Embed Size (px)
Citation preview

Application for Monitoring the Reception of the Reports
for Statistical Surveys
Author: Branka Raičević, Head of Department for Data Collection
Institution: Statistical Office of Montenegro

General data
Location: Montenegro is located in South‐Eastern Europe
Area ( in km2 ):13812
Population by Census 2011: 620029
Gross domestic product of Montenegro in 2013 is 3 327 million EUR
Capital: Podgorica ‐ administrative and economic centre
Old Royal Capital: Cetinje ‐ historical and cultural centre
Currency: EUR
Climate:Continental, Mediterranean and mountain

Length of the sea coast: 293 kmNumber of beaches: 117Length of beaches: 52 kmLongest beach: Velika plaža (Ulcinj) ‐ 13 km

National parks: Durmitor, Biogradska gora, Skadarsko jezero, Lovćen, Prokletije
Mountain : Durmitor, Bjelasice, Lovcen
Natural lakes : Biogradsko , Plavsko, Skadarsko, Crno
Largest lake: Skadar Lake (391 m²)
Deepest canyon: Tara (1.300 m)
National parks: Durmitor, Biogradska gora, Skadarsko jezero, Lovćen, Prokletije
Mountain : Durmitor, Bjelasice, Lovcen
Natural lakes : Biogradsko , Plavsko, Skadarsko, Crno
Largest lake: Skadar Lake (391 m²)
Deepest canyon: Tara (1.300 m)

Montenegro, the pearl of the Mediterranean, unique in many ways, is situated in the south of the Adriatic. Nowhere else can you find, so much natural wealth, beauty, mild beaches, clear lakes, fast rivers, and gorgeous mountains in such a compact area as in Montenegro. In the morning you can wake up along the beautiful Adriatic coast, have lunch on the banks of SkadarLake, and enjoy an evening walk in the Montenegrin mountains.

The Statistical office of Montenegro is the main producer and the overall coordinator of statistics in Montenegro;
Legal framework for statistics is set by the “Law on official statistics and system of official statistics” .
Statistical office of Montenegro – MONSTAT

Statistical office of Montenegro – MONSTAT
Number of employees in MONSTAT: 102
Average age employees in MONSTAT: 43 years old
Education structure: 25% employees are with PhD and Master degree; 65% employees are with Faculty degree; 10% employees are with Secondary school degree:
Structure by sex: 70% women's, 30% mans

In the Statistical Office of Montenegro, the data collection is carried out by means of PAPI method. Currently the pilot project is being devised regarding the collection of data for a particular survey in the area of short‐term statistics by means of CAWI method.It has been planned to introduce also CAPI and CATI methods.For faster and simpler monitoring of the reception of survey reports from wherever the reporting units of the company are located, automatic monitoring of the report reception has been introduced. The application has been prepared and installed in the Data Collection Department as well as on the computers of those statisticians in charge of relevant surveys. The application has been developed in VB.NET and the database is SQL Server.
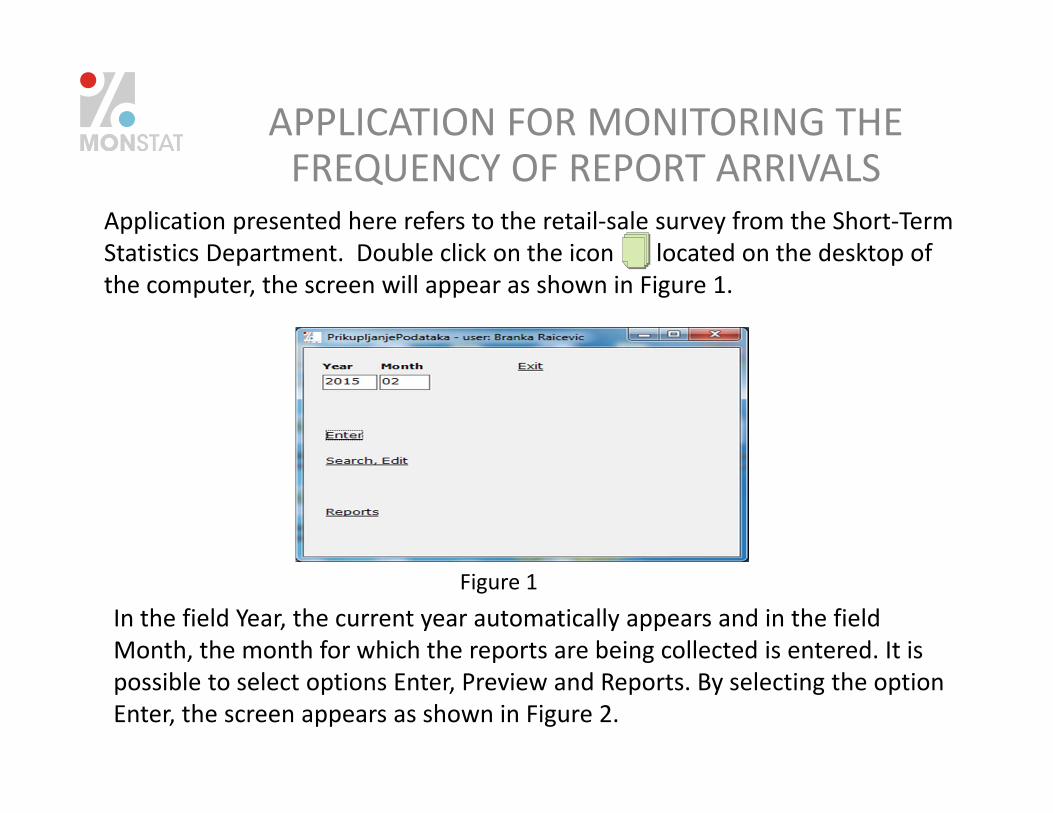
Application presented here refers to the retail‐sale survey from the Short‐Term Statistics Department. Double click on the icon located on the desktop of the computer, the screen will appear as shown in Figure 1.
APPLICATION FOR MONITORING THE FREQUENCY OF REPORT ARRIVALS
Figure 1In the field Year, the current year automatically appears and in the field Month, the month for which the reports are being collected is entered. It is possible to select options Enter, Preview and Reports. By selecting the option Enter, the screen appears as shown in Figure 2.

Figure 2
The data from the original form are copied into the fields Year and Month in this form. In the field highlighted in different colour, the company ID number is entered followed by click on the button Enter on the keyboard.

The other fields will be automatically filled with data from the address book as shown on the figure 3. It is set so in the application that it is not possible to access those fields.
Figure 3

Figure 4
Upon selecting the option Reports on the original form, the screen will appear as shown in the Figure 4.

Figure 5
By selecting the option Report On the Reports Received for the Data Collection Department, the screen shows the report in Excel format regarding all reports entered by the employee logged in the computer in question (Figure 5). This report contains all data regarding reporting units as well as the reason for non‐response. Depending on the reason of non‐response, the employee may contact the reporting unit and try to obtain the report before deadline.

Figure 6
By selecting the second option, the screen shows the report on the number of reports per municipality and reason of non‐response, cumulatively (Figure 6).

Analysis

Before the introduction of this improvement in work, the officer in department for collection data had separate records of incoming reports in paper form.
Now employees do not spend time on the recording. They are working on improving the collection of data.
In the two months since this work method has been introduced the work of the employees has been improved and the monitoring of the reception of reports has been made simpler.
CONCLUSION

THANK YOU FOR YOUR ATTENTION!