Embed Size (px)
Citation preview
Prefatory Note The attached document represents the most complete and accurate version available based on original copies culled from the files of the FOMC Secretariat at the Board of Governors of the Federal Reserve System. This electronic document was created through a comprehensive digitization process which included identifying the best-preserved paper copies, scanning those copies,1
and then making the scanned versions text-searchable.2
Though a stringent quality assurance process was employed, some imperfections may remain. Please note that some material may have been redacted from this document if that material was received on a confidential basis. Redacted material is indicated by occasional gaps in the text or by gray boxes around non-text content. All redacted passages are exempt from disclosure under applicable provisions of the Freedom of Information Act. 1 In some cases, original copies needed to be photocopied before being scanned into electronic format. All scanned images were deskewed (to remove the effects of printer- and scanner-introduced tilting) and lightly cleaned (to remove dark spots caused by staple holes, hole punches, and other blemishes caused after initial printing). 2 A two-step process was used. An advanced optical character recognition computer program (OCR) first created electronic text from the document image. Where the OCR results were inconclusive, staff checked and corrected the text as necessary. Please note that the numbers and text in charts and tables were not reliably recognized by the OCR process and were not checked or corrected by staff.
Content last modified 6/05/2009.

January 18, 1974(CONFIDENTIAL FR)
MONETARY AGGREGATESANDMONEY MARKET CONDITIONS
Prepared for the Federal Open Market Committee
By the Staff
BOARD OF GOVERNORS OF THE FEDERAL RESERVE SYSTEM
CONFIDENTIAL (FR)
MONETARY AGGREGATES ANDONEY MARKET CONDITIONS
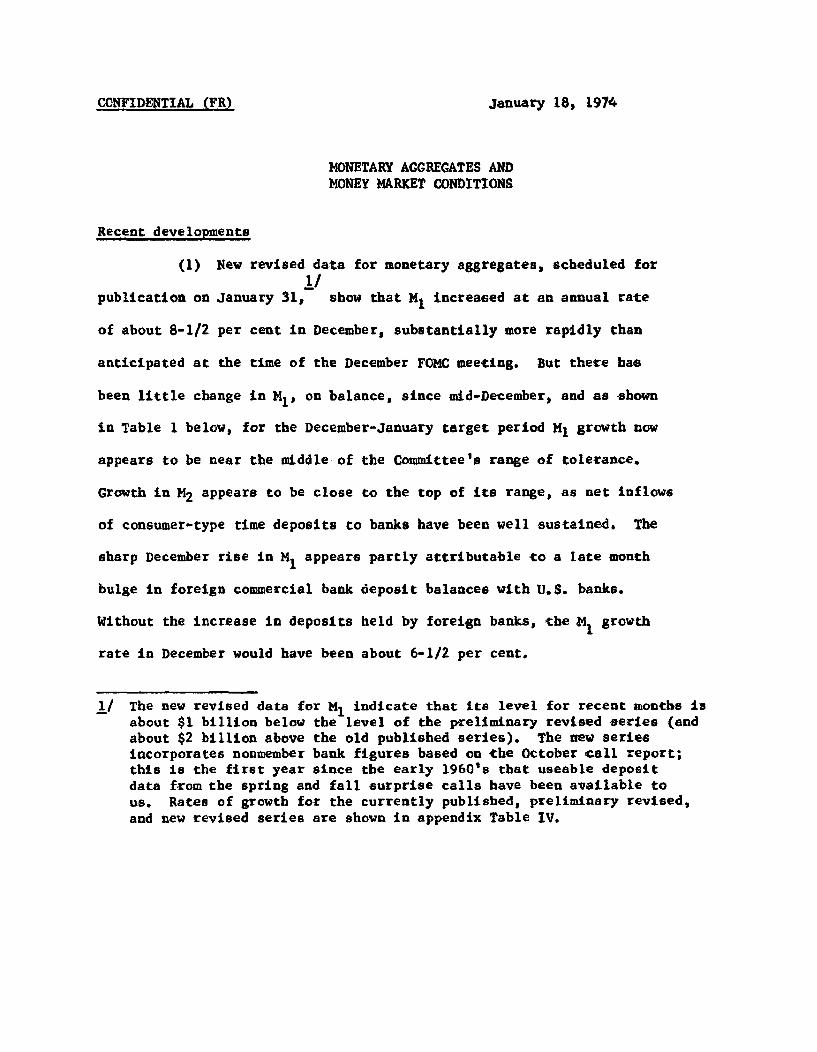
Recent developments
(1) New revised data for monetary aggregates, scheduled for
publication on January 31, 1/ show that M 1 increased at an annual rate
of about 8-1/2 per cent in December, substantially more rapidly than
anticipated at the time of the December FOMC meeting. But there has
been little change in M1, on balance, since mid-December, and as shown
in Table 1 below, for the December-January target period M1 growth now
appears to be near the middle of the Committee's range of tolerance.
Growth in M2 appears to be close to the top of its range, as net inflows
of consumer-type time deposits to banks have been well sustained. The
sharp December rise in M1 appears partly attributable to a late month
bulge in foreign commercial bank deposit balances with U.S. banks.
Without the increase in deposits held by foreign banks, the M 1 growth
rate in December would have been about 6-1/2 per cent.
1/ The new revised data for M1 indicate that its level for recent months isabout $1 billion below the level of the preliminary revised series (andabout $2 billion above the old published series). The new seriesincorporates nonmember bank figures based on the October call report;this is the first year since the early 1960's that useable depositdata from the spring and fall surprise calls have been available tous. Rates of growth for the currently published, preliminary revised,and new revised series are shown in appendix Table IV.
January 18, 1974
-2-
Table 1
Growth of Monetary Aggregates and RPD'sin December-January Target Period
Reserve and Monetary Aggregates Range ofGrowth at SAAR in per cent) Tolerance
RPD's 8-1/4--11
M1 3--6M1
M2
Memo:Fed funds rate
(per cent per annum)
5--8
8-3/4--10
LatestEstimates
9.1
4.9 1/
7.8 1/7.8 1/
Avg. for Statementweek ending
Jan. 9 9.76Jan. 16 9.77
1/ These figures are based on the new revised series. December-January ratesof growth for the preliminary revised series would be little different.
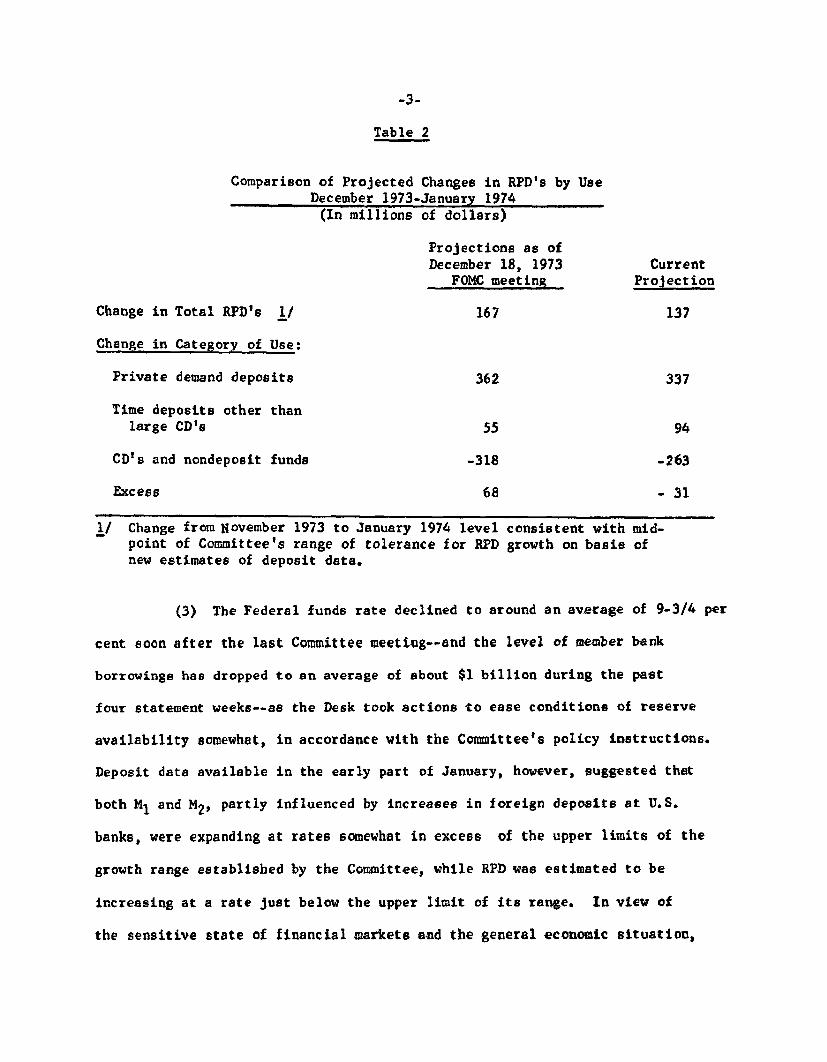
(2) RPD's have been expanding at about a 9 per cent annual rate
in the December-January target period, well within the growth range desired
by the Committee. As indicated in Table 2, however, there were minor
deviations from projections made at the time of the December FOMC meeting in
the use of RPD to support various types of deposits and excess reserves.
-3-
Table 2
Change in Total RPD's 1/
Comparison of Projected Changes in RPD's by UseDecember 1973-January 1974(In millions of dollars)
Projections as ofDecember 18, 1973
FOMC meeting
RPD's 1/ 167
CurrentProjection
137
Change in Category of Use:
Private demand deposits
Time deposits other thanlarge CD's
CD's and nondeposit funds
Excess
362
55
-318
68
94
-263
- 31
1/ Change from November 1973 to January 1974 level consistent with mid-point of Committee's range of tolerance for RPD growth on basis ofnew estimates of deposit data.
(3) The Federal funds rate declined to around an average of 9-3/4 per
cent soon after the last Committee meeting--and the level of member bank
borrowings has dropped to an average of about $1 billion during the past
four statement weeks--as the Desk took actions to ease conditions of reserve
availability somewhat, in accordance with the Committee's policy instructions.
Deposit data available in the early part of January, however, suggested that
both M1 and M2, partly influenced by increases in foreign deposits at U.S.
banks, were expanding at rates somewhat in excess of the upper limits of the
growth range established by the Committee, while RPD was estimated to be
increasing at a rate just below the upper limit of its range. In view of
the sensitive state of financial markets and the general economic situation,
-4-
a majority of Committee members concurred on January 11 in the Chairman's
recommendation that the Desk should continue to maintain prevailing money
market conditions, aiming at a Federal funds rate of 9-3/4 per cent.
(4) Bond market yields have generally moved up about 10 to 30
basis points since the last Committee meeting, responding first to the
potential and then to the actual weight of a heavy calendar of new
corporate and municipal issues. Meanwhile, short-term interest rates
have moved on divergent paths. Treasury bill rates have increased from
20 basis points (in the longer maturity area) to 50 basis points (in the
shorter maturity areas). In the private market--with business short-term
credit demands slackening in December--rates on commercial paper and
short-term bank CD's have declined 1/8 to 1/4 of a point, and banks with
prime rates of 10 per cent have dropped the rate to 9-3/4 per cent.
(5) The advance in bill rates appears attributable mainly to
the dispelling of expectations held by many market participants that
monetary policy would ease significantly over the near-term future. The
fact that the Federal funds rate failed to move down from the 9-3/4 per
cent level achieved early in the inter-meeting period appears to have
been mainly responsible for this reassessment of expectations. The
process was reinforced, however, by the sharp rise in M1 reported for
December. And bill rates also responded to ongoing and expected sales of
Treasury issues by foreign central banks. Most of the net foreign sales
in December and early January were absorbed by the System in the course of
normal seasonal reserve supplying operations. But this in turn meant that
seasonal demand for bills from the dealer market was commensurately reduced.
-5-
(6) The table on the next page shows (in percentage annual rates
of change) selected monetary and financial flows over various recent time
periods on the new revised basis. Appendix Table III compares money supply
growth rates computed on a quarterly-average basis with those computed on a
last-month-of-quarter basis. This blue book does not contain the usual
charts 1-3 on the monetary aggregates because of time pressure in converting
to the new revised money supply series.

3 years Past Past Pastending 12 6 3 Past
Dec. 1972 Months Months Months MonthDec. '72 Dec. '73 Dec. '73 Dec. '73 Dec. '73
over over over over overDec. '69 Dec. '72 June '73 Sep, '73 Nov. '73
Total reserves 7.8 7.7 8.5 6.1 10.3
Nonborrowed reserves 8.3 7.2 12.6 13.3 14.1
Reserves available tosupport private non-bank deposits 8.5 9.3 7.8 1.4 9.4
Concepts of Money
Ml (currency plusdemand deposits) 1/ 7.5 5.9 3.9 8.0 8.5
M2 (M1 plus time depositsat commercial banksother than largeCD's) 11.3 8.6 7.8 10.2 8.7
M3 (M2 plus deposits atthrift institu-tions) 12.8 8.6 6.5 9.1 9.6
Bank Credit
Total member banksdeposits (bank creditproxy adj.) 10.7 10.7 7.0 3.5 6.2
Loans and investmentsof commercial banks 2/ 12.6 12.6 8.0 4.4 1.5
Short-term market paper(Monthly avg. change inbillions)
Large CD's .9 1.6 0.1 -1.3 0.8
Nonbank commercial paper 0.1 0.3 0.8 1.2 -0.4
1/ Other than interbank and U.S. Government.
2/ Based on month-end figures. Includes loans sold to affiliates and branches.
NOTE: All items are based on averages of daily figures, except for data ontotal loans and investments of commercial banks, commercial paper, and thriftinstitutions--which are derived from either end-of-month or last Wednesday-of-month figures. Growth rates for reserve measures in this and subsequent tablesare adjusted to remove the effect of discontinuities from breaks in the serieswhen reserve requirements are changed.
Prospective developments
(7) Three alternative sets of specifications for growth rates in
the aggregates and money market conditions are summarized below for Committee
consideration. (More detailed figures are shown in the table on p. 7a).
Alt. A Alt. B Alt. C
Targets (1st & 2nd qtrs.combined)
M1
M2
Credit Proxy
Associated ranges forJanuary-February
RPD
6-3/4
10
9-1/2
6--8
6
8-1/2
8-1/2
5-1/2--7-1/2
5-1/4
7
7
4-3/4--6-3/4
M1 4--6 3-1/2--5-1/2 3--5
M2 7-1/2--9-1/2 7--9 6--8
Federal funds rate range 8-3/4--9-3/4 9-1/4--10-1/4 9-3/4--10-3/4(inter-meeting period)
(8) Alternative C encompasses the 5-1/4 per cent growth rate
for M1 between December and June adopted by the Committee at its last
meeting. (This and other alternative growth rates are shown in the chart
on the following page in relation to the rate of increase for M1 over the
past year). The money market specifications for alternative C indicate
that continuation of the path for the aggregates adopted at the last
meeting would likely be associated with some upward movement in the
Federal funds rate from the prevailing level of around 9-3/4 per cent.
This now seems probable because we expect somewhat greater demand for
money in the first half of 1974 than we did at the time of the last
5
8
10-3/4

MONEY SUPPLY AND LONGER RUN TARGET PATH
RATIO SCALE, BILLIONS OF DOLLARS
5/%% GROWTH
REVISED M1
....-**RATE OF GROWTHDEC. '72 TO DEC. '73 5.9%
28Q
- 270
-1260
1 II, I I I. I I 1I -1A M J A S 0
1973N D F M A M
1974

Alternative Longer-Run
-7a-
Targets for Key Monetary Aggregates
Ml
Alt. A Alt. B
270.7
271.0272.9274.6
280.0
270.7
271.0272.7274.2
279.1
Alt. C
270.7
271.0272.6273.9
277.9
Alt. A Alt. B Alt. C
570.8
574.1578.9583.9
599.3
570.8
574.1578.3582.6
595.6
570.8
574.0577.6581.0
590.8
M3
Alt. A Alt. B
893.4
899.1906.1913.2
935.0
893.4
899.1905.3911.5
930.5
Quarters:
1974 1st Q.2nd Q.
Months:Jan.Feb.
1973 Dec.1974 Jan.
Feb.Mar.
June
Quarters:1974 1st Q.
2nd Q.
Months:Jan.
Feb.
4.75.8
1.3 1.38,4 7.5
Adjusted CreditAlt. A Alt. B
449.8 449.8454.0 454.0455.6 455.2457.6 456.6
471.4 468.8
6.912.1
11.24.2
6.010.7
11.23.2
1.37.1
ProxyAlt. C
449.8454.0454.6455.6
465.8
5.29.0
11.21.6
Rates of Growth
9.2 8.310.5 8.9
6.910.0
6.98.8
7.16.7
6.77.5
Total ReservesAlt. A Alt. B Alt. C
35,097 35,097 35,09735,883 35,888 35,88235,473 35,437 35,40134,998 34,924 34,855
35,977 35,797 35,598
2.311.2
37.1-13.7
1.510.0
37.3-15.1
0.78.5
37.1-16.1
1973
1974
Dec.
Jan.Feb.Mar.
June
Alt. C
893.4
898.9904.5909.6
925.0
7.79.3
7.36.8
7.47.5
32,91232,84532,92032,943
33,600
7.78.3
RPDAlt. B
32,91232,85132,95633,012
33,793
Alt. A
32,91232,84732,992
33,085
33,968
5.810.7
8.65.3
4.08.0
8.62.7
8.93.8

-8-
FOMC meeting, reflecting the larger increase in prices and in nominal
GNP now projected.
(9) The specifications for alternative B include a 6 per
cent annual rate for M1 over the first half of 1974. The staff believes
that such a growth rate would probably entail little change in the funds
rate from current levels. Thus, the range for the funds rate in that
alternative centers on 9-3/4 per cent. Alternative A includes moderately
higher growth rates for the monetary aggregates and a consequent easing
in money market conditions.
(10) No matter which of these alternatives might be chosen,
the rates of growth for M1 are expected to be higher in the second quarter
than in the first quarter of 1974, and to be quite moderate for the two
month January-February period. For example, under alternative B, the
annual rate of M1 growth over the first quarter is indicated to be around
5-1/4 per cent--and in a 3-1/2 to 5-1/2 per cent range for January-February--
but to rise to 7 per cent in the second quarter. The greater growth in
the second quarter reflects the temporary impact of large tax refunds--
estimated at $2-$3 billion above last year--and initial consumer adjustments
to higher social security benefit payments. We would expect M1 growth in
the third quarter, assuming little change in interest rates from those
prevailing, to be on the order of one percentage point lower than in the
second quarter as these temporary factors disappear.
(11) The outlook for interest rates in general is uncertain
partly because market attitudes are so sensitive to the course of military
and oil developments in the Middle East and their implications for domestic
inflation, international capital flows, and foreign official sales of U.S.
Government securities. Also, of course, market participants are quite

-9-
sensitive at this time to monetary policy. In long-term markets, the
recent enlarged flow of bond offerings has moved relatively well, but a
continued heavy calendar is likely to lead to a further updrift in long-
term yields--assuming no significant change in the Federal funds rate, and
no dramatic change in the outlook for oil prices and supplies. In the
short-term sector, rates could also back up somewhat further, given the
prevailing Federal funds rate, as dealer financing costs remain high and
market participants come to believe that further monetary ease is not in
prospect. However, Federal Government financing requirements appear light
enough over the next few weeks to moderate upward rate pressures. Housing
agencies will be repaying debt, and the Treasury has little or no net cash
need between now and late March or early April (assuming no sizable further
liquidation of Treasury specials by foreign central banks).
(12) Given the sensitivity of markets, a rise in the funds rate
from current levels would probably lead to an increase of interest rates
generally--adjustments that could be fairly large if the funds rate
increase were sizable, say on the order of 1/4--1/2 percentage points,
and gave signs of persisting. A drop in the funds rate from prevailing
levels, on the other hand, would be accompanied by declines in market
interest rates, particularly short-term rates. The likely strength of any
ensuing market rally is unclear. Since the market over-anticipated the
extent and speed of the easing in policy late last year, reactions to
further declines in the funds rate might be on the cautious side.
-10-
(13) The Treasury will be announcing mid-February refunding
terms on January 30. About $4-1/2 billion of maturing debt is publicly
held. Under current market circumstances, it does not appear likely
that the Treasury would seek to pre-refund additional issues or to
offer longer-term securities in volume. Thus, the refunding may be a
relatively uncomplicated operation, although somewhat larger in size than
the mid-November refunding.
(14) Net inflows of consumer-type time and savings deposits
are expected to continue at about the November-December pace at banks
and thrift institutions under alternative B, which does not contemplate
significant changes in market rates. Somewhat greater growth would be
likely to evolve under alternative A. There is risk of an appreciable
reduction in savings flows under alternative C if the money market does
in fact tighten as much as shown in paragraph (7).
(15) The various alternatives include more rapid expansion
in bank credit in the winter and spring of 1974 than occurred in the
fourth quarter of last year, when growth was quite slow. Since mid-
December, banks have once again begun to increase offerings of CD's.
We have assumed a modest continuing expansion in CD's, in contrast
to the sharp decline that occurred over the fourth quarter--a decline
that was equivalent to a reduction in bank credit growth by about
4 percentage points (at an annual rate). However, demands for bank credit
may be relatively modest in the first quarter, given recent emphasis on
capital market financing by businesses, slower consumer credit growth, and
less mortgage credit demand. Thus, banks may be reluctant to issue CD's in

-11-
any significant volume at current relatively high interest rates. We
have not assumed availability of relatively low cost funds to banks
through oil revenues in the Euro-dollar market; the means and channels
by which oil revenues will be recycled through world money and capital
markets are still unclear. If banks were to obtain more funds in the
Euro-dollar market, however, they would mainly substitute for domestic
CD sales rather than add to the over-all bank credit expansion that would
otherwise occur.
-12-
Proposed directive language
(16) Presented below are three alternative formulations
for the operational paragraph of the directive, which are intended to
correspond to the similarly lettered policy alternatives discussed in
the preceding section. For all three alternatives, it is proposed to
add a reference to Treasury financing because of the regular February
refinancing to be announced later this month. As will be noted, the
three alternatives refer to growth rates in the aggregates "over the
past 12 months." For the 12 months through December 1973, these are as
follows in terms of the revised series: M1, 5.9 per cent; M2, 8.6 per
cent; and the bank credit proxy, 10.7 per cent.
Alternative A
To implement this policy, while taking account of THE
FORTHCOMING TREASURY FINANCING AND OF internationl and domestic
financial market developments, the Committee seeks to achieve
[DEL: some easing in] bank reserve and money market conditions [DEL: provided
that the] CONSISTENT WITH SOMEWHAT FASTER GROWTH IN monetary
aggregates [DEL: do not appear to be growing excessively] OVER THE MONTHS
AHEAD THAN HAS OCCURRED OVER THE PAST 12 MONTHS.
-13-
Alternative B
To implement this policy, while taking account of THE
FORTHCOMING TREASURY FINANCING AND OF international and domestic
financial market developments, the Committee seeks to achieve
[DEL: some easing in] bank reserve and money market conditions [DEL: provided
that the] CONSISTENT WITH GROWTH IN monetary aggregates [DEL: do not
appear to be growing excessively] OVER THE MONTHS AHEAD AT ABOUT
THE RATES THAT PREVAILED OVER THE PAST 12 MONTHS.
Alternative C
To implement this policy, while taking account of THE
FORTHCOMING TREASURY FINANCING AND OF international and domestic
financial market developments, the Committee seeks to achieve
[DEL: some easing in] bank reserve and money market condition [DEL: provided
that the] CONSISTENT WITH SOMEWHAT SLOWER GROWTH IN monetary aggregates
[DEL: do not appear to be growing excessively] OVER THE MONTHS AHEAD
THAN HAS OCCURRED OVER THE PAST 12 MONTHS.
(17) In the event that the Committee again wishes to couch
the operational paragraph of the directive in terms of money market
conditions, the specifications of alternative A might be associated
with the language adopted at the December meeting (". . .the Committee
seeks to achieve some easing in bank reserve and money market conditions,
provided that the monetary aggregates do not appear to be growing
excessively." The specifications of alternative B might be associated
with language indicating that ". . . the Committee seeks to maintain
about the prevailing money market conditions, provided that the monetary
aggregates appear to be growing at rates within the specified ranges
of tolerance."
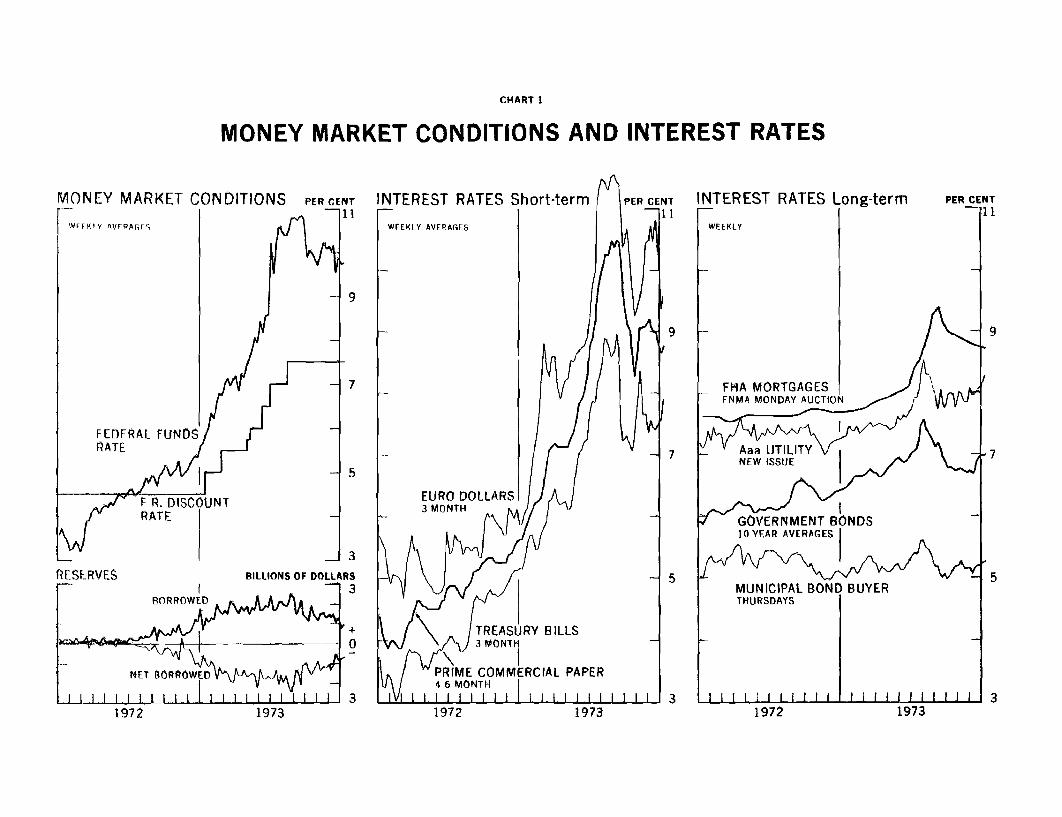
CHART 1
MONEY MARKET CONDITIONS AND INTEREST RATES
IONEY MARKET C
WEEKLY AVERAGES
FEDFRAL FUNDSRATE I
ONDITIONS PER CENT
S/ 411
1972 1973

RANK RESERVES JANUARY 18. 1974(ACTUAL AND CURRENT PROJECTIONS)
--------------------------------------- **---_*--- ------------- --------------
PFRIOD I-------------------------
MONTHLY LEVELS-IMILIIONSI------------------------ I
1973--SEPT IOCT.NOV.DEC. I
1974--JAN. I
ANNUAL RATES OF CHANGE I--------------------- I
OUARTERLY I
1973--1T QTR.2ND OTR.3RDO TR.4TH QTR I
I1974--1ST OTR.
MONTHLY1973--SPT. I
OCT. INOV. IDEC. I
1974--JAN.
DEC.-JAN.
WEEKLY LFVELS-SMILLIONS I-- ---- **---------
1973--NOV. 7142128 I
DEC. 512 I19 126 I
1974--JAN. 2 I9 I
16 I
IIRESERVFS AVAILABLE FOR II
PRIVATE NON@ANK DEPOSIT% II
-*----------------------------11IISEAS AOJ I NON SEAS AOJ I
(1) I (2) 1
itI I
32.394 I 32179 II32.845 I 32.739 II32.714 I 32.75232.91P I 33,166 II
I II(32.851) 1 (33.919) 1f
I III ( I
I II itI If
7.8 I I17.5 1 II14.2 II1.4 II
I II( 4.9) II
I I II II
11.3 I1.0 I I
-6.39.4 I II
I IIS A.8)
I II( 0.1) I
I II It
I II32.657 32.647 1I32.694 32.745 1132.904 I 32.977 II32.508 32,552 II
I I33,041 33.053 II32.561 32.534 II32,869 33,127 II33.209 I 33,637 (I
1 II32.918 I 33.560 II32,657 I 33.392 II33,088 34.77 II
1 1I
AGREGATF RESFRVFS
TOTAL NORESFRVES
(3)
34.17334.94234,85735,097
(35.848)
6.46.9
10.66.1
( 1.5)
9.4
12.1-4.310.3
I 37.3)
( ?3.9)
34,b5534.86635,19234,641
35,10834,62335,19135 330
35,29135,64636*468
NRnRROWED IRESERVES I
(4) 1
1
32.321 I33,4A6 I33.46333,799
(34,879) I
-3.6 I7.011.3 113.3
S 3.9)
21.926.7-1.614.1 IIrl .
( 49.0) I
( 31. )
33,48533,34533,620 133,354 I
33,63333,32133.70234,922 I
34.08134.87035,479 I
I
SEASONALLY------------PRIVATEDEMANn
(5)
19.93019«99819.97f-20,227
(20.313)
O.63.P1.45.8
( -1.9)
-6.83.4
-1.115.1
( 5.1)
S 10.1)
19,817q1,94120,06420,011
20,2212C ,17120,15120,264
20,36120,4220,41?
REQUIRED RESERVES
ADJUSTED------ *----
OTHERTIME DEP
(6)
B.1998,3108,4308*460
S8.524)
7.49.7
15.712.7
( 8.5)
2A.416.217.34.3
( 9.1)
( 6.7)
8.3868,4328,44189462
8,4228,4508,4728,441
8,5238,5068,528
CD'S ANDNON DEP
(7)
4,0384,3124,0693,918
( 3,806)
4.18849158
3.948
3,9523*9663*9304,028
3.6493*7313,821
GOV*T ANDINTER8ANK
-------
(8)
1.7792.0982,1422,185
( 3,037)
1.9982.172292882,132
2*0682.0622.3222*121
2.3732,9903,380
-,r--------------------------------------------------------------------------------
NOTE: DATA SHOWN IN PARENTHESES ARE CURRENT PROJECTIONS. ANNUAL RATES OF GROWTH HAVE BEENADJUSTED FOR CHANGES IN RESERVE REQUIREMENTS. AT THE FOMC MEETING OF DECEMBER 18, 1973THE COMMITTEE AGREED ON A RPD RANGE OF 8.25 TO 11 PERCENT FOR THE DEC-JAN PERIOD.
------------------------------------------- ******************-******------
-------------
kw-
------------m
m
...---------------------
m lgam
STRICTLY CONFIDENTIAL---------------------,
NeV RtVISED SERIES TARLE 1

NEWLY REVISED TABLE 2 STRICTLY CONFIDENTIAL------------- ..------.- *.........
MONETARY AGGREGATES JANUARY 18, 1974(ACTUAL AND CURRENT PROJECTIONS, SEASONALLY ADJUSTED)
.mmmw.memm.......m m mmwm--- memm------mmem---mm mmmmmemmm mmeme-m-- -------------- m em-- em--
I MONEY SUPPLY I ADJUSTED 1I U.S. I TIME AND SAVINGS DEPOSITS I NONDEPOSITI NAOW I BROAD I CREDIT II GOVT. I I OTHER I I SOURCES OF
PERIOD I (Ml) I (M2) PROXY II DEPOSITS I TOTAL I THAN CD S I CO S I FUNDS----------------------------------------------------------------------------meeeeeeeeeemmeeeeeeee e emme emmmemememmmmmmeememmmee wmeeemmemmemee emeemmemmm mmmme ee emmm
I (1) (2) 9 (3) II (A4 I (5) (6) (7) (8)II I I I I
MONTHLY LEVELS-SRILLIONSI I I I-II ---- -- I------ I I I I
1973--SEPT. I 265.4 I 556.6 1 445.9 11 5.0 357,9 I 291.2 I 66.7 I 7.3OCT. I 266. I 561.6 446.5 11 6.0 358.9 I 295.1 63.8 6.9NOV. I 268. I 566.7 447.5 11 5.0 I 359.9 1 297.8 6200 1 7.1DEC. 270.7 I 570.8 449.8 II 5.0 363.0 300.2 I 62.8 I 7.4
I I I 1I I I I I1974--JAN. I (271.n) (574.1) (454.0) 11 ( 6.2) (368.0) 1 (303.1) ( 64.9) I I 7.2)
II I I I I IPERCENT ANNUAL GROWTH I I I I-------------------- I I I I I I
QUARTERLY I I III I I II I I I I
1973--1ST OTR. 3.0 6.9 14.6 II I 22.7 9.92ND QTR9. 11. I 11.1 1 12.6 I 17. 1 10.43RO OTR. I -0.2 I 5.2 I 10.5 II 14.0 10.44TH QTR. I 8.0 110.2 1 3.5 II I 5.7 12.4
I I I II I I I I1974--1ST OTR. I 5.?) ( 8.3) I ( 6.0) I (14.3) (10.9)
I I iI I I IMONTHLY I II------ I I I I
1973--SEPT. -3.6 3.7 5.7 II I 9.8 I 10.4OCT. I 5.0 I 10.8 1.6 11 3.4 I 16.1NOV. I 10.4 10.9 2.7 II 3.3 11.0DEC. I 8.5 8 .7 6.2 I I 10.3 I 97
1974--JAN. I ( 1.3) ( 6.9) (11.2) 11 I (16.5) I (11.61I I I I f 1 I I I
DEC.-JAN. ( 4.0 I 7.8) 8.7) I (13.51 (10.7)I I I II I I I I
WEEKLY LEVELS-SRILLIONS I I I II---------------------- I I I I I
I I I If I I I INOV. 7 268.1 565.7 I 447.7 I 6.5 360.1 I 297.6 62.5 6.7
14 269.1 I 567.2 647.1 (I 5.8 360.0 1 298.1 1 61.9 6.721 1 269.4 5 66.8 I 447T6 11 5.7 I 359.3 I 297.4 I 61.9 7.428 269.0 567.2 447.6 11 4.9 1 3601 298.2 61.9 7.6
DEC. 5 269.1 568.2 1 4476 1 4.8 360. 299.1 I61.7 I 212 270.7 569.7 I 447.9 I 4.1 I 361.9 1 296.9 1 63.0 1 ?.619 270.9 571.8 I 449.3 .5 4 363.1 300.9 I 62.2 I 7*626 270.9 571.6 I 452.4 f 5.9 1 363.7 300.7 1 63.0 1 7.3
I I I 99 I I I1974--JAN. 2 1 270.1 1 571.8 452.0 I 5.9 I 366.0 1 301.7 I 64.3 T70
9 P 1 269.3 1 571.3 453.1 1 6.8 1 366.8 1 30260 1 64.8 I 7.116 PE I 270.2 I 573.0 453.6 11 6.6 367.6 302.9 64*8 1 7*3
1 I I If I I I----------------------------------------------------------------------------------------------------------------------
NOTEl DATA SHOWN IN PARENTHESES ARE CURRENT PROJecTIONS. P - PRELIMINARYPE - PARTIALLY ESTIMATES
-......---..---...-.-............---.-.....--- .-..--....-- ......--.-..---.-----.-------- a . -
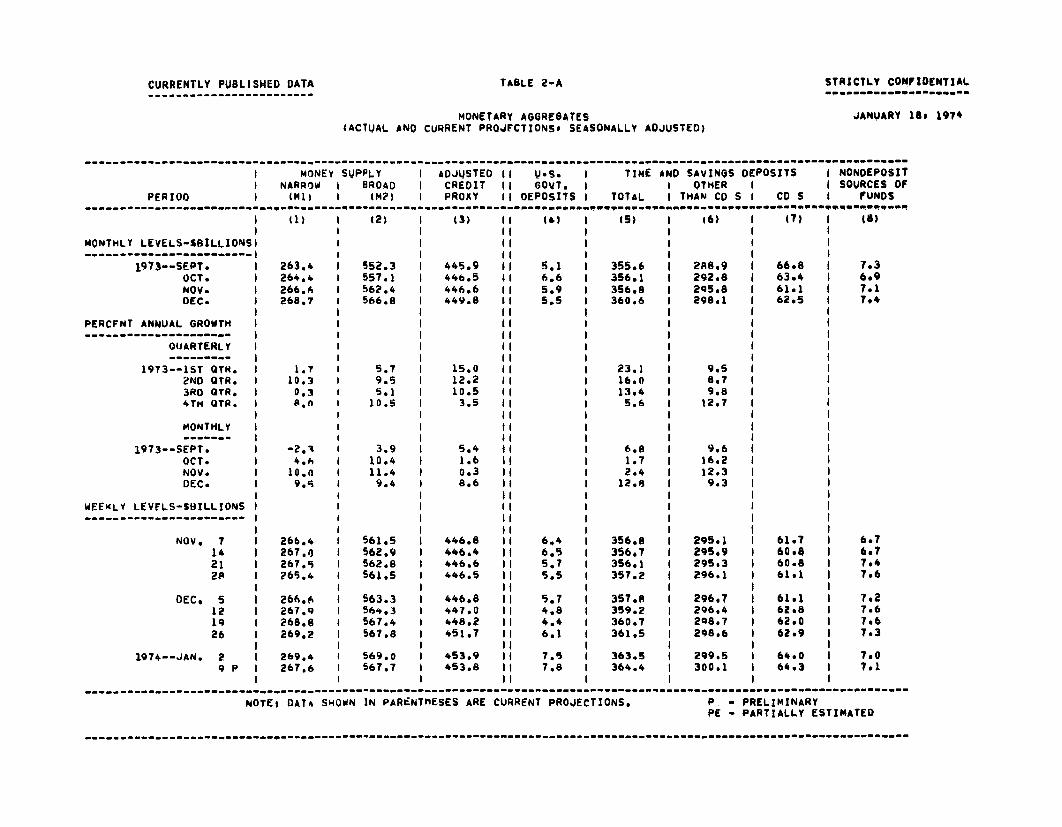
CURRENTLY PUBLISHED DATA--------------------.---
TABLE 2-A STRICTLY CONFIDENTIAL-mm~mmm~m~o~mmmoI~m
MONETARY AGGREGATES(ACTUAL AND CURRENT PROJECTIONS, SEASONALLY ADJUSTED)
JANUARY 18, 1974
-------------------- ---------,, -------- - - - - - - - - - - - - - - - - - - - - - - - - - - - - - - - - - - - -=- - - -
1 MONEY SUPPLY I ADJUSTED II U.S. I TIME AND SAVINGS DEPOSITS I NONDEPOSITI NARROW I BROAD I CREDIT II GOVT. I I OTHER I I SOURCES OF
PERIOD I (MI) I (M?) I PROXY II DEPOSITS I TOTAL I THAN CD S I CO S I FUNDS----------------------------------------- .... ---------------
I (1)I I
MONTHLY LEVELS-SBILLIONSI----------------------- I I
1973--SEPT. I 263.4OCT. 264.4NOV. 266.4DEC. I 268.7
PERCENT ANNUAL GROWTH I------------------ I I
QUARTERLY I I--------- I I
1973--1ST QT. 1.72ND QTR. 10.33RD QTR. 0.34TH OTR. 8.0 I
MONTHLY
1973--SEPT. -2.1
OCT. 4.hNOV. 10.0DEC. I 9. I
I IWEEKLY LEVFLS-SBILLIONS I----------------------- I I
NOV. 7 266.414 267.021 267.52 I 65.4 I
I IDEC. 5 1 266.6
12 267.919 I 268.8
26 269.2I I
1974--JAN. 2 269.49 P 1 267.6
I I
(2)
552.3557.1562.4 I566.8
5.79.55.1 I
10.5
3.910.411.49.4
561.5562.9562.8561.5
563.3564.3567.4567.8
569.0567.7 I
I
(3) IIIIIIII
445.9 II446.5 II446.6 1449.8 II
IIIIIIII
15.0 I12.2 II10.5 II3.5 I
IIIIII
5.4 II1.6 II0.3 I8.6 11
IIIIIIII
446.8 II446.4 II446.6 11446.5 II
II446.8 II447.0 1448.2 II451.7 II
II453.9 11453.8 II
II
(A)
5.1 I6.65.95.5
6.46.55.S5.5 I
5.74.84.46.1
7.57.8 I
(5)I
355.6356.1356.8360.6
23.)16.013.45.6
6.81.72.412.8
356.8356.7356.1357.2
357.8359.2360.7361.5
363.5364.4
(6)
288.9292.8295.8298.1
9.5
9.812.7
9.616.212.39.3
295.1295.9295.3296.1
296.7296.4298.7 I298.6
299.5300.1
1
<7)
66.8 I63.4 I61.162.5
61.760.60.861.1 I
61.1 I62.862.062.9
64.064.3
I
NOTEI DATA SHOWN IN PARENTHESES ARE CURRENT PROJECTIONS. P - PRELIMINARYPE - PARTIALLY ESTIMATED

STRICTLY CONFIDENTIAL (FR)
JANUARY 18, 1974
TABLE 3
RESERVE EFFECTS OF
OPEN MARKET OPERATTONS AND OTHER RESERVE FACTORS(Millions of dollars, not seasonally adjusted)
Open Market Operations/ _1 Daily Average Reserve Effect 2/ in reserve categories TargetBills Coupon Agency RP's Open Market A Member Other 4/ req. res. against available res. 5/ available
_ & Accept. Issues Issues Net 3/ Total Operations Bank Borrowing Factors U.S.G. and interb. (6)+(7)+(8)-(9) reserves 5
(1) (2) (3) (4) (5) (6) (7) (8) (9) (10) (11)lfonthly
1973 -- .une 649 228 209 -- 1.085 -1,450 1 1,084 -470 105 175
July 1,073 27 168 1,148 2,416 2,090 263 -850 311 1,185 795
Aug. -753 -- -20 -143 -915 -818 93 978 -304 557 680
Sept -494 -- -30 531 7 -583 -282 1,150 -133 418 475
Oct 1,972 -- 172 295 2,440 1,986 -395 -678 373 540 1,005
Nov -1,008 533 71 -902 -1,307 394 -68 -646 -167 -153 860
Der 1.867 226 178 -831 1,386 1,339 -101 -846 -68 460 475
1974 -- Jan. 895
Feb.
Weekly
1973 -- Nov. 7 -418 - - -2,811 -3,229 -326 -285 288 -78 -245
14 -303 -- -- 2,571 2,268 -848 351 738 122 119
21 3 499 50 907 1,458 2,562 51 -2,389 12 212
28 13 34 20 -1,522 -1,454 -827 -284 449 -220 -442
Dec 5 -304 - - 593 288 710 188 -424 62 412
12 -33 - -84 -1,393 -1,510 -824 -172 538 -31 -427
19 1,002 73 73 2,752 3,900 868 186 -370 106 -578
26 420 50 -- -5,874 -5,404 6 13p -447 152 -238 556
1974 -- Jan. 2 659 205 121 5,124 6,110 716p 168 -885 293 -294o9 205 - -2 -3,819 -3,616 -36p -434 1,025 669 -114p
16 -201 -- -- 2,187 1,986 -155p 213 1,394 307 1,145p
2330
T- Represents change in System s portfolio from end-of-period to end-of-period; includes redemptions in regular bill auctions.
2/ Represents change In daily average level from preceding period.T/ Includes matched sale-purchase transactions as well as RP's.4/ Sum of changes in vault cash, currency in circulation, Treasury operations, F.R. float, gold and foreign accounts, and other F.R. accounts.
5/ Reserves to support private nonbank deposits. Target change for December and January reflects the target adopted at the December 18, 1973 FOMC
meeting. Target change for previous months reflects the bluebook patterns that are consistent with target ranges that were adopted during the
month.
STRICTLY CONFIDENTIAL (FR)JANUARY 18, 1974
TABLE 4
SECURITY DEALER POSITIONS AND BANK POSITIONSMillions of dollars
1977 -- High
1913 -- llighLow
1972 -- Dec.
1073 -- Tan.r1h.
Apr.MaV.Tuno
JuTlyAug.
0pIt .
Oct.Nov.1) r .
1073 -- Nov.
1974 --
7142128
Dec. 5121976
.Tan. 29
162330
U 8 Govt. SecurityDealer Positions Dealer Positions Member Bank Reserves Positions
Per I orlBills Coupon Issues Corporate Municipal Excess** Borrowing at FRB** _ Basic Reserve Deficit
B ill. Bonds Bonds Reserves Total Seasonal 8 New York 38 5thera
(1)
4,2911,916
3,796897
3,510
3, 4072,1327,400
2,4571,8947,281
) .251,6907,745
2,5652,804
*31,41
2,9737,9752,7272,357
3,0903.7373,796
*3,312
*2,890*3,079*3,117
(2)
1,585-93
1,299-301
953
720562-50
106421562
26539
395
484793
*973
1,299859470644
746910
1,144*1,090
*858*611*533
291
177123125
60
151120
1397080
276148276
154167104168
275
225327277
238213125p
(7)
289207177
255161234
285177216
227239299p
26516338485
446-2831 6 p476p
3 8 6 p-2p321p
1.22312
2,561688
1,049
1,1611,5941,825
1,6881,8431,851
1,9532,1651,801
1,4761,3931,299p
1,1701,5211,5721,287
1,4751,3031,489 p1,038p
1,210p
776p989p
33075
155163148
126844 1p
93808584
57454 0p3 p
3 1 p19p20 p
(8)
-5,635-1,638
-5,243-1,831
-4,977
-4,550-4,187-4,273
-3,793-3,019-3,507
-2,460-2.689-3.173
-3,814-4,469-4,682
-5,168-5,056-4,157-3.756
-3.6 ~"-4,881-5,017-4,757
-4,418-5,220p- 6 ,079p
(9)
-5,770-1,910
-10,661-4,048
-4,958
-5,469-5,436-5,847
-6,577-5,872-6,443
-6,106-4,940-5,355
-6,090-8,186-9,793
-6,867-8,572-8,757-8,199
-8,594-10,651-10,661-9,281
- 9,541-10, 79 7p-11,314p
Y1..- overnment Security dealer trading positions are on a commitment basis. Trading positions, wh-ch exclude Treasury bills financed by repurchase agreements
maturing in 16 days or more, are indicators of dealer holdings available for sale over the near-term. Other security dealer positions are debt Issues
still in syndicate, excluding trading positions. The basic reserve deficit is excess reserves less borrowing at Federal Reserve less net Federal funds
pIreChales. Weekly data are daily averages for statem(nt weeks, except for corporate and municipal issues in syndicate which are Friday figures.
* STRICTLY CONFIDENTIAL** Beginning with Tanuary 1973, monthly sverprirs for excess reserves and borrowings are weighted averages of statement week figures.

CONFIDENTIAL (FR)JANUARY 18, 1974
TABLE 5
SELECTED INTEREST RATESPer Cent
Short-Term _ Long-Term
Treasury Bills 90-119 Day CD's New Issue-NYC Aa Utility U.S. Government FNMA
Commercial New Recently Municipal (10-yr Constant Auction
Period Federal Funds 90-Day 1-Year Paper 60-89 Day 90-119 Day Issue Offered Bond Buyer Maturi ty) yields
(M) (2) (3) (4) . (.) (6) (7) (8) (9) (10) (
1972 -- High 5.38 5 13 5.52 5.50 5.38 5.50 7.60 7 46 5.54 6.58 7.72T.Lw 3.18 3.03 3.60 3.75 3.13 3 50 6.99 7.12 4.96 5.87 7.54
193) -- High 10.84 8.95 8.43 10.50 10.50 10.75 8.52 8.30 5.59 7.54 9.37
.Low 5.61 5.15 5.42 5.63 5.38 5 50 7.29 7.26 4.99 6.42 7.69
1917 -- Dec. 5.33 5.07 5.28 5.40 5 19 5.38 7.15 7.18 5.05 6.36 7 68
1q73 -- Jan. 5.94 5.41 5.58 5.76 5.63 5.75 7.38 7.35 5.05 6 46 7.69
reh. 6.58 5.60 5.93 6.17 6.16 6.28 7.40 7 41 5.13 6.64 7.72
Mar 7.09 6.09 6.53 6.76 6.78 6.75 7.49 7.51 5.29 6.71 7.78
Apr. 7.12 6.26 6.51 7.13 7.04 6.75 7.48 7.48 5.15 6.67 7.89
May 7.84 6.36 6.63 7.26 7.44 7.41 7.51 7.50 5.15 6.85 7.98
Tim n8.49 7.19 7.05 8.00 7.98 8.13 7.64 7.64 5.18 6 90 8.07
July 10.40 8.01 7.97 9.26 9.09 9.19 8.01 7.97 5.40 7.13 8 46
Aug. 10.50 8.67 8.32 10.26 10.25 10.40 8.36 8.22 5.48 7.40 8 83
Sept. 10.78 8.29 8.07 10.31 10.31 10.50 7.88 7.99 5.10 7 09 9.32
(Ot 10.01 7.22 7.17 9 14 9.15 9.08 7.90 7.94 5.05 6.79 9.01
Nov. 10.03 7.83 7.40 9.11 9.06 8,91 7.89 7.94 5.18 6.73 8.84
De-e .95 7.45 7.01 9.28 9.44 9.13 8.03 8.03 5.12 6 74 8.78
113 -- Nov 7 9.71 7.84 7.30 8.78 8.75 8.50 8.00 8.02 5.19 6.7614 10.03 8,34 7.54 9.03 9.00 8.88 7.98 7.99 5.27 6.76 8.8721 10.23 7.64 7.47 9.28 9.25 9.13 7.86 7,85 5.13 6.712 1 10.09 7.67 7.32 9.25 9.25 9.13 7.85 7.87 5.15 6.70 8.81
Dec. 5 10.17 7.36 7.31 9.33 9.50 9.25 8.06 7.98 5.15 6.7212 10.04 7.55 7.27 9.48 9.50 9.13 7.97 7.97 5.06 6.69
19 10.18 7.44 6.77 9.18 9.38 9.13 7.98 8.05 5.11 6.71 8.78
26 9.52 7.40 6.79 9.16 9.38 9.00 -- 8.10 5.16 6 87
1474 -- Jan. 2 9.87 7.48 6.88 9.16 9.38 9.00 -- 8.14 5.18 6 94
9 9.76 7.57 7.01 8.98 9.13 8.88 8.17r 8.25 5.22 6.98t6 9.77 7.89 7.09 8.88 9.13 8.88 8.27p 8.2 5p 5.24 6 .99p 8.712330
Noter : Weklty data for columns I to 4 are statement week averages of daily data. Columns 5 and 6 are one-day Wednesday quotes. For Columns 7, 8 and 10
the weekly date is the mid-point of the calendar week ove: which data are averaged. Column 9 is a one-day quote for Thursday following the end of
hire statement week Column 11 gives FNMA auction data for the Monday preceding the end of the statement week. The FNMA auction yield is the
average yield in the bi-weekly auction for short-term forward commitments for Governent underwritten mortgages.

CURRENTLY PUBLISHED DATA
Appendix Table IRESERVE AND MONETARY VARIABLES
CONFIDENTIAL (FR)
January 18, 1974
Reserves ony Stock arrea k crl M. ther
Available to | Adjusted Total I ' Time Thrift U.S.Support Pvt. M M M Credit Loans and local Other than Institution Noudepoait Gov't
period Total I Nnborrowe posit 1 2 3 Proxy I stment.. C Depot ' Cp Funds D
Annually
196819691970197119721973
Semi-Annually:lst Half 19712nd Half 19711st Half 19722nd Half 1972
let Half 19732nd Half 1973
Quarter. :3rd Qtr. 19714th Qtr. 1971
let Qtr. 19722nd Itr. 19723rd Qtr. 19724th Qtr. 1972
lot Qtr. 19732nd Qtr. 19733rd Qtr. 19734th Qtr. 1973
1972: Jan.Feb.Mar.Apr.May.JuneJulyAug.Sept,Oct.Nov.Dec.
1973: Jan.Feb,Mar.Apr.MayJuneJulyAug.Sept.Oct.Nov.Dec.p
(Per Cent Annual Rates of Growth)
+7.5-1.1+6.1+7.2
+10.6+7.6
+9.7+4.4
+11.7+9.0
+7.4+7.7
+6.5+2.3
+10.4+12.6
+3.6+14.2
+8.8+5.8
+10.3+4.7+21.8
-5.2+14.5+22.1
+8.8+6.4+5.2+7.6-1.9
+18.2+11.4+12.5
+35.8-22,1+13.3+12.3+4.4+0.6
+26.9-5.1+8.7
+14.1-72+7.3
+5.3-2,8+9.6+8.1+7.1+6.4
+9.6+6.3
+12.1+2.0
+4.9+7.8
+6.6+6.0
+10.7+13.1
-0.8+4.8
-7.1+17.3+12.4
+3.0+26.7
-5.7+11.0+21.7
+9.4+8.0+2.9+0.7-6.1
+15.5+9.8
-10.9
+31.3-41.3-10.5+26.1
+1.1+24.0444.9-30.3+22.8+19.3- 2.0- 8.2
+8.1-1.7+8.6+7.2+9.7+9.0
+10.7+3.4+8.6
+10.4
+11.4+6.2
+3.2+3.6
+10.4+6.6+9,9
+10.6
+10.5+12.0+13.6
-1.2+11.0+6.5
+13.4+6.8+3.9+9.0+6.9+9.7
+12.9+3.2
+20.8+7.7
+22.8-4.7
+13.4+9.6+9.4
+16.6+18.6+8.4
+13.1+0.9-8 5+4.1
+9.3+2.6+8.4
+11.4+10.8+7.9
+14.9+7.4
+10.8+10.3
+7.7+7.9
+6.0+8.7
+12.7+8.5
+10.3+10.2
+5.7+9.5+5.1
+10.5+10.4+15.1+12.4
+7.9+8.3+9.2
+12.5+9.3+8.7
+10.1+7.9
+12.2
+6.4+5.9+4.7+8.1+9.8
+10.4+5.1+6.4+3.9
+10.4+11.4+9.4
+8.3+2.9+8.0
+13.5+13.0
+8.2
+16.4+9.8
+13.0+12.1
+9.1+7.0
+8.9+10.5
+14.9+10.7+12.4+11.5
+8.6+9.4+4.4+9.4
+13.2+16.8+14.2+10.7+10.1+11.1+13.9+11.6+11.2+12.0
+9.8+12.4
+9.8+9.0+6.9+8.4+9.1
+10.4+5.6+4.2+3.2+9.1
+ 9.9+ 9.1
+9.5+0.4+8.2+9.4
+11.6+10.7
+10.1+8.4
+11.4+11.1
+13.8+7.0
+6.7+9.8
+11.0+11.5
+9.8+12.1
+15.0+12.2+10.5
+3.5+9.2+7.2
+16.2+12.2+15.6+6.6
+10.0+9.6+9.5
+11.9+10.5+13.4
+8.3+16.4+19.7+13.1+12.1+11.1+8,8
+17.0+5.4+1.6+0.3+8.6
I *
+10.9+2.9+8.1
+11.2+14.6+12.6
+12.1+9.7
+13.6+14.7
+16.6+8.0
+8.5+10.6
+15.7+11.1+11J,+15.8
+19.9+12.7+11.4
+4.4+15.3+13.9+17,3+11.4+15.2
+6.5+9.9
+14.4+14 2+11.2+21.+14.3
+17.8+23.7+17.2+13.1+16.6+8.2
+13.3+16.7+4.1+6.7+5.0+1.5
A. I
p - PreliminaryNOTE: Reserve Requirements on Eurodollar borrowings are included beginning October 16, 1969, and requirements on bank-related commercial paper are included beginning October 1, 19701/ Growth rates are based on estimated monthly average levels derived by averaging end of current month and end of previous month reported data2/ Series revised to incorporate new seasonal factors and June 30, 1973, benchmark adjustments Data are preliminary and may be subject to minor changes.
+11.5-4.8
+17.9+18.2+15.5+15.3
+21.6+13.4+15.4+14.5
+20.0+9.6
+9.8+16.6
+15.4+14.8+14.0+14.4
+23.1+16.0+13.4
+5.6+17.7+16.2+11.6+12.8+18.2+12.9+13.6+15.9+12.0+11.5+14.2+17.1
+15.7+21.6+30.9+21.0+18.2+8.1
+12.6+20.4
+6.8+1.7+2.4
+12.8
+11.2+1.4
+11.1+16.7+13.3+10.6
+20.0+12.1+13.7+12.1
+9.2+11.4
+8.0+15.9
+16.1+10.8+12,3+11.6
+9.5+8.7+9.8
+12.7+19.2+15.4+13.2
+7.8+13.0+11.4+12.3+14.0+10.2+12.8+10.4+11.2
+12.9+5.7+9.6+8.7+9.1+8.1+5.5
+14.0+9.6
+16.2+12 3
+9.3
+6.3+3.6+7.1
+17.4+17.0+&.7
+19.3+14.3+17.3+15.4
+11.6+5.3
+14.5+13.5
+19.1+14.7+16.2+13.9
+13.6+9.4+3.1+7.6
+18.9+20.0+17.4+15 8+13.4+14.5+17.0+15.5+15.7+15.5+13.2+12.7
+15.8+14.4+10.2+9.4+7.8
+10.8+6.5
+2.7+6 4+7.2+9.0
1 \"/ ) n- ( \*
(Dolla; Change in Billions)
+2.9 +2.6 -0.6-12.4 +13.0 +0.5+14.4 -8.4 +1.1+7.7 -7.6 -0.3
+10.1 +0.4 +0.4+19 3 +3.0 -1.1
+4.3 -7.1 -1.4+3.4 -0.4 +1.1+4.4 -0.3+5.7 +0.6 +0.4
+18.9 +1.2 -1.4+0.5 +1.7 +0.3
+1.7 -0.4 +1.1+1.8
+0.8 -0.3 -0.4+3.7 -- +0.5+2.4 +0.4 -1.1+3.3 +0.3 +1.4
+11.7 +0.5 +9.9+7.1 +0.7 -2.4+4.7 +1.6-4.3 +0.1 +0.3+0.1 -0.1 +0.2+0.6 -0.3 -1.7+0.1 +0.1 +1.1+1.5 -0.2 +1.1+1.5 +0.2 +0.7+0.7 -- -1.3+0.8 +0.1 -1.0+0.8 +0.3 -0.7+0.8 -0.1 +0.6+0.2 +0.2 +1.2+1.2 -- +0.6+1.9 +0.1 -0.4
+1.2 +0.1 +0.6+4.5 -- +0.1+6.1 +0.4 +0.3+3.8 +0.2 -1.7+3.1 +0.3 -1.2+0.3 +0.2 +0.5+2.4 +0.9 -1.7+2.5 +0.6 +0,8-0.2 +0.1 +0.9-3.4 -0.4 +1.5-2.3 +0.2 -0.7+1.4 +0.3 -0.5
I ------- ~---I --
Appendix Table IIRESERVES AND MONETARY VARIABLES
(Seasonally adjusted, billions of dollars)
CONFIDENTIAL (FR)
January 18, 1974
RESERVES MONEY STOCK MEASURES BANK CREDIT MEASURES OTHER
Available to Adjusted Total 2/ Time Thrift Non- U.S.Non- Support Pvt. Credit Loans & Total Other than Institution Depotta Gov't
Period Total borrowed Deposits Total Pvt. ep. 2 3 Proxy Investments Time GO's Deposits 1 ps Funds Demand
ANNUALLY:
Dec. 1969Dec. 1970Dec. 1971
1972
-- JulyAug.Sept.
Oct.Nov.Dec.
1973--Jan.Feb.Mar.
Apr.MayJune
JulyAug.Sept.
Oct.Nov.Dec.
Nov. 7142128
Dec. 5121926
Jan. 2 p9p
27,95929,12131,209
33,17133,38133,327
33,83231,88331,309
32,24231,64931.999
32,32632,44532,460
33,56933,89834,145
34,97134.80334,957
34,65834,67535,21634,606
35,00934,51435,21735,196
34,90635,502
26,69928,72731,060
33,01833,03832,870
33,29531,29730,063
30,84829,78729,526
30,16730,19530,800
32,33231,99632,604
33,55333,53933,252
33,23532,94333,87533,777
33,21831,94133,15334,188
33,47434,497
25,33926,97528,907
30,31730,56230,890
30,97329,49628,862
29,41129,29629,622
29,86030,09530,511
31,32431,96132,311
32,75932,57132,623
32,49632,46432,89232,369
32,80232,31132,76532,873
32,41532,459
208.8221.3236.0
247.7248.6250.1
251.6252.7255.5
255.4256.7256.6
258.2260.5263.2
264.3263.9263.4
264.4266.6268.7
266.4267.0267.5265.4
266.6267.9268.8269.2
269.4267.6
162.7172.2183.4
193.1193.8194.8
195.9196.5198.7
198.4199.3198.7
199.5201.6203.9
204.9204.2203.3
204.0205.8207.2
205.9206.2206.4204.6
205.9206.4207.3207.1
207.5205.5
392.3 594.0 307.7425.2 641.3 332.9473.8 727.7 364.3
784.0791.6799.0
807.0813.6822.0
828.7834.9839.7
845.6852.0859.4
863.5866.5868.8
875.4882.6899.3
388.3391.4394.5
398.4401.9406.4
409.2414.8421.6
426.2430.5434.5
437.7443.9445.9
446.5446.6449.8
446.8446.4446.6446.5
446.8447.0448.2451.7
453.9453.8
405.6438.5487.6
525.1531.4537.7
542.552.4559.0
567.3578.5586.8
593.2601.4605.5
612.2620.7622.8
626.3628.9629.7
194.4229.2270.9
295.0298.9301.9
304.8308.4312.8
316.9322.6330.9
336.7341.8344.1
347.7353.6355.6
356.1356.8360.6
356.8356.7356.1357.2
357.8359.2360.7361.5
363.5364.4
183.5203.9237.9
256.8259.8262.0
264.8267.1269.6
272.5273.8276.0
278.0280.1282.0
283.3286.6288.9
292.8295.8298.1
295.1295.9295.3296.1
296.7296.4298.7298.6
299.5300.1
201.7216.1253.8
279.6283.2286.9
290.6293.8296.9
300.8304.4307.0
309.4311.4314.2
315.9315.9316.6
318.3320.2322.6
p - PieliminaryNOTE: Reserve requirements on Eurodollar borrowings are included beginning OLtober 16, 1969, and requirements on bank-related commercial paper are included beginning
October 1, 1970. Adjusted credit proxy includes mainly total member bank deposits subject to reserve requirements, bank-related commercial paper and Eurodollarborrowings of U.S. banks. Weekly data are daily averages for statement weeks. Monthly data are daily averages except for nonbank commercial paper figures whichaif or last day of month. Weekly datai are not available for M3, total loans and investments and thrift institution deposits.
1/ EbtimIoted monthly average levels derived by averaging end of current month and end of previous month reported data.2/ Series revised to incorporate new season.al factorb and June 30, 1973, benchmark adjustments. Data are preliminary and may be subject to minor changes.

Appendix Table III
Growth Rate in Money Supply--New Revised Series(Per cent change at an annual rate)
M1
M Q
M2
M Q
9.0
6.2
8.7
9.9
I 3.8
II 11.5
III -0.2
IV 8.0
5.3
8.2
8.2
8.4
7.1
7.3
5.5
4.1
12.3
8.9
10.8
10.6
6.9
11.1
5.2
10.2
11.0
9.8
10.8
10.2
8.9
8.6
7.9
8.6
14.6
10.9
12.8
11.8
9.4
10.4
4.5
9.3
13.2
12.0
12.6
11.8
10.8
9.1
7.2
7.4
M = Annual rates of growth calculated from averagelevels in the final months of the quarters.
Q = Annual rates calculated from average levels in allthree months of the quarters.
M3
M 4mH_ ___ 5
I
II
III
IV
1972
1973

Appendix Table IV
Comparison of Published, Preliminary Revisedand New Revised M1 and M2 Growth Rates
Ml M2
Preliminary New Preliminary NewPublished Revised Revised Published Revised Revised
Annual:
1971 6.6 6.3 6.3 11.4 11.2 11.21972 8.3 8.7 8.7 10.8 11.1 11.11973 5.2 6.3 5.9 7.9 8.9 8.6
Half year:
1971 1st Half 10.1 9.9 9.9 14.9 14.8 14.82nd Half 3.0 2.6 2.6 7.4 7.1 7.1
1972 1st Half 7.7 7.7 7.7 10.8 10.7 10.72nd Half 8.5 9.4 9.4 10.3 11.0 10.9
1973 1st Half 6.0 7.7 7.7 7.7 9.0 9.12nd Half 4.2 4.7 3.9 7.9 8.5 7.8
Quarterly:
1972 I 9.2 9.0 9.0 12.7 12.3 12.3II 6.1 6.2 6.2 8.5 8.9 8.9III 8.2 8.7 8.7 10.3 10.8 10.8IV 8.6 9.9 9.9 10.2 10.6 10.6
1973 I 1.7 3.4 3.8 5.7 6.5 6.9II 10.3 11.8 11.5 9.5 11.3 11.1III 0.3 0.8 -0.2 5.1 6.2 5.2IV 8.0 9.2 8.0 10.5 10.6 10.2
Monthly:
1973 January -0.5 4.7 4.7 6.4 9.1 9.4February 6.1 6.5 7.0 5.9 6.3 6.8March -0.5 -0.9 -0.5 4.7 4.1 4.5April 7.5 6.5 6.0 8.1 8.3 8.3Nay 10.7 13.4 13.9 9.8 12.3 11.8June 12.4 15.1 14.2 10.4 13.0 12.8July 5.0 5.0 4.1 5.1 6.6 5.7August -1.8 0.0 -0.9 6.4 7.2 6.3September -2.3 -2.7 -3.6 3.9 4.8 3.7October 4.6 6.3 5.0 10.4 11.4 10.8November 10.0 10.6 10.4 11.4 11.3 10.9December 9.5 8.5 8.5 9.4 9.4 8.7


