Embed Size (px)
Citation preview

Prefatory Note
The attached document represents the most complete and accurate version available based on original copies culled from the files of the FOMC Secretariat at the Board of Governors of the Federal Reserve System. This electronic document was created through a comprehensive digitization process which included identifying the best-preserved paper copies, scanning those copies,1 and then making the scanned versions text-searchable.2 Though a stringent quality assurance process was employed, some imperfections may remain.
Please note that this document may contain occasional gaps in the text. These gaps are the result of a redaction process that removed information obtained on a confidential basis. All redacted passages are exempt from disclosure under applicable provisions of the Freedom of Information Act.
1 In some cases, original copies needed to be photocopied before being scanned into electronic format. All scanned images were deskewed (to remove the effects of printer- and scanner-introduced tilting) and lightly cleaned (to remove dark spots caused by staple holes, hole punches, and other blemishes caused after initial printing). 2 A two-step process was used. An advanced optimal character recognition computer program (OCR) first created electronic text from the document image. Where the OCR results were inconclusive, staff checked and corrected the text as necessary. Please note that the numbers and text in charts and tables were not reliably recognized by the OCR process and were not checked or corrected by staff.

Strictly Confidential (FR) Class I FOMC
MONETARY POLICY ALTERNATIVES
Prepared for the Federal Open Market Committee
By the staff Board of Governors of the Federal Reserve System
January 29, 1982
STRICTLY CONFIDENTIAL (FR) January 29, 1982CLASS I - FOMC
MONETARY POLICY ALTERNATIVES
Recent developments
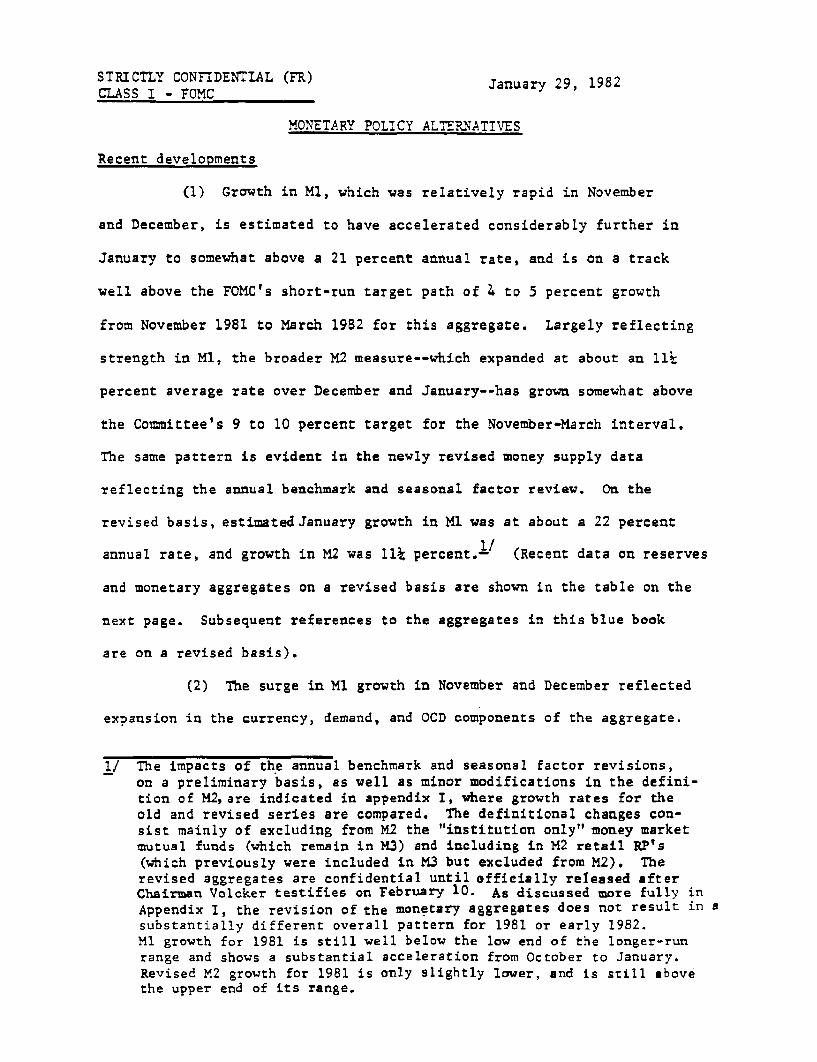
(1) Growth in M1, which was relatively rapid in November
and December, is estimated to have accelerated considerably further in
January to somewhat above a 21 percent annual rate, and is on a track
well above the FOMC's short-run target path of 4 to 5 percent growth
from November 1981 to March 1982 for this aggregate. Largely reflecting
strength in M1, the broader M2 measure--which expanded at about an 11¼
percent average rate over December and January--has grown somewhat above
the Committee's 9 to 10 percent target for the November-March interval.
The same pattern is evident in the newly revised money supply data
reflecting the annual benchmark and seasonal factor review. On the
revised basis, estimated January growth in M1 was at about a 22 percent
annual rate, and growth in M2 was 11¼ percent.1/ (Recent data on reserves
and monetary aggregates on a revised basis are shown in the table on the
next page. Subsequent references to the aggregates in this blue book
are on a revised basis).
(2) The surge in M1 growth in November and December reflected
expansion in the currency, demand, and OCD components of the aggregate.
1/ The impacts of the annual benchmark and seasonal factor revisions,on a preliminary basis, as well as minor modifications in the defini-tion of M2,are indicated in appendix I, where growth rates for theold and revised series are compared. The definitional changes con-sist mainly of excluding from M2 the "institution only" money marketmutual funds (which remain in M3) and including in M2 retail RP's(which previously were included in M3 but excluded from M2). Therevised aggregates are confidential until officially released afterChairman Volcker testifies on February 10. As discussed more fully inAppendix I, the revision of the monetary aggregates does not result in asubstantially different overall pattern for 1981 or early 1982.M1 growth for 1981 is still well below the low end of the longer-runrange and shows a substantial acceleration from October to January.Revised M2 growth for 1981 is only slightly lower, and is still abovethe upper end of its range.

KEY MONETARY POLICY AGGREGATES(Seasonally adjusted annual rates of growth)
S Growth in Preceding Years
1981 1982 Jan. '82 / (QIV over QIV (Year over
/ over basis) Year basis)Nov. Dec. Jan.- Nov. '81 1980 1981 1980 1981
Money and Credit Aggregates
M1 9.7 11.5 22.3 17.0 7.2 5.0 6.2 7.0(Shift-adjusted) (7.7) (9.9) -- -- (6.7) (2.3) (5.9) (4.7)
M2 13.7 7.8 11.2 9.6 9.1 9.4 8.3 9.8
M3 13.2 7.0 9.4 8.3 9.9 11.3 9.3 11.6
2/ 2Bank Credit 3.4 11.1- n.a. n.a. 8.0 8.8- 8.5 9.6
3/Reserve Measures-
4/Nonborrowed reserves- 7.4 16.6 -13.0 4.0 7.5 6.8 7.0 5.8
Total reserves -0.1 16.1 11.1 13.7 6.8 3.7 6.4 5.7
Monetary base 5.8 9.8 9.2 9.6 8.4 5.0 8.4 6.7
Memo: (Millions of dollars)Adjustment borrowing 498 488 1,274Excess reserves 259 308 322
January 1982 estimated on the basis of partial data.Adjusted for shifts of assets from U.S. offices to IBFs.Growth rates for reserve measures are adjusted to remove the effects of discontinuitiesresulting from phased changes in reserve ratios under the Monetary Control Act. Inaddition, reserve data for QIV '80 have been adjusted to remove the distorting effectsof the reduction in weekend reserve avoidance activities that occurred in late 1980.
4/ Nonborrowed reserves include special borrowing and other extended credit from theFederal Reserve.
N.B. The data in this table reflect seasonal and benchmark revisions, as well as minordefinitional changes. See appendix I. Revised data are confidential until releasedofficially after Chairman Volcker testifies on February 10.
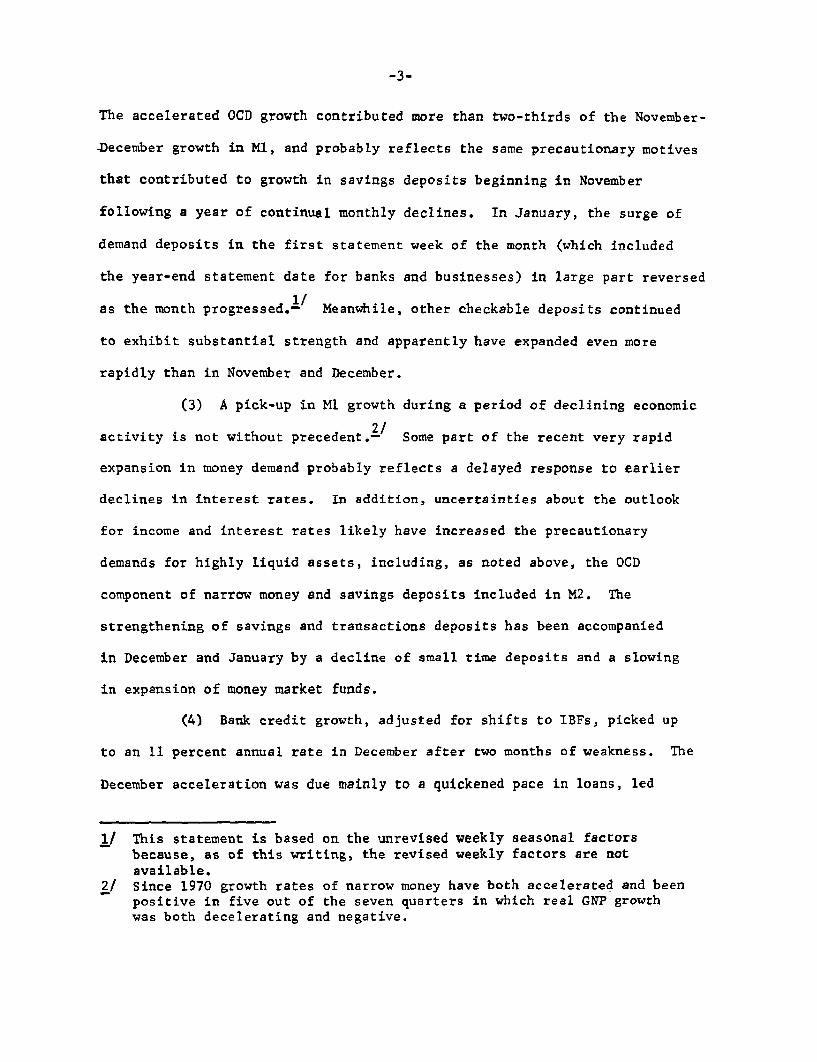
The accelerated OCD growth contributed more than two-thirds of the November-
December growth in M1, and probably reflects the same precautionary motives
that contributed to growth in savings deposits beginning in November
following a year of continual monthly declines. In January, the surge of
demand deposits in the first statement week of the month (which included
the year-end statement date for banks and businesses) in large part reversed
as the month progressed.1/ Meanwhile, other checkable deposits continued
to exhibit substantial strength and apparently have expanded even more
rapidly than in November and December.
(3) A pick-up in M1 growth during a period of declining economic
2/activity is not without precedent.- Some part of the recent very rapid
expansion in money demand probably reflects a delayed response to earlier
declines in interest rates. In addition, uncertainties about the outlook
for income and interest rates likely have increased the precautionary
demands for highly liquid assets, including, as noted above, the OCD
component of narrow money and savings deposits included in M2. The
strengthening of savings and transactions deposits has been accompanied
in December and January by a decline of small time deposits and a slowing
in expansion of money market funds.
(4) Bank credit growth, adjusted for shifts to IBFs, picked up
to an 11 percent annual rate in December after two months of weakness. The
December acceleration was due mainly to a quickened pace in loans, led
1/ This statement is based on the unrevised weekly seasonal factorsbecause, as of this writing, the revised weekly factors are notavailable.
2/ Since 1970 growth rates of narrow money have both accelerated and beenpositive in five out of the seven quarters in which real GNP growthwas both decelerating and negative.

by a significantly higher growth of business loans (adjusted for shifts
to IBFs). Large bank data for early January suggest continued strength
for business loans, in large part reflecting a shift in corporate borrowing
from long-term markets. In December and January, commercial banks supple-
mented their other deposit flows by stepping up issuance of large time
deposits, while S&Ls continued to issue such deposits at an appreciable
pace.
(5) Total reserves expanded over December and January at about
13½ percent annual rate on average, reflecting the increase in required
reserves associated with the strength in the aggregates. Most of the
increased demand for reserves in December was, consistent with the reserve
path, accommodated by open market operations. By January, however, con-
straint on reserve provision by the Desk led to a sizable increase in
adjustment borrowing at the discount window as required reserves strengthened
markedly relative to path. The increase in borrowings was reinforced, given
continued strength in the aggregates, by a mid-January lowering of the
nonborrowed reserve path.1/ Nonborrowed reserves declined in January at
an estimated 13 percent annual rate. Over the last four statement weeks,
adjustment borrowing has averaged about $1.3 billion, in contrast to the
$300 million initially assumed in construction of the nonborrowed reserve
path.
(6) Given the tightening of bank reserve positions, short-
term market interest rates have risen about ¾ to 1½ percentage points,
on balance, since the December FOMC meeting. The federal funds rate has
moved up to the 14 percent area. Markets also have focused on the large
current and prospective borrowing requirements of the federal government.
1/ Reserve paths and adjustments made since the last Committee meetingare shown in Appendix II.

Since the December meeting, the Treasury has increased the size of the
weekly bill auction twice, boosted the monthly bill auction, and .issued
126-day cash management bills. For its mid-February refunding, the
Treasury has announced an offering of $10 billion of new coupon issues
(which will raise $5 3/4 billion of new cash). Bond rates rose substantially
after the December FOMC meeting, but the recent rally has cut the increase
to about 1/4 to 1/2 percentage point. In January corporate bond issuance
declined to minimal levels, increasing the already sizable backlog of
issues overhanging the market. Since the last meeting, rates on fixed
rate mortgages in the primary market have risen almost 3/4 of a percentage
point.
(7) The dollar has risen by 2 percent on a weighted average
basis,
. The strength of the dollar was primarily in response
to the recent rise in short-term U.S. interest rates, coupled with a slight
decline in foreign interest rates, which increased the differential
between U.S. and a weighted average of short-term foreign interest rates
from to 2 percentage points over the period.
Alternative longer-run monetary strategies
(8) Broad economic and financial considerations affecting
the Committee's decision with respect to long-run targets for 1982
were discussed in the previous blue book. In this blue book, quantita-
tive impacts on key economic variables are estimated for alternative
money growth strategies looking out over the next three years. Of the
three strategies shown in the table on the next page, Strategy 1 would
have M1 grow from its QIV '81 level at the 4 percent midpoint of the
Committee's tentative 2½ to 5½ percent range for 1982 and then decelerate
gradually to 3½ percent in 1983 and 3 percent in 1984. M2 growth in 1982
would be about 8 percent, in the upper part of the FOMC's tentative 6 to
9 percent range. This strategy embodies the monetary policy assumption
underlying the staff's judgmental GNP forecast detailed in the Greenbook.
Strategy 2 specifies faster M1 growth--at the 5½ percent top of tentative
range for 1982 and then decelerating one-half percentage point per year
in 1983 and 1984. Strategy 3 represents a more stringent monetary policy,
with M1 growing at the 2½ percent low end of the tentative 1982 range and
continuing at that same rate in 1983 and 1984.
(9) As may be seen in the table, the extension of the Strategy 1
monetary path through 1984 produces a continuation of the moderate real GNP
growth in the Greenbook forecast for 1983 and a further slowing of inflation.
Unemployment remains in the 9 percent area. The higher M1 growth in Strategy 2
permits a considerably faster expansion of nominal GNP. (Projections
associated with Strategies 2 and 3 were derived as differences from the
judgmental base forecast as calculated by the Board's quarterly econometric
model.) Given the structure of the economy, as captured in the model,
within the three year forecast horizon the bulk of the increment to

Economic Projections Associatedwith Alternative Long-runMonetary Growth Strategies
1982
Nominal GNP (percent change, Q4/Q4)
Strategy 1Strategy 2Strategy 3
Real GNP (percent change, Q4/Q4)
Strategy 1Strategy 2Strategy 3
7.98.76.9
1.32.00.5
Implicit GNP Deflator (percent change, Q4/Q4)
Strategy 1Strategy 2Strategy 3
6.46.56.4
Unemployment Rate (Q4 average)
StrategyStrategyStrategy
9.39.09.6
Treasury Bill Rate (Q4 average)
Strategy 1Strategy 2Strategy 3
13.09.7
16.7
Note: Strategy 1:
Strategy 2:
Strategy 3:
M1 grows 4 percent in 1982, 3k percent in 1983, 3 percentin 1984Ml grows 5% percent in 1982, 5 percent in 1983, 4
percent in 1984Ml grows 2 percent in 1982, 1983 and 1984.
19841983
7.69.26.0
6.810.2
5.1
2.33.61.1
2.54.61.7
5.15.44.9
4.25.33.3
9.18.2
10.1
12.58.315.6
8.96.9
10.5
11.08.4
11.9

nominal GNP under strategy 2 shows up in greater output. However, by the
third year inflation is no longer slowing, and upward price pressures are
likely to be strengthening,given the level of plant and manpower resource
utilization. Strategy 3, on the other hand, forces a more rapid decelera-
tion in nominal GNP; real GNP growth is very sluggish, causing the
unemployment rate to move above 10 percent, but the inflation rate drops
to around 3 percent by 1984.
(10) It should be noted that the staff's judgmental forecast,
represented by the Strategy 1 results, implies a substantial continuing
shortfall in the demand for M1 relative to the patterns obtaining before
the mid-1970s (according to the standard formulation in the Board model).
The failure of such weakness to materialize would result, at least in the
earlier part of the period, in higher interest rates, with negative con-
sequences for economic activity. On the other hand, the projection for
Strategy 3 does not allow for the possibility that a tendency for short-
term rates to rise toward record levels might prompt a still greater
degree of innovation in cash management; such a development would mean
that attainment of the specified M1 growth would be less restrictive than
indicated. Finally, it also should be noted that these figures do not
make allowance for the possibility that wages might adjust more quickly
than in the past to labor market slack or that inflation expectations,
as reflected in wage decisions or in bond rates, might improve markedly
owing to a greater public confidence in governmental policies. Such
developments could yield better outcomes for both real output and prices,
but would have to be major departures from past patterns in order to
materially alter the picture.

-9-
Near-term targets
(11) Attainment of the Committee's short-run target calling
for growth in M1 at a 4 to 5 percent annual rate from November to March
requires M1 to decline on average on the order of 8 percent, at an annual rate,
over February and March. Such an average rate of decline for a two-month
period would be very unusual, though not without precedent in the period
since 1959 for which we have monthly daily average data. So rapid a two-
month rate of decline developed in March-April of 1980, but at that time
money supply behavior was affected in large part by the ramifications of the
newly imposed credit control programs. However, there was a two-month
decline of similar magnitude in 1981 that seemed more related to monetary
policy actions. In May-June of last year M1-B (shift adjusted) declined at
almost a 7 percent annual rate, following a 19½ percent rise in April, while
the funds rate rose from a low of 13 percent in late March to over 19
percent in June.1/ Under current circumstances, it seems plausible that
there will be a sharp deceleration in money demand at around current interest
rates,and possibly even some decline, in part as the public begins to
invest or spend funds that had been temporarily placed in NOW accounts and
also demand deposits. But the very sharp decline over a 2-month period re-
quired to attain the FOMC's previous target seems unlikely to occur without a
further rise in the funds rate. A contraction in total reserves at about
a 7 percent annual rate from January to March would be needed. Non-
borrowed reserves would decline at about a 30 percent annual rate, if
borrowing were set at around $3 billion on the ground that a rise in the
funds rate of around 3 percentage points is likely to develop.
1/ Not-shift adjusted M1-B declined at a 6¾ percent annual rate in May-June following a 25 percent rise in April.

-10-
(12) Continuation of the short-run policy toward M1 adopted
at the last meeting is shown as alternative A in the table below. This
option would bring M1 into the upper half of the 2½ to 5½ percent longer-
run range by March, assuming this long-run range is based, as has been
the case in the past, on the actual average level of M1 in the fourth
quarter of the previous year.1/ The risk of sharp interest rate fluctua-
tions that might be associated with alternative A, accompanied by
potentially adverse implications for economic activity and financial
markets, might be reduced by extending beyond the first quarter the
horizon over which the Committee targets the return of M1 to within the
tentative 2½ to 5½ percent longer-run range--as is contemplated by the
three other alternatives in the table. (More detailed and longer-run data
for the alternatives are contained in the table and charts on the
following pages).
Alt. A Alt. B Alt. C Alt. D
Growth from Jan. to March
M1 -8 1 2½ 4M2 5½ 8 8½ 9
Implied growth fromNov. '81 to March '82
M1 4½ 9 10 10½M2 7½ 9 9 9
Federal funds rate range 13 to 19 12 to 16 11 to 15 10 to 14
1/ Even if the Committee wished to aim at the upper limit of that longer-run range by March, M1 would have to contract at about a 5½ percentannual rate over the remaining months of the quarter.

-11-
Alternative Levels and Growth Rates for Key Monetary Aggregates
Alt. A Alt. B Alt. C Alt. D Alt. A Alt. B Alt. C Alt. D Alt. A Alt. B Alt. C Alt. D
436.5440.7448.9446.0443.0
1981--NovemberDecember
1982--JanuaryFebruaryMarch
Growth RatesMonthly
1981--NovemberDecember
1982--JanuaryFebruaryMarch
9.711.522.3-7.8-8.1
4.52.1-7.9
Nov. '81 - March '82Dec. '81 - March '82Jan. '82 - March '82
Quarterly Averages
QIV '81 - QI '82QIV '81 - QIV '82
436.5440.7448.9449.3449.6
9.711.522.31.10.8
436.5440.7448.9449.9450.9
9.711.522.32.72.7
436.5440.7448.9450.4451.9
9.711.522.34.04.0
9.0 9.9 10.68.1 9.3 10.20.9 2.7 4.0
8.5 11.5 12.1 12.54.0 4.0 5.0 6.2
1809.41821.51838.51847.01855.4
13.78.0
11.25.55.5
1809.41821.51838.51850.81863.0
13.78.0
11.28.07.9
1809.41821.51838.51851.51864.5
13.78.0
11.28.58.4
8.9 9.19.1 9.48.0 8.5
8.9 9.88.0 8.0
1809.41821.51838.51852.31866.1
13.78.0
11.29.08.9
2174.32187.02204.22217.62230.9
13.27.09.47.37.2
2174.32187.02204.22221.42238.5
13.27.09.49.49.2
7.8 8.98.0 9.47.3 9.3
2174.32187.02204.22221.72239.1
13.27.09.49.59.4
2174.32187.02204.22222.22240.2
13.27.09.49.89.7
8.9 9.19.5 9.79.5 9.8
10.19.0
Annual Averages
1981 over 19801982 over 1981
7.0 7.05.1 5.8
9.8 9.88.6 8.8
9.59.5
11.6 11.69.5 9.8
11.6 11.69.8 10.0
NOTE: Bank credit would be expected to grow approximately 8 percent between QIV '81 and QIV '82 under alternatives A, B, andC, and somewhat faster under alternative D -- !after adjustment for the impact of shifts of assets from domestic officesto IBFs. The need for such an IBF adjustment could be avoided by basing the annual range for bank credit on theactual December-January average; such a base would yield virtually the same 1982 growth rates.

Chart 1
Actual and Targeted M1
CONFIDENTIAL (FR)
Class II-FOMC
Billions of dollars1480
- Actual Level 1
.... Short -Run Alternatives-- 470
-- 460
2%% -- 450
C-
-- 440
-- 430
-- 420
O N J F M A M J J A S O N D0 N 0 J F M A M J J A S 0 N D
19811
January level is projected.
1982
C,.°

Chart 2
Actual and Targeted M2CONFIDENTIAL (FR)
Class II FOMC
Billions of dollarsS2000
- Actual Level1
S* Short -Run Alternatives
//
- 1980
- 1960
1940
1920
1900
i 1880
O/
/
1860
-1 1840
- 1820
- 1800
1 I I I 1 I I I I I IO N D J
1981
1 January level is protecled.
F M A M J J A S 0 N D1982
1780
M2r-

Chart 3
Actual and Targeted M3
CONFIDENTIAL (FR)
Class II-FOMC
M3-
- Actual Level
- - - Short -Run Alternatives
Billions of dollars2400
2350
% - 23061
/% 2300
D9- -1 2250
2200
-42150
0 N D
1981
1 January level is projected
NOTE B. C, and D alternatives are indistinguishable on this scale.
I 1 I I I 1 I I I IJ F M A M J J A S 0 N D
1982
10nnSI 1 .
91nn

-12-
(13) Alternative B is designed to attain the upper limit of
the 2½ to 5½ percent range for M1 by June. That would be achieved, as
shown in Chart 1, by extending the January to March annual growth rate of
1 percent, suggested for this alternative, through June. This approach,
like alternative A, would be consistent with growth for 1982 at around the
midpoint of the longer-run range. Alternative C, which involves about a
2½ percent annual rate of growth over the last two months of the current
quarter, is designed to reach the upper end of the M1 range by September.
Such an approach would be more consistent with growth for the year in the
upper half of the longer-run range.
(14) Alternative D specifies a 4 percent annual rate of growth
for February and March. Continuation of that growth rate over the balance
of the year would result in growth of M1 from QIV '81 to QIV '82 at about
6¾ percent, above the 5½ percent upper limit of the 1982 range based on
the actual QIV '81 average level. Such a trajectory would be consistent
with a Committee decision to raise the upper limit of the tentative 1982
range or a decision to base the 2½ to 5½ percent range, not on the actual
QIV '81 level, but on, say, the lower limit of last year's longer-run
target range.1/ When the Committee established its tentative range for
1982 last July, it had anticipated that M1 would reach the lower limit
of the long-run range for 1981 by the fourth quarter; an upward shift in
1/ To derive a base consistent with the current M1, which is not shift-adjusted, the level in QIV '81 implied by the 3½ percent lower limit
of the target range for M1-B shift-adjusted has to be raised by the$11.3 billion of estimated shifts into NOW accounts from non-demand
deposit sources in 1981. This derived level would be $5.1 billion,or 1.2 percent, higher than the actual (not shift-adjusted) level ofM1-B in the fourth quarter of 1981.

-13-
the base for the 1982 range would in that context indicate the Committee
was not willing to accept last year's undershoot and viewed the recent
increase in M1 as at least in part a desirable offset to the earlier short-
fall. With such a rebasing of the 2½ to 5½ percent longer-run range for
1982, the specifications of alternative D if extended for the year would
bring M1 into the upper half of the rebased range by the fourth quarter of
this year. If alternative C were adopted in conjunction with a rebasing
of the long-run range, growth by the fourth quarter would be around the
midpoint of the range.
(15) In all of the alternatives, except for A, M2 would probably
be above the top of its tentative longer-run range by March, essentially
reflecting the strength of M1 growth over the last three months. Given
the slowing in M1 growth that is targeted for the balance of the year,
the staff expects that M2 growth over the year as a whole will fall within
its longer-run range for alternatives A, B, and C, and will be at the top
of the range under the more expansive alternative D. Such behavior would
be consistent with the unchanged income-velocity of M2 over the past two
years.
(16) Alternative B calls for growth in Ml at about a 1 percent
annual rate over the two months January to March, a considerable decelera-
tion from the rapid pace of the previous three months. The staff believes
that such a slowing in narrow money growth is consistent with only rather
modest further upward pressure on interest rates, if any. Given the
staff's projection of nominal GNP growth during the current quarter at
only about a 2½ percent annual rate, the rapid increase in money that has
already occurred would appear quite sufficient to finance transactions
needs over the quarter, even assuming that a substantial part of the

-14-
increase represented precautionary balances. Indeed, even with virtually
no money growth over the balance of the quarter, the velocity of M1 would
decline in the quarter at a postwar record annual rate of about 9 percent.
(17) The alternative B specifications would entail little change
in total reserves over the period from January to March. Assuming adjustment
borrowing of around $1 billion, nonborrowed reserves would decline at a
3 percent rate and, at the present discount rate, the federal funds rate
in the intermeeting period would likely fluctuate in a 13½ to 14½ percent
range.1/ Demands for short-term credit are likely to remain quite strong
over the balance of the quarter, with businesses continuing to avoid the
bond market at the relatively high rate levels likely to prevail over the
near-term under this alternative.
(18) Treasury credit demands will remain sizable in all maturity
sectors. The 3-month bill rate may be in a 12½ to 13½ percent range over
the next few weeks. However, both short- and long-rates might show down-
ward tendencies as the quarter progresses, as the market responds to slow
money growth and also if economic indicators show unexpected economic
weakness. Residential mortgage rates are likely to remain near their
current advanced levels, and this may work to restrain demand for mortgage
commitments--the supply of which might also be constrained by cautious
behavior of thrifts in face of continued operating losses.
(19) Alternative C, which calls for growth of M1 at about a
2½ percent annual rate from January to March, would involve an increase
in total reserves over the balance of the quarter at about a 2 percent
1/ Such an interest rate is consistent with the near-term financial condi-tions assumed in the Greenbook GNP projection. Appendix III showsthe quarterly pattern of interest rates over 1982 and 1983 associatedwith the Greenbook projection.

-15-
annual rate. Assuming a decline in adjustment borrowing from recent levels
to about $1 billion, nonborrowed reserves would rise at 2 percent rate.
A federal funds rate of about 13 percent would be implied. The 3-month
bill rate would likely decline from present levels to around 12 percent
or a bit lower as expectations of further monetary ease tend to develop.
Bond yields may edge down from current levels, inducing a pick-up in bond
issuance from recent depressed levels.
(20) Alternative D, involving a 4 percent rate of growth of M1
on average in February and March, would require a growth in total reserves
at about a 4 percent annual rate. Given the staff's expectations for
weak money demand,such reserve growth would probably be associated with
a decline in borrowing to about $500 million, given the current discount
rate, and with growth in nonborrowed reserves at a 15 percent annual rate
over the balance of the quarter. The federal funds rate may drop to near
12 percent, and the 3-month bill rate decline into the 10½ to 11 percent
area. A sizable rally in bond markets would also tend to develop, but
marketing of the large overhang of corporate bonds would tend to moderate
the extent of rate decline. Cost pressure on thrift institutions would be
eased, which would probably be reflected in a downward adjustment in
mortgage rates and in a greater willingness on the part of instititions
to make mortgage commitments. M2 growth is likely to be strengthened
under this alternative, particularly in the near-term, as yields on MMMFs
lag the drop in open market rates.

-16-
Directive language
(21) Given below are two suggested operational paragraphs
for the directive. Alternative I, in which the specifications adopted
at the meeting on December 21-22 are shown in strike-through form, is
the more standard form. It could be adapted to growth rates either
continuing to be based on November, as at the last meeting, or updated
to January to take account of recent developments. Alternative II need
not have different substantive implications than alternative I. However,
its language relates the short-run objectives more explicitly to
achievement of the longer-run target over time, and indicates that a more
rapid return than the basic short-run path that might be selected by the
Committee would be acceptable in an environment of easier market conditions.
Alternative I
In the short run, the Committee seeks behavior of reserve
aggregates consistent with growth of M1 and M2 from [DEL: November
1981 to March] ____ TO ____ at annual rates of around [DEL: 4-to-5]
____ percent and [DEL: 9 to 10] ____ percent respectively. [DEL: The target
for M1 no longer reflects the "shift adjustment" for conversion
of outstanding interest-bearing assets into NOW accounts,
formerly estimated in the "shirft adjusted" M-1B series. In
setting the M1 target, the Committee took acocunt of the
relatively rapid growth that had already taken place through
the first part of December; it also recognized that inter-
pretation of actual money growth may nned to take account of
the significance of fluctuations in NOW accounts, which have
recently been growing relatively rapidly.] The Chairman may
call for Committee consultation if it appears to the Manager

-17-
for Domestic Operations that pursuit of the monetary objectives
and related reserve paths during the period before the next
meeting is likely to be associated with a federal funds rate
persistently outside a range of [DEL: 10 to 14] ____ TO ____ percent.
Alternative II
The Committee seeks behavior of reserve aggregates over the
balance of the quarter consistent with bringing M1 and M2 over time
into their longer-run target ranges for the year. For the January to
March period growth in M1 and M2 at annual rates of around ____
and ____ percent, respectively, is sought. A slower growth, or
in the case of M1 some decline, would be associated with more
rapid attainment of the longer-run range and would be acceptable
in the context of declining market interest rates. [Same federal
funds rate sentence as in alternative I].

APPENDIX I
MONEY STOCK REVISIONS
Measures of the money stock have been revised to incorporate
annual seasonal adjustment and benchmark changes, as well as minor defini-
tional changes. This appendix briefly describes these changes, to be
considered confidential until published after the Chairman's testimony,
and compares growth rates of the revised series, which are still preliminary,
with the old series.
Revisions to seasonal factors
Seasonal adjustment factors have been updated using data for 1981
and, in accordance with a recommendation of the Committee of Experts on
Seasonal Adjustment Techniques, an X-11-ARIMA method was used to compute
seasonal factors for 1982. For the deposit component of M1, seasonal
factors were calculated using data preadjusted to reduce distortions to
deposit flows accompanying the Special Credit Restraint Program of 1980
and shifts to NOW and ATS accounts; a similar procedure had been used in
1981. Seasonal factors for transactions deposits and demand deposits
were estimated separately, giving implicit factors for other checkable
deposits. Revisions due to seasonal factors were relatively small for
most months; however, in May, August and November of last year seasonal
revisions lowered M1 growth by 2¾, 2 and 4 percentage points at an
annual rate, respectively, while in June and September they raised M1
growth by 3½ to 2½ percentage points, respectively.
Benchmark revisions
Several benchmark revisions were made.
* Commercial bank deposits data were benchmarked to the March,
June and September 1981 call reports. The impact of these
adjustments was relatively small, both on levels and growth
rates.
I-2
* A consolidation adjustment has been made to remove at the M1
level the portion of thrift institutions' holdings of vault
cash that is estimated to be used for servicing their other
checkable deposit (OCD) liabilities; this lowers the currency
component of the money stock that previously included all
vault cash at thrift institutions. The remainder of thrift
institution vault cash has been removed at the M2 level.
This consolidation adjustment lowers M1 by less than
$.2 billion and M2 by $2.1 billion in December 1981; this
adjustment affects growth rates minimally.
* Cash items in the process of collection (CIPC) of thrift
institutions has been netted against transactions deposits
at the M1 level, lowering the level of the aggregates by
about $1.1 billion in December 1981 and affecting growth
rates negligibly. Owing to lack of data availability,
CIPC of thrift institutions previously had not been deducted
from measures of the money stock.
* Daily deposits data for savings and time deposits at thrift
institutions--reported since November 1980 as a consequence
of the Monetary Control Act of 1980--have been incorporated,
making these components for thrifts comparable to those of
commercial banks in terms of frequency of data and definition.
Incorporation of these new data has raised the level of small
time and savings deposits at thrifts by about $3 billion in
December 1981, although growth of M2 in 1981 was affected
only slightly.

I-3
* Revisions to deposits data of quarterly reporting institutions
and travelers check data have been incorporated. The principal
impact of revisions to quarterly reporters was to raise M1
growth in September and October of 1981 while revisions to
travelers checks reduced narrow money growth a bit in the
fourth quarter of last year.
Compositional changes
In the revised measures, retail RPs at all depository institutions--
issued in denominations of less than $100,000--appear in the small denomina-
tion time deposit component of M2; in the old measures, retail RPs entered
at the M3 level as a component of term RPs. Institution-only money market
mutual funds are removed from the money market mutual fund component of M2
and enter the money stock at the M3 level, along with large-denomination
time deposits and large denomination term RPs. The inclusion of retail
RPs raises the level of M2 by $12.5 billion in December 1981 while the
removal of institution-only money funds lowers M2 by $30.1 billion (after
a consolidation adjustment to the overnight RP component of M2 reflecting
RPs held by such money market funds) in that month. For the QIV '80 to
QIV '81 period, the retail RP adjustment raised the 12 growth rate by
0.7 percent, while the removal of institution-only money market funds
reduced this aggregate's growth rate by 0.9 percent.
Tables I-1, I-2 and I-3 compare growth rates of revised and old
M1, shift-adjusted M1, and M2. At this writing, revised M3 data are not
available.

Table I-1
COMPARISON OF REVISED AND OLD M1 GROWTH RATES 1/(percent changes at annual rates)
DifferenceRevised M1 Old M1 (1-2)
(1) (2) (3)
1980--October 14.6 13.1 1.5Noven ber 5.5 8.1 - 2.6DecemBer - 9.2 -10.0 .8
1981--January 9.8 10.4 - .6Februswry 4.6 5.7 - 1.1March 14.3 12.8 1.5April 25.2 21.4 3.8May -11.4 - 5.5 - 5.9June - 2.2 - 7.0 4.8July 2.8 3.6 - .8Augusst 3.9 7.5 - 3.6Septe~amber 1.4 - 2.8 4.2Octatoer 4.7 3.3 1.4Noverrber 9.7 13.6 - 3.9Decerimber 11.5 11.0 .5
1982--Janusry (proj.) 22.3 21.2 1.1
Quarterly
1980--QIV 11.2 10.8 .41981--QI 4.4 4.8 - .4
QI1 9.3 8.6 .7QIIT .2 .4 - .2QIV 5.8 5.6 .2
Annual
1981--QIVi' 1 over QIV'80 5.0 4.9 .1
1/ M1 is defined to include currency, travelers checks, demand deposits andother checkable deposits.

Table I-2
1/COMPARISON OF REVISED AND OLD SHIFT-ADJUSTED M1 GROWTH RATES-(percent changes at annual rates)
Revised OldShift-adjusted Shift-adjusted Difference
M1 Ml (1-2)(1) (2) (3)
1981--January -0.3 -.2 -.1February -2.6 -1.4 -1.2March 9.9 8.1 1.8April 19.6 16.4 3.2May -9.9 -4.3 -5.6June -3.7 -8.5 4.8July 2.0 2.9 -.9August 3.4 6.6 -3.2September 0 -3.7 3.7October 4.8 3.1 1.7November 7.7 11.4 -3.7December 9.9 9.6 .3
Quarterly
1981--QI -1.1 -.9 -.2QII 5.8 5.2 .6QIII -0.5 -.4 -.1QIV 4.9 4.6 .3
Annual
1981--QIV '81over QIV '80 2.3 2.1 .2
1/ Shift-adjusted Ml is defined to include currency, travelers checks,demand deposits, and other checkable deposits excluding estimated inflows
to other checkable deposits in 1981 from sources other than demand deposits.

Table I-3
COMPARISON OF REVISED AND OLD M2 GROWTH RATES(percent changes at annual rates)
DifferenceRevised M2 Old M2 (1-2)
(1) -27 (3)
1980--October 8.2 6.6 1.6November 10.1 10.5 - .4December 0 .6 - .6
1981--January 9.7 8.2 1.5February 11.3 10.6 .7March 16.5 16.1 .4April 15.4 13.5 1.9May 1.4 3.8 -2.4June 5.9 4.2 1.7July 6.4 7.4 -1.0August 11.6 11.7 - .1September 7.7 6.5 1.2October 7.6 8.1 - .5November 13.6 17.2 -3.6December 8.0 10.9 -2.9
1982--January (proj.) 11.1 11.5 - .4
Quarterly
1980--QIV 6.8 8.1 -1.31981--QI 8.7 8.3 .4
QII 11.1 10.6 .5QIII 7.1 7.2 .1QIV 9.5 10.6 -1.1
Annual
1981--QIV'81 over QIV'80 9.4 9.5 - .1

Appendix II
RESERVE TARGETS AND RELATED MEASURESINTERMEETING PERIOD
(millions of dollars; not seasonally adjusted)
Date ReservesPath Constructed
December
January
1/
Reserve Targetsfor Intermeeting
Period(6-week avg. basis)
TotalReserves
4 - I.
(1)
42,684
42,573242,536442,534542,4597
42,3238
Nonborrowed'Reserves
42,384
42,1842,34 2 , 14 741,9585,641,883 7
41,747 -
Projection ofReserves Demanded
(6-week Average Basis)
TotalReserves
(3)
42,684
42,77942,86043,02042,97642,964
Required ExcessReserves Reserve
(4)
42,459
42,44342,52242,65942,611
42,611
4- 4--
(5)
225
336338354366
353
Implied Adjust-ment Borrowing
On a6-weekAverageBasis
300
595713
1,0621,093
1,217
Represents borrowing in remaining statement weeks (as intermeeting period
For Remain-ing State-ment Weeksof Inter-meetingPeriod
(7)
300
465577
1,2001,513
1,500
progresses)implied by each weekly updating of the 6-week average nonborrowed reserves path. The movement in implied borrowing represents deviations in total reserves from target as well asany compensation for misses in nonborrowed reserves from target in earlier weeks of theintermeeting period.2/ Total and nonborrowed reserves paths adjusted downward by $111 million due to changeaffecting the reserves multiplier.3/ Nonborrowed reserves path adjusted downward an additional $89 million to offset theunusually large borrowing in the January 6 holiday week.4/ Total and nonborrowed reserves paths adjusted downward by $37 million due to changesaffecting the reserves multiplier.5/ Total and nonborrowed reserves paths adjusted downward by $2 million due to changesaffecting the reserves multiplier.6/ Nonborrowed reserves multiplier adjusted downward by an additional $187 million due tostrength in total reserves.7/ Total and nonborrowed reserves paths adjusted downward by $75 million due to changesaffecting the reserves multiplier.
8/ Total and nonborrowed reserves paths adjusted downward by $108 million due to changesaffecting the reserves multiplier.9/ Total and nonborrowed reserves paths adjusted downward by $28 million to smooththe transition to the forthcoming reserve period.
NOTE: The intermeeting period consisted of the 6 weeks from the statement week endedDecember 30 to the statement week ended February 3.
-
I n ,,
.
'' "

APPENDIX III
INTEREST RATES CONSISTENT WITH THE GREENBOOK GNP PROJECTIONBased on 4 percent growth of M1 in 1982 and
3-1/2 percent growth in 1983(Quarterly averages, in percent)
FederalFunds
13-1/2131414-1/2
141313-1/214
3-MonthTreasury Bills
12-3/811-3/412-1/213
12-1/211-1/21212-1/2
AaaCorporate
Bonds Me
]]]11
]11
15-3/415-1/415-3/416
15-3/4151515-1/4
1/
Fixed-Rate
ortgages
L7-3/8L6-3/4L77-1/4
17L6-1/216-1/416-1/2
1/ For the current quarter, the monetary assumption was roughly in line
with short-run alternative B in this Bluebook.
1982--QIQ2Q3Q4
1983--Q1Q2Q3Q4