Embed Size (px)
Citation preview

Prefatory Note
The attached document represents the most complete and accurate version available based on original copies culled from the files of the FOMC Secretariat at the Board of Governors of the Federal Reserve System. This electronic document was created through a comprehensive digitization process which included identifying the best-preserved paper copies, scanning those copies,1 and then making the scanned versions text-searchable.2 Though a stringent quality assurance process was employed, some imperfections may remain.
Please note that this document may contain occasional gaps in the text. These gaps are the result of a redaction process that removed information obtained on a confidential basis. All redacted passages are exempt from disclosure under applicable provisions of the Freedom of Information Act.
1 In some cases, original copies needed to be photocopied before being scanned into electronic format. All scanned images were deskewed (to remove the effects of printer- and scanner-introduced tilting) and lightly cleaned (to remove dark spots caused by staple holes, hole punches, and other blemishes caused after initial printing). 2 A two-step process was used. An advanced optimal character recognition computer program (OCR) first created electronic text from the document image. Where the OCR results were inconclusive, staff checked and corrected the text as necessary. Please note that the numbers and text in charts and tables were not reliably recognized by the OCR process and were not checked or corrected by staff.

May 16, 1980Strictly Confidential (FR) Class I FOMC
MONETARY AGGREGATES ANDMONEY MARKET CONDITIONS
Prepared for the Federal Open Market Committee
By the staff Board of Governors of the Federal Reserve System

STRICTLY CONFIDENTIAL (FR)CLASS I - FOMC May 16, 1980
MONETARY AGGREGATES ANDMONEY MARKET CONDITIONS
Recent developments
(1) The record decline in demand deposits in April led to a
contraction in all of the targeted monetary aggregates last month. M-LA
and M-1B showed particularly sharp rates of decrease, even after allowing
for a probable 5 to 8 percentage point impact from larger-than-seasonal
reductions in private demand balances in connection with the Treasury's
quicker processing of nonwithheld tax payments. The underlying
weakness in money supply over the past several weeks most likely reflects
not only the lagged effect of previous high interest rates, but also
net repayment of bank debt at a time of sizable reduction in economic
activity. The non-transactions component of M-2 also was weaker in April,
largely as a result of marked slowing of the growth of MMMF shares that
followed the Board's March 14 actions and of reductions in overnight RP
and Eurodollar deposits. Total managed liabilities at banks declined as
bank credit contracted. Owing mainly to the April developments, the growth
in the monetary aggregates over the first four months of 1980 has been
Target ActualMonetary Aggregates Dec. to June Dec. to April April
M-1A 4½ -1.5 -18.5
M-1B 5 0.0 -14.4
M-2 7¾ 4.6 -2.8
M-3 - 6.0 -0.3
Memo:
Bank Credit 7.3 -5.1
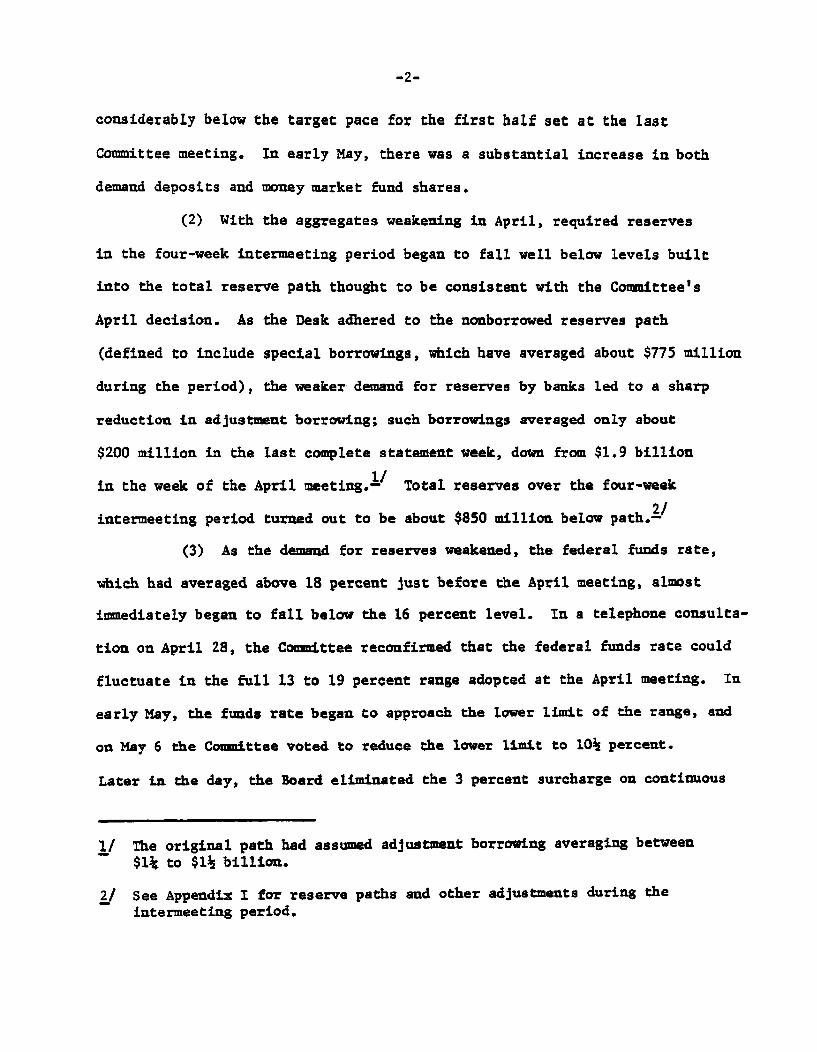
considerably below the target pace for the first half set at the last
Committee meeting. In early May, there was a substantial increase in both
demand deposits and money market fund shares.
(2) With the aggregates weakening in April, required reserves
in the four-week intermeeting period began to fall well below levels built
into the total reserve path thought to be consistent with the Committee's
April decision. As the Desk adhered to the nonborrowed reserves path
(defined to include special borrowings, which have averaged about $775 million
during the period), the weaker demand for reserves by banks led to a sharp
reduction in adjustment borrowing; such borrowings averaged only about
$200 million in the last complete statement week, down from $1.9 billion
in the week of the April meeting.1/ Total reserves over the four-week
intermeeting period turned out to be about $850 million below path.2/
(3) As the demand for reserves weakened, the federal funds rate,
which had averaged above 18 percent just before the April meeting, almost
immediately began to fall below the 16 percent level. In a telephone consulta-
tion on April 28, the Committee reconfirmed that the federal funds rate could
fluctuate in the full 13 to 19 percent range adopted at the April meeting. In
early May, the funds rate began to approach the lower limit of the range, and
on May 6 the Committee voted to reduce the lower limit to 10½ percent.
Later in the day, the Board eliminated the 3 percent surcharge on continuous
1/ The original path had assumed adjustment borrowing averaging between
$1¼ to $1½ billion.
2/ See Appendix I for reserve paths and other adjustments during theintermeeting period.

borrowing. In the most recent complete statement week, the federal funds
rate averaged 10-7/8 percent, and, as noted above, adjustment borrowing
fell to minimal levels.
(4) The broad rally in debt markets gained momentum during the
intermeeting period, as market participants reacted to evidence that a
recession had begun, to the sustained money stock weakness, and to the
decline in the federal funds rate. Treasury bill rates and private short-
term rates have fallen substantially further; the 3-month bill rate is
currently around 9 percent and the 3-month CD rate around 10 percent.
Most short-term rates are now about 5 to 8 percentage points below their
recent highs. The prime lending rate at banks, however, has declined only
about 3½ percentage points from its 20 percent peak, as banks attempt to
maintain profit margins.
(5) Capital markets have also rallied further since the last FOMC
meeting, with bond yields declining ½ to 1½ percentage points. In response
to the lower levels of bond yields--down 2½ to 3 percentage points since
their March highs--corporate and municipal bond offerings increased
markedly in April and early May, far eclipsing the first quarter pace. The
Treasury conducted its quarterly financing auction in early May, and in the
ebullient market atmosphere the $7.5 billion offering of two notes and a
long bond was well bid; the new issues did, however, soon drop below their
auction prices. The average rate on new mortgage commitments at S&Ls declined
to 14.68 percent in early May from the record high of 16.35 percent, and
recent press reports indicate much larger cuts in mortgage rates at some
S&Ls as these lenders anticipate larger deposit inflows at the lower short-
term market rates of interest.

(6) Since the last FOMC meeting, the dollar has declined by
about 3 1/2 percent on a weighted-average basis, reflecting the relative
decline in U.S. short-term interest rates. Toward the end of the period
the dollar stabilized as some market participants began looking for some
back-up in U.S. interest rates and as news of the April Producer Price
Index provided some indication of a slowing of U.S. inflation.
(7) The table on the next page shows seasonally adjusted annual
rates of change, in percent, for selected monetary and financial flows over
various time periods.

PastMonth
QI '80 Apr. '80 Apr. '80/ , over over over
1977-1 19781/ 1979- QIV '79 Jan. '79 Mar. '80
Nonborrowed reserves 3.5 5.6 2.7 4.3 -9.8 13.8
Total reserves 4.9 6.3 4.1 5.1 1.7 2.7
Monetary base 8.3 9.0 7.6 7.9 5.0 1.9
Concepts of Money
M-1A (Currency plus demanddeposits) 2/ 7.7 7.1 5.7 5.5 -3.2 -18.5
M-lB (M-1A plus other check-able deposits) 8.1 8.2 7.7 6.0 -1.3 -14.4
M-2 (M-1B plus small time andsavings deposits, moneymarket mutual fund shares andovernight RP's and Euro-dollars) 10.9 8.2 8.8 7.4 3.8 -2.8
M-3 (M-2 plus large time depositsand term RP's) 12.4 11.1 9.3 8.4 5.3 -0.3
Bank Credit
Loans and investment ofall commercial banks 3/ 10.9 13.6 11.5 9.4 5.4 -5.1
Managed Liabilities of Banks(Monthly average changein billions)
Large time deposits 2.0 4.3 1.4 2.0 4.5 5.0Eurodollars /0.6 0.6 1.9 -0.8 -0.1 -4.6Other borrowings- 1.0 1.3 1.1 2.3 0.0 -5.9
Memo
Nonbank commercial paper 0.2 0.3 0.9 1.5 1.6 1.1
1/ December to December.2/ Other than interbank and U.S. Government3/ Includes loans sold to affiliates and branches.4/ Primarily federal funds purchases and securities sold under agreements to repurchase.
NOTE: All items are based on averages of daily figures, except for data on total loans andinvestments of commercial banks, commercial paper, and thrift institutions--which are derivedfrom either end-of-month or Wednesday statement date figures. Growth rates for reservemeasures in this and subsequent tables are adjusted to remove the effect of discontinuitiesfrom breaks in the series when reserve requirements are changed.

-6-
Prospective developments and short-term targets
(8) The recent shortfall in money growth appears to make it
impractical to achieve the Committee's December to June targets for the M's
adopted at the last meeting. To reach these targets, M-1A would have to
expand at a 16¾ percent annual rate over the two months of May and June,
M-1B at 15 percent rate, and M-2 at an 11 percent rate. Attempts to
encourage such a large rebound over a short period would probably entail a
drop in the funds rate in the near term to levels as low as in the 1 to
5 percent range. It would also very probably entail a sharp subsequent
reversal of those rates to keep money growth in later months within the
Committee's longer-run ranges.
(9) The staff expects some rebound of money growth to occur
in any event in May and June--for example, a growth of 7 percent on average
in M-1A at around current interest rate levels and growth of about 7¾
percent in M-2. The recent contraction in transactions balances implies
a need by the public to rebuild their cash holdings to sustain growth
in nominal economic activity in the second quarter at the projected 4½
percent annual rate. Moreover, the lagged impacts of the recent sharp
drop in interest rates should serve to increase the quantity of money
demanded in the months ahead. Our projected expansion of M-1A in May-June
would generate a 1¼ percent annual rate of growth over the 6 months from
December to June, and a one percent rate of growth from the QIV '79 average
level to the QII '80 average. Associated growth in M-2 over the December
to June period would be about 5¾ percent, 1/ somewhat closer to the
Committee's target than in the case of M-1.
1/ And 5 percent from QIV '79 to QII '80.

-7-
(10) Against this background, the Committee, in framing its
approach to operations between now and the next meeting, may wish to
consider policies that recognize the high probability of a shortfall in
growth of the aggregates over the first half of the year and that aim to
get the aggregates back on path over a longer period. Two such alternatives
are presented below, and depicted in the charts on the following pages.
Alternative A is designed to achieve a level of M-1A in December equal
to that implied by the midpoint growth path of the 3½ to 6 percent range
for this aggregate over the QIV '79 to QIV '80 period. Alternative B
is designed to return M-1A to the midpoint path by September. Growth in
M-2 would follow similar patterns. (More detailed specifications, with
implied rates of growth over various time periods, are shown in the
tables on pages 8 and 9.)
Alt. A Alt. BBack to Path Back to Path
by Dec. by Sept.
Growth rates from April to Sept.
M-1A 7.6 9.5
M-1B 8.0 9.8
M-2 8.0 9.8
Growth targets for May-June
M-1A 7.0 8.4
M-1B 7.6 9.1
M-2 7.8 8.7
Intermeeting federal fundsrate range, percent 10 to 14 9 to 14

Chart 1
Actual and Targeted M-1A and M-1BCONFIDENTIAL (FR)
Class II - FOMC
M-1A
- Longer-Run Range- *.**Short-Run Alternatves
I - May Projection
BOions of dolars"-400
-- 396
S386
380
-- 370
I I I I I I I I I I I I I I
0 N1979
D J F M A M J J1980
A S 0 N 0
Bmons ofM-1B
- Longer-un Range-.- Short-Run Alaatives
- May Projection'
M A M J J1980
S I I I I I I I I

Chart 2 CONFIDENTIAL (FR)Class II - FOMC
Actual and Targeted M-2 and M-3
M-2 Billions of dollarsI- "--11680
1980
Billions of dollars
0 N-1979

Alternative Levels and Growth Rates for Key Monetary Aggregates
M-1A M-1B
Alt. A Alt. B Alt. A Alt. B
1980--April 369.6 369.6 387.7 387.7May 370,8 371.0 388.5 388.7June 373,9 374.8 392.6 393.6
Growth Rates
Monthly
1980--May 3.9 4.5 2.5 3.1June 10.0 12.3 12.7 15.1
Dec. '79 - June '80 1.3 1.8 2.5 3.0
quarterly Average
1980--QI 5k 5k 6 6QII -3% -3k -1% -1kQIII 8 10 8% 10%QIV 7t 64 7% 6k
1979 QIV to.1980 QII 0.9 1.1 2.1 2.31979 QIV to 1980 QIV 4% 4% 5k 54

Alternative Levels and Growth Rates for Key Monetary Aggregates (cont'd)
M-2 M-3
Alt. A Alt. B Alt. A Alt. B
1980--April 1547.5 1547.5 1808.8 1808.8May 1555.9 1556.4 1820.8 1821.4June 1567.7 1569.9 1836.2 1838.3
Growth Rates
Monthly
1980--May 6.5 6.9 8.0 8.4June 9.1 10.4 10.1 11.1
Dec. '79-June '80 5.7 6.0 7.1 7.3
Quarterly Average
1980--QI 7k 74 8 84QII 34 3% 5 5kQIII 8k 10 8k 9%QIV 84 6% 8t 74
1979 QIV to 1980 QII 5.5 5.6 6.7 6.81979 QIV to 1980 QIV 7 7 71 7%
NOTE: The following annual rates of growth in bank credit for the year and for the quartersare expected under alternative B: year 1980, 7k; QI, 9k; QII, 5; QIII, 64; QIV, 6k.Only minor variations in growth rates would be expected under the other alternatives.For the December to June period, bank credit growth under alternative B would be 81percent.

-10-
(11) Alternative A calls for growth in M-1A at about a 7½
percent annual rate between April and September, and continuation of that
growth rate over the remainder of the year. For purposes of monetary
targeting between now and the July 9 FOMC meeting, however, the Committee
may wish to target a somewhat slower money growth of 7 percent for the
two months of May and June, given the relatively moderate growth that is
apparently in train for May. As noted in paragraph 9, such a growth rate
is not likely to involve any appreciable change in the funds rate from its
recent trading range of 10½ to 11½ percent. The federal funds rate range
suggested for alternative A is 10 to 14 percent. The suggested lower
limit is a bit lower than that currently in place to provide for some
operational flexibility. The proposed upper limit has been lowered to 14
percent on the thought that the Committee might wish to limit fluctuations
on the upside, given the recent shortfall in money growth and the apparent
weakness in the economy.
(12) Looking beyond the current quarter, some upward pressure
on interest rates might develop. The recent weakness in M-1A has left it
well short of what might have been expected on the basis of historical
relationships among money, income, and interest rates. Thus, although
nominal GNP is projected to rise at only a 5½ percent annual rate in the
second half of the year, our econometric models would suggest that, at
current interest rates, money would tend to grow much more rapidly than
that, and probably somewhat in excess of the 7½ percent alternative A path,
as the public attempts to restore recently depleted cash balances. This
would generate upward rate pressures at a time when income velocity of M-1A

-11-
would be declining, a reversal of the normal situation.1/ If, however,
the recent evident weakness in M-1A should prove largely to represent a
lasting shift in the public's liquidity preferences, then upward rate
pressures might be minimal, or indeed there could be some further downward
drift in rates.
(13) The specifications for alternative A call for a considerable
pick-up in growth of M-2 for the May-June period, to about a 7¾ percent
annual rate. The implied rate of growth for the nontransactions component
of this aggregate period--at around an 8 percent rate--is considerably
higher than has occurred recently. A return to MMMF growth after the decline
associated with the March 14 actions appears already to have begun, and with
market rates far below their recent peaks, growth of small time and savings
deposits, especially the 2½ year variable ceiling certificates, is expected
to pick up.
(14) With the federal funds rate essentially unchanged in the
near term, as contemplated under alternative A, other market interest rates
probably would hold near current levels or edge upward a bit, especially
if and as monetary growth strengthened perceptibly. A limited back-up in
market rates, however, is unlikely to halt the downtrend of bank loan and
mortgage rates, rates that are still high relative to competitive instruments.
Business credit demands in the period ahead may still fall relatively heavily
on the corporate bond markets, as firms continue efforts to restructure
their balance sheets at what appear to be relatively attractive long-term
yields. But even so loan growth at banks could pick up, particularly if
recent loan weakness makes banks a bit more sanguine about their ability
to remain within loan restraint guidelines.
1/ Of course, at this point it seems likely that the opposite, and alsounusual, pattern will prevail in the second quarter--a sharp rise invelocity and a substantial decline of interest rates.

-12-
(15) To achieve the growth in aggregates for the May-June period
specified under alternative A, total reserves would have to expand at about
a 4 percent annual rate from April to June. Nonborrowed reserves would
expand at about a 27 percent annual rate, assuming a frictional level of
adjustment borrowing from Reserve Banks on the order of $100 to $200 million
(and continued special borrowing of about $750 million).
(16) Alternative B contemplates a more rapid growth in the monetary
aggregates than alternative A over the short run--for example, an 8 per-
cent annual rate of growth in M-1A over the May-June period--in the process
of reaching the Committee's longer-run path by September (rather than by
December as in alternative A). Such an approach involves a greater likeli-
hood that interest rates, particularly short-term rates, will decline further
over the weeks ahead. The proposed federal funds rate range for this
alternative is 9 to 14 percent.
(17) A decline of the funds rate into the 9 to 10 percent range
would probably lead to a 3-month bill rate in the 7½ to 8 percent range.
Bond yields could drop further, although such a decline would be limited
if growth in the monetary aggregates began to pick up substantially. Inflows
to thrift institutions would probably strengthen as they benefit from full
ceiling rate differentials on both the 6-month money market certificate and
the higher-yielding 2 year certificate. This would tend to make thrifts
more eager to lend and encourage further declines in rates on new mortgage
loans. In foreign exchange markets, the dollar would probably weaken, as
short rates fell further relative to foreign interest rates.

-13-
(18) To attain the aggregates of alternative B over the May-
June period, total reserves would have to increase at a 5 percent annual
rate. With borrowing at frictional levels, as in alternative A, nonborrowed
reserves would increase at a 28 percent rate. For both alternatives A
and B, it should be pointed out that if growth of money stock deposits
and related required reserves over the weeks immediately ahead runs below
target, attainment of the nonborrowed reserve path in the short-run would
involve adding to banks' excess reserves (since there are practically no
borrowings to be paid off). This would generate downward pressure on
interest rates, of course, and possibly very substantial downward pressures,
particularly on the funds rate, if banks are not very willing to hold excess
reserves at relatively high interest rate levels. Thus, the lower limits
of the funds rate ranges could rather promptly become the operative guides
for open market operations.

-14-
Directive language
(19) Given below are suggested operational paragraphs for the
directive consistent with either of the short-run policy alternatives dis-
cussed earlier. The proposed directive contains only qualitative language
for the objectives for monetary aggregates over the months ahead. The
specific numerical guidelines decided on by the Committee for the aggregates
seem likely to involve relatively rapid growth to compensate to some degree
for the recent large shortfalls. It was felt that such numerical specifica-
tions might be omitted from the directive and included only in the policy
record, where they would be fully explained and less subject to misunder-
standing.
In the short run, the Committee seeks expansion of reserve
aggregates consistent with growth [DEL:over the first half of 1988 at an
annual rate of 4½ percent for M-1A and 5 percent for M-1B, or some
what less] OF M-1A, M-1B, AND M-2 OVER A PERIOD OF MONTHS AT RATES THAT
WOULD PROMOTE ACHIEVEMENT OF THE COMMITTEE'S LONGER-RUN OBJECTIVES FOR
MONETARY GROWTH, provided that in the period before the next regular
meeting the weekly average federal funds rate remains within a
range of [DEL: 13 to 19] ____ TO ____ percent. [DEL: The-Committee-believes
that, to be consistent with this short run policy, M-2 should grow
at an annual rate of about 6¼ percent over the first half and that
bank credit-should grow in the months ahead at a pace compatible
with-growth over the year as a whole withing the range agreed upon.]
If it appears during the period before the next meeting that
the constraint on the federal funds rate is inconsistent with the
objective for the expansion of reserves, the Manager for Domestic
Operations is promptly to notify the Chairman who will then decide
whether the situation calls for supplementary instructions from
the Committee.

Appendix I
Comparison of Actual Level of Reserves to Their Paths(Millions of dollars, not seasonally adjusted)
April 30 toMay 21 1/
(Inclusive)-
Total ReservesOriginal path 45,131,Adjustments +100.-Adjusted path 45,231Actual 44,377Deviation of actual from adjusted path -854
Excess ReservesOriginal path 250Adjustments 0Adjusted path 250Actual 224Deviation of actual from adjusted path -26
Required ReservesOriginal path 44,881Implied adjustments +100Implied required reserves path 44,981Actual 44,153Deviation of actual from implied path -828
Nonborrowed ReservesOriginal path 43,7563/Adjustments -51Adjusted path 43,705Actual 43,705Deviation of actual from adjusted path 0
Member Bank BorrowingsOriginal path 1,375Adjustments +151Adjusted path 1,526Actual 672Deviation of actual from adjusted path -854
1/ Week of May 21 is estimated and assumes the following: excess reserves of$385 million, zero borrowing and nonborrowed reserves of $44,287 million.
2/ Reflects upward adjustment in the total reserves path in view of lowerthan expected growth of nonmember M-1A deposits and higher than expectedgrowth of non-M2 deposits absorbing reserves.
3/ Net adjustment, reflecting the $100 million upward adjustment to the.total reserve path for multiplier changes, a $251 million downward adjust-ment in nonborrowed reserves to reflect stronger than expected demand forborrowing in the first week of the period, and a $100 million upwardadjustment in light of the weakness in actual total reserves.

TABLE 1SELECTED INTEREST RATES
(Percent)
STRICTLY CONFIDENTIAL (FR)CLASS II - FOMCMAY 16, 1980
Short-term Long-term
Treasury Bills CD om Bank U.S. Govt. Constant Corp.-Aaa Huni- Home MortgagesFederal T y eco ndary O e aturity Yields Utility cipal Primar Secondary Market
funds Market IAuction Market 3-mo Rate 3-yr 10-yr 30-yr ew Recently Bond Con NMA NMA3-mo 1-yr I 6-mo 3 3- 3-yr 10-yr 30-yr sue offered Buyer Con. Auc. Sec.
(1) (2) (3) (4) (5) (6) (7) (8) (9) (10) (11) (12) (13) (14) (15) (16)
1979--HighLow
1980--HighLow
1979--Apr.HayJune
JulyAug.Sept.
Oct.Nov.Dec.
1980--Jan.Feb.Mar.
Apr.
1980--HMr. 5121926
Apr. 29162330
Hay 7142128
15.619.93
19.3910.85
10.0110.2410.29
10.4710.9411.43
13.7713.1813.78
13.8214.1317.19
12.60 11.89 12.65 14.53 14.26 15.75 11.68 10.87 10.42 11.50 11.45 7.38 12.90 13.29 11.778.85 8.64 8.87 9.84 9.66 11.50 8.76 8.79 8.82 9.40 9.39 6.08 10.38 10.42 9.51
15.618.52
9.469.619.06
9.249.52
10.26
11.7011.7912.04
12.0012.8615.20
14.398.75
9.289.278.81
15.70 18.04 17.61 20.00 14.29 13.33 12.73 14.22 14.12 9.44 16.35 15.93 14.178.78 9.81 9.41 15.25 9.45 10.15 10.17 11.35 11.42 7.11 12.85 12.70 11.03
9.50 10.069.53 10.169.06 9.95
8.87 9.199.16 9.459.89 10.13
11.2311.2210.92
10.9612.4614.03
11.3411.8611.85
11.8512.7215.10
10.1110.7111.89
13.6613.9013.43
13.3914.3017.57
9.85 11.759.95 11.759.76 11.65
9.8710.4311.63
13.2313.5713.24
13.0413.7816.81
11.5411.9112.90
14.3915.5515.30
15.2515.6318.31
9.43 9.18 9.09 9.70 9.74 6.29 10.509.42 9.25 9.19 9.83 9.84 6.25 10.698.95 8.91 8.92 9.50 9.50 6.13 11.04
8.94 8.95 8.93 9.58 9.53 6.13 11.099.14 9.03 8.98 9.48 9.49 6.20 11.099.69 9.33 9.17 9.93 9.87 6.52 11.30
10.9511.1810.71
10.8812.8414.05
10.3010.6510.39
10.8012.4112.75
9.8510.3010.12
10.6012.1312.34
10.9711.4211.25
11.7313.5714.00
10.9111.3611.33
11.7713.3513.90
7.08 11.647.30 12.837.22 12.90
7.35 12.888.16 13.039.17 15.28
10.5910.8410.77
10.6610.6711.09
12.5212.7512.49
12.9114.4915.64
9.789.899.75
9.779.90
10.31
11.2511.5711.35
11.9413.1613.79
17.61 13.20 11.97 13.62 16.14 15.78 19.77 12.02 11.47 11.40 12 .90p 12.91 8.63 16.33 14.61 12.64
16.1716.4516.2417.78
19.3919.0418.3517.5615.12
14.6215.5114.8015.61
14.8014.5413.8912.7811.17
13.6913.9813.8314.39
14.0113.3912.5011.1810.34
14.7914.9614.9515.70
14.8014.2313.5511.8910.79
15.9717.6018.0417.63
17.9717.8817.1315.5613.59
15.3417.0117.1016.81
17.2217.6116.8815.3313.03
16.8417.6018.4619.00
19.5020.0020.0019.5719.50
14.0314.0713.7814.29
13.8413.1112.3111.3610.87
12.8712.7312.4712.93
12.7312.2311.5910.9610.79
12.3212.3812.1112.48
12.3611.9511.4310.9810.99
13.9813.9513.8514.22
13.9813.2812.8712.4212.10
13.9413.7213.8014.12
13.9313.3012.6912.6412.05
8.949.089.209.44
9.449.077.898.117.96
14.0015.4015.7016.03
16.3516.3516.3516.2515.90
15.26
15.73
15.93
15.18
14.03
13.5813.5713.8414.17
13.7813.4012.9612.2311.98
12.96 9.67 9.32 9.50 11.30 11.07 18.39 9.85 10.15 10.39 11.38 11.55 7.11 14.68 -- 11.0310.85 8.52 8.75 8.78 9.81 9.41 17.50 9.45 10.21 10.35 11.4 3p 11.65p 7.44 n.a. 13.16 11.26
Daily--Hay 8 10.57 8.75 8.8215 11. 20p 8.61 8.73
9.89 9.23 17.50 9.50 10.18 10.34- 9.46 9.07 17.50 9.46p l0.30p 10.4 3p
NOTE: Weekly data for columns 1, 2, 3, and 5 through 10 are statement week averages of daily data. Weekly data in column 4 are average rates set in the auctionsof 6-month bills that will be issued on the Thursday following the end of the statement week. For column 11, the weekly date is the mid-point of the calendar weekover which data are averaged. Columns 12 and 13 are 1-day quotes for Friday and Thursday, respectively, following the end of the statement week. Column 14 is anaverage of contract interest rates on commitments for conventional first mortgages with 80percent loan-to-value ratios made by a sample of insured savings and loanassociations on the Friday following the end of the statement week. Column 15 gives FNMA auction data for Monday preceding the end of the statement week. Column16 is a 1-day quote for Monday preceding the end of the statement week. The FNMA auction yield is the average yield in a bi-weekly auction for short-term forwardcommitments for government underwritten mortgages. GNMA yields are average net yields to investors on mortgage-backed securities for immediate delivery, assumingprepayment in 12 years on pools of 30-year FRA/VA mortgages carrying the coupon rate 50 basis points below the current FHA/VA ceiling.

TABLE 2NET CHANGES IN SYSTEM HOLDINGS OF SECURITIES-1(Millions of dollars, not seasonally adjusted)
STRICTLY CONFIDENTIAL (FR)CLASS II - FOMCMAY 16, 1980
Treasury Coupons Federal Agencies Net ChangeTreasury Net purchases 3/ Net Purchases 4/ Outright Net
Change / Within I - 5 5- 10 Over 10 Total ithin 1 - 5 5 - 10 Over 10 Total Holdings 6/- I year I i year Total 5/ -
1975 -468 337 3,284 1,510 1,070 6,202 191 824 460 138 1,613 7,267 1,2721976 863 472 3,025 1,048 642 5,187 105 469 203 114 891 6,227 3,6071977 4,361 517 2,833 758 553 4,660 -- 792 428 213 1,433 10,035 -2,8921978 870 1,184 4,188 1,526 1,063 7,962 -47 45 104 24 127 8,724 -1,7741979 6,243 603 3,456 523 454 5,035 131 317 5 -- 454 10,290 -2,597
1979--Qtr. I -3,750 48 426 134 93 700 -170 -229 -- - -399 -882 / 68011 465 42 640 - - 682 110 258 2 - 371 -1,795' 2,542III 5,363 395 1,289 309 310 2,302 191 288 3 - 482 8,129 -2,019IV 4,164 118 1,101 81 51 1,351 - - - - - 4,839 / -3,801
1980--Qtr. I -2,945 292 355 107 81 836 -- -- - -- - -2,114 362
1979--Nov. 2,297 - -- - - - -- -- -- -- - 2,297 2,078Dec. 2s086 90 398 81 51 620 - -- -- - -- 2,701 -3,380
1980--Jan. -2,512 - -- -- -- -- -- - -- - - -2,512 166Feb. -1,803 - -- -- -- - - - -- -- - -1,803 900Mar. 1,370 292 355 107 81 836 -- - - -- -- 2,201 -705
Apr. 2,321 109 373 62 64 607 217 398 29 24 668 3,594 -1,012
1980--Har. 5 - -- -- -- -- -- - - - -- -- -- 1,14112 194 - - - -- -- -- -- - -- - 190 -3,25819 959 42 255 107 81 486 -- -- - - -- 1,445 -1426 106 250 100 -- - 350 - - -- -- -- 456 5,566
Apr. 2 110 - - -- -- -- -- - - - -- 110 -4,1389 540 -- -- - - -- 217 398 29 24 668 1,208 -1,782
16 645 109 373 62 64 607 - -- -- - -- 1,249 3,20223 1,244 - - -- -- -- - -- - - -- 1,244 1,60130 -108 - -- - - -- - -- -- -- - -108 -927
Hay 7 -- -- -- -- - -- - -- - - -- - -54814 406 155 267 44 155 621 - -- -- - -- 1,027 3,1502 1p -- 138 89 61 28828
LEVEL--Hay 14 49.8 17.7 30.1 12.1 13.3 73.1 2.1 4.8 1.3 0.7 8.9 131.8 -0.5(in billions)1/ Change from end-of-period to end-of-period.2/ Outright transactions in market and with foreign accounts, and redemption (-) in bill auctions.3/ Outright transactions in market and with foreign accounts, and short-term notes acquired in exchange for maturing bills. Excludes redemptions, maturity
shifts, rollovers of maturing coupon issues, and direct Treasury borrowing from the System.4/ Outright transactions in market and with foreign accounts only. Excludes redemptions and maturity shifts.5/ In addition to net purchases of securities, also reflects changes in System holdings of bankers' acceptances, direct Treasury borrowings from the System
and redemptions (-) of agency and Treasury coupon issues.6/ Includes changes in both RPs (+) and matched sale-purchase transactions (-).7/ The Treasury sold $2,600 million of special certificates to the Federal Reserve on March 31, 1979 and redeemed the last of them on April 4, 1979.8/ $640 million of 2-year notes were exchanged for a like amount of cash management bills on April 3, 1979. On April 9, 1979, the bills were exchanged for
new 2-year notes.9/ On October 1, 1979, $668 million of maturing 2- and 4-year notes were exchanged for a like amount of short-term bills, because the note auctions were
delayed. On October 9 and 10, the bills were exchanged for new 2- and 4-year notes, respectively.

TABLE 3SECURITY DEALER POSITIONS AND BANK POSITIONS
(Millions of dollars)
STRICTLY CONFIDENTIAL (FR)CLASS II - FOMC
MAY 16, 1980
U.S. Govt. Security Underwriting Member Bank Reserve PositionsDealer Positions Syndicate Positions Excess** Borrowing at FRB**
Bill Coupon Corporate Municipal es Total SeasonalBills Issues I Bonds I Bonds Reserves Totl Sesonal
1979--HighLow
1980--HighLow
1979--Apr.MayJune
JulyAug.Sept.
Oct.Nov.Dec.
1980--Jan.Feb.Mar.
Apr.
1980--Mar. 5121926
Apr. 29162330
May 7142128
8,091138
*8,8381,972
4,3263,9876,930
3,161996
2,392
2,2894,4275,760
4,3802,9372,964
*7,838
2,6973,7441,9722,510
4,8337,7318,838
*7,440*7,920
*4,742*3,936
902-2,569
*1,937-1,482
-365166
-277
-658-179
-1,608
-1,576-514
-1,901
-944-212-659
*167
-290-983
-1,131-392
38233-99*89
*554
*910*1,937
2830
800
573170
6632142
751734
42337
48
6350315
7500
12525p
0300p
40453
15732
191186277
28029952
152106164
1178759
89
3235
12245
383911216737p
71140p
726-122
6 00p-228p
177141221
211222191
264244398p
350p199p258p
278p
510p139p223p132p
39 8p19 9 p239p423p216p
301p-9p
2,960628
3,439p732p
9181,7651,418
1,1711,0851,340
2,0231,9111,473p
1,2 40p1,654 p2,8 24 p
2,756p
2,508 p3 ,4 3 9p3,001p2,660p
2,262p2,38 6p2,276p2,555p2,664p
1,329p1,021p
15514081p74 p95 p
151p15 7p
114p139p155p177p
155p4 7 p
NOTE: Government security dealer trading positions are on a commitment basis. Trading positions, which exclude Treasury secu-rities financed by repurchase agreements maturing in 16 days or more, are indicators of dealer holdings available for sale overthe near-term. Underwriting syndicate positions consist of issues still in syndicate, excluding trading positions. Weekly dataare daily averages for statement weeks, except for corporate and municipal issues in syndicate which are Friday figures.
* Strictly confidential.** Monthly averages for excess reserves and borrowings are weighted averages of statement week figures.