Embed Size (px)
Citation preview

1
Flutter Entertainment PlcInterim Results 2021 & US Deep Dive10 August 2021

2
IntroductionPeter Jackson, Group CEO

3
Agenda
• H1 Summary• Financial Review• Group ex-US Business Update
− UK and Ireland− International− Australia
• US Deep Dive• Conclusion

4
H1 Summary
• Excellent operational performance, exceeding our expectations − Diversification benefits clearly evident
• Strong customer momentum with material increase in global customer base− UK & Ireland: strong customer growth with good integration progress− International: revenue decline less than expected with investment
programme putting business on more sustainable footing − Australia: sustained change in scale and profitability − FanDuel: US leadership position extended

5
Scale and quality of Flutter Group enhanced…Significantly expanded global player base Increasingly diversified and sustainable revenue streams
46%
16%
8%
30%
H1 2019
39%
19%
21%
21%
H1 2021
UK&IAustraliaUSROW
82%Regulated
90%RegulatedGroupUS Australia UK&I International
H1 2019 H1 2021
3.3x
1.2x1.3x1.6x
1.4x
7.6m AMPs1
1 Average Monthly Players represent the total number of players that have placed a sports bet/wager, staked a casino bet and/or contributed to rake or tournament fees during a month within the reporting period. The totals include only those players that have deposited real money funds with a Flutter brand on at least one occasion. The AMP numbers do not include Junglee players
in 2020 or 2021 to allow for better comparability of underlying player growth for International and Group.

6
Leading on safer gambling through market specific initiatives
Optimising our framework on a market by market basis… …Leading to more sustainable customer base
H1 YoY growth
• Customer growth > revenue growth
• Revenue per average monthly player lower across both sports and gaming with increased recreational play
• Increased SG tool usage
• Continued investment in people, resources and technology
• Improving number and quality of SG interactions
• Developing our Affordability framework in UK; further changes in H2
• Investing in SG tools awareness, e.g. ‘Take a sec before you bet’ Sportsbet campaign launched last month
• Major partnerships to promote safer gambling, e.g. FanDuel and American Gaming Association / Gamban
• Leading the market ahead of regulation, e.g. Irish credit card deposit ban, whistle-to-whistle ban and RET funding
+40%
+30%
AMPs Revenue

7
Financial ReviewJonathan Hill, Group CFO

8
Key financial highlights
• Strong revenue performance from diversified portfolio
• Group ex-US:– Sports uplift in UK & Ireland and Australia
with excellent operational gearing – Offset by lower poker revenue and
investment in customer growth in International
• Significant investment in US
• EPS reduction reflects increased share count and US loss
• Turning profits into cash
• Leverage of 2.3x
Pro forma1 H1 2021
H1 2020
YOY CC
Revenue
Sports revenue £1,894m £1,199m +57%
Gaming revenue £1,159m £1,190m +1%
Total revenue £3,053m £2,389m +30%
Profitability
Adjusted EBITDA Group £597m £684m -12%
Adjusted EBITDA Group ex-US £684m £703m -2%
Adjusted operating profit £472m £567m -16%
Adjusted EPS 171.1p 286.3p -40%
Free cash flow £333m £500m
Financial position
Cash conversion2 95% 114%
Net debt £2,682m £2,899m
Net debt / LTM EBITDA 2.3x 2.3x
1 Includes TSG as though part of the Flutter Group throughout 2020 and 2021 (date of acquisition May 5, 2020). Junglee, which was acquired in January 2021, has not been included on a pro forma basis. See Appendix 3 of the Interim financial statements for a reconciliation of pro forma results to statutory results.
2 Reflects conversion of Operating Profit to pre-tax Adjusted free cash flow.

9
Statutory Group P&L
£m Reported H1 2021 H1 2020 YOY
Revenue 3,053 1,522 +101%
Adjusted gross profit 1,944 1,026 +89%
Adjusted EBITDA 597 342 +75%
Depreciation & amortisation (125) (89) +41%
Adjusted operating profit 472 253 +87%
Adjusted net interest expense (74) (35) +115%
Separately disclosed items (SDIs) (321) (194) +65%
Profit before tax 77 24 +221%
Tax (163) (15)
(Loss)/profit after tax (86) 9
Non-controlling interest (3) 10
(Loss)/profit attributable to equity holders (89) 19
Adjusted basic EPS 171.1p 187.5p -9%
• Six month contribution from TSG in 2021 with < 2 months in 20201
– Primary driver of all increases
• SDIs2 consisted of: – Non-cash items primarily amortisation of
acquired intangibles (£276m)– Cash items: transaction fees, restructuring and
integration costs
• Tax includes deferred tax charge of £105m due to announced UK tax rate increase to 25%
– Adjusted H1 2021 effective tax rate 23% (Group ex-US: 18%)
• Adjusted EPS 9% lower reflecting the increased tax charge in current period and higher share count in H1 2021
1 Acquisition completed on 5 May 2020.2 Separately Disclosed Items: see slide 51 for further details.

10
Customer momentum continued into H1…
• Q4 momentum carried into 2021; great execution and marquee events drove recreational play
• Group AMPs +40% YoY
• Cheltenham, Grand National and Euros in UK & Ireland in Q1 and Q2
• Excellent retention of Sportsbet customers from Spring Carnival period in Q4 into H1
• Lockdowns benefited Q1 International AMPs vs challenging gaming comparatives
• SuperBowl in US exceeded expectations in Q1
Pro forma AMPs Q1’20 – Q2’21(millions)
0
0.5
1
1.5
2
2.5
3
3.5
UK & Ireland Australia International US
H1+44%
+52%
(3%)
+166%

11
0.0
0.1
0.2
0.3
0.4
0.5
0.6
0.7
UK & Ireland Australia International US
…Driving excellent revenue performance…
• Group revenue +30% YoY
• Net revenue margins 160 bps lower YoY driven by:
– Increased investment in generosity– H1 sports results beneficial but less
so than in H1 2020
• UK & Ireland online revenue +37% with retail shut for most of H1
• Excellent execution in Australia delivering 27% growth
• International reflects tough Q2 2020 comparatives and impact of German regulatory headwinds
• US +159% fuelled by more states and SuperBowl acquisition in H1
Pro forma revenue Q1’20 – Q2’21(CC, £bn)
H1 +30%
+27%(11%) +159%

12
…with benefits of diversified product portfolio evident
• Prior year revenue mix different due to Covid lockdowns and disruption to sporting calendar
• Sports uplift offsetting gaming reductions
• Group revenue +30% in H1 (sports +57%, gaming +1%)
• Q2 impacts more pronounced with particularly challenging comparatives for gaming in UK & Ireland and International
• US expansion also boosted revenue growth
Pro forma revenue (CC, £bn)
+22%+27%
-7%
+75%+66%
-14%
0.0
0.2
0.4
0.6
0.8
1.0
1.2
1.4
1.6
1Q20 2Q20 3Q20 4Q20 1Q21 2Q21Sports revenue Gaming revenue Group YoY % Sports YoY % Gaming YoY %
Total revenue +30% in H1

13
Group ex-US diversification supporting investment
• Growth in UK&I and Australia offset anticipated International reduction
• Excellent operating leverage in UK & Ireland online; lockdown continued to impact retail
• Australian performance reflects strong execution and delivery of merger synergies
• YoY International performance driven by “one-off” nature of poker spike in H1 2020
• Total synergies £52m, timing slightly ahead of schedule
H1 2021 reduction 2%
EBITDA £m, constant currency

14
International EBITDA reflects various significant factors
EBITDA £m, constant currency • EBITDA 52% lower in constant currency terms (£196m)
• Influx of new and re-engaged customers in Q2 2020
• Regulatory impact of -£58m includes Germany and post merger alignment of compliance practices
• Growth driven by investment in – Sales and marketing (£70m)– Other operating costs (£18m)
• YoY growth of £105m reflects c. £38m lockdown benefit
£196
+£67
+£38(Covid)
(£88)£162

15
Group ex-US EBITDA margin 28% after investment
• Group ex-US EBITDA margin of 28%
• Excellent operating leverage in UK&I online and Australia
• This helped offset: – Retail closures in UK&I for majority of H1– Significant investment in International– Regulatory changes which accounted for
approx. half the EBITDA margin decline in International
• US loss increased to £87m reflecting online operations in 6 new states vs H1 2020 and continued customer acquisition in existing states
• Significant Group-wide investment – Incremental c. £300m in marketing to
£728m in H1
Adjusted EBITDA (£m)H1 H1 YoY
Pro forma 2021 2020 CCUK & Ireland Online 398 260 +52%UK & Ireland Retail (39) (10) +340%
UK & Ireland 359 251 +42%Australia 201 121 +56%International 179 397 -52%Corporate costs (55) (66) -10%Group ex-US 684 703 -2%
US (87) (19) +376%Group 597 684 -12%
Adjusted EBITDA %Group ex-US 28% 33% -5ppsGroup 20% 29% -9pps

16
Cash flow• Adjusted free cash flow pre-tax of £450m compares to
Adjusted operating profit of £472m, converting at 95%
• Adjusted free cash flow lower due to US investment losses and lower working capital benefit
• Working capital favorably impacted by scale of Group. Lower year-on-year due to lockdown outperformance in H1 2020 combined with deferral of certain payments
• Corporation tax payments higher due to profit mix
• Interest £31m lower following debt repayment and lower financing costs
• £89m share purchase to part settle FanDuel incentive schemes
• Exceptional items during H1:– £71m payment of Kentucky bond (included in SDIs) – Acquisition of Junglee Games for £51m
Pro forma £m H1 2021 H1 2020
Adjusted EBITDA 597 684Capex (138) (118)Working capital 18 105Corporation tax (92) (63)Lease liabilities paid (27) (24)Adjusted free cash flow 358 584Cash flow from separately disclosed items (24) (84)Free cash flow 333 500Interest cost (70) (101)Other borrowing costs (5) (22)Settlement of swaps - (28)Settlement of Kentucky Supersedeas Bonds (71) -Purchase of shares by the Employee Benefit Trust (89) -Acquisitions (51) -Other (4) 5Net increase in cash before equity raises/acquisitions 43 356Proceeds from equity raise - 806Cash acquired in business combination 18 -Net increase in cash 61 1,162Net debt at start of year1 (2,814) (3,827)Foreign currency exchange translation 26 (253)Change in fair value of hedging derivatives 45 19Net debt at 30 June (2,682) (2,899)
1 Net debt defined as principal amount of borrowings plus associated accrued interest, minus cash & cash equivalents plus/minus carrying value of debt related derivatives.

17
H2 2021 refinancing strengthens debt position
£’m, leverage ratio 30 June 2021 Refinancing Pro forma for refinancing
Gross debt 3,316 289 3,604Cash (excl. customer balances) 634 250 884Net debt 2,682 39 2,721LTM pro forma Adjusted EBITDA 1,145 1,145
Leverage ratio 2.34x 2.38x
Borrowing2 Principal Interest rate Maturity Debt structure at 30 June
TLA (GBP) £950m GBP LIBOR +175bps 2025TLB (USD) $1,438m USD LIBOR +350bps, 0% Floor 2025TLB (EUR) €507m EURIBOR +375bps, 0% Floor 2025Senior Notes3 $1,000m Coupon 7% 2026
Debt structure pro forma for refinancingTLA (GBP) £950m GBP LIBOR +175bps 2025TLB (USD) $2,938m USD LIBOR +225bps, 0% Floor 2026TLB (EUR) €507m EURIBOR +250bps, 0% Floor 2026Senior Notes3 Nil - -
1 Total balance of £450m; £15m sub-limit assigned to guarantee facility; available balance of £435m.2 USD Notes are swapped into EUR and the USD TLB is swapped into GBP and EUR.
3 Due July 2026. Repaid shortly after first call date on 21 July 2021 at a price equal to 103.5% of the principal amount of the notes.4 Moody’s / S&P / Fitch - all ratings at Stable outlook after Fitch outlook improvement.
• Leverage 2.3x at 30 June 2021
• Significant liquidity; cash available of £634m and undrawn RCF of £435m1
• Material covenant headroom; earliest debt maturity 2025
• July refinancing upsized USD TLB by $1.5bn to repay most expensive debt, USD and EUR TLB repriced to attractive levels
• Weighted average cost of debt reduced from 4.2% to 2.5% with annualised interest savings of c.£50m
• Additional cash liquidity added of c.£250m
• Credit ratings reaffirmed at Ba1/BB+/BBB-4
stable outlook

18
2021 Outlook
Current trading • Positive start to H2, albeit a traditionally quiet part of the year
Ex-US guidance• Group ex-US EBITDA expected to be between £1,270m and £1,370m assuming:
– Normalised net revenue margins for remainder of year; no material disruption to sporting calendars– No further retail closures
US guidance
• US net revenue expected to be between £1,285m - £1,425m ($1.8bn and $2.0bn) with a US EBITDA loss of £225m - £275m ($315-$385m) assuming:
– Normalised net revenue margins for remainder of year; no material disruption to sporting calendar– State launches in Arizona and Connecticut in H2
Tax • Effective Group ex-US corporate tax rate expected to be 17-19% (previously 15-17%) reflecting higher proportion of earnings coming from Australia and UK&I
Capex • Continue to expect capex to be c.£300m in 2021

19
Group ex-US Business ReviewPeter Jackson, Group CEO

20
UK & Ireland: progress on integrationStrategy serving all customers at scale
• Focus on maintaining strong performance
• Creating ‘Centres of Excellence’– Key functions powering brands– Shared insights, technology and tools to optimize
customer offering and further unlock scale benefits
• ‘Club and Country’ people model in place to sustain mix of cultures – Club representing brand e.g. Betfair– Country representing UK&I
• Strategy delivering strong growth– > 3.3m AMPs in H1– Scale benefits even before integration work
complete
Integration while maintaining momentum
Integration progress
Complement and compete to serve entire market
Highly engagedRecreational
Sports first
Racing
Football bettors
Gaming led
In-play
PeopleCustomer
operations
Pricing and risk
managementTech
Centres of Excellence powering
brands

21
• Improved ‘Bet Builder’ on Paddy Power and Betfair – Higher margin product– Popular with recreational customers – Over double the volume on created bet types in 2021 vs 2020
• Enhanced SBG in-play with 86% of football markets now traded in-house; 100% target by end 2021
Improved gaming offering also driving engagementEarly collaboration on sports products driving growth
• Learnings from Sky Vegas ‘Prize Machine’ improved Paddy Power and Betfair gaming content– 50% increase in multi-product
monthly players– 77% daily customers played
Paddy’s Wonder Wheel in March
UK & Ireland: benefits of shared expertise evident
Sports AMPs Gaming AMPs
H1 2019 H1 2021
+24%+59%

22
Buying local capabilities like Junglee and Singular
International: building the foundations for future growthContinuing to put business on more stable footing… …through actions we are taking
RevitalisingPokerStars
brand, stabilisingpoker base
Scaling casino through cross-sell and direct
acquisition
Building a lead in sports with multi-brand
portfolio
2 31 • PokerStars Neymar “I’m In” campaign • Increased live-streamed poker content• Improved promotions and value
1
• ‘EPIC downtime’ PokerStars direct casino campaign • Market leading casino promotions e.g. Million Dollar Race• More proprietary content; designed for greater cross-sell
• Betfair LATAM investment• Locally focussed marketing investment with Adjarasport• Prepare GBP for country by country launch beginning in 2022
2
3Local focus
Underpinned by:
Increased focus on regulated markets
Sustainable growth
Enabled by: investment to address legacy underspend in brand, product and technology

23
H1'19 H1'21
International: our changes are having an impactPoker Sports
• Positive brand metrics following Neymar “I’m In” brand campaign
• Sunday Millions 15 year anniversary tournament second largest ever, key retention content
• Dominated share of viewers of live-streamed H1 poker content; driving engagement • All time high PokerStars cross-sell
driving sports revenues
• Betfair Spain Q1 market share 3x to 9%2
• Betfair sportsbook AMPs +53% versus H1 2019 with LATAM significant driver
Casino
• Largest product vertical
• 19% of PokerStars gaming GGRnow from proprietary games
• PokerStars direct casino business accelerated, AMPs 5x H1 2019
• Adjarabet #1 operator1
1 2 3
H1 2019 H1 2021
5x
Direct casino AMPs PokerStars Sports cross-sell AMPs; sustained step change from Q3’20
1 Combined market share for Georgia and Armenia in June 2021 based on third party data and company estimates2 Based on published regulator data for Q1 2021
H1 +36% Yo2Y

24
Australia: Step change in scale of Sportsbet business
Significant year-over-two-year growth in key metrics
• Retail competitors open throughout most of H1
• Customer retention rates exceeding our expectations
• Staking remains elevated from traditional retail players
• Increasingly confident that this represents a permanent step change in customer behaviour
• Sportsbet investor day September 22ndAverage monthly players Revenue EBITDA
H1'19 H1'21
+56%
+86%
+192%

25
US Deep DivePeter Jackson, Group CEO

26
US Deep Dive: Introduction
• Compelling customer economics
• Path to 2023 profitability
• Scale advantage generating ‘flywheel effect’
• Our structural competitive advantages:−Product (including pricing and risk management)−Brand reach
• Q2 market share performance
• What’s next…

27
FanDuel scaling rapidly with attractive CPAs…
2018 2019 2020 H1 2021
>2.2m sportsbook and gamingcustomers acquired to date
Low cost per acquisition (CPA) contributing to compelling customer economics
# of online states1
1041 8
• Gap between CPA and expected lifetime value of customers is key
• Our expectations on lifetime values have increased due to:
– Better overall customer retention– Product advantages driving higher sports margins– Greater cross-sell to gaming
1 Number of states live at the end of each period. 2 CPA is FanDuel’s cost per acquisition and represents total media and digital marketing spend per acquired customer.

28
Acquisitionquarter
Q1 Q2 Q3 Q4
Marketing spend to acquire customers
Cumulative gross profit from acquired customers
…and excellent customer values from strong retention…
Average return on CPA investment (ROI)1
of 1.2x by end of year 1……while strong customer retention is
driving revenue growth in year 22
($X)
Revenue Yr 1 post-acquisition quarter
Revenue Yr 2 post-acquisition quarter
1 Return on investment (ROI) is the average gross profit generated from customers divided by their average CPA. Analysis of 1 year returns is based on the spending patterns of all FanDuel sportsbook/gaming customers acquired pre June 30 2020.
2 Analysis of 2 year returns is based on the spending patterns of all FanDuel sportsbook/gaming customers acquired pre June 30 2019.
$1.2X +11%

29
91
402
169
200
33
(311)
12 months to June 2021
New customer acquisition
Contribution from existingbusiness and customers
Growth from existingsportsbook and gaming
customers
DFS/TVG
12 months to June 2020
FanDuel contribution $m
• FanDuel contribution1 $402m pre investment in new customer acquisition generated by:
— ~550k customer acquired by June 2020— Existing TVG and DFS businesses
• More than covers $320m in other operating costs (excluding sales and marketing)
• This implies that FanDuel would have been profitable pre-customer acquisition in the last 12 months
Over 1.7m customer acquired in the last 12 months, 3x total acquired in previous period to date
…leading to a clear pathway for future profitability…
1 Contribution is defined as gross profit less sales and marketing expense.2 Growth from existing sportsbook and gaming customers represents YoY increase in contribution from customers acquired pre-June 2020 less an allocation for retention marketing.
3 New customer acquisition represents contribution from new customers acquired in LTM, including gross profit generated from these customers in that period.
2
3
30
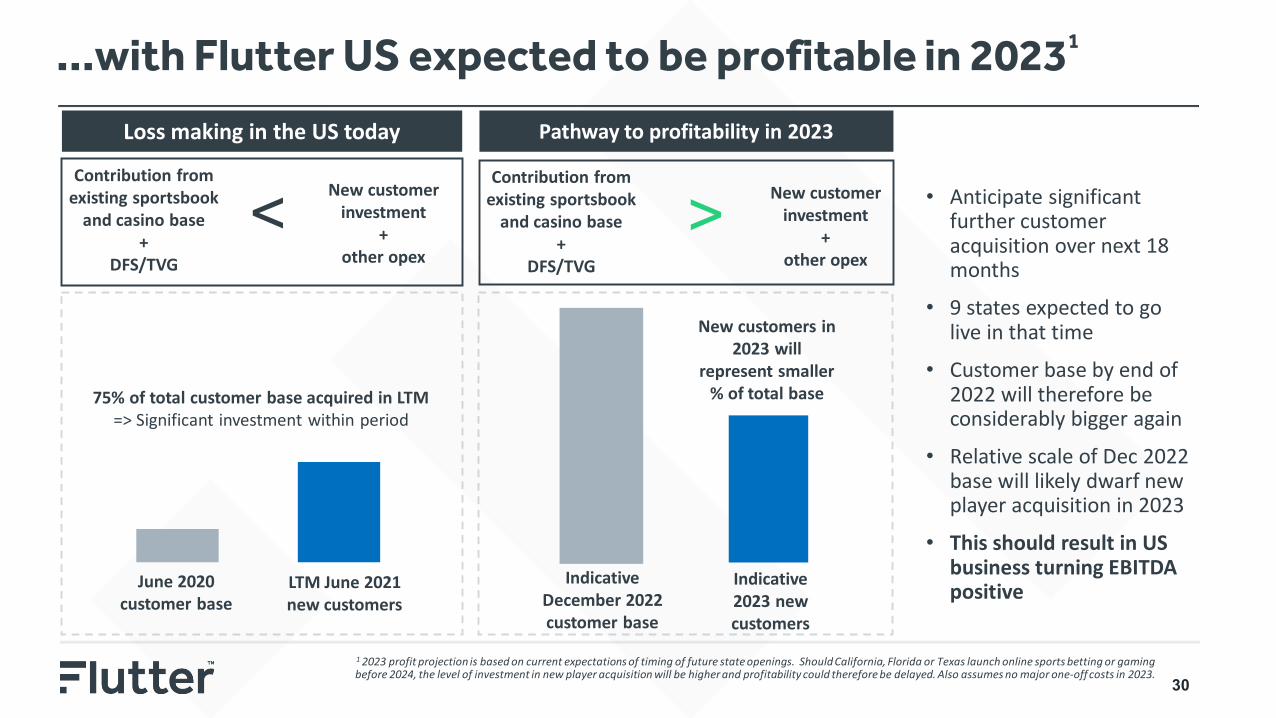
…with Flutter US expected to be profitable in 20231
Contribution from existing sportsbook
and casino base +
DFS/TVG
Loss making in the US today
75% of total customer base acquired in LTM=> Significant investment within period
June 2020 customer base
LTM June 2021new customers
Indicative 2023 new customers
Indicative December 2022 customer base
New customers in 2023 will
represent smaller % of total base
1 2023 profit projection is based on current expectations of timing of future state openings. Should California, Florida or Texas launch online sports betting or gaming before 2024, the level of investment in new player acquisition will be higher and profitability could therefore be delayed. Also assumes no major one-off costs in 2023.
Pathway to profitability in 2023
New customer investment
+ other opex
<Contribution from
existing sportsbook and casino base
+ DFS/TVG
New customer investment
+ other opex
> • Anticipate significant further customer acquisition over next 18 months
• 9 states expected to go live in that time
• Customer base by end of 2022 will therefore be considerably bigger again
• Relative scale of Dec 2022 base will likely dwarf new player acquisition in 2023
• This should result in US business turning EBITDA positive

31
• Product and technologyinvestment doubled
• Marketing >$400m (+262%) in H1
• #1 ranked sports app• Proprietary sports technology• Broadest range of betting
products for customers• Improving gaming proposition
• Revenue $906m, +159%• Q2 revenue >$0.5bn• AMPs +166% to 1.5m
• Other operating costs as a % of revenue reduced 970bps
• Fixed cost base now supporting • 10 online states
Greater operating leverage
Increased scale and flexibility
Enhanced customer
proposition
Higher revenue growth
‘Flywheel effect’: Investing to retain gold medal
Product and brand foundations for success to date

32
Proprietary technology drives sustainable product leadership
FanDuel sportsbook app
Betting platform
Account & wallet
Pricing & risk management
Platforms supported by Flutter technology team of 4,800Shared codebase provides access to Flutter’s latest products e.g. Same Game Parlay™
• Proprietary platform now live in all states
• Significantly improved speed, scalability and reliability
• iOS log-in time one-third faster, improving customer experience
• Significant increase in peak capacity
• In-house DFS solution expanded to combine sports and gaming
• Cross-sell experience significantly improved
• DFS to sportsbook cross-sell doubled when FanDuel A&W available on state launch
• Global solution live with FanDuel since launch
• Integrated with global pricing and risk management functions
• Platform delivers over 1 billion price updates every week

33
Same Game Parlay™: Leveraging global scale and resources
SGP available
Widest range of SGP markets
SGP available
Widest range of SGP markets
SGP available
Widest range of SGP markets
• Same Game Parlay™ (SGP) is selection of multiple correlated events within single game
• Very popular product with customers. >50% of customers placed a SGP during 2020/21 NFL season
• Structurally higher margin than single bet
• Difficult product to deliver due to:– Complexity of mathematics on correlated
events– Delivery of integrated, intuitive in-app
experience for customers
• FanDuel SGP delivered by Flutter, product quality materially ahead of competitive offering
• Investing to add more sports
H1 2021

34
Proprietary models delivering #1 player experience…
309
255
Flutter pricing and risk management unlocks greater depth of markets…
Number of betting markets1
78%
91%
Sep. '19 Entire 20/21 Season
% uptime2
…and enables the best in-play experiences • Currently 75% of handle priced using in-house models; target of ~95% by end of 2023
• Margin on in-house traded live sports ~2x third-party solution
• Continued investment to iterate existing models
• Building out local expertise within the US team
• Focus on reducing friction on in-play bet placement
• In-play bet delay 1 second during 2021 Super Bowl vs 7 seconds in 2019
Competitor A Competitor B
1Sample taken during Q2 2021.2Uptime equates to the % of game where customers can place a bet and odds are not suspended.
Pre-live In-play

35
6.8%
8.3%
…while generating structural margin advantages
More to come……generating higher revenue% of Handle Priced In-HouseHighly competitive odds for
customers……better pricing accuracy and product
mix improve trading margins…Stake weighted over-round vs FanDuel1 Rolling 3 month average trading margin of FD
Sportsbook2
Q4 ‘18 Q2 ‘21
Online Gross Win % 3
Rest of Market Avg.
~20% more GGR from any given handle
7% higher price
3% higherprice
Best pricing
1 Stake weighted over-round is FanDuel product mix applied to competitors over-round during H1 2021.2 Trading margin reflects underlying actual margin of FanDuel sportsbook, excluding impact of material customer acquisition promotions/odds boosts which come through margin line.
3 Online gross win percentage is gross gaming revenue divided by handle for all states where information is available over last 12 months. Gross win definition may differ slightly between states.
Competitor A
Competitor B
0%
2%
4%
6%
8%
10%
12%
(12 months to June 2021)

36
3% 4% 4%8% 8%
11% 11%
54% 54%
Brand synonymous with the US sports experience
31
54 5868 71 72
97116
172
200
Leading brand in sports gaming… …with unmatched user engagement
Average engagement per user per month during NFL season2
(installed base, minutes spent on site)Spontaneous brand awareness1
1 Full year 2020 including all states where FanDuel was live during the period. Source: Beall research.2 Source: ComScore data, conducted for 2019-20 NFL season.

37
Expanding customer database is driving growth
FanDuel database,registered players
More effectivereferralsprogram
Biggerdatabase
• Large, relevant national customer base drives cross-sell
• FanDuel database provided >40% of sportsbook customers to June 2021
• ~33% of customers placed first bet following friend referral or viral marketing campaign
• Word-of-mouth as source of FanDuel awareness >2x next biggest source (TV)
Continued strong growth in DFS database Investing in direct casino players
2019 2020 H1 2021
FanDuel new customers first playing casino
• Broader range of content for casino players with over 100 titles added in H1
• Upgraded customer interface leveraging Group resources in Romania
7 million
13 million
2017 2021

38
Extensive, flexible media strategy, H1 investment >$300m
39%
26%
16%
12%7%
Majority of marketing spend is variable; Continually optimised using data analytics
Share of voice on regional sports networks
• Strong relationships with national sporting bodies, premium NFL partnership signed in 2021
• National integrations (NBA on TNT, CBS) to reach large sports audience
• Highest share of voice on regional sports networks where consumers watch local teams’ NBA, MLB and NHL games
• Partnerships with at least one major league team in every sportsbook state
National Local
FanDuelCompetitor ACompetitor BCompetitor COthers

39
-
20
40
60
80
100
120
140
160
180
10% 20% 30% 40% 50% 60%
Gold medals in six largest statesQ2 GGR
$’m
• Q2 sports market share of 45%
• Top 6 markets account for over 80% of market in Q2
• Lead extended in Q2 due to our pricing, risk management and product advantages
• Leading in various different types of states
1 Online sportsbook market share is the GGR market share of FanDuel and FOX Bet for Q2 in the states in which FanDuel was live based on published gaming regulator reports in those states.
Market share %
NJ
CO
IAWV
PAIL
VAIN
MI
TN
Q2 online sportsbook GGR1 and market share,Bubble size proportionate to size of state market

40
Market share of 51% in early states
0%
10%
20%
30%
40%
50%
60%
Jan-20
New Jersey Pennsylvania Indiana
0%
10%
20%
30%
40%
50%
60%
Jan-200%
10%
20%
30%
40%
50%
60%
70%
Jan-20
31%
13%36%
Clear market leader in each state despite slightly late entry
Flutter US Current #2 operator in each market
1 Online sportsbook market share is the GGR market share of FanDuel and FOX Bet for Q2 based on published gaming regulator reports in those states.
Sportsbook, rolling 3-month GGR1

41
0%
10%
20%
30%
40%
50%
Oct-20 Jun-210%
10%
20%
30%
40%
50%
Mar-20 Jun-210%
10%
20%
30%
40%
50%
Mar-20 Jun-21
New large states generating similar results Illinois Michigan Virginia
20% 21%17%
Flutter US Current #2 operator in each market
• Launched 3 weeks behind competitors• State has reverted to remote sign-up
since April
• Jan-21 launch in line with competitors
• Early GGR numbers impacted by promotional spend
• Jan-21 launch 2 days ahead of competitors
• Consistent leader since launch
Sportsbook, rolling 3-month GGR1
1 Online sportsbook market share is the GGR market share of FanDuel and FOX Bet for Q2 based on published gaming regulator reports in those states.

42
More to come…
• Maintaining challenger mindset despite our market leadership
• Continuing to invest to:
− Extend our sportsbook product advantage
− Improve our gaming proposition by leveraging Group capabilities− Keep the flywheel turning
• In addition, part-funding referendum efforts in Florida to support the regulation of mobile sports betting
• Pipeline of new state regulation is sports-betting rather than gaming focused
• Of ~9 state openings expected in next 18 months, 8 likely to be sports betting only initially. Only 1 expected to regulate gaming
• Positions FanDuel exceptionally well

43
ConclusionPeter Jackson, Group CEO
44
Conclusion
• Excellent performance delivered in H1 2021
• Scale and diversification clearly evident
• High performing brand portfolio in the UK&I
• Well positioned to rebuild foundations of International for future growth
• Sportsbet #1 in Australian market; sustained scale due to excellent execution
• FanDuel; leveraging competitive advantages to compound leadership position
• Looking forward to the future with confidence

45
Appendix

46
KPI: Average monthly players
Average Monthly Players (“AMP”)1,2
Pro forma ('000s)2021 Q1 Q2 H1Group 7,672 7,578 7,625UK & Ireland 3,167 3,440 3,303Australia 831 982 906International 2,027 1,863 1,945US 1,648 1,292 1,4702020 Q1 Q2 H1
Group 5,635 5,256 5,445 UK & Ireland 2,571 2,027 2,299 Australia 581 611 596 International 1,774 2,223 1,999 US 710 395 552
YoY % Q1 Q2 H1
Group +36% +44% +40%UK & Ireland +23% +70% +44%Australia +43% +61% +52%International +14% -16% -3%US +132% +227% +166%
1 Average Monthly Players represent the total number of players that have placed a sports bet/wager, staked a casino bet and/or contributed to rake or tournament fees during a month within the reporting period. The totals include only those players that have deposited real money funds with a Flutter brand on at least one occasion. The AMP numbers do not include Junglee players
in 2020 or 2021 to allow for better comparability of underlying player growth for International and Group.2 UK&I and US totals are not de-duped i.e. a customer that is active on more than one brand will be counted more than once based on the number of brands they are active within a quarter.

47
UK & IrelandOnline
• Sportsbook revenue +53%:– Staking +82% given prior year calendar– 110bps of H1 favourable sports results– Prior year favourable results lead to
margin decline year on year• Exchange and B2B revenue +40% • Gaming +17% despite tough comparatives• Cost of sales % higher due to data feeds• Marketing year on year increased due to
normalised sporting calendar• EBITDA up 53% year on year with 370
basis point improvement in marginRetail
• Revenue decline due to shops remaining shut for majority of H1
• No government support claimed with EBITDA loss of £39m in H1
ONLINE RETAIL
Pro forma £m H1 2021 H1 2020 YOY H1 2021 H1 2020 YOY
Average monthly players (‘000s) 3,303 2,299 +44%
Sportsbook stakes 5,885 3,231 +82% 207 383 -46%Sportsbook net revenue margin 10.6% 12.6% -200bps 12.5% 14.6% -210bps
Sports revenue 712 470 +52% 26 56 -54%
Gaming revenue 382 327 +17% 16 23 -33%
Total revenue 1,094 796 +37% 41 79 -47%
Cost of sales (332) (224) +48% (10) (17) -43%Cost of sales as a % of net revenue 30.4% 28.2% +220bps 23.4% 21.6% +180bps
Gross profit 762 572 +33% 32 62 -49%
Sales & marketing costs (204) (166) +23% (3) (3) -
Contribution 558 406 +37% 29 59 -51%
Other operating costs (160) (146) +9% (68) (69) -2%
Adjusted EBITDA 398 260 +53% (39) (10) +296%Adjusted EBITDA margin 36.4% 32.7% +370bps (93.6%) (12.4%) -8,120bps
Depreciation and amortisation (42) (36) +15% (21) (21) -3%
Adjusted operating profit 356 224 +59% (59) (31) +91%

48
Australia
• Customer volumes 52% higher drove revenue growth
• Staking +27% at £5bn
• Net revenue margin remained in line with prior year; favourable sports results reinvested in incremental generosity
• Marketing % declined 360 bps benefitting from merger synergies
• Cost efficiencies delivered excellent operating leverage with EBITDA +56% to £201m; a 630bps expansion in margin
Pro forma £m H1 2021 H1 2020 YOY YOY CC
Average monthly players (‘000s) 906 596 +52%
Sportsbook stakes 5,000 3,723 +34% +27%Sportsbook net revenue margin 11.7% 11.7% - -
Revenue 585 435 +35% +27%
Cost of sales (275) (200) +38% +30%
Cost of sales as a % of net revenue 47.0% 45.9% +110bps +100bps
Gross profit 310 235 +32% +25%
Sales & marketing costs (59) (59) -1% -6%
Contribution 252 176 +43% +35%
Other operating costs (51) (55) -7% -11%
Adjusted EBITDA 201 121 +66% +56%Adjusted EBITDA margin 34.3% 27.9% +640bps +630bps
Depreciation and amortisation (13) (14) -9% -15%
Adjusted operating profit 188 107 +76% +66%

49
International
• Revenue -11% primarily due to Covid related benefit in prior year
• Regulatory headwinds previously guided also had impact
• Cost of sales % increase reflects change in regulated mix and increased casino
• Investment in brand and product driving cost growth including– Increased brand spend on Betfair
LATAM marketing campaigns and PokerStars “EPIC downtime”
– Headcount investment and operational capabilities
Pro forma £m H1 2021 H1 2020 YOY YOY CC
Average monthly players (‘000s) 1,945 1,999 -3%
Sportsbook stakes 871 555 +57% +61%Sportsbook net revenue margin 9.1% 8.7% +40bps +40bps
Sports revenue 118 74 +59% +62%
Gaming revenue 562 727 -23% -19%
Total revenue 680 801 -15% -11%
Cost of sales (199) (181) +10% +14%
Cost of sales as a % of net revenue 29.3% 22.6% +670bps +640bps
Gross profit 481 620 -22% -18%
Sales & marketing costs (171) (110) +55% +71%
Contribution 310 510 -39% -37%
Other operating costs (131) (113) +16% +16%
Adjusted EBITDA 179 397 -55% -52%Adjusted EBITDA margin 26.3% 49.5% -2,330bps -2,280bps
Depreciation and amortisation (25) (24) +4% +7%
Adjusted operating profit 154 373 -59% -56%

50
US
• Revenue +159% reflecting:– AMPs +166% to 1.5m– Continued strong growth in existing states– Successful launches in Michigan and Virginia – An uninterrupted sports calendar
• Sports revenue trebled; sportsbook +540% and DFS/TVG racing +36%
• Gaming growth reflects launch in Michigan
• COS % increase from change in revenue mix to higher cost sportsbook and gaming
• Marketing trebled with new launches and investment in existing states
• Scale efficiencies in operating costs which grew well below revenue
• EBITDA loss of £87m reflecting significant investment in Michigan and Virginia
Pro forma £m H1 2021 H1 2020 YOY YOY CC
Average monthly players (‘000s) 1,470 552 +166%
Sportsbook stakes 5,072 1,090 +365% +402%Sportsbook net revenue margin 6.2% 4.9% +130bps +130bps
Sports revenue 452 164 +175% +202%
Gaming revenue 200 113 +76% +95%
Total revenue 652 278 +135% +159%
Cost of sales (293) (116) +152% +177%Cost of sales as a % of net revenue 44.9% 41.9% +300bps +300bps
Gross profit 359 162 +122% +145%
Sales & marketing costs (292) (88) +230% +262%
Contribution 67 73 -8% +2%
Other operating costs (154) (93) +66% +83%
Adjusted EBITDA (87) (19) +348% +376%Adjusted EBITDA margin (13.3%) (6.9%) -630bps -610bps
Depreciation and amortisation (22) (18) +20% +33%
Adjusted operating profit (108) (38) +189% +213%

51
Separately disclosed items
£m H1 2021 H1 2020
Amortisation of acquisition related intangible assets (276) (128)
Combination fees and associated costs - (26)
Restructuring and integration costs (22) (41)
Greece tax expense (13) -
VAT refund - 10
Operating profit impact of separately disclosed items (310) (185)
Financial Income - 49
Financial Expense (11) (59)
Profit before tax impact of separately disclosed items (321) (194)
Tax credit on separately disclosed items (72) 14
Total separately disclosed items (392) (180)
• Amortisation and restructuring and integration costs due to combination with TSG
• Greek tax expense relates to historic tax case which Paddy Power continues to appeal
• Tax charge primarily driven by charge of £105m relating to increase in deferred tax liabilities due to future UK tax increase to 25% from 1 April 2023

www.flutter.com