Embed Size (px)
Citation preview
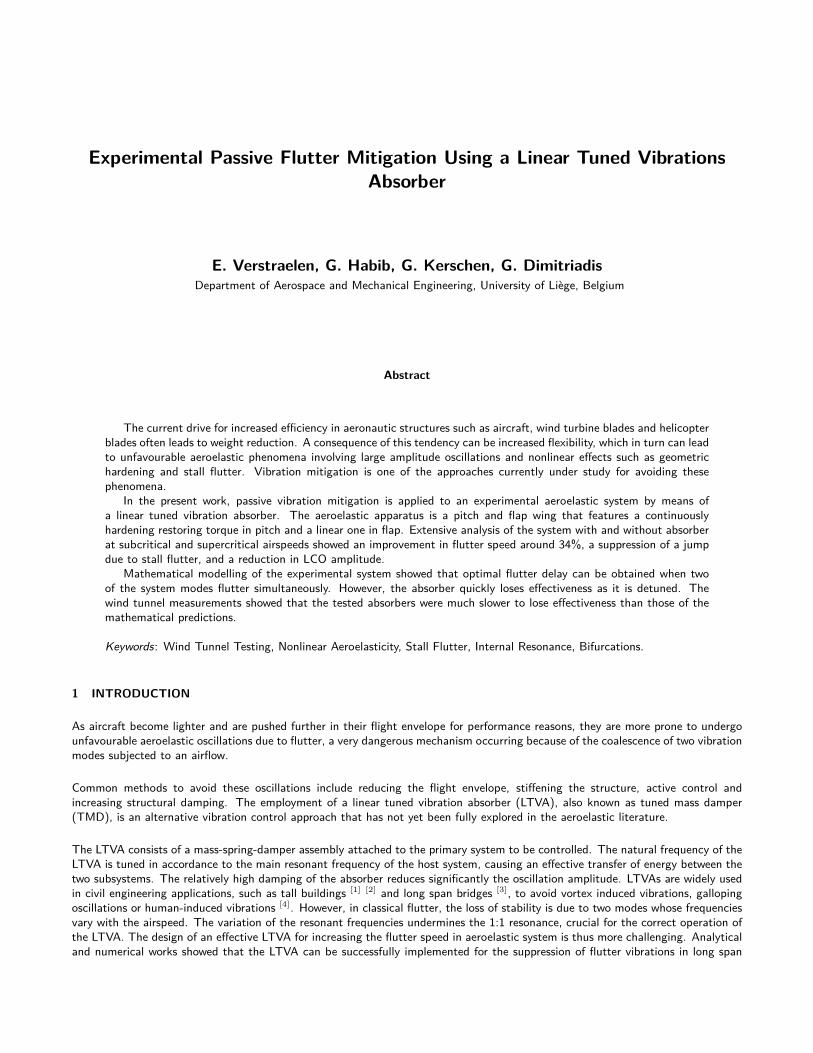
Experimental Passive Flutter Mitigation Using a Linear Tuned VibrationsAbsorber
E. Verstraelen, G. Habib, G. Kerschen, G. DimitriadisDepartment of Aerospace and Mechanical Engineering, University of Liege, Belgium
Abstract
The current drive for increased efficiency in aeronautic structures such as aircraft, wind turbine blades and helicopterblades often leads to weight reduction. A consequence of this tendency can be increased flexibility, which in turn can leadto unfavourable aeroelastic phenomena involving large amplitude oscillations and nonlinear effects such as geometrichardening and stall flutter. Vibration mitigation is one of the approaches currently under study for avoiding thesephenomena.
In the present work, passive vibration mitigation is applied to an experimental aeroelastic system by means ofa linear tuned vibration absorber. The aeroelastic apparatus is a pitch and flap wing that features a continuouslyhardening restoring torque in pitch and a linear one in flap. Extensive analysis of the system with and without absorberat subcritical and supercritical airspeeds showed an improvement in flutter speed around 34%, a suppression of a jumpdue to stall flutter, and a reduction in LCO amplitude.
Mathematical modelling of the experimental system showed that optimal flutter delay can be obtained when twoof the system modes flutter simultaneously. However, the absorber quickly loses effectiveness as it is detuned. Thewind tunnel measurements showed that the tested absorbers were much slower to lose effectiveness than those of themathematical predictions.
Keywords: Wind Tunnel Testing, Nonlinear Aeroelasticity, Stall Flutter, Internal Resonance, Bifurcations.
1 INTRODUCTION
As aircraft become lighter and are pushed further in their flight envelope for performance reasons, they are more prone to undergounfavourable aeroelastic oscillations due to flutter, a very dangerous mechanism occurring because of the coalescence of two vibrationmodes subjected to an airflow.
Common methods to avoid these oscillations include reducing the flight envelope, stiffening the structure, active control andincreasing structural damping. The employment of a linear tuned vibration absorber (LTVA), also known as tuned mass damper(TMD), is an alternative vibration control approach that has not yet been fully explored in the aeroelastic literature.
The LTVA consists of a mass-spring-damper assembly attached to the primary system to be controlled. The natural frequency of theLTVA is tuned in accordance to the main resonant frequency of the host system, causing an effective transfer of energy between thetwo subsystems. The relatively high damping of the absorber reduces significantly the oscillation amplitude. LTVAs are widely usedin civil engineering applications, such as tall buildings [1] [2] and long span bridges [3], to avoid vortex induced vibrations, gallopingoscillations or human-induced vibrations [4]. However, in classical flutter, the loss of stability is due to two modes whose frequenciesvary with the airspeed. The variation of the resonant frequencies undermines the 1:1 resonance, crucial for the correct operation ofthe LTVA. The design of an effective LTVA for increasing the flutter speed in aeroelastic system is thus more challenging. Analyticaland numerical works showed that the LTVA can be successfully implemented for the suppression of flutter vibrations in long span
bridges [5−8]. A few pioneering studies[9, 10] have illustrated that the same concept can be applied to aircraft wings. However, tothe authors’ knowledge, there is a lack of experimental work demonstrating the effectiveness of LTVAs for flutter suppression in theliterature.
In this study we attach a LTVA to a nonlinear pitch and flap wing (NLPFW) in order to delay the flutter onset speed. The studyis conducted in three steps. Firstly, the aeroelastic system’s behaviour is extensively investigated numerically and experimentally inthe wind-tunnel. Secondly, numerical and experimental LTVAs are designed. Finally, the efficiency of these absorbers is assessedand tuning rules are derived.
2 PRIMARY SYSTEM
2.1 Experimental setup
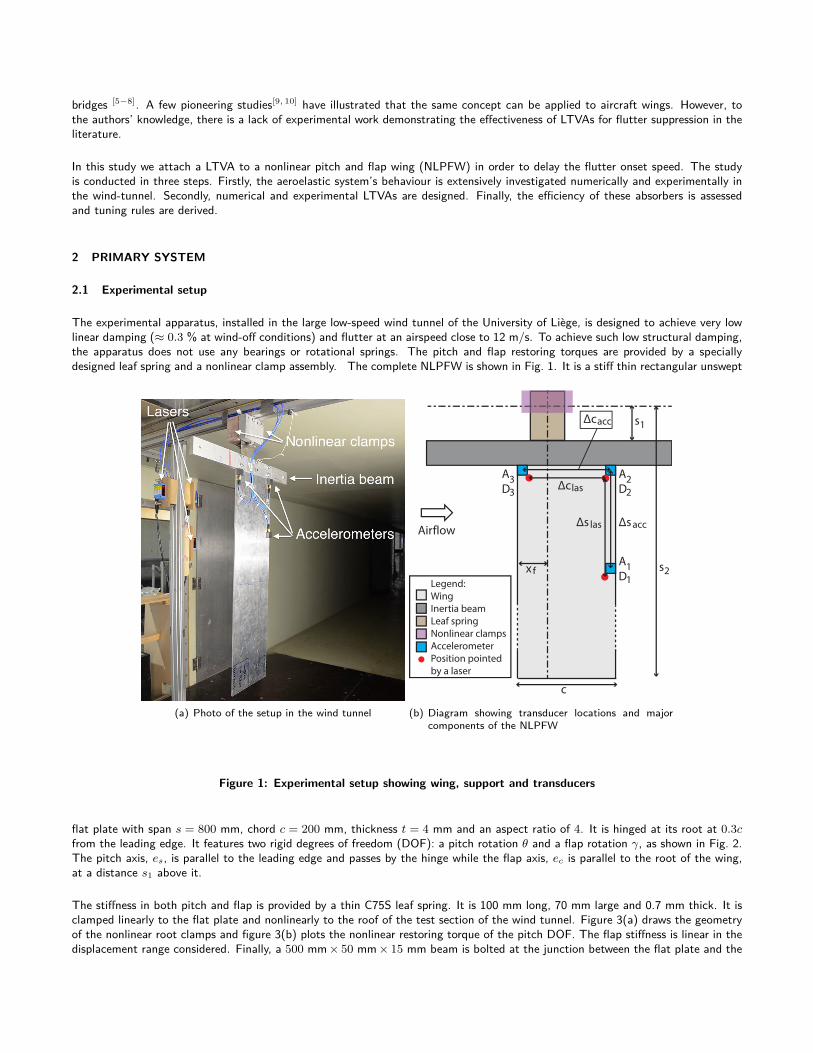
The experimental apparatus, installed in the large low-speed wind tunnel of the University of Liege, is designed to achieve very lowlinear damping (≈ 0.3 % at wind-off conditions) and flutter at an airspeed close to 12 m/s. To achieve such low structural damping,the apparatus does not use any bearings or rotational springs. The pitch and flap restoring torques are provided by a speciallydesigned leaf spring and a nonlinear clamp assembly. The complete NLPFW is shown in Fig. 1. It is a stiff thin rectangular unswept
(a) Photo of the setup in the wind tunnel
Legend:
Wing
Inertia beam
Leaf spring
Nonlinear clamps
Accelerometer
Position pointed
by a laser
ΔsaccΔs las
Δclas
Δcacc
c
sx f
A
D2
2
A
D1
1
A
D3
3
2
s1
Airflow
(b) Diagram showing transducer locations and majorcomponents of the NLPFW
Figure 1: Experimental setup showing wing, support and transducers
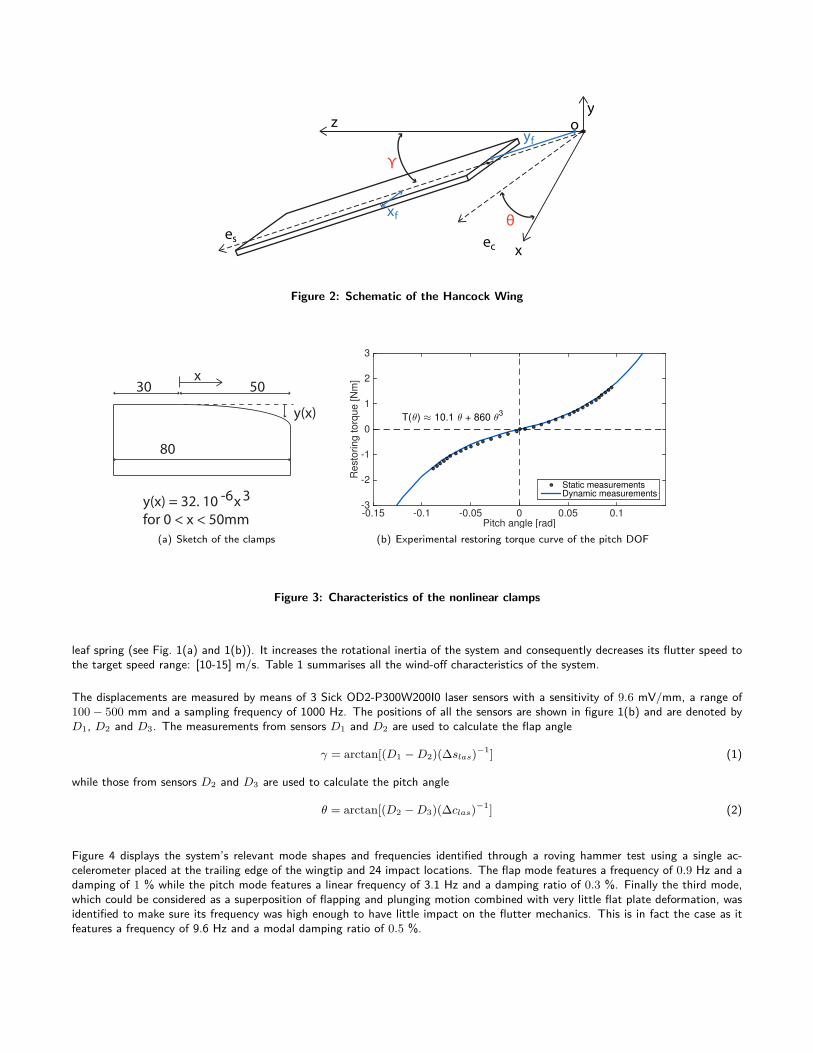
flat plate with span s = 800 mm, chord c = 200 mm, thickness t = 4 mm and an aspect ratio of 4. It is hinged at its root at 0.3cfrom the leading edge. It features two rigid degrees of freedom (DOF): a pitch rotation θ and a flap rotation γ, as shown in Fig. 2.The pitch axis, es, is parallel to the leading edge and passes by the hinge while the flap axis, ec is parallel to the root of the wing,at a distance s1 above it.
The stiffness in both pitch and flap is provided by a thin C75S leaf spring. It is 100 mm long, 70 mm large and 0.7 mm thick. It isclamped linearly to the flat plate and nonlinearly to the roof of the test section of the wind tunnel. Figure 3(a) draws the geometryof the nonlinear root clamps and figure 3(b) plots the nonlinear restoring torque of the pitch DOF. The flap stiffness is linear in thedisplacement range considered. Finally, a 500 mm × 50 mm × 15 mm beam is bolted at the junction between the flat plate and the
yz
θ
Ύ
es
o
ec x
xf
yf
Figure 2: Schematic of the Hancock Wing
80
x30 50
y(x) = 32. 10 x
for 0 < x < 50mm
-6 3
y(x)
(a) Sketch of the clamps
Pitch angle [rad]-0.15 -0.1 -0.05 0 0.05 0.1
Re
sto
rin
g t
orq
ue
[N
m]
-3
-2
-1
0
1
2
3
T(θ) ≈ 10.1 θ + 860 θ3
Static measurementsDynamic measurements
(b) Experimental restoring torque curve of the pitch DOF
Figure 3: Characteristics of the nonlinear clamps
leaf spring (see Fig. 1(a) and 1(b)). It increases the rotational inertia of the system and consequently decreases its flutter speed tothe target speed range: [10-15] m/s. Table 1 summarises all the wind-off characteristics of the system.
The displacements are measured by means of 3 Sick OD2-P300W200I0 laser sensors with a sensitivity of 9.6 mV/mm, a range of100 − 500 mm and a sampling frequency of 1000 Hz. The positions of all the sensors are shown in figure 1(b) and are denoted byD1, D2 and D3. The measurements from sensors D1 and D2 are used to calculate the flap angle
γ = arctan[(D1 −D2)(∆slas)−1] (1)
while those from sensors D2 and D3 are used to calculate the pitch angle
θ = arctan[(D2 −D3)(∆clas)−1] (2)
Figure 4 displays the system’s relevant mode shapes and frequencies identified through a roving hammer test using a single ac-celerometer placed at the trailing edge of the wingtip and 24 impact locations. The flap mode features a frequency of 0.9 Hz and adamping of 1 % while the pitch mode features a linear frequency of 3.1 Hz and a damping ratio of 0.3 %. Finally the third mode,which could be considered as a superposition of flapping and plunging motion combined with very little flat plate deformation, wasidentified to make sure its frequency was high enough to have little impact on the flutter mechanics. This is in fact the case as itfeatures a frequency of 9.6 Hz and a modal damping ratio of 0.5 %.
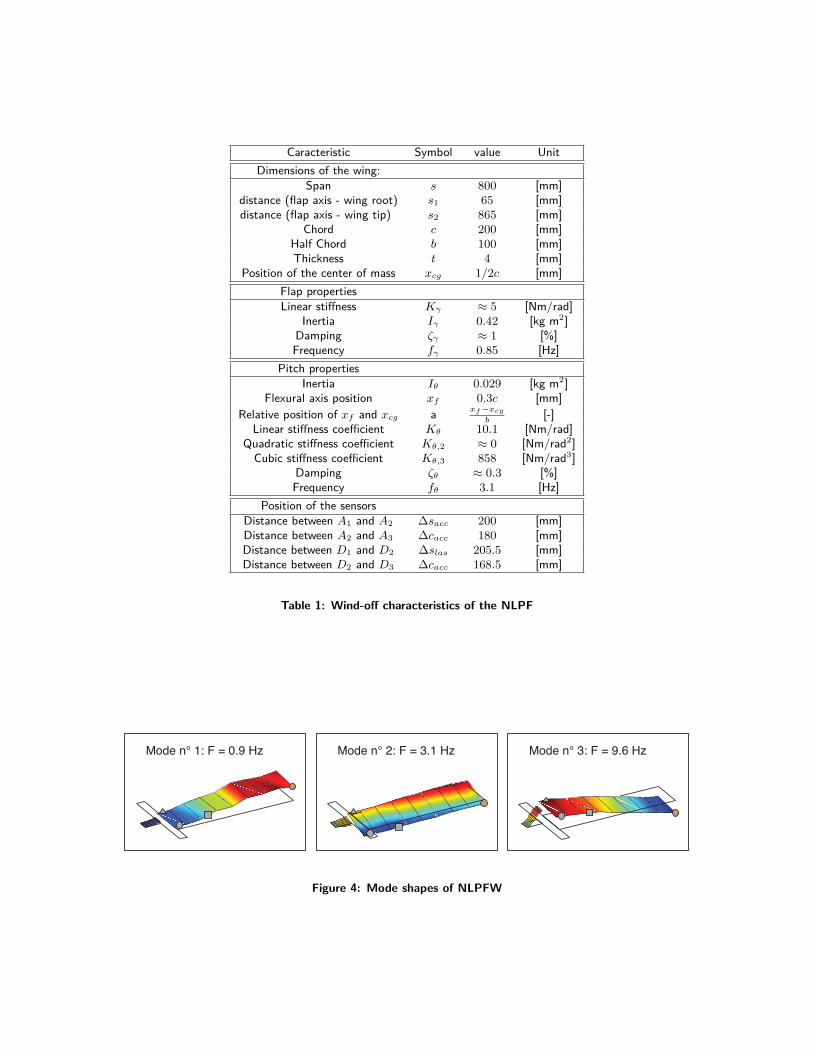
Caracteristic Symbol value UnitDimensions of the wing:
Span s 800 [mm]distance (flap axis - wing root) s1 65 [mm]distance (flap axis - wing tip) s2 865 [mm]
Chord c 200 [mm]Half Chord b 100 [mm]Thickness t 4 [mm]
Position of the center of mass xcg 1/2c [mm]Flap propertiesLinear stiffness Kγ ≈ 5 [Nm/rad]
Inertia Iγ 0.42 [kg m2]Damping ζγ ≈ 1 [%]Frequency fγ 0.85 [Hz]
Pitch propertiesInertia Iθ 0.029 [kg m2]
Flexural axis position xf 0.3c [mm]Relative position of xf and xcg a xf−xcg
b[-]
Linear stiffness coefficient Kθ 10.1 [Nm/rad]Quadratic stiffness coefficient Kθ,2 ≈ 0 [Nm/rad2]
Cubic stiffness coefficient Kθ,3 858 [Nm/rad3]Damping ζθ ≈ 0.3 [%]Frequency fθ 3.1 [Hz]
Position of the sensorsDistance between A1 and A2 ∆sacc 200 [mm]Distance between A2 and A3 ∆cacc 180 [mm]Distance between D1 and D2 ∆slas 205.5 [mm]Distance between D2 and D3 ∆cacc 168.5 [mm]
Table 1: Wind-off characteristics of the NLPF
Mode n° 1: F = 0.9 Hz Mode n° 2: F = 3.1 Hz Mode n° 3: F = 9.6 Hz
Figure 4: Mode shapes of NLPFW
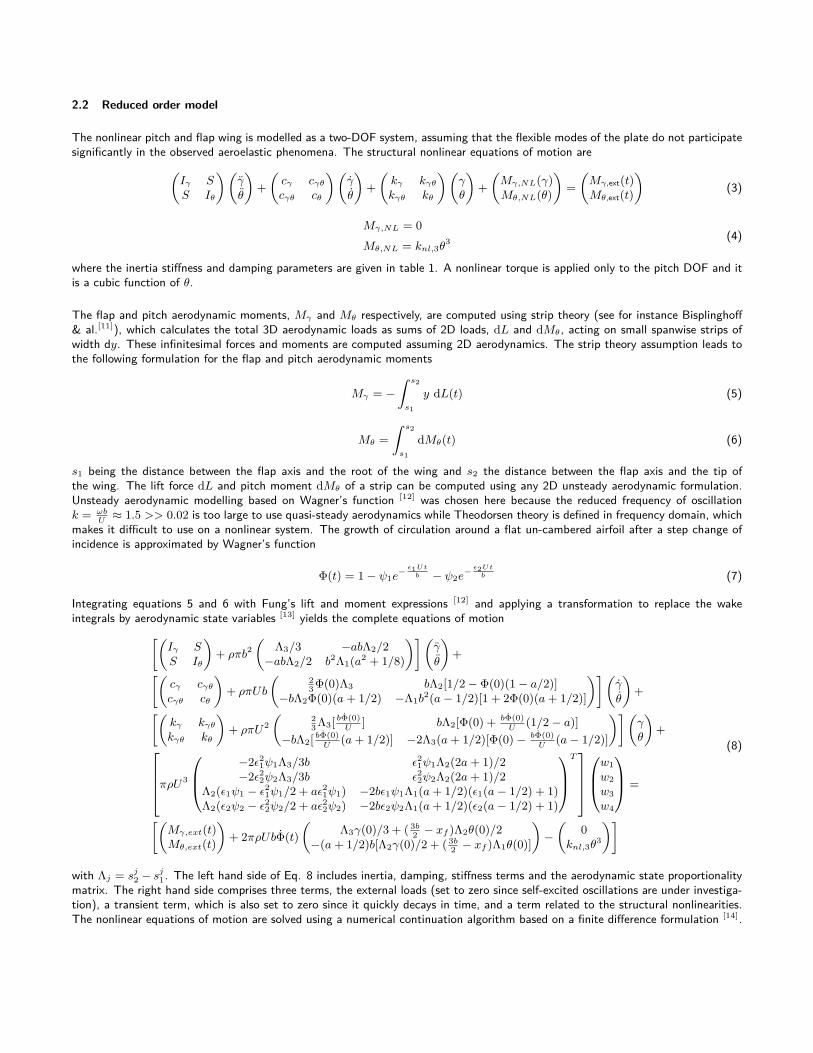
2.2 Reduced order model
The nonlinear pitch and flap wing is modelled as a two-DOF system, assuming that the flexible modes of the plate do not participatesignificantly in the observed aeroelastic phenomena. The structural nonlinear equations of motion are(
Iγ SS Iθ
)(γ
θ
)+(cγ cγθcγθ cθ
)(γ
θ
)+(kγ kγθkγθ kθ
)(γθ
)+(Mγ,NL(γ)Mθ,NL(θ)
)=(Mγ,ext(t)Mθ,ext(t)
)(3)
Mγ,NL = 0Mθ,NL = knl,3θ
3 (4)
where the inertia stiffness and damping parameters are given in table 1. A nonlinear torque is applied only to the pitch DOF and itis a cubic function of θ.
The flap and pitch aerodynamic moments, Mγ and Mθ respectively, are computed using strip theory (see for instance Bisplinghoff& al.[11]), which calculates the total 3D aerodynamic loads as sums of 2D loads, dL and dMθ, acting on small spanwise strips ofwidth dy. These infinitesimal forces and moments are computed assuming 2D aerodynamics. The strip theory assumption leads tothe following formulation for the flap and pitch aerodynamic moments
Mγ = −∫ s2
s1
y dL(t) (5)
Mθ =∫ s2
s1
dMθ(t) (6)
s1 being the distance between the flap axis and the root of the wing and s2 the distance between the flap axis and the tip ofthe wing. The lift force dL and pitch moment dMθ of a strip can be computed using any 2D unsteady aerodynamic formulation.Unsteady aerodynamic modelling based on Wagner’s function [12] was chosen here because the reduced frequency of oscillationk = ωb
U≈ 1.5 >> 0.02 is too large to use quasi-steady aerodynamics while Theodorsen theory is defined in frequency domain, which
makes it difficult to use on a nonlinear system. The growth of circulation around a flat un-cambered airfoil after a step change ofincidence is approximated by Wagner’s function
Φ(t) = 1 − ψ1e− ε1Ut
b − ψ2e− ε2Ut
b (7)
Integrating equations 5 and 6 with Fung’s lift and moment expressions [12] and applying a transformation to replace the wakeintegrals by aerodynamic state variables [13] yields the complete equations of motion[(
Iγ SS Iθ
)+ ρπb2
(Λ3/3 −abΛ2/2
−abΛ2/2 b2Λ1(a2 + 1/8)
)](γ
θ
)+[(
cγ cγθcγθ cθ
)+ ρπUb
(23 Φ(0)Λ3 bΛ2[1/2 − Φ(0)(1 − a/2)]
−bΛ2Φ(0)(a+ 1/2) −Λ1b2(a− 1/2)[1 + 2Φ(0)(a+ 1/2)]
)](γ
θ
)+[(
kγ kγθkγθ kθ
)+ ρπU2
(23 Λ3[ bΦ(0)
U] bΛ2[Φ(0) + bΦ(0)
U(1/2 − a)]
−bΛ2[ bΦ(0)U
(a+ 1/2)] −2Λ3(a+ 1/2)[Φ(0) − bΦ(0)U
(a− 1/2)]
)](γθ
)+πρU3
−2ε21ψ1Λ3/3b ε21ψ1Λ2(2a+ 1)/2−2ε22ψ2Λ3/3b ε22ψ2Λ2(2a+ 1)/2
Λ2(ε1ψ1 − ε21ψ1/2 + aε21ψ1) −2bε1ψ1Λ1(a+ 1/2)(ε1(a− 1/2) + 1)Λ2(ε2ψ2 − ε22ψ2/2 + aε22ψ2) −2bε2ψ2Λ1(a+ 1/2)(ε2(a− 1/2) + 1)
Tw1w2w3w4
=
[(Mγ,ext(t)Mθ,ext(t)
)+ 2πρUbΦ(t)
(Λ3γ(0)/3 + ( 3b
2 − xf )Λ2θ(0)/2−(a+ 1/2)b[Λ2γ(0)/2 + ( 3b
2 − xf )Λ1θ(0)]
)−(
0knl,3θ
3
)]
(8)
with Λj = sj2 − sj1. The left hand side of Eq. 8 includes inertia, damping, stiffness terms and the aerodynamic state proportionalitymatrix. The right hand side comprises three terms, the external loads (set to zero since self-excited oscillations are under investiga-tion), a transient term, which is also set to zero since it quickly decays in time, and a term related to the structural nonlinearities.The nonlinear equations of motion are solved using a numerical continuation algorithm based on a finite difference formulation [14].
Time [s]0 5 10 15 20 25 30
An
gle
[ra
d]
-0.1
-0.05
0
0.05
0.1 U = 0 m/sU = 5.5 m/sU = 8.7 m/s
(a) Sub critical pitch response
Time [s]0 10 20
Pitch
an
gle
[ra
d]
-0.15
-0.05
0
0.05
0.15U = 14.8 m/sU = 13.3 m/sU = 12.4 m/s
(b) Super critical pitch response
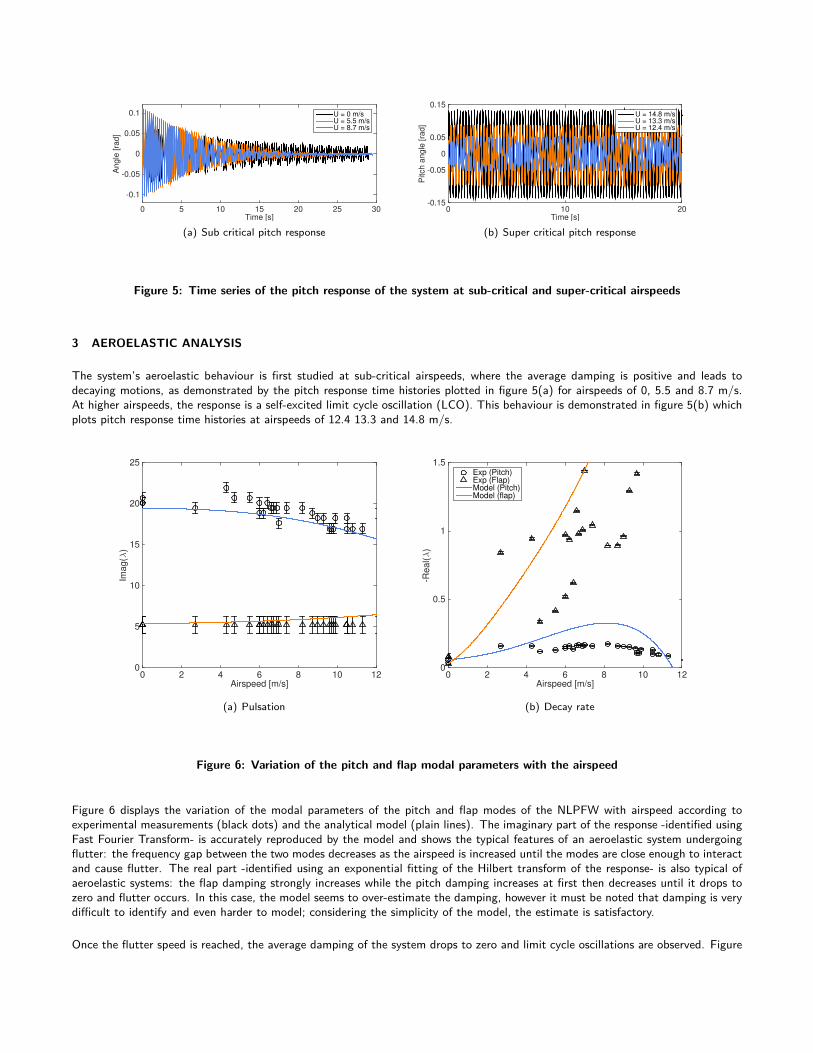
Figure 5: Time series of the pitch response of the system at sub-critical and super-critical airspeeds
3 AEROELASTIC ANALYSIS
The system’s aeroelastic behaviour is first studied at sub-critical airspeeds, where the average damping is positive and leads todecaying motions, as demonstrated by the pitch response time histories plotted in figure 5(a) for airspeeds of 0, 5.5 and 8.7 m/s.At higher airspeeds, the response is a self-excited limit cycle oscillation (LCO). This behaviour is demonstrated in figure 5(b) whichplots pitch response time histories at airspeeds of 12.4 13.3 and 14.8 m/s.
Airspeed [m/s]0 2 4 6 8 10 12
Imag(λ
)
0
5
10
15
20
25
(a) Pulsation
Airspeed [m/s]0 2 4 6 8 10 12
-Real(λ
)
0
0.5
1
1.5Exp (Pitch)Exp (Flap)Model (Pitch)Model (flap)
(b) Decay rate
Figure 6: Variation of the pitch and flap modal parameters with the airspeed
Figure 6 displays the variation of the modal parameters of the pitch and flap modes of the NLPFW with airspeed according toexperimental measurements (black dots) and the analytical model (plain lines). The imaginary part of the response -identified usingFast Fourier Transform- is accurately reproduced by the model and shows the typical features of an aeroelastic system undergoingflutter: the frequency gap between the two modes decreases as the airspeed is increased until the modes are close enough to interactand cause flutter. The real part -identified using an exponential fitting of the Hilbert transform of the response- is also typical ofaeroelastic systems: the flap damping strongly increases while the pitch damping increases at first then decreases until it drops tozero and flutter occurs. In this case, the model seems to over-estimate the damping, however it must be noted that damping is verydifficult to identify and even harder to model; considering the simplicity of the model, the estimate is satisfactory.
Once the flutter speed is reached, the average damping of the system drops to zero and limit cycle oscillations are observed. Figure
Airspeed [m/s]11 12 13 14 15 16 17
Ro
tatio
n [
rad
]
0
0.05
0.1
0.15PitchFlapPitch (model)Flap (model)
(a) Pitch and Flap LCO amplitude
Airspeed [m/s]11 12 13 14 15 16 17
Fre
qu
en
cy [
Hz]
2.5
3
3.5
4
4.5FreqFreq (m)
(b) LCO frequency
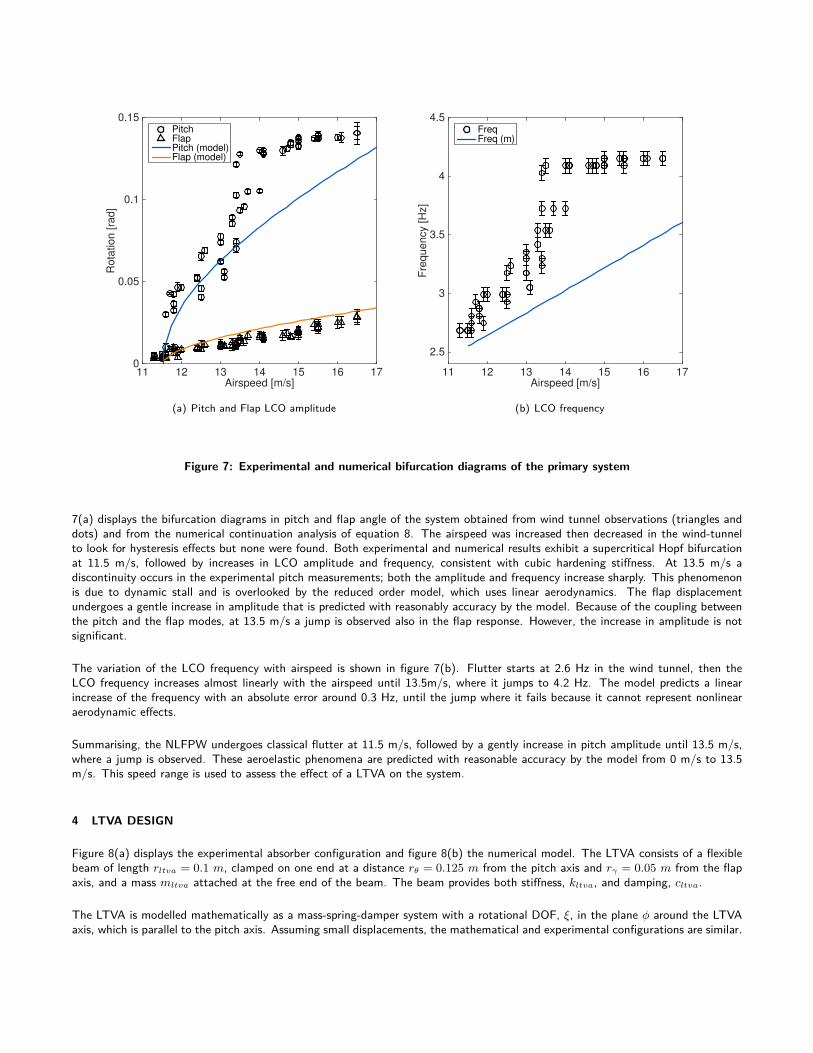
Figure 7: Experimental and numerical bifurcation diagrams of the primary system
7(a) displays the bifurcation diagrams in pitch and flap angle of the system obtained from wind tunnel observations (triangles anddots) and from the numerical continuation analysis of equation 8. The airspeed was increased then decreased in the wind-tunnelto look for hysteresis effects but none were found. Both experimental and numerical results exhibit a supercritical Hopf bifurcationat 11.5 m/s, followed by increases in LCO amplitude and frequency, consistent with cubic hardening stiffness. At 13.5 m/s adiscontinuity occurs in the experimental pitch measurements; both the amplitude and frequency increase sharply. This phenomenonis due to dynamic stall and is overlooked by the reduced order model, which uses linear aerodynamics. The flap displacementundergoes a gentle increase in amplitude that is predicted with reasonably accuracy by the model. Because of the coupling betweenthe pitch and the flap modes, at 13.5 m/s a jump is observed also in the flap response. However, the increase in amplitude is notsignificant.
The variation of the LCO frequency with airspeed is shown in figure 7(b). Flutter starts at 2.6 Hz in the wind tunnel, then theLCO frequency increases almost linearly with the airspeed until 13.5m/s, where it jumps to 4.2 Hz. The model predicts a linearincrease of the frequency with an absolute error around 0.3 Hz, until the jump where it fails because it cannot represent nonlinearaerodynamic effects.
Summarising, the NLFPW undergoes classical flutter at 11.5 m/s, followed by a gently increase in pitch amplitude until 13.5 m/s,where a jump is observed. These aeroelastic phenomena are predicted with reasonable accuracy by the model from 0 m/s to 13.5m/s. This speed range is used to assess the effect of a LTVA on the system.
4 LTVA DESIGN
Figure 8(a) displays the experimental absorber configuration and figure 8(b) the numerical model. The LTVA consists of a flexiblebeam of length rltva = 0.1 m, clamped on one end at a distance rθ = 0.125 m from the pitch axis and rγ = 0.05 m from the flapaxis, and a mass mltva attached at the free end of the beam. The beam provides both stiffness, kltva, and damping, cltva.
The LTVA is modelled mathematically as a mass-spring-damper system with a rotational DOF, ξ, in the plane φ around the LTVAaxis, which is parallel to the pitch axis. Assuming small displacements, the mathematical and experimental configurations are similar.
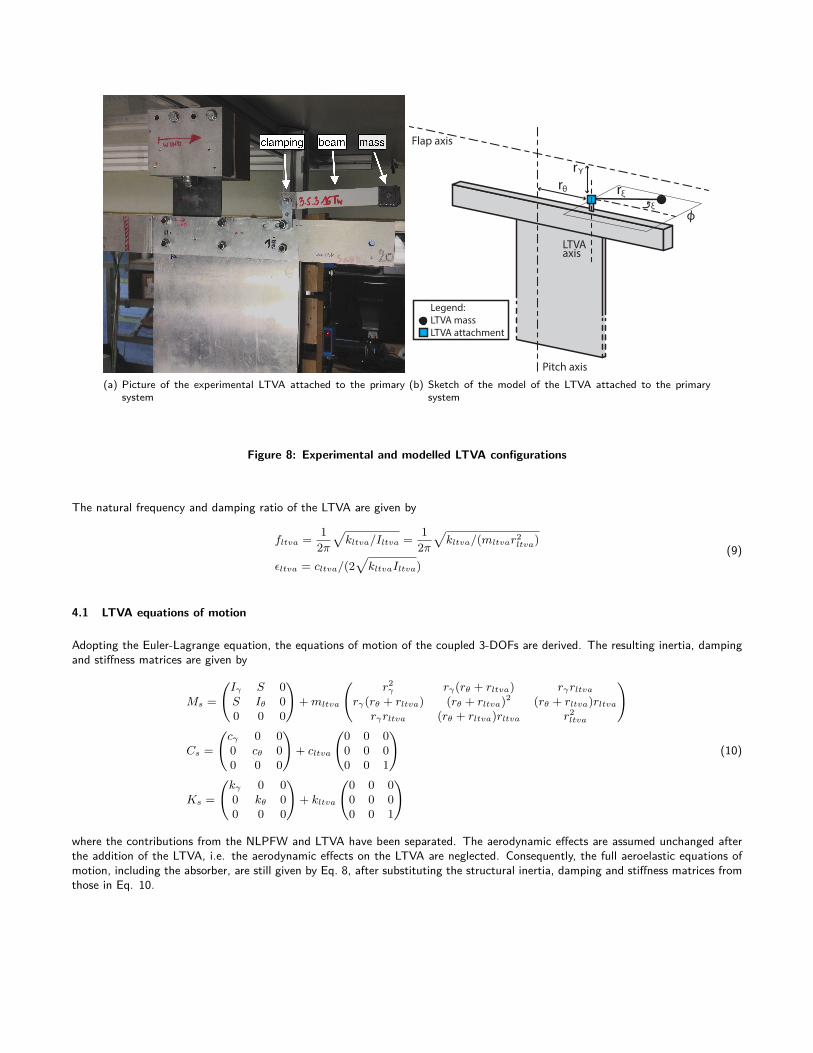
(a) Picture of the experimental LTVA attached to the primarysystem
Pitch axis
Flap axis
LTVAaxis
rξ
rΎ
rθ
Legend:
LTVA mass
LTVA attachment
ξ
ф
(b) Sketch of the model of the LTVA attached to the primarysystem
Figure 8: Experimental and modelled LTVA configurations
The natural frequency and damping ratio of the LTVA are given by
fltva = 12π√kltva/Iltva = 1
2π√kltva/(mltvar2
ltva)
εltva = cltva/(2√kltvaIltva)
(9)
4.1 LTVA equations of motion
Adopting the Euler-Lagrange equation, the equations of motion of the coupled 3-DOFs are derived. The resulting inertia, dampingand stiffness matrices are given by
Ms =
(Iγ S 0S Iθ 00 0 0
)+mltva
(r2γ rγ(rθ + rltva) rγrltva
rγ(rθ + rltva) (rθ + rltva)2 (rθ + rltva)rltvarγrltva (rθ + rltva)rltva r2
ltva
)
Cs =
(cγ 0 00 cθ 00 0 0
)+ cltva
(0 0 00 0 00 0 1
)
Ks =
(kγ 0 00 kθ 00 0 0
)+ kltva
(0 0 00 0 00 0 1
)(10)
where the contributions from the NLPFW and LTVA have been separated. The aerodynamic effects are assumed unchanged afterthe addition of the LTVA, i.e. the aerodynamic effects on the LTVA are neglected. Consequently, the full aeroelastic equations ofmotion, including the absorber, are still given by Eq. 8, after substituting the structural inertia, damping and stiffness matrices fromthose in Eq. 10.
Time [s]0 0.5 1 1.5 2 2.5 3
Te
nsio
n [
mV
]
-50
-40
-30
-20
-10
0
10
20
30
40
50Measured signalAverage cycles amplitudeExponential Fit
(a) Free decay response of the LTVA 30-50-30-16T
LTVA frequency [Hz]2 2.5 3 3.5 4 4.5
LT
VA
da
mp
ing
[%
]
4
6
8
10
12
14
16m54 30-50-30-10Tm54 30-50-30-16Tm61 30-50-30-16Tm54 50-30-50-10Tm54 50-30-50-16Tm61 40-40-40-08Tm61 25-30-25-16Tm61 30-30-30-16Tdamping from log decaydamping from exp fit
(b) Identification results of all the experimental LTVAs
Figure 9: Experimental identification of the LTVAs
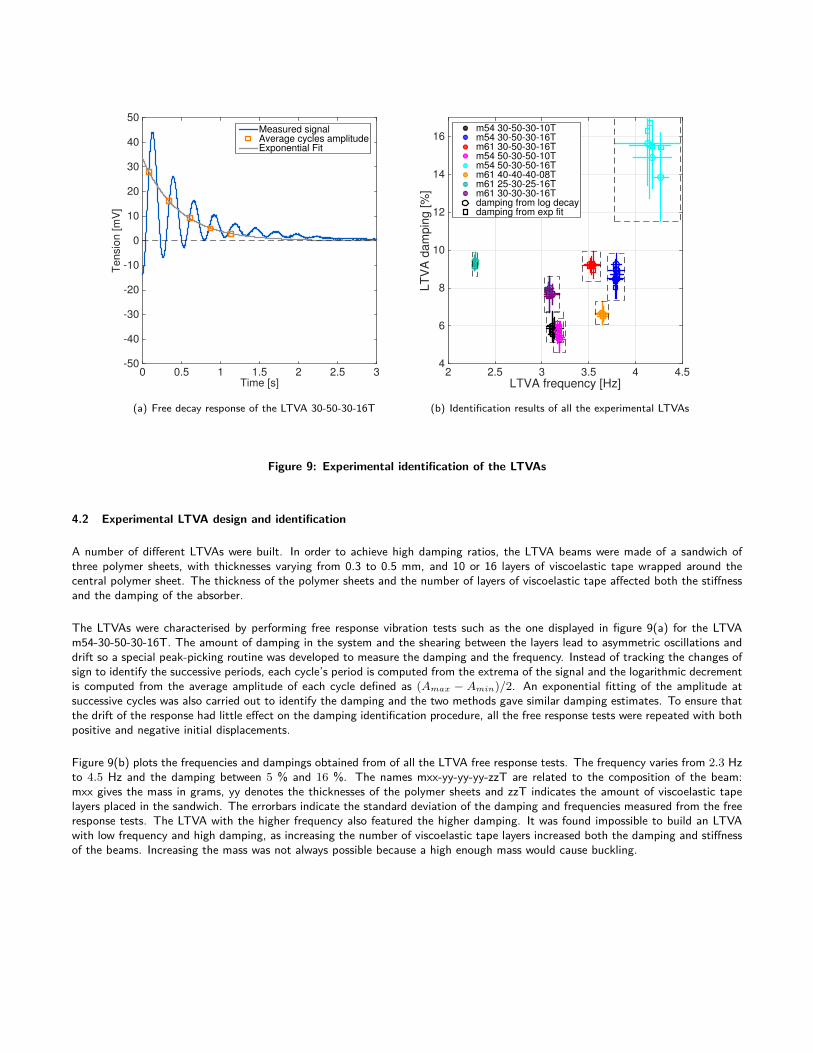
4.2 Experimental LTVA design and identification
A number of different LTVAs were built. In order to achieve high damping ratios, the LTVA beams were made of a sandwich ofthree polymer sheets, with thicknesses varying from 0.3 to 0.5 mm, and 10 or 16 layers of viscoelastic tape wrapped around thecentral polymer sheet. The thickness of the polymer sheets and the number of layers of viscoelastic tape affected both the stiffnessand the damping of the absorber.
The LTVAs were characterised by performing free response vibration tests such as the one displayed in figure 9(a) for the LTVAm54-30-50-30-16T. The amount of damping in the system and the shearing between the layers lead to asymmetric oscillations anddrift so a special peak-picking routine was developed to measure the damping and the frequency. Instead of tracking the changes ofsign to identify the successive periods, each cycle’s period is computed from the extrema of the signal and the logarithmic decrementis computed from the average amplitude of each cycle defined as (Amax − Amin)/2. An exponential fitting of the amplitude atsuccessive cycles was also carried out to identify the damping and the two methods gave similar damping estimates. To ensure thatthe drift of the response had little effect on the damping identification procedure, all the free response tests were repeated with bothpositive and negative initial displacements.
Figure 9(b) plots the frequencies and dampings obtained from of all the LTVA free response tests. The frequency varies from 2.3 Hzto 4.5 Hz and the damping between 5 % and 16 %. The names mxx-yy-yy-yy-zzT are related to the composition of the beam:mxx gives the mass in grams, yy denotes the thicknesses of the polymer sheets and zzT indicates the amount of viscoelastic tapelayers placed in the sandwich. The errorbars indicate the standard deviation of the damping and frequencies measured from the freeresponse tests. The LTVA with the higher frequency also featured the higher damping. It was found impossible to build an LTVAwith low frequency and high damping, as increasing the number of viscoelastic tape layers increased both the damping and stiffnessof the beams. Increasing the mass was not always possible because a high enough mass would cause buckling.
5 NUMERICAL AND EXPERIMENTAL AEROELASTIC ANALYSIS OF THE PRIMARY SYSTEM COUPLED WITHTHE LTVA
5.1 Effect of the LTVA on the flutter speed
In the wind tunnel the critical flutter speed was defined as the first airspeed at which LCOs were clearly observed. Both increasingand decreasing airspeed tests were carried out to search for hysteresis effects. No such effects were observed, suggesting that allbifurcations were supercritical.
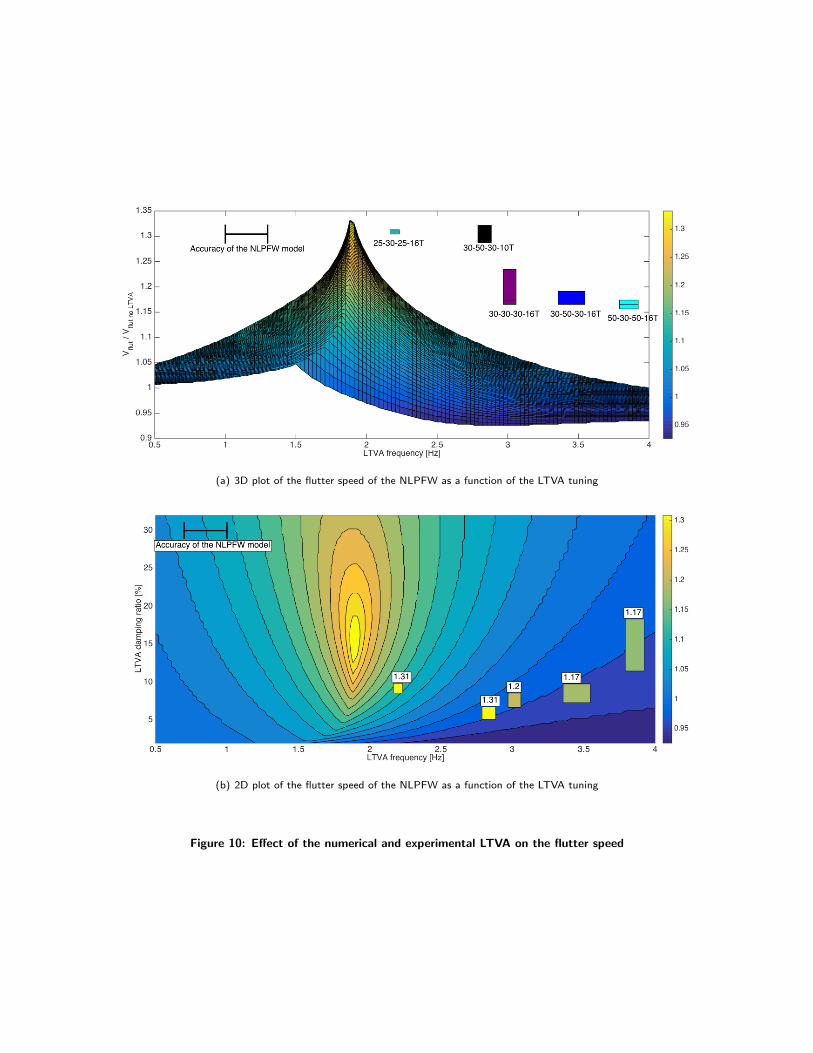
The flutter speed was also estimated from the mathematical model, for a very wide range of LTVA frequencies and damping ratios.The solid surface on figure 10 plots the results of this calculation; the flutter speed is plotted as a ratio of flutter speeds with andwithout LTVA. All the results in the figure were obtained for a LTVA mass of 64 grams (≈ 2.3% mass ratio). The experimentalflutter speeds are plotted on the same axes. Figure 10(b) plots the same data seen from above, so that the effect of both frequencyand damping ratio on the flutter speed is displayed.
The mathematical model predicts a maximum increase in flutter speed of 34%. This optimum is obtained at 1.892 Hz and 14.47% damping and quickly decreases as the LTVA gets detuned. The flutter speed is very sensitive to LTVA frequency; a frequencychange of 0.1 Hz can lead to a decrease in non-dimensional flutter speed from 1.34 to 1.24. The sensitivity to damping ratio ismuch lower. The LTVAs tested in the wind tunnel showed similar optimum flutter speeds, however the results appeared to be farless sensitive to detuning than in the case of the mathematical model. The cyan LTVA, for instance, was supposed to be completelydetuned according to the model yet it yielded a commendable increase in flutter speed of 17% in the wind-tunnel. There are severalpossible reasons for the difference between the detuning behaviour of the experiment and the mathematical model:
1. The LTVA structural damping may be nonlinear in practice but is modelled as linear.
2. The flow around the LTVA is not modelled but may have an affect on the absorber’s effectiveness.
3. The difference between the modelled LTVA (rigid body rotation) and the experimental absorber (cantilever beam) may betoo pronounced.
Finally it must be noted that the higher the damping the lower the sensitivity to frequency tuning. For a real life application it mightbe better to tune the LTVA to a damping higher than its optimum value.
5.2 Effect of the LTVA on the subcritical response of the system
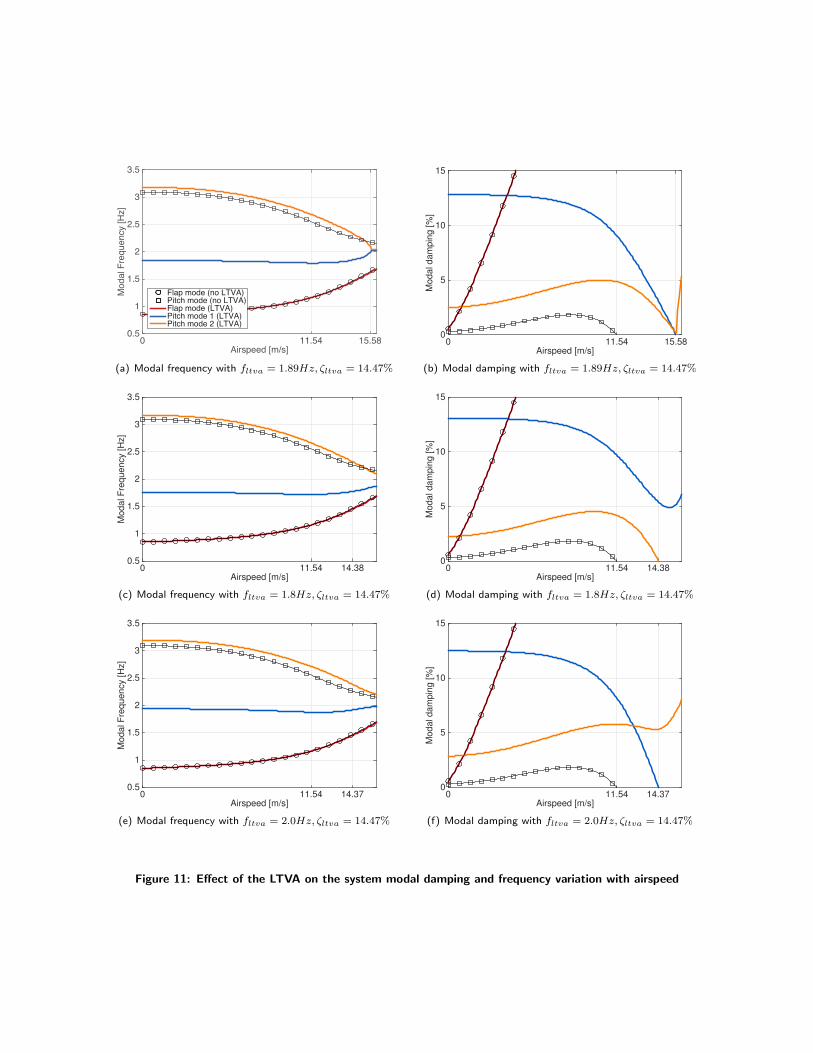
The mechanism leading to an optimum tuning was investigated by studying numerically the effect of the LTVA on the variations ofthe modal frequencies and damping ratios with airspeed. These are variations are plotted in figure 11. The absorbers consideredhave mass mltva = 64 grams, damping ζltva = 14.47 % and frequencies 1.892 Hz, 1.8 Hz and 2.0 Hz respectively from top tobottom.
Figures 11(a) and 11(b) display the results with an optimum LTVA. The system with absorber has three modes:
• Mode a: mostly flap motion (red).
• Mode b: in phase pitch and LTVA motion (blue).
• Mode c: out of phase pitch and LTVA motion (orange).
The absorber splits the uncontrolled system’s pitch mode (black squares) into modes b and c (orange and blue) and has very loweffect on the flap mode (black circles and red), because the flap inertia is larger than the pitch inertia and the LTVA is close to theflap axis and far from the pitch axis. Flutter occurs at 15.58m/s on the system with LTVA. At flutter modes b and c have the samefrequency and are essentially a single mode. The damping figure shows that again, modes b and c nearly merge at flutter.
Figures 11(c) & 11(d) plot the effect of a slightly undertuned LTVA (1.8Hz). In this case mode c leads to flutter alone and doesnot merge with mode b at flutter. Figures 11(e) & 11(f) finally show the effect of a slightly overtuned LTVA (2.0Hz). In this case,mode b leads to flutter alone and once again no frequency matching of modes b and c occurs.
The fact that, for optimal LTVA tuning, modes b and c undergo flutter simultaneously, resembles the classical Den Hartog’s criterionfor optimisation of LTVA for forced vibration, where the optimum corresponds to two equally high resonant peaks. This suggeststhat equating the flutter speed of the pitch modes could indeed be used to calculate the optimal tuning. Although up to nowthis conclusion is supported only by numerical calculations, in [15] a similar result was obtained for a LTVA applied to a van derPol-Duffing oscillator.
5.3 Effect of the LTVA on the supercritical response of the system
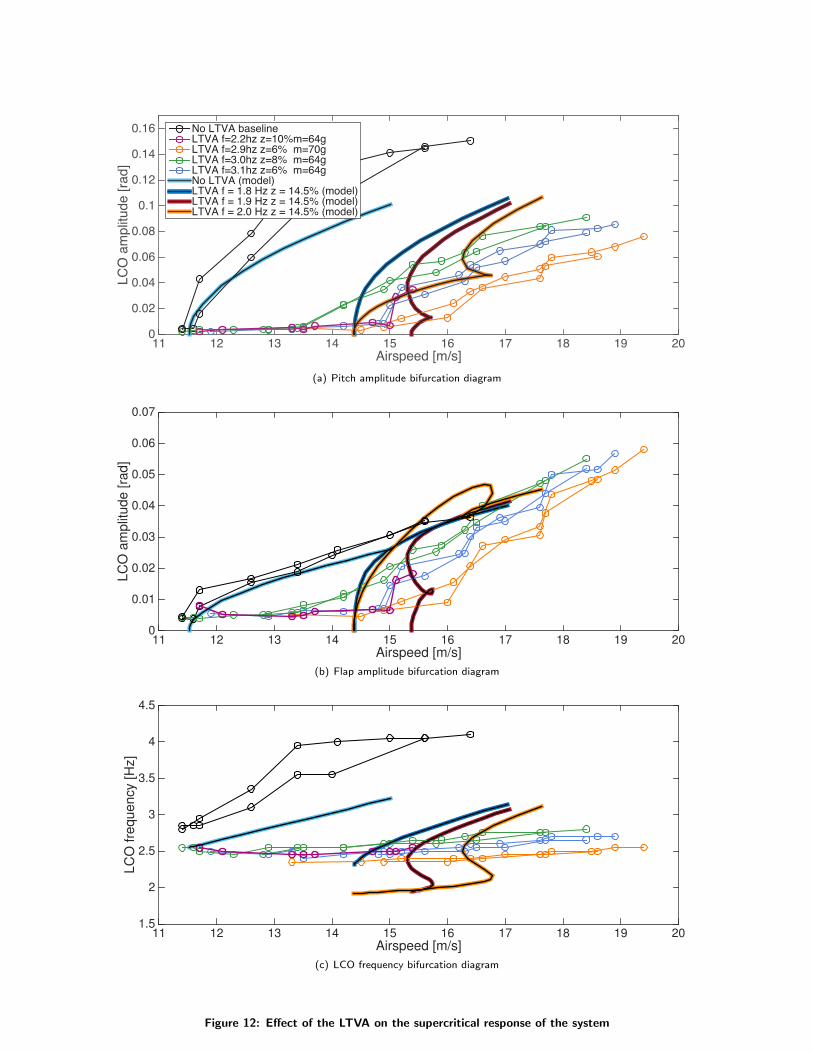
Figure 12 displays experimental and numerical bifurcation diagrams in pitch LCO amplitude (12(a)), flap LCO amplitude (12(b))and LCO frequency (12(c)). The circles correspond to wind tunnel experiments with velocity sweeps up and down that did not showany hysteretic behaviour in any of the cases investigated. The thick lines show continuation computations from the model withthree different LTVA frequencies, namely 1.8, 1.89 and 2.0 Hz, where 1.89 Hz corresponds to the optimal tuning.
The pitch bifurcation diagram plotted in figure 12(a) already provides most of the information. The model showed that the 1.8 HzLTVA (dark blue) improves the flutter speed and barely changes the shape of the bifurcation. In this case the absorber is alreadydetuned when flutter occurs. The 1.89 Hz LTVA (dark red) is the optimum case for increasing the flutter speed, however it featuresa narrow region of bi-stable solutions due to fold bifurcations occurring when the absorber is detuned. Finally the 2.0Hz absorber(orange) leads to flutter at 14.3 m/s then decreases the amplitude of the ensuing LCOs until it gets detuned and the response jumpsto a large amplitude limit cycle.
The experiments showed similar performance in flutter speed however no detuning was observed in the wind tunnel and the shapeof the bifurcation branches is quite different because of the nonlinear damping, the effect of the airflow on the absorber and thedifference in LTVA geometry. The light blue and orange curves correspond to the same LTVA beam with masses of 64 and 70 gramsrespectively. They show that an increase in mass of just 10% leads to a decrease in LCO amplitude of roughly 25%. Moreover theheavier case leads to a smoother amplitude variation with airspeed close to the flutter speed. The purple line corresponds to theLTVA with the lowest frequency we could achieve, which should be the best one according to the model. In practice however itshowed performance similar to the blue one. Furthermore, the maximum airspeed tested with this LTVA was lower than usual due toimpacts phenomena between the absorber and the primary structure. Finally, the green curve corresponds to another intermediateLTVA that should have performed better than the blue one, according to the model, but which showed slightly worse performance.
Figure 12(b) displays the bifurcation diagrams of the system in flap amplitude. The model shows that the undertuned (dark blue)and optimum LTVAs (dark red) rapidly reach the amplitude of the system without absorber, and have a detrimental effect on theflap response. The overtuned LTVA (orange) leads to oscillations of larger amplitude until it is detuned, then it jumps down to theamplitude experienced by the system the with other absorbers. The experiments, on the other hand, featured a smooth increase inamplitude and a better performance than the system without absorber up to 16.5m/s. Beyond this airspeed we did not take anymeasurements without absorber for safety reasons.
The variation of the LCO frequency plotted in figure 12(c) features significant differences after the addition of the LTVA. Accordingto the experimental results, all the absorbers decreased the frequency of the oscillations. Furthermore, the limit cycle frequency variedvery little with airspeed. The mathematical model showed that only the optimum and overtuned LTVAs decrease the frequency,for as long as they remain tuned (i.e. near the flutter speed and at low LCO amplitudes). The undertuned absorber has very littleeffect on the frequency. Once again, it appears that the experimental LTVAs remain tuned over a much wider airspeed range thanthe mathematical ones.
Considering the uncertainties in the LTVA identification and the complexity of the phenomena that occur in the wind tunnel, thepredictions of the model are satisfactory. Finally, none of the experimental bifurcation diagrams performed with a LTVA attachedto the system exhibited the jump due to stall-flutter. The increased damping and lower oscillation frequency is probably the reason.
6 CONCLUSIONS
The main purpose of this study was to demonstrate experimentally the effectiveness of the LTVA in delaying flutter and theappearance of limit cycle oscillations. Both the experiments and the mathematical model showed an improvement of about 30% ofthe flutter speed with a damper mass of around 2.3 % of the mass of the full system.
The mathematical model demonstrated that optimal flutter delay occurs when the LTVA is tuned such that two of the system modesflutter simultaneously at the same airspeed. However, the effectiveness of the LTVA decreases steeply as the natural frequency ofthe absorber moves away from an optimum tuned value.
The major difference between the model and the experiments was the sensitivity of the LTVA to its tuning parameters. Absorbersthat were totally detuned according to the model showed very good performance in the wind tunnel, which is encouraging forfuture experimental studies and applications. Furthermore, all the LTVAs suppressed the stall flutter phenomenon that occurs in theuncontrolled system.
Finally, it must be noted that this study considered a single LTVA position. The effects of the position of the LTVA on optimumtuning rules and effectiveness will be investigated in the future. Furthermore, the effect of the introduction of a nonlinear restoringforce in the LTVA (leading to a nonlinear tuned vibration absorber [15−17]) will be assessed, with the objective of improving thesupercritical response of the system.
7 ACKNOWLEDGMENTS
The authors would like to acknowledge the financial support of the European Union (ERC Starting Grant NoVib 307265).
References
[1] Nagase, T. and Hisatoku, T. (1992). Tuned-pendulum mass damper installed in crystal tower. The Structural Design of TallBuildings, 1(1), 35–56.
[2] Lu, X., Li, P., Guo, X., et al. (2014). Vibration control using atmd and site measurements on the shanghai world financialcenter tower. The Structural Design of Tall and Special Buildings, 23(2), 105–123.
[3] Gu, M., Chang, C., Wu, W., et al. (1998). Increase of critical flutter wind speed of long-span bridges using tuned mass dampers.Journal of Wind Engineering and Industrial Aerodynamics, 73(2), 111–123.
[4] Dallard, P., Fitzpatrick, A., Flint, A., et al. (2001). The london millennium footbridge. Structural Engineer, 79(22), 17–21.
[5] Gu, M., Chang, C., Wu, W., et al. (1998). Increase of critical flutter wind speed of long-span bridges using tuned mass dampers.Journal of Wind Engineering and Industrial Aerodynamics, 73(2), 111–123.
[6] Lin, Y.-Y., Cheng, C.-M., and Lee, C.-H. (2000). A tuned mass damper for suppressing the coupled flexural and torsionalbuffeting response of long-span bridges. Engineering structures, 22(9), 1195–1204.
[7] Chen, X. and Kareem, A. (2003). Efficacy of tuned mass dampers for bridge flutter control. Journal of Structural Engineering,129(10), 1291–1300.
[8] Casalotti, A., Arena, A., and Lacarbonara, W. (2014). Mitigation of post-flutter oscillations in suspension bridges by hysteretictuned mass dampers. Engineering Structures, 69, 62–71.
[9] INGRAM, C. and SZWARC, W. (1976). Passive flutter suppression. Journal of Aircraft, 13(7), 542–543.
[10] Karpel, M. (1981). Design for active and passive flutter suppression and gust alleviation, vol. 3482. National Aeronautics andSpace Administration, Scientific and Technical Information Branch.
[11] Bisplinghoff, R., Ashley, H., and Halfman, R. (1996). Aeroelasticity. Dover Publications Inc.
[12] Fung, Y. (1993). An introduction to the Theory of Aeroelasticity. Dover Publications Inc.
[13] Lee, B., Gong, L., and Wong, Y. (1997). Analysis and computation of nonlinear dynamic response of a two-degree-of-freedomsystem and its application in aeroelasticity. Journal of Fluids and Structures, 11, 225–246.
[14] Dimitriadis, G. (2008). Numerical continuation of aeroelastic systems: Shooting vs finite difference approach. In RTO-MP-AVT-152 Limit Cycle Oscillations and Other Amplitude-Limited Self-Excited Vibrations, AVT-152-025. Loen, Norway.
[15] Habib, G. and Kerschen, G. (2015). Suppression of limit cycle oscillations using the nonlinear tuned vibration absorber. InProceedings of the Royal Society of London A: Mathematical, Physical and Engineering Sciences, vol. 471. The Royal Society,p. 20140976.
[16] Habib, G., Detroux, T., Viguie, R., et al. (2015). Nonlinear generalization of den hartog»ş s equal-peak method. MechanicalSystems and Signal Processing, 52, 17–28.
[17] Detroux, T., Habib, G., Masset, L., et al. (2015). Performance, robustness and sensitivity analysis of the nonlinear tunedvibration absorber. Mechanical Systems and Signal Processing, 60, 799–809.
(a) 3D plot of the flutter speed of the NLPFW as a function of the LTVA tuning
(b) 2D plot of the flutter speed of the NLPFW as a function of the LTVA tuning
Figure 10: Effect of the numerical and experimental LTVA on the flutter speed
Airspeed [m/s]0 11.54 15.58
Mo
da
l F
req
ue
ncy [H
z]
0.5
1
1.5
2
2.5
3
3.5
Flap mode (no LTVA)Pitch mode (no LTVA)Flap mode (LTVA)Pitch mode 1 (LTVA)Pitch mode 2 (LTVA)
(a) Modal frequency with fltva = 1.89Hz, ζltva = 14.47%Airspeed [m/s]
0 11.54 15.58
Modal dam
pin
g [%
]
0
5
10
15
(b) Modal damping with fltva = 1.89Hz, ζltva = 14.47%
Airspeed [m/s]0 11.54 14.38
Modal F
requency [H
z]
0.5
1
1.5
2
2.5
3
3.5
(c) Modal frequency with fltva = 1.8Hz, ζltva = 14.47%Airspeed [m/s]
0 11.54 14.38
Modal dam
pin
g [%
]
0
5
10
15
(d) Modal damping with fltva = 1.8Hz, ζltva = 14.47%
Airspeed [m/s]0 11.54 14.37
Modal F
requency [H
z]
0.5
1
1.5
2
2.5
3
3.5
(e) Modal frequency with fltva = 2.0Hz, ζltva = 14.47%Airspeed [m/s]
0 11.54 14.37
Modal dam
pin
g [%
]
0
5
10
15
(f) Modal damping with fltva = 2.0Hz, ζltva = 14.47%
Figure 11: Effect of the LTVA on the system modal damping and frequency variation with airspeed
Airspeed [m/s]11 12 13 14 15 16 17 18 19 20
LC
O a
mp
litu
de
[ra
d]
0
0.02
0.04
0.06
0.08
0.1
0.12
0.14
0.16 No LTVA baselineLTVA f=2.2hz z=10%m=64gLTVA f=2.9hz z=6% m=70gLTVA f=3.0hz z=8% m=64gLTVA f=3.1hz z=6% m=64gNo LTVA (model)LTVA f = 1.8 Hz z = 14.5% (model)LTVA f = 1.9 Hz z = 14.5% (model)LTVA f = 2.0 Hz z = 14.5% (model)
(a) Pitch amplitude bifurcation diagram
Airspeed [m/s]11 12 13 14 15 16 17 18 19 20
LC
O a
mplit
ude [ra
d]
0
0.01
0.02
0.03
0.04
0.05
0.06
0.07
(b) Flap amplitude bifurcation diagram
Airspeed [m/s]11 12 13 14 15 16 17 18 19 20
LC
O fre
quency [H
z]
1.5
2
2.5
3
3.5
4
4.5
(c) LCO frequency bifurcation diagram
Figure 12: Effect of the LTVA on the supercritical response of the system