Embed Size (px)
Citation preview

FLOWERING OF BOUGAINVILLEA ‘AFTERGLOW’: ENVIRONMENTAL TRIGGERS AND THEIR HORMONAL RESPONSES
By
MUN WYE CHNG
A DISSERTATION PRESENTED TO THE GRADUATE SCHOOL OF THE UNIVERSITY OF FLORIDA IN PARTIAL FULFILLMENT
OF THE REQUIREMENTS FOR THE DEGREE OF DOCTOR OF PHILOSOPHY
UNIVERSITY OF FLORIDA
2017

© 2017 Mun Wye Chng

To the Moore Lab Group

4
ACKNOWLEDGMENTS
The completion of this dissertation could not have been possible without the
guidance of my adviser and committee chair, Dr. Kimberly A. Moore. Her well-timed
advice was vital to keeping me on track and focused on the important details of this
project. I am also grateful for the critiques and shared knowledge of my committee
members, Dr. Timothy K. Broschat, Dr. Gail M. Hansen de Chapman, and Dr. William
Kern, Jr. Dr. Broschat’s precise questions regarding statistical presentation was
particularly important for me. I also thank Dr. Hanzhuo Fu “Andy”, for his enormous
assistance in working out of the protocols required for mass-spectrometry analysis in
this research project, as well as my partner in the chemistry lab, Dr. Samar Shawaqfeh.
I thank Dr. Ragab Salama Taha of Fayoum University, without whom a key component
of this project would have been missed. I also thank Luci Fisher for her invaluable
assistance in the greenhouse, as well as her personal friendship from day one of this
journey. I would also like to acknowledge that this dissertation could not have been
possible without funding support from the Ministry of National Development and
National Parks Board (Singapore). Finally, I thank my family – the one in Singapore, for
enduring four years of physical separation by 10,500 nautical miles and the emotional
distance that at times seemed even greater; and the one in Florida, for supporting me
through this endeavor, and helping me become truly aware of myself.

5
TABLE OF CONTENTS page
ACKNOWLEDGMENTS .................................................................................................. 4
LIST OF FIGURES .......................................................................................................... 8
LIST OF ABBREVIATIONS ........................................................................................... 10
ABSTRACT ................................................................................................................... 11
CHAPTER
1 RATIONALE ........................................................................................................... 13
Introduction ............................................................................................................. 13 Objectives ............................................................................................................... 15
2 LITERATURE REVIEW .......................................................................................... 16
Photoperiod and Flowering ..................................................................................... 16
Phytohormones and Flowering ............................................................................... 19 Gibberellic Acid (GA) ........................................................................................ 20 Abscisic Acid (ABA) .......................................................................................... 22
Ethylene ........................................................................................................... 27 Hypotheses ............................................................................................................. 29
3 OPTIMAL PHOTOPERIOD FOR FLOWERING OF BOUGAINVILLEA ‘AFTERGLOW’ ....................................................................................................... 31
Introduction ............................................................................................................. 31 Materials and Methods............................................................................................ 33
Results .................................................................................................................... 35 Discussion .............................................................................................................. 36
4 EFFECT OF VARYING ETHEPHON RATE APPLICATIONS ON FLOWERING OF BOUGAINVILLEA ‘AFTERGLOW’ .................................................................... 39
Introduction ............................................................................................................. 39 Materials and Methods............................................................................................ 39
Results .................................................................................................................... 41 Discussion .............................................................................................................. 41
5 EFFECTS OF WATER STRESS, HORMONES, AND PHOTOPERIOD ON FLOWERING OF BOUGAINVILLEA ‘AFTERGLOW’ ............................................. 44
Introduction ............................................................................................................. 44

6
Materials and Methods............................................................................................ 44
Results .................................................................................................................... 47
Discussion .............................................................................................................. 47
6 HORMONES, FLOWERING AND ABA LEVELS .................................................... 52
Introduction ............................................................................................................. 52 Materials and Methods............................................................................................ 54 Results .................................................................................................................... 58
Flowering and Growth ...................................................................................... 58 ABA Levels ....................................................................................................... 58
Discussion .............................................................................................................. 62 Summary ................................................................................................................ 64
7 PHOTOPERIOD, EXOGENOUS ABA AND ETHYLENE EFFECTS ON FLOWERING AND ENDOGENOUS GIBBERELLIC ACID IN BOUGAINVILLEA ‘AFTERGLOW’ ....................................................................................................... 73
Introduction ............................................................................................................. 73 Materials and Methods............................................................................................ 74
ABA determination ........................................................................................... 76 GA determination ............................................................................................. 78
Results .................................................................................................................... 80 Flowering Response ......................................................................................... 80 ABA Levels ....................................................................................................... 81
GA Levels ......................................................................................................... 81
Discussion .............................................................................................................. 83 Summary ................................................................................................................ 85
8 CONCLUSION ........................................................................................................ 93
APPENDIX
A PRELIMINARY EXPERIMENT ON INDUCTION OF FLOWERING BY WATER STRESS ................................................................................................................. 95
Introduction ............................................................................................................. 95 Materials and Methods............................................................................................ 95 Results .................................................................................................................... 96
B ETHYLENE CONCENTRATION DATA FROM CHAPTER 6 .................................. 98
LITERATURE CITED .................................................................................................. 100
BIOGRAPHICAL SKETCH .......................................................................................... 106

7
LIST OF TABLES Table page 3-1 Effect of photoperiod and relative growth on number of inflorescences on
Bougainvillea ‘Afterglow’ in December 2015. n=30. (*) indicates significant difference at α=0.05 ............................................................................................ 38
3-2 Effects of photoperiod on number of inflorescences and relative growth of Bougainvillea ‘Afterglow’ in December 2015. Means in the same column followed by the same letters are not significantly different at α=0.05. n=30. ....... 38
4-1 ANOVA results of mean plant size and number of inflorescences at 30 days after treatment with increasing concentration of ethephon. (*) indicates statistical difference at α=0.05. (n=30). ............................................................... 43
5-1 Tukey’s HSD Means separation of number of inflorescences under 6 different treatments and control (LD – No WS, No PGR). Treatments followed by the same letters are not significantly different at α=0.05, n=70 ................................ 51
6-1 Means and standard deviation of number of inflorescences produced by Bougainvillea ‘Afterglow’ under two photoperiods and six hormone treatments. N=56. Means followed by the same letter were not significantly different at α=0.05. ............................................................................................. 65
7-1 Means number of inflorescences. Means followed by the same letter are not significantly different to each other at α=0.05. NS=not significantN=65 .............. 92

8
LIST OF FIGURES
Figure page 2-1 Phytochrome Interaction Factors (PIF) under far-red light (710-730 nm) or
dark conditions (above), and red light (650-680 nm) or bright conditions (below). Drawing by Mun Wye Chng. ................................................................. 18
2-2 Gibberellic acid closes the ‘lid’ of the GID1 receptor, causing DELLA protein degradation and releasing transcription factor (Hedden, 2008). ......................... 21
4-1 Effect of increasing ethephon concentration on number of inflorescences in Bougainvillea ‘Afterglow’ under 14-hour photoperiod. The 150 µL/L rate was significantly more effective than the control (P=0.027). (n=30). .......................... 43
6-1 Relative growth response of Bougainvillea ‘Afterglow’ to increasing exogenous ABA application rates under short-day and long-day photoperiods (n=32) ................................................................................................................. 65
6-2 Relative growth response of Bougainvillea ‘Afterglow’ to increasing rates of ethephon under short-day and long-day photoperiods (n=32). ........................... 66
6-3 Abundance of abscisic acid (ABA) in plants grown under SD (8-hour) photoperiod, over 14 days after exogenous ABA treatment. (trt= treatment, aba=abscisic acid, 75=75 µL/L, 150=150 µL/L, 300=300 µL/L, n=32) ................ 67
6-4 Abundance of abscisic acid (ABA) in Bougainvillea ‘Afterglow’ grown under SD (8-hour) photoperiod, over 14 days after ethephon treatment. (eth=ethephon, 075=75 µL/L, 150=150 µL/L, 300=300 µL/L, n=32) ................... 68
6-5 Abundance of abscisic acid (ABA) in Bougainvillea ‘Afterglow’ grown under LD (14-hour) photoperiod, over 14 days after exogenous ABA treatment. (075=75 µL/L, 150=150 µL/L, 300=300 µL/L, n=32) ........................................... 69
6-6 Abundance of abscisic acid (ABA) in Bougainvillea ‘Afterglow’ grown under LD (14-hour) photoperiod, over 14 days after ethephon treatment. (075=75 µL/L, 150=150 µL/L, 300=300 µL/L, n=32) ......................................................... 70
6-7 Change in endogenous ABA levels under increasing rates of ethephon application (n=32) ............................................................................................... 71
6-8 Change in endogenous ABA levels in Bougainvillea ‘Afterglow’ in response to increasing rates of exogenous ABA application under short-day and long-day photoperiods (n=32). .......................................................................................... 72
7-1 Number of inflorescences on Bougainvillea ‘Afterglow’ under increasing rates of ethephon application (n=30). .......................................................................... 86

9
7-2 Number of inflorescences in Bougainvillea ‘Afterglow’ under increasing rate of exogenous ABA applications (n=30)............................................................... 87
7-3 Endogenous levels of ABA in Bougainvillea ‘Afterglow’ under short-day and long-day photoperiods (n=10) ............................................................................. 88
7-4 Change in endogenous ABA levels in Bougainvillea ‘Afterglow’ under increasing ABA application rates. ....................................................................... 89
7-5 Change in endogenous ABA in Bougainvillea ‘Afterglow’ under increasing rates of ethephon application. (n=30). ................................................................ 90
7-6 Change in endogenous gibberellic acid (GA) levels in Bougainvillea ‘Afterglow’ under increasing rates of ethephon (n=30). ...................................... 91
A-1 Stomatal conductance and mean inflorescences under varying levels of drought stress. Error bars indicate standard errors.(n=35) ................................. 96
B-1 Ethylene levels (parts per million) on day 1, day 14, day 28 after treatment, under varying rates of exogenous ABA application. There were no differences between treatments and photoperiod. ▲= Short-day, ■ = Long-day, solid line = linear regression for short-day, dotted line = linear regression for long-day......................................................................................................... 98
B-2 Ethylene levels (parts per million) on day 1, day 14, day 28 after treatment, under varying rates of exogenous ethephon application. There were no differences between treatments and photoperiod. ▲= Short-day, ■ = Long-day, solid line = linear regression for short-day, dotted line = linear regression for long-day......................................................................................................... 99

10
LIST OF ABBREVIATIONS
µg Microgram
µL Microliter
ABA Abscisic acid
DI De-ionized water
GA3 Gibberellic Acid
GC-MS Gas Chromatograph-Mass Spectrometry
H Height of plant
HCl Hydrochloric Acid
L Liter
LD Long Day
LDP Long Day Plant
Pfr Phytochrome far-red
PGR Plant Growth Regulator(s)
Pr Phytochrome red
SD Short Day
SDP Short Day Plant
TMSD Trimethylsilyldiazomethane
VCT Volatile Compound Trap
VPE Vapor-Phase Extraction
W1 Width at widest part of plant
W2 Width perpendicular to W1
WS Water Stress

11
Abstract of Dissertation Presented to the Graduate School of the University of Florida in Partial Fulfillment of the Requirements for the Degree of Doctor of Philosophy
FLOWERING OF BOUGAINVILLEA ‘AFTERGLOW’: ENVIRONMENTAL TRIGGERS
AND THEIR HORMONAL RESPONSES By
Mun Wye Chng
August 2017
Chair: Kimberly A. Moore Major: Horticultural Sciences
Bougainvillea cultivars are widely used in tropical ornamental landscapes for their
floral displays. Flowering response in bougainvillea is typically photoperiod dependent.
However, in tropical climates, photoperiod variation may be insufficient to stimulate
uniform flowering response in the landscape, resulting in patchy floral displays. This
study seeks to identify the mechanism behind apparent environmental triggers that have
been observed to trigger flowering in the absence of photoperiod variation.
Bougainvillea ‘Afterglow’ cuttings were grown under various treatments within an
open-sided greenhouse in Davie, Florida. Environmental conditions such as
photoperiod, water availability and temperature were controlled in various experiments.
Additional treatments were the application of exogenous the plant hormones ethylene in
the form of ethephon (2-chloroethylphosphonic acid), and abscisic acid (ABA).
Endogenous levels of ABA were determined using gas chromatography to separate
trimethylsilylated esters of ABA from leaf tissue extracts, and measuring the ion
fragments using mass spectrometry. Endogenous gibberellic acid (GA) was measured
using ultra-violet spectrophotometry of filtered leaf tissue extracts. Growth and number

12
of inflorescences were recorded for each experiment, which ran on average for thirty
days. Statistical analyses were performed using the R software package.
Bougainvillea ‘Afterglow’ was found to be a strongly photoperiodic short-day (SD)
plant, with an inductive photoperiod of 8 hours, and an inhibitory long-day (LD)
photoperiod of 14 hours. Application of ethephon to plants under SD improved flowering
response, and was less effective on plants under LD. Application of ABA to plants under
SD improved flowering response as well, but had no effect on plants under LD. GA was
found to decline in plants that flowered, regardless of whether they were induced by
photoperiod or by exogenous hormones. ABA also declined in plants that flowered.
Ethephon appeared to promote flowering in Bougainvillea by regulating both ABA and
GA levels. GA regulation of flowering response in Bougainvillea appeared to contradict
the DELLA-protein dependent pathway described for the LD plant, Arabidopsis thaliana.

13
CHAPTER 1 RATIONALE
Introduction
Scientific studies related to the flowering of horticultural plants in tropical and
subtropical zones of the world, including the United States, have largely focused on the
economically important tropical fruit crops of several key genera, namely Mangifera
(mango) (Núñez-Elisea and Davenport, 1994; Ramírez and Davenport, 2010), Citrus
(Koshita and Takahara, 2004) and Litchi (lychee) (Menzel, 1983), but less attention has
been paid to woody ornamentals.
Ornamental crops in the tropics, as in any climate, can be generally classified
into foliage crops and floral crops. The difference between tropical/sub-tropical and
temperate floral crops from a landscape design point of view is the seasonality of
flowering, and the respective environmental stimuli that trigger flowering. In high
latitudes, day length (photoperiod) and temperature (vernalization) are the predominant
cues that signal plants to enter reproductive phase. At lower latitudes, especially in
areas with distinct wet/dry seasonal variations, the trigger is often water availability. In
areas without significant variation in water availability, intensity of solar radiation has
been suggested as the trigger for some species to flower (Yeang, 2007).
One of the most commonly found landscape shrubs planted in Singapore is
bougainvillea (Bougainvillea spp.). It is an evergreen perennial native to tropical South
America. It was named for Louis Antoine de Bougainville, a French navigator and
military commander who was the first European to take note of the plant, in Brazil, in
1768 (Kobayashi et al., 2007). It has small, rather insignificant flowers typically
subtended by three colorful bracts, borne in apical panicles on the current year wood

14
(Ma and Gu, 2010). It is a very widespread and popular landscape ornamental plant in
tropical and sub-tropical zones around the world, greatly valued for its vigor and relative
resistance to pests, disease and drought, bright floral display of colorful bracts, and
variability in form as it can be planted as a shrub, standard, espaliered, or trained onto a
trellis.
Singapore has an equatorial climate which is characterized by consistently high
temperatures (average night/day temperatures of 25/31°C) and high rainfall (average
total annual rainfall of 2342.5mm out of 178 rain days evenly distributed over the year)
(National Environment Agency, 2017.). It also has an annual day length variation of
roughly 9 minutes, although sunrise (and concurrently sunset) shift roughly 30 minutes
throughout the year (Yeow, 2002). Because of this, many tropical flowering trees and
shrubs planted in the city do not flower as predictably as they do in climates with more
pronounced seasonality.
In Singapore’s climate, Bougainvillea exhibits an unpredictable and sporadic
flowering pattern due to the lack of distinct seasonality. In sub-tropical climates like
Florida, it flowers in fall to late spring, when the daylength is relatively short, night-time
temperatures are above 21°C, and rainfall is reduced. One horticulturally significant
characteristic of Bougainvillea is its tendency to flower more profusely when under a
moderate level of drought stress. Drought stress has been successfully deployed to
induce flowering in tropical and subtropical fruit trees such as mango (Mangifera indica)
(Núñez-Elisea & Davenport 1994), and lime (Citrus latifolia) (Southwick & Davenport
1986). Some Bougainvillea growers employ this technique to encourage flowering. Most
growers rely on trial and error to figure out the practical level of drought stress that suits

15
the purposes of their crop production (Jamie Modlin, grower - personal communication).
In the case of Bougainvillea, the general practice is to allow the planting media to dry
out in between watering. Growers understand that there is a correlation between
drought stress and bud initiation in these plants, but the underlying reason for this
physiological response has not been explored in the literature.
Objectives
The fundamental goal of this project was to identify a common denominator
linking the various environmental cues to flowering in Bougainvillea, and to determine
the dominant environmental factors required for flowering to occur. A secondary
objective was to use different methods to induce flowering under sub-optimal
environmental conditions.

16
CHAPTER 2 LITERATURE REVIEW
Photoperiod and Flowering
Many flowering plants use environmental cues to regulate the transition from
vegetative growth to sexual reproduction (Yeang, 2007). Multiple individuals of the
same species need to flower at the same time for pollination to occur with the highest
possible rate of outcrossing to ensure genetic diversity. To do so, environmental cues
are taken to signal optimal times for flowering. The major variables that serve this
function are photoperiod, temperature, and water availability (Rivera and Borchert,
2001; Yeang, 2007).
Photoperiodism is defined as "...the ability of an organism to detect day length..."
(Taiz and Zeiger, 2010). Plants that have evolved to grow at latitudes where there are
annual variations in daylength may exhibit the ability to detect these variations in
daylight hours through the year, if the completion of their reproductive cycle is
dependent on time-sensitive flowering, (during periods with high pollinator activity).
Plants can be classified in terms of their photoperiodic responses. Short-day plants
(SDP) flower during short days (qualitative SDP), or their flowering may be increased or
expedited by short days (quantitative SDP). Long-day plants (LDP) flower only during
long days, or flowering is increased by longer days. Day-neutral plants flower equally
regardless of daylengths.
The ability of plants to sense daylength is dependent on two components – the
ability to detect light, and the ability to “keep time” internally (circadian cycle). The first
component is photosensitivity, which is enabled by the presence of phytochromes in
plant leaf cells. Several different phytochromes form a family of protein-pigment
17
photoreceptors. Phytochromes exist in two forms. Phytochrome red (Pr) is located in the
cytoplasm and is inactive, and Phytochrome far-red (Pfr) is located in the nucleus and is
active (see Fig. 2-1). Phytochromes toggle between both forms depending on the
amount and wavelength of light they receive. Pr is sensitive to red light (650 – 680nm),
and upon perceiving it, changes conformation and migrates to the nucleus as Pfr.
Likewise, Pfr is sensitive to far-red light (710 – 730nm), and upon perception,
undergoes conformational change and dephosphorylation, and converts to Pr.
Phytochrome-Interacting Factors (PIFs) are transcription factors that are
associated with phytochromes. They have been found to act as repressors of light-
activated genes, and promoters of dark-regulated genes (Taiz and Zeiger, 2010). The
current understanding, is that when Pf responds to red light during the day and converts
to Pfr, the Pfr induces phosphorylation and degradation of the PIFs, which in turn
remove the suppression of light-activated genes, thus allowing the physiological
responses induced by light exposure, such as shade avoidance, elongation, and
flowering (Schwechheimer and Willige, 2009; Taiz and Zeiger, 2010). (Fig. 2-1)

18
Figure 2-1. Phytochrome Interaction Factors (PIF) under far-red light (710-730 nm) or
dark conditions (above), and red light (650-680 nm) or bright conditions (below). Drawing by Mun Wye Chng.
Pr
Pr
Red light Pfr
Pfr
Nucleus
Cytoplasm
PIF
PIF
No transcription
(Inactive) (Active – moves into nucleus)
Pfr
Pfr
Pr
Far-red light
Pr Pfr
Nucleus
Cytoplasm
PIF
Transcription occurs
(Inactive)

19
Flowering in Bougainvillea has been studied for more than fifty years. Earlier
research had established that photoperiod was an important determinant in flowering
time (Joiner et al., 1962; Staden and Dimalla, 1980). Light intensity, cytokinin levels,
and their involvement in diverting metabolic assimilates away from shoots tips to axillary
buds have also been implicated in the flowering process of Bougainvillea (Even-Chen
and Sachs, 1980; Hackett and Sachs, 1984.; Ramina et al., 1979; Staden and Dimalla,
1980). Most Bougainvillea varieties in the literature have been found to be quantitative
SDP. These include B. sanderiana, B. glabra, B. spectabilis, ‘Rainbow Gold’, ‘San
Diego Red’, and ‘Raspberry Ice’(Even-Chen and Sachs, 1980; Joiner et al., 1962; Ma
and Gu, 2010; Steffen et al., 1988; Tse et al., 1974).
Phytohormones and Flowering
Photoperiod induction of flowering causes dramatic and complex alterations of
the long-distance signaling system in plants. Plants that do not require a photoperiod or
temperature to flower (so-called “autonomous flowering” plants) are usually sensitive to
irradiance. Photoperiod and irradiance are usually perceived by mature leaves in intact
plants (Rivera and Borchert, 2001). Temperature on the other hand, is perceived by all
parts of the plant, although vernalization or low temperature is usually perceived by the
shoot apex. Water availability is perceived by the root system (Bernier et al., 1993).
Plant response to environmental triggers are signaled by molecules known as
phytohormones, of which the classical ones are auxins, gibberellins, abscisic acid,
cytokinins and ethylene. The hormones thought to be related to the flowering response
are gibberellic acid, abscisic acid and ethylene

20
Gibberellic Acid (GA)
Gibberellic acid (GA) has been implicated in the flowering process. GA has been
known to play an important role in cell elongation since being discovered from the
spindly rice plants infected with Gibberella fujikuroi fungus. Besides stem elongation, it
also affects fruit and flower formation, dormancy of vegetative organs, and along with
ABA, the control of seed germination. Staden and Dimalla (1980) subjected
Bougainvillea ‘San Diego Red’ to three treatments: short day (SD) of 8h light and 16h of
uninterrupted dark, long day (LD) of 8h light and 16 dark interrupted by 4h of
incandescent light, and SD+GA, where plants were sprayed with 10 mg/L of gibberellic
acid (GA) before being subjected to the SD treatment. They found that LD treatment
suppressed flowering, and was correlated with high levels of cytokinin in the mature
leaves and shoot tips. The SD treatment enhanced floral development, and was
correlated with a lowered cytokinin level in the mature leaves and shoot tips, except for
the shoots where flower bud initiation had occurred. These shoot tips had the same
levels of cytokinins as the LD treatment plants. The combination of SD and GA
application yielded similar results as the LD treatment. The application of exogenous
GA overcame the restriction of cytokinin production in the roots, leading to the plants
exhibiting the same profile as the LD plants. The authors concluded that GA may play a
role in preventing the development of flower buds in Bougainvillea. This was supported
by other applied experiments using GA inhibitors. Paclobutrazol and dikegulac
promoted flowering under LD conditions in B. spectabilis (Karagüzel, 1999), daminozide
and chlormequat increased the number of flowers of ‘Raspberry Ice’ under LD
conditions (Ma and Gu, 2010), and dikegulac promoted flowering in ‘Rainbow Gold’
under decreasing daylengths (Norcini et al., 1992).

21
GA is also involved in circadian responses and photoperiodism. Spinach
(Spinacia oleracea) is a LDP that changes from juvenile to reproductive phase when
plants are moved from SD to LD. Application of exogenous GA under SD was shown to
simulate the LD effect (Zeevaart, 1971a). However, endogenous levels of GA were
similar under both SD and LD. This led to the suggestion that the SD inhibition of
flowering was due to other signaling molecules. However, recent studies have shown
that GA does play a role in regulating responses to light and photoperiod. The GA-
signaling in relation to light works via the suppression or activation of DELLA proteins
(Fig. 2-2). DELLA proteins are so named due to the D-E-L-L-A amino acid chain is
conserved in them. They are proteins that inhibit numerous GA-regulated responses. In
the absence of GA, DELLA proteins prevent PIFs from binding to their cognate
promoters and thereby preventing PIF-dependent transcriptional activation (Alabadí and
Blázquez, 2009; Lau and Deng, 2010; Schwechheimer and Willige, 2009). In the
presence of GA, the DELLA proteins are degraded, allowing the PIFs to activate the
related growth responses like germination, stem elongation and flowering. In this way,
GA appears to regulate flowering response - at least in LD plants - by releasing the
suppressive effect of DELLA proteins on PIFs (Cheng et al., 2004; Schwechheimer and
Willige, 2009).
Figure 2-2. Gibberellic acid closes the ‘lid’ of the GID1 receptor, causing DELLA protein degradation and releasing transcription factor (Hedden, 2008).

22
However, the relationship between GA, DELLA, PIFs and flowering in SD plants
is not as well described. The GA-DELLA pathway described above relates to
Arabidopsis thaliana, which is a LD plant. In that pathway, an increase in GA levels
would promote flowering, instead of inhibiting flowering like in Bougainvillea. The GA-
DELLA pathway an important nexus point between the signaling pathways of other
hormones, especially abscisic acid and ethylene (Colebrook et al., 2014). Therefore, it
is quite likely that the signaling pathways in SD plants between these three major
hormones is different but equally important. The first other major hormone to look at is
abscisic acid.
Abscisic Acid (ABA)
Water stress is another abiotic factor that has been found to promote flowering in
Bougainvillea (Kobayashi, et.al., 2007; Ma and Gu, 2010). This implicates the abiotic-
stress-response hormones ethylene and abscisic acid (ABA) in the flowering process.
Abscisic acid was named because it was originally thought to play an inhibitory
role in plant growth, induce abscission of plant parts, and control dormancy. While
exogenous application of ABA does sometimes inhibit growth, it also seems to promote
certain types of growth, such as in the protein synthesis in seeds. Therefore, its role is
likely to be much larger than previously thought (Mansfield, 1987).
ABA is found in all vascular plants. Within the plant, ABA has been found in all
major organs and living tissue from root cap to apical meristem. It is synthesized in
almost all cells that contain chloroplasts or amyloplasts (Taiz and Zeiger, 2010). It is
synthesized from mevalonic acid in mature leaves in response to water or drought
stress. It is also found in high concentrations in seeds, where it may have been
transported from other parts of the plant, or been synthesized in situ (Walton, 1987).

23
ABA and transpiration: In general, the known effects of ABA are the closure of
stomata, induction of transportation of photosynthetic products towards developing
seeds and uptake by embryos, induction of the synthesis of storage proteins in seeds,
and possibly affecting the induction and maintenance of dormancy in seeds and buds
(Powell, 1987).
When plants, especially smaller herbaceous plants, are under water stress, ABA
levels can rise from 10- to 50-fold within 4 to 8 hours. When the plants are watered,
ABA levels drop to pre-stress levels within 4 to 8 hours. In seeds, ABA levels can rise
100-fold within a few days and decline to low levels as the seeds mature and desiccate
(Walton, 1987). Synthesis and metabolism, and transport or import through the xylem
and phloem, are involved in the changing of ABA levels. The most apparent effect of
elevated ABA levels is ABA causes the guard cells around stomata to lose turgor and
thus close the stomata, reducing transpiration. Redistribution or biosynthesis of ABA is
very effective in causing stomatal closure. ABA also promotes root growth and inhibits
shoot growth at low water potentials (Mansfield, 1987b).
The correlation between water stress and ABA in plants has been well
established in the literature (Munns and Sharp, 1993; Sharp and LeNoble, 2002;
Zeevaart, 1971b). However, apart from the known effect of causing the loss of turgor in
guard cells, which in turn closes stomata and reduces transpiration, much of the other
possible effects of ABA on plants is less understood (Taiz and Zeiger, 2010).
ABA and shoot growth: From the 1970s to the early 2000s, it was suggested
that water stress-induced increases in ABA concentrations were one of the causes of
the inhibition of shoot growth (Sharp and LeNoble, 2002). Experimental applications of

24
ABA to well-watered plants resulted in reduced root and shoot growth. In some of these
experiments, the findings suggested that the increase in endogenous ABA in water-
stressed plants was enough to cause most of the inhibition of growth (Davies and
Zhang, 1991).
ABA content doubled in high water-stressed Satsuma mandarin (Citrus unshiu)
leaves, as compared to moderate water-stressed ones (Koshita and Takahara, 2004).
In spinach (Spinacia oleracea L., cv. Savoy Hybrid 612) kept under water stress to
wilting point, ABA content increased by 10 times as compared to turgid plants
(Zeevaart, 1971a).
In wheat (Triticum aestivum), loss of turgor in the leaves due to osmotic
regulation may have had an indirect negative effect on pollen and spike development
because of the increase in production of ABA (Morgan, 1984). Morgan (1984) reported
that the amount of grain produced was correlated with the level of water stress
experienced by the plants before the onset of flowering. There was a negative
correlation between wheat floret fertility and ABA concentrations, with grain yield falling
as ABA concentrations increased. The flower spike could continue to expand at full
turgor even under water deficit, but at the expense of leaf turgor, which fell to zero (full
wilt) (Morgan 1980).
In the case of spinach plants that were subjected to limited water until wilting
symptoms appeared, the ABA content in the plant (whole plant) increased 10-fold
compared to turgid plants (Zeevaart, 1971a). The significant increase in ABA
concentrations when spinach plants were under water stress raised the question of
whether the ABA was produced by the plant when subjected to water stress, or

25
released from a bound form that already existed before the water stress occurred. The
authors’ investigation found that free ABA had increased 10-fold in wilted plants
compared to turgid plants. Alkaline hydrolysis of the water residue released minimal
amounts of ABA regardless of whether plants were under water stress or not.
Therefore, the ABA in spinach was shown to have been synthesized by the stressed
plants, and not released from a bound form.
Spinach was also subjected to short day (SD)/long day (LD) exposures to see if
photoperiodism affected ABA levels (Zeevaart, 1971a). The authors found that ABA
levels did not decrease when plants were exposed to LD to stimulate flowering and
shoot growth. This implies that ABA alone does not have an inhibitory effect on
flowering and stem growth in spinach. It was proposed that ABA might interact with
other growth inhibitors such as GA in controlling flowering and stem growth. Conversely,
the application of exogenous ABA to spinach under LD conditions inhibited the flowering
response, but endogenous ABA levels were higher under LD than SD. Therefore, ABA
did not appear to have a causal relation with the ability to flower in spinach (Metzger
and Zeevaart, 1980). Only GA has been shown to induce flowering under strictly non-
inductive conditions, but only for LDP or plants that require vernalization to flower. SDP
and day-neutral plants tend not to be responsive to GA applications.
Transport of ABA: Research on water stress reactions is concerned with the
sensing and signaling mechanisms of water deficits. The conventional understanding
has been that as the soil dries, water uptake is reduced, and leaf water potential
declines (Davies and Zhang, 1991).

26
Direct evidence of root signaling of water deficit can be found in plants where the
root mass was split equally between two separate medium containers, one of which
received adequate irrigation while the other did not. The plants showed signs of reduced
growth, smaller individual leaves and fewer new leaves. When water was restored to
both containers, the plants recovered leaf growth to the same level as the control plants.
However, by simply cutting off the dry half of the root mass, the same effect could be
achieved. Such split-root experiments show evidence that partial drying of the root
system does not significantly reduce leaf conductance (water potential) even though
leaf growth is reduced. Thus, it was hypothesized that the dry roots somehow
chemically inhibit cell expansion and division in leaves, even though the shoots are well-
supplied with water. Removing the roots removes the inhibitory effects, thus explaining
why the plant recovers to well-watered status (Davies and Zhang, 1991)
In experiments analyzing the composition of xylem sap in water-stressed plants,
most contents (cations, anions, pH, amino acids and plant hormones) decrease in
concentration, with the clear exception of ABA (Schurr and Gollan, 1990). ABA is now
thought to be synthesized in both roots and shoots. Leaves can contain a lot of ABA
even when well-watered. Assuming ABA synthesized in the roots is transported to the
leaves through the xylem, the leaves must be able to differentiate between the ABA that
is endogenous to the leaf tissue, and that which has been delivered through the xylem
sap. Shoots can do this because in well-watered plants under sufficient light, most of
the ABA is sequestered in the chloroplasts. When leaf turgor is maintained, this ABA is
effectively kept separate from ABA coming from the xylem sap.

27
External applications of synthetic ABA seem to mimic the effects of water stress
on wheat leaf growth. The effects of both ABA and water stress were: smaller average
cell size, smaller number of stomata on leaves, more trichomes on leaves. It was
suggested that the role of ABA was intertwined with other growth regulators like
cytokinins (Quarrie and Jones, 1977).
New formulations of ABA have been produced recently, and some research has
been conducted on their efficacy in delaying wilting from environmental stress. s-ABA
(ProTone™ from Valent BioSciences Corp.) is one such product. s-ABA is an analog of
ABA, and application of s-ABA works by mimicking increased levels of ABA in the plant
tissue, causing the plant to respond as if it were already under drought stress when it is
still well-watered. Researchers found that exogenous applications of this product in the
form of a “sprench” or spraying until runoff occurs, at 125 or 250 mg/L could significantly
delay wilting caused by drought stress in several common bedding plants such as
Impatiens walleriana, Catharanthus roseus, I. wittrockiana, Petunia × hybrida ‘Red and
White’ (Blanchard et al., 2007) These findings were supported by other researchers
(Waterland et al., 2010), who also found that there was no significant difference on the
efficacy of s-ABA in delaying wilting, between the two application methods tested (spray
versus drench).
Ethylene
Ethylene, a small molecule that exists as a gas at room temperature, is involved
in stress responses, as well as developmental processes such as seed germination,
senescence, and flowering time. In the LDP A. thaliana, it does in fact delay the
flowering phase, and does so by reducing the abundance of activated GA in the plant,
thereby increasing the concentration of DELLA proteins, which in turn delays the

28
flowering phase as described earlier (Achard et al., 2007). It was thought to inhibit
flowering in SDP (Wilmowicz et al., 2008), but actually induces flowering in a number of
plants such as pineapple (Ananas comosus) (Taiz and Zeiger, 2010, p. 652), and
Plumbago indica (Nitsch and Nitsch, 1969). Wilmowicz et al (2008) studied the relation
between ABA and ethylene in Pharbitis nil, an SDP that requires at least 16 hours of
continuous darkness to induce flowering. They discovered that applying an ABA
inhibitor during SD inhibited flowering, while subsequent application of ethylene
inhibitors reversed this effect. The flowering responses also varied with the timing of
ABA application during different phases of the inductive dark periods. These results
suggest that ABA plays an important part in controlling the photoperiod flowering
response of P. nil. The authors suggest that the inhibitory effect of ethylene may be
related to its effect on ABA levels in the plant. Furthermore, application of ABA during
the sub-inductive (12-hour darkness) period resulted in flowering response. Was the
flowering response observed caused by ethylene having an inhibitory effect on ABA, or
by direct stimulation of ABA synthesis? Since Bougainvillea is also an SDP, it would be
interesting to apply ABA to Bougainvillea under the same photoperiod as described by
Wilmowicz et al., and compare the responses of Bougainvillea to those reported for P.
nil.
More recent research on Bougainvillea has found that ethylene plays an
important role in flowering time. Liu and Chang (2010) found that forced bending of
Bougainvillea shoots induced flowering and showed a correlation with elevated levels of
1-aminocyclopropene-1-carboxylate (ACC), which is a precursor of ethylene. They
hypothesized that ethylene functions as a signal to flower in Bougainvillea shoots that

29
are in a vegetative state. Their subsequent experiment applying ethephon (2-
chloroethylphosphonic acid), directly to Bougainvillea shoots at different stages of
vegetative and reproductive growth, confirmed their hypothesis that exposing vegetative
Bougainvillea shoots to ethylene would induce earlier flowering and an increased
number of flowers. However, they also found that shoots in reproductive stages (with
developed floral buds or flowers) reacted to ethylene by abscission of leaves and
flowers/bracts (Liu and Chang, 2011). This was corroborated by Al-Qubaie, (2013) who
found that 75 ppm ethephon (in conjunction with magnesium sulfate and boric acid)
applied as a foliar spray to vegetative shoots accelerated flowering of B. glabra under
unstated photoperiod conditions. However, applying ethephon to flowering shoots
caused leaf and bract abscission (Liu and Chang, 2011).
Therefore, ethylene appears to possess bidirectional regulatory effects on
flowering in Bougainvillea depending on whether the shoots are in the vegetative or
reproductive phase. Since ABA and ethylene are both stress hormones closely related
to water stress responses, further examination of the interaction between these two
hormones in Bougainvillea could contribute to a clearer understanding of the
physiological signals for flowering in Bougainvillea.
Hypotheses
Our first hypothesis was that ABA and ethylene exhibit a positive relationship in
Bougainvillea under non-flowering conditions. We expect that water stress would lead to
an increase in ABA levels in the leaf tissue in the short term. We expected that
application of exogenous ethylene would result in an increase in ABA levels in the leaf
tissue as well.

30
Our second hypothesis was that ABA and ethylene would exhibit a negative
relationship in Bougainvillea. We expect that the increase in ABA due to (a) water
stress, (b) application of exogenous ABA, and (c) application of exogenous ethylene
would lead to a decrease in endogenous GA in the shoot tissue of Bougainvillea.
Our third hypothesis was that the resulting fall in GA levels in the leaf tissue
under the previous treatments would result in accelerated flowering response in
Bougainvillea even under non-inductive photoperiods.

31
CHAPTER 3 OPTIMAL PHOTOPERIOD FOR FLOWERING OF BOUGAINVILLEA ‘AFTERGLOW’
Introduction
Studies related to the flowering of horticultural plants in tropical and subtropical
zones of the world, including the United States, have largely focused on economically
important tropical fruit crops of several key genera, namely Mangifera (mango), Citrus
(citrus) and Litchi (lychee) (Koshita and Takahara, 2004; Menzel, 1983; Núñez-Elisea
and Davenport, 1994; Ramírez and Davenport, 2010). Less attention has been paid to
woody ornamentals in recent years as the flowering behaviors of most landscape plants
are already well-understood.
Ornamental crops in the tropics can be generally classified into foliage crops and
floral crops. The difference between tropical/sub-tropical and temperate floral crops
from a landscape design point of view is the seasonality of flowering, and the respective
environmental stimuli that trigger flowering. In high latitudes, day length (photoperiod)
and temperature (vernalization) are the predominant cues that signal plants to enter
reproductive phase. At lower latitudes, especially in areas with distinct wet/dry seasonal
variations, the trigger is often water availability. In areas without significant variation in
water availability, intensity of solar radiation has been suggested as the trigger for some
species to flower (Yeang, 2007).
Bougainvillea (Bougainvillea spp.) is a widespread and common woody
evergreen perennial that is used as a landscape ornamental plant in South Florida and
in tropical areas around the world. It is greatly valued for its vigor and resistance to
pests, disease, and drought, in addition to its bright floral display of colorful bracts, and
32
variability in form as it can be planted as a shrub, standard, espaliered, or trained onto a
trellis (Kobayashi et al., 2007).
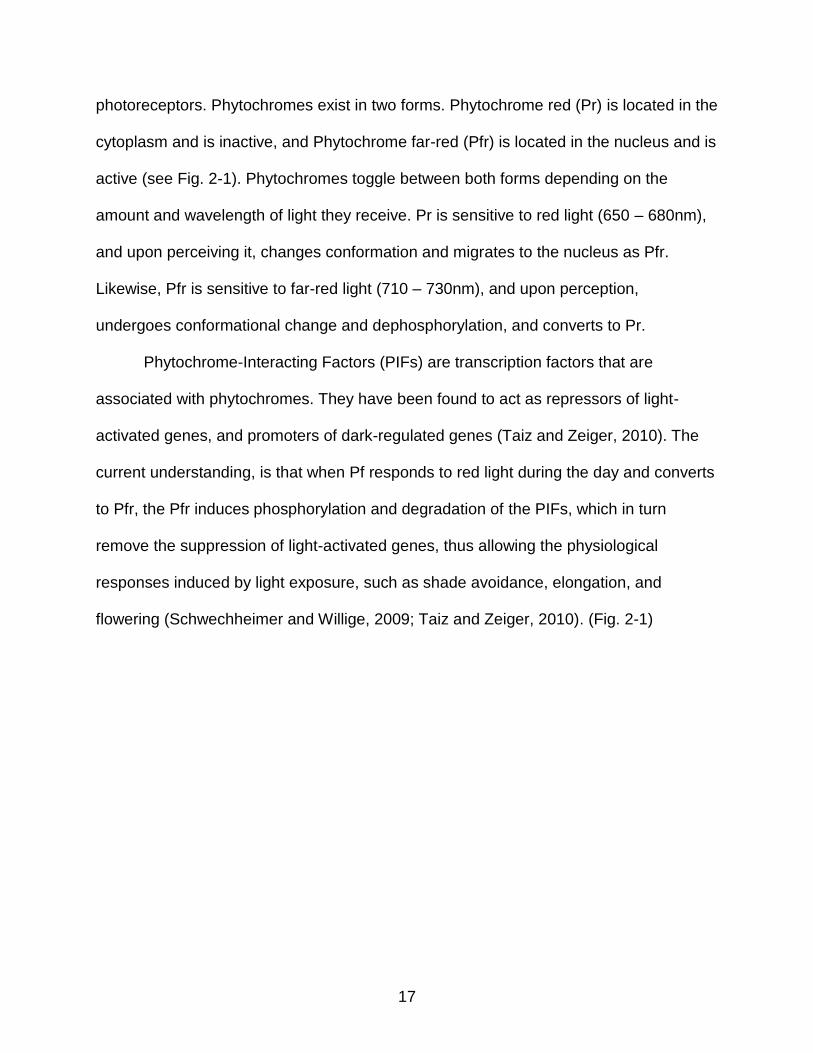
It is a SDP, with flowers forming in apical panicles on the current year wood (Ma
and Gu, 2010). In sub-tropical/tropical climates like South Florida, Bougainvillea flowers
in fall to late spring, when the daylength is less than 12 h per day and night-time
temperatures are above 21°C (Schoellhorn and Alvarez, 2002). Ramina and Sachs
(1979) hypothesized that flowering in Bougainvillea was a function of nutrient diversion,
and in further studies Even-Chen and Sachs (1980) supported the theory that SD
induction was positively correlated to photosynthetic rates in mature Bougainvillea
leaves. Ma and Gu (2010) built on this theory and confirmed earlier research by Steffen
et al. (1988) that flowering in Bougainvillea was controlled in some way by GA by
diverting nutrient assimilates away from the apical meristem. Since GA levels are known
to change in response to photoperiod, or more specifically to the effect of far-red light on
phytochrome photoreceptors (Taiz and Zeiger, 2010), SD induction as in the case of 8-
hour photoperiod induction of Bougainvillea ‘San Diego Red’, and 10- to 8-hour
photoperiod induction for Bougainvillea glabra ‘Sanderiana’ was thought to be the result
of a complex web of interactions between hormones and environmental factors (Even-
Chen and Sachs, 1980; Joiner et al., 1962).
We hypothesized that all other environmental factors being equal, Bougainvillea
‘Afterglow’ would exhibit the same SD inductive response as ‘San Diego Red’, with an
inductive photoperiod of between 8 and 10 hours. We also sought to clarify the most
inductive daylength for this cultivar. The objective of experiment 1 was to verify that
Bougainvillea ‘Afterglow’ was a quantitative short-day plant (SDP), and that flowering

33
could be suppressed by night interruption or daylight extension. The objective of
experiment 2 was to determine the length of photoperiod that was most inductive to
flowering for this cultivar.
Materials and Methods
Experiment 1 was conducted in December 2015, and Experiment 2 was
conducted in March 2016. Established rooted cuttings of Bougainvillea ‘Afterglow’ were
used in both experiments. They were transplanted into 10 cm pots filled with 100% 5
mm coarse washed aquarium zeolite (Pentair Aquatic Eco-systems Inc., Apopka, FL,
USA). Plants were sprayed with 30 µL of ethephon (25 mL of 1200 ppm concentration;
Southern Agricultural Insecticides, Inc., Hendersonville, NC) to induce leaf and
inflorescence senescence, then pruned to remove apical buds, and as far as possible
reduced to a length with 7 visible lateral nodes. They were then kept vegetative under
14-hour photoperiod, consisting of daylight supplemented with white LED lights
supplying 70 µmol m-1s-1 photosynthetic photon flux (PPF). To prevent nutrient
deficiencies, plants were fertilized with Peters Professional Bloom Booster (10N-
30P2O5-20K2O; JR Peters, Allentown, PA) at 9.4 μg total N (nitrogen) once per week
starting three weeks prior to the start of the experiment. We continued to apply the
fertilizer at the same rate once per week through the remainder of the experiment. In
addition to fertilizer, plants were watered with 50mL of tap water (EC = 516 µS, pH =
8.3) every two days.
For Experiment 1, thirty plants (six treatments with five replicates each) were
arranged in a completely randomized design in an open sided greenhouse exposed to
ambient air temperatures (25.0/18.8°C day/night) and 81% relative humidity, at the
University of Florida, Fort Lauderdale Research and Education Center in Davie, Florida.

34
Photoperiod treatments were created using a 5-gallon black plastic pot inverted over
each plant to block out light. All plants were covered at 6pm and uncovered at 8am. A
single 5-watt LED bulb providing 35 µmol m-1 s-1 PPF suspended inside each pot and
set on a timer provided night interruption or daylength extension. There were three
continuous photoperiod treatments 14 (control), 11 and 8 hours, and three night-
interruption treatments: 8+3-hours, 8+6-hours, and 11+3-hours. Night interruptions
occurred after 3 hours of dark. Night interruption treatments were designed to match the
number of daylight hours of the continuous photoperiod treatments. Prior experiments
(data not shown) suggested that short night interruptions (5 to 30 mins of light) were
insufficient to inhibit flowering.
Root zone temperature (RZT) was monitored using two dataloggers (HOBOWare
Pro U12, Onset Computer Corporation, Bourne, MA), with sensors inserted into seven
random replicate pots. Temperatures were logged in °C at 30 min intervals.
Plant size was recorded at the start and end of the experiment to calculate growth. Plant
size was determined by the formula
Size = H × W1 ×W2 (3-1)
Where H = height, rounded to the nearest cm, W1 = maximum width of the plant to the
nearest cm, and W2 = width of the plant perpendicular to W1, to the nearest cm.
Growth was defined as the difference between the plant size at the end of the
experiment and at the start of the experiment. Relative growth was calculated as the
percentage ratio of growth over initial size.

35
The number of inflorescences on each plant was counted at the end of day 30.
One inflorescence was defined as an individual thorn-inflorescence axil, regardless of
how many florets were attached to the peduncle.
Experiment 2 was a repeat of Experiment 1 with the same preparation but with
continuous photoperiod treatments without night interruption. The treatments were 14-
(control), 12-, 11-, 10-, 9- and 8-hour photoperiods respectively.
Analysis of variance (ANOVA, α=0.05) was performed using R statistical analysis
program, with number of inflorescences as the dependent variable and photoperiod
treatment and relative growth as the independent variables. Data for experiment 1 and
experiment 2 were analyzed separately. Root-zone temperature was identical across
all treatments so this data was omitted from ANOVA. The average daily temperature
range was 24°C to 32°C. In experiment 1, mean separation was conducted using paired
t-tests to identify which treatments were significantly different. In experiment 2, Tukey’s
Honestly Significant Difference was used for means separation to identify which
treatments were significantly different.
Results
The number of inflorescences was not significantly affected by the growth of the
plants, and there was no interaction between relative growth and photoperiod treatment
on number of inflorescences (Table 3-1).
In experiment 1, plants grown under 8-hour and 11-hour photoperiods produced
significantly more inflorescences than all other treatments (Table 3-2). All night
interruption treatments inhibited flowering response. Among the three continuous
photoperiod treatments, the control plants (14-hour) had the fewest flowers, while those
under 8-hour grew the least but had the most number of flowers. Since night interruption

36
effectively inhibited flowering, the treatments for Experiment 2 omitted night interruption
and focused on narrowing the range of photoperiod treatments.
In Experiment 2, control plants remained completely vegetative under 14-hour
photoperiod (See Table 3-3). Plants grown under 8-hour photoperiod had the greatest
number of inflorescences (13.6).
Plants grown under 9-hour photoperiod had the second highest mean number of
inflorescences (11.2). There was no significant increase in the number of inflorescences
produced under 12-, 11- and 10-hour photoperiods, compared to controls (Table 3-3).
Linear regression analysis was performed on number of inflorescences as a response
to photoperiod. The coefficient for photoperiod was -2.15, which showed that
inflorescences had a negative linear relationship with photoperiod.
Discussion
Previous studies indicated that Bougainvillea ‘San Diego Red’ flowered under SD
conditions (Even-Chen et al., 1979; Even-Chen and Sachs, 1980). The results of
experiment 1 appear to support the hypothesis that the cultivar ‘Afterglow’ is also a SD
plant that requires photoperiods of less than 12 hours to induce flowering, while the
results from experiment 2 indicate that 8 hours of daylight was the most inductive
photoperiod for ‘Afterglow’. These results concur with previous research which
suggested that 8 hours was the optimal photoperiod for flowering of Bougainvillea
(Schoellhorn and Alvarez, 2002; Singh et al., 2013). In addition, flowering of ‘Afterglow’
was completely inhibited by extending the photoperiod to 14 hours, either continuously
or as night interruption. This result was interesting as early studies suggested that there
was no clearly defined critical photoperiod to induce floral initiation in Bougainvillea
(Joiner et al., 1962). However, these results suggest that there may be a threshold

37
photoperiod to inhibit flowering altogether. In addition, the inability of short night
interruptions of 5 to 30 minutes to inhibit flowering would be of interest for further
research.
Bougainvillea is an important landscape shrub in the tropics and subtropics,
where annual variation of daylength is between 10 ½ hours and 13 ½ hours. In these
areas, seasonal variation in daylength creates alternating inductive and sub-inductive
photoperiods. We designate the latter sub-inductive rather than non-inductive because
the photoperiod does not reach or exceed 14 hours, which would completely inhibit
flowering. In South Florida, the inductive season would correspond to mid-October to
mid-February, and the sub-inductive period would be from March through September.
The tropics also encompass equatorial areas that have a constant year-round 12-hour
daylength. In these places, we could consider the entire year as sub-inductive, so
flowering can take place sporadically year-round in response to other factors such as
microclimate, light intensity, nutrient availability, and environmental stresses. In
particular, the water deficit and physical stress have been found to induce flowering in
Bougainvillea (Liu and Chang, 2010, 2011; Ma and Gu, 2010; Schoellhorn and Alvarez,
2002). Since the stress hormones ethylene and abscisic acid (ABA) both have complex
relations with GA pathways, further investigation on the interactions between ethylene
and ABA levels on GA in Bougainvillea in relation to flowering responses under sub-
inductive conditions should be taken.

38
Table 3-1. Effect of photoperiod and relative growth on number of inflorescences on Bougainvillea ‘Afterglow’ in December 2015. n=30. (*) indicates significant difference at α=0.05
Variable Df Sum Sq Mean Sq F-Value P-value Photoperiod 5 755.5 151.10 3.235 *0.0295 Relative Growth 1 42.5 42.51 0.910 0.3527
Treatments × Relative Growth
5 267.4 53.48 1.145 0.3732
Table 3-2. Effects of photoperiod on number of inflorescences and relative growth of Bougainvillea ‘Afterglow’ in December 2015. Means in the same column followed by the same letters are not significantly different at α=0.05. n=30.
Treatment (hours)
Mean Number of Inflorescences inflorescences
Standard Error
P-value
Relative Growth (%)
Standard Error
P-value
Control (14)
0.4 b a a
0.000 na 262.8 a 107.616 na 11 12.2 a 5.903 0.09
4 253.0 a 142.269 0.99
9 8 10.2 a 3.680 0.220
190.7 a 70.292 0.978 8+3 0.0 b 0.000 1.00
0 216.8 a 82.451 0.99
9 8+6 0.0 b 0.000 1.000
144.4 a 34.371 0.987 11+3 3.0 b 3.000 0.98
1 346.9 a 518.011 0.99
5
Table 3-3. Effects of photoperiods on number of inflorescences of Bougainvillea ‘Afterglow’ grown in February 2016. Means in the same column followed by the same letters are not significantly different at α=0.05.
Treatment (hours)
Mean Number of inflorescences
Standard error P-value
14 0.0 b 0.000 na.
12 5.8 b 1.462 0.343
11 8.0 b 1.871 0.085
10 8.4 b 2.857 0.064
9 11.2 a 2.577 0.006
8 13.6 a 1.860 <0.001
39
CHAPTER 4 EFFECT OF VARYING ETHEPHON RATE APPLICATIONS ON FLOWERING OF
BOUGAINVILLEA ‘AFTERGLOW’
Introduction
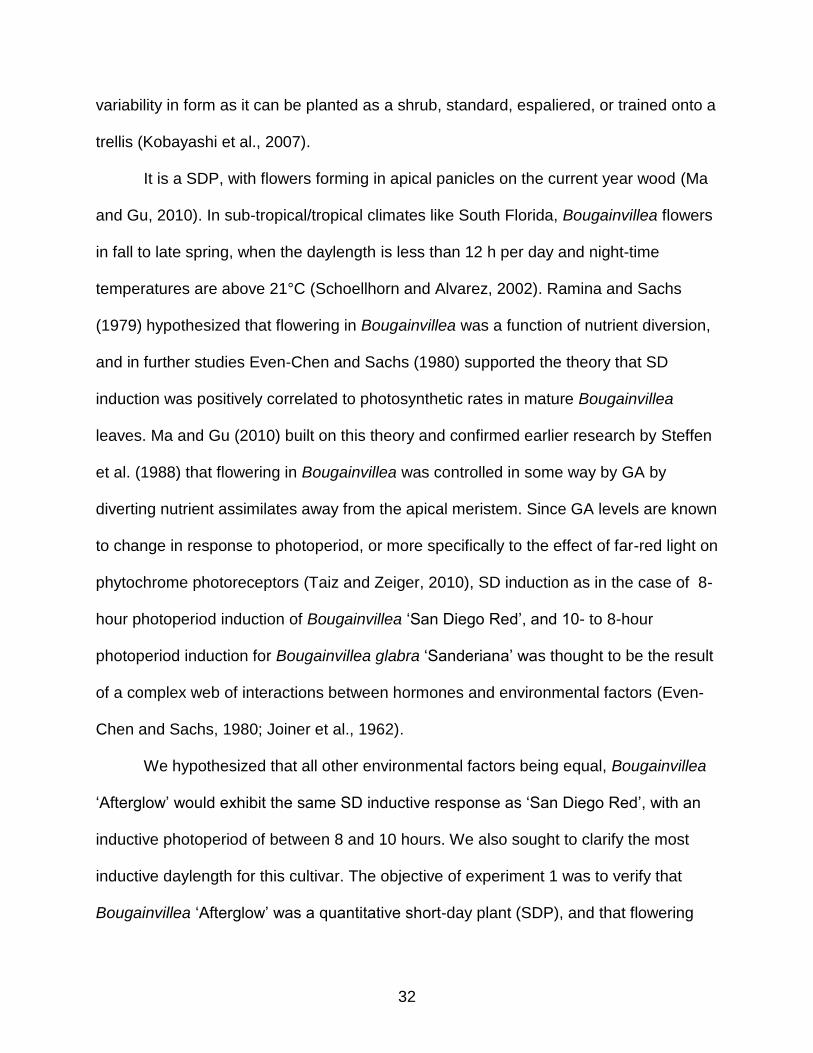
Flowering of Bougainvillea ‘Afterglow’ was triggered in response to an 8-hour
photoperiod. This cultivar, like several others including ‘Raspberry Ice’, ‘San Diego
Red’, and ‘Rainbow Gold’ are quantitative short-day (SD) plants that flower more readily
under SD conditions. Other environmental factors, such as drought stress, high light
intensity and low nighttime temperatures might also enhance flowering (Hackett and
Sachs, 1985; Joiner et al., 1962; Jeffrey G. Norcini et al., 1992; Norcini et al., 1994)
Other researchers have found that ethylene, applied in the form of ethephon (2-
chloroethylphosphonic acid) is effective in promoting flowering of Bougainvillea glabra
and Bougainvillea ‘Taipei Red’, but these experiments were conducted under shortening
daylengths, and not under non-inductive photoperiods of more than 13-hour daylengths
(Al-Qubaie, 2013; Liu and Chang, 2011). The application rate of 75 µL/L ethephon
applied as a foliar spray was found to be effective under SD on these plants.
To find out if a different rate would be able to break the LD inhibition of flowering
in Bougainvillea ‘Afterglow’, a rate study of ethephon was conducted. If a rate was found
to effective, then the effective rate would be used in further experiments to compare the
effect of ethephon application against the effect of SD photoperiod on Bougainvillea
‘Afterglow’.
Materials and Methods
Thirty rooted cuttings of Bougainvillea ‘Afterglow’ were grown in 10 cm plastic
pots with 100% 5 mm coarse washed aquarium zeolite (Pentair Aquatic Eco-systems
Inc., Apopka, FL, USA). They were kept under 14-hour photoperiod (natural daylight

40
with supplemental white LED lights providing 70 µmol·m-1·s-1 photosynthetic photon
flux, to inhibit photoperiod-induced flowering. To prevent nutrient deficiencies, plants
were fertilized with Peters Professional Bloom Booster (10N-30P2O5-20K2O; JR Peters,
Allentown, PA) at 9.4 μg total (N) nitrogen once per week starting three weeks prior to
the start of the experiment. We continued to apply the fertilizer at the same rate once
per week through the remainder of the experiment. Five concentrations (75, 150, 300,
600 and 1200 µL/L) of ethephon (Florel® brand, Southern Agricultural Insecticides, Inc.,
Hendersonville, NC) were prepared at the start of the experiment, and each plant was
sprayed with 25 mL of the PGR solution on the foliage. The actual amount of ethephon
applied under each treatment was thus 1.875 µL, 3.75 µL, 7.5 µL, 15 µL, and 30 µL per
plant respectively. The control plants received no PGR applications. All plants were
hand watered with 100 mL of tap water every 3 days. Plants were arranged in a
complete randomized design in an open-sided greenhouse exposed to ambient air
temperatures (28.3/20.8°C day/night) and 71% relative humidity, at the University of
Florida Fort Lauderdale Research and Education Center in Davie, Florida.
The number of inflorescences on each plant was counted at the end of day 30.
One inflorescence was defined as an individual thorn-inflorescence axil, regardless of
how many florets were attached to the peduncle. Plant size was recorded at the end of
the experiment when flowering was observed. Plant size was determined by the formula
Size = H × W1 ×W2 (4-1)
Where H = height, rounded to the nearest cm, W1 = maximum width of the plant to the
nearest cm, and W2 = width of the plant perpendicular to W1, to the nearest cm.

41
General linear model with Poisson regression was conducted using R statistical
analysis program (www.r-project.org) to identify the relationship between ethephon
concentrations and number of inflorescences.
Results
There were no significant differences between treatments in terms of overall size
of plants. There were significant differences in mean number of inflorescences between
treatments (Table 4-1). The lowest rate (75 µL/L) and the two highest rates (600 and
1200 µL/L) resulted in flowering responses that were not significantly different from
control plants at 30 days after treatment. (Table 4-1).
Among the remaining treatments that promoted flowering, 150 µL/L ethephon
appeared to promote the largest number of flowers (mean = 18.0), followed by 300 µL/L
(mean = 12.2) and 75 µL/L (mean = 9.8) (Table 4-1). Only the 150 µL/L treatment was
significantly different from the control (P<0.05) (Fig. 4-1). The effectiveness of ethephon
as a flowering promoter in this cultivar of Bougainvillea appeared to increase from
application rates between 75 µL/L to 150 µL/L, and gradually decrease between 200
and 600 µL/L, and was not effective at higher concentrations. The highest concentration
of ethephon (1200 µL/L) defoliated all plants within 72 hours of application. Therefore, at
the end of the experiment, there were no flowers on plants under that treatment (mean
inflorescences = 0.8) (Table 4-1).
Discussion
Under non-inductive LD conditions, control plants did not remain completely
vegetative, but the number of inflorescences were not significantly greater than zero. It
was clear from the results that any rate of ethephon higher than 600 µL/L would not be
effective in promoting flowering in the short term (within 30 to 48 days), as it would be

42
likely to completely defoliate the plants. This rate (600 µL/L) can be applied if a chemical
defoliant is required, without killing the plant. The practical use of such an application is
to remove both foliage and inflorescences without the need for physical pruning. The
new growth that comes back after defoliation tends to be from existing axillary buds,
instead of the apical meristems, which creates a denser plant without increasing the
overall height of the plant.
Although we found that 75 µL/L application rate did appear to promote flowering
of Bougainvillea ‘Afterglow’ under LD conditions, it was not significant. Since the Liu and
Chang study was conducted in the fall of 2009 in Taipei, we could surmise that the
photoperiod conditions of that experiment was SD. (Khandaker et al., 2013) found that
ethylene production in Bougainvillea under neutral day lengths (12 hour light/dark)
naturally increased with age and maturity of the shoots, leading to flowering and then
abscission of the flowers. Therefore, 75 µL/L ethephon spray may promote flowering
only under SD or neutral day lengths, when it constitutes a supplementary source of
ethylene to accelerate the transition of shoots from the vegetative to reproductive stage.
Under non-inductive LD conditions, a higher concentration of ethephon may be required
to achieve the same effect. Therefore, a rate study would need to be conducted to
determine the optimal concentration, if any, for application of ethephon to Bougainvillea
‘Afterglow’ under strictly non-inductive LD conditions.
The flowering response increased at the lower application rates, and peaked
between 75 µL/L and 300 µL/L, with 150 µL/L showing the only significantly positive
treatment effect. A repeat of this rate including a narrower range of concentrations
between 50 µL/L and 200 µL/L should be conducted to determine the most effective

43
rate of ethephon application for LD conditions. These results support the hypothesis that
exogenous ethylene application will promote flowering of Bougainvillea under non-
inductive LD photoperiod.
Table 4-1. ANOVA results of mean plant size and number of inflorescences at 30 days after treatment with increasing concentration of ethephon. (*) indicates statistical difference at α=0.05. (n=30).
Concentration of ethephon (µL/L)
Mean plant size (cm -3)
Standard error
P-value
Mean number of inflorescences
Standard error
P-value
0 2868.2 991.99 5.8 2.42 75 2883.6 289.24 0.986 9.8 1.74 0.149
150 1937.4 397.04 0.290 18.0 2.59 **0.003 300 1773.8 402.57 0.216 12.2 1.39 *0.090 600 4209.6 675.91 0.132 7.4 4.60 0.663
1200 2600.4 613.81 0.758 0.8 0.80 0.180
Figure 4-1. Effect of increasing ethephon concentration on number of inflorescences in Bougainvillea ‘Afterglow’ under 14-hour photoperiod. The 150 µL/L rate was significantly more effective than the control (P=0.027). (n=30).

44
CHAPTER 5 EFFECTS OF WATER STRESS, HORMONES, AND PHOTOPERIOD ON
FLOWERING OF BOUGAINVILLEA ‘AFTERGLOW’
Introduction
The flowering of many ornamental Bougainvillea hybrids (Bougainvillea x
buttiana) appears to have multiple environmental triggers, including photoperiod and
various abiotic stress factors like wounding or drought (Hackett and Sachs, 1985; Liu
and Chang, 2010, 2011; Ramina et al., 1979; Tse et al., 1974).
The results from the previous chapters showed that Bougainvillea ‘Afterglow’ is a
short-day (SD) plant that flowers more profusely as the photoperiod was reduced from
12 hours to 8 hours, while a photoperiod of 14 hours effectively inhibited flowering.
Therefore, in this experiment we compared the effect of the both long-day (LD) and SD,
in combination with exogenous application of abscisic acid (ABA) and ethylene to
simulate the effect of increase in endogenous ABA and ethylene by drought stress and
physical wounding. The objectives were firstly to compare the effects of the exogenous
hormone application with the actual effect of drought stress and photoperiod, and
secondly to find out if one factor was more dominant than the others.
Materials and Methods
Seventy rooted cuttings of Bougainvillea ‘Afterglow’ were transplanted into 10 cm
pots filled with 100% 5 mm coarse washed aquarium zeolite (Pentair Aquatic Eco-
systems Inc., Apopka, FL, USA). Plants were sprayed with 30 µl of ethephon (25 mL of
1200 ppm concentration; Southern Agricultural Insecticides, Inc., Hendersonville, NC) to
induce total leaf drop, then pruned to a mean height of 12 cm with no lateral shoots as
much as possible. Plants were then placed under LD (14-hour photoperiod) to prevent
flowering prior to the start of the experiment. This consisted of natural daylight

45
supplemented with white LED lights supplying 70 µmol m-1 s-1 photosynthetic photon
flux (PPF). To prevent nutrient deficiencies, plants were fertilized with Peters
Professional Bloom Booster (10N-30P2O5-20K2O; JR Peters, Allentown, PA) at 9.4 μg
total nitrogen once per week starting three weeks prior to the start of the experiment.
We continued to apply the fertilizer at the same rate once per week through the
remainder of the experiment. In addition to fertilizer, plants were watered with 50 mL of
tap water (EC = 516 µS, pH = 8.3) every two days.
There were seven treatments, with ten replicates per treatment. There were 3
plant growth regulator (PGR) treatments under LD: 1.8 µl of ethephon (25 mL of 75
ppm concentration), 12.5 µg of ABA (25 mL of 500 ppm concentration), and a
combination of both (1.8 µl ethephon + 12.5 µg ABA). Control plants were under LD with
no hormones applied. There were 2 treatments under SD, which were water stress
(WS) and no water stress. Plants in the water stress treatments were watered with 50
mL of water every 4 days, all other plants were watered with 50 mL of tap water every 2
days. SD treatment was an 8-hour photoperiod, achieved by covering the plants with
black plastic covers between 4pm and 8am.
Plants were arranged in a complete randomized design in an open-sided
greenhouse exposed to ambient air temperatures (33.3/25.2°C day/night) and 77.7%
relative humidity, at the University of Florida Fort Lauderdale Research and Education
Center in Davie, Florida.
Plant size was recorded at the start and end of the experiment to calculate
growth. Plant size was determined by the formula below, where H = height, rounded to

46
the nearest cm, W1 = maximum width of the plant to the nearest cm, and W2 = width of
the plant perpendicular to W1, to the nearest cm.
Size = H × W1 ×W2 (5-1)
Growth was defined as the difference between the plant size on day 1 and day
30. Relative growth was calculated as the percentage ratio of growth over initial size.
The number of inflorescences on each plant was counted on day 30. One inflorescence
was defined as an individual thorn-inflorescence axil, regardless of how many florets
were attached to the peduncle.
The pour-through method (Wright, 1986) was used to collect leachate at the start
and end of the experiment. pH and electrical conductivity (EC) were measured using a
portable pH/EC meter (Hanna Instruments, Ann Arbor, MI, USA), and N-nitrate (NO3),
potassium (K) and calcium (Ca) levels where measured using LAQUA portable ion
meters (Spectrum Technologies, Aurora, IL, USA). Phosphate (PO4) levels were
measured using a benchtop selective ion probe (Accumet® XL250, Fisher Scientific,
Waltham, MA, USA). Results were compared using paired t-tests performed in R
statistical analysis program (www.r-project.org) to check if there were any differences
between treatments in terms of nutrient availability in the media.
Analysis of variance (ANOVA, α=0.05) was performed using R statistical analysis
program, with number of inflorescence, growth, and change in number of leaves as the
dependent variables and treatments as the independent variables, with mean
separation conducted using Tukey’s HSD to identify which treatments were significantly
different.

47
Results
ANOVA was conducted on the three growth parameters (relative growth,
difference in number of leaves, and difference in number of buds) on day 30 of the
experiment. There were no significant treatment effects on the overall growth (change in
size) of the plants or on the change in the number of leaves from day 1 to day 30. There
was a significant difference between treatments in number of buds on day 30 (Table 5-
1).
Tukey’s Honestly Significant Differences (HSD) was used to identify the specific
treatments that showed significant effects (Table 5-1). The combination of SD and WS
induced the largest mean number of inflorescences (12.4) after thirty days (P<0.0001).
SD without WS produced the next highest mean number of inflorescences (8.2,
P<0.05). The other treatments were not significantly different from the control. However,
the LD+WS+Ethephon treatment showed a slight positive effect on flowering even
though they were not significant. Both the application of s-ABA alone, and in conjunction
with ethephon, resulted in virtually no flowering.
Student’s t-test conducted on the NO3, K, PO4, pH and electrical conductivity
(EC) of the leachate taken at the end of the experiment showed that there were no
differences among treatments (data not shown). Therefore, nutrient availability did not
contribute to any of the differences between plant size and number of inflorescences at
the end of the experiment, and were excluded from the subsequent statistical analysis.
Discussion
This study was set up to identify whether one factor was more important than
other factors to trigger flowering in Bougainvillea ‘Afterglow’. Two abiotic factors –
photoperiod and drought stress – were used as treatments in this experiment.

48
Additionally, two stress hormones related to both drought stress and physical stress
(abscisic acid and ethylene respectively) were also used as treatments, to see if
exogenous application of these hormones could simulate the abiotic stress under LD
(non-inductive) photoperiod. Liu and Chang (2011) found that exogenous foliar spray
application of ethephon at 75 ppm concentration was effective in accelerating and
increasing the flowering of Bougainvillea ‘Taipei Red’. We sought to replicate this finding
by applying the same concentration of ethephon on Bougainvillea ‘Afterglow’ to see if
the effects were the same for this cultivar.
The most salient observation from this experiment was that photoperiod was
more important than all the other treatments in promoting flowering of Bougainvillea
‘Afterglow’. WS promoted flowering under both SD and LD conditions, but the effect was
significant only under SD conditions. It appeared that the effect was additive to the SD
conditions. The application rate of 50 mL of 75 µL/L ethephon spray was found by (Liu
and Chang, 2011) to be effective in promoting flowering of Bougainvillea ‘Taipei Red’.
While water stress was found to induce some flowering in Bougainvillea
‘Afterglow’ under LD conditions, the lack of flowering response with exogenous
applications of ABA suggests that exogenous ABA applied as a foliar spray did not
become active in the same way that endogenous ABA within the plant tissue was.
Exogenous ABA on the leaf may have remained largely on the epidermis and may not
have been taken up by the plant Since endogenous ABA is both synthesized within the
leaves as well as transported from the roots during a drought stress event, (Malladi and
Burns, 2007; Verelst et al., 2010), application as a drench should be explored as an

49
alternative method. This might also suggest that the increased presence of ABA may
not have been the real cause of flowering response under water stress.
ABA and ethylene have a complex interaction that is typically antagonistic, where
a sharp increase in ABA usually coincides with a decrease in ethylene (Sharp and
LeNoble, 2002). In this experiment, the combined application of ABA and ethephon
resulted in no flowering at the end of the experiment. The question arises as to whether
the concurrent application of ABA negated the mild promotive effect of ethephon on
flowering. At least in the case of hibiscus flowers (Hibiscus rosa-sinensis), application of
exogenous ABA was found to have a negative effect on the biosynthesis of ethylene in
the flower tissues (Trivellini et al., 2011). The interaction between ABA and ethylene
appears to take place along the gibberellic acid (GA) pathway (Sharp and LeNoble,
2002; Wilmowicz et al., 2008). Pierik et al. (2004) found that in tobacco (Nicotiana
tabacum cv. Samsun NN), an increase in the ratio of red:far-red light (R:FR), ethylene
production increased, and this coincided with the shade avoidance response (leaf
elongation and leaf hyponasty). The shade avoidance response was a phytochrome-
mediated function that required the presence of GA. This was further confirmed by the
fact that application of paclobutrazol, a GA inhibitor, reduced the shade avoidance
response in both wild-type plants and ethylene-insensitive mutants. Furthermore, it has
been found that application of exogenous GA on shoot tips inhibits flowering in
Bougainvillea ‘Raspberry Ice’, while application of dikegulac, another GA inhibitor,
increased flowering under SD and day-neutral conditions (Jeffrey G. Norcini et al.,
1992).

50
The shade avoidance response is a phytochrome-mediated function that requires
the presence of GA. In brief, an accumulation of GA in the cell nucleus leads to the
degradation of DELLA proteins, which are negative regulators of shade avoidance
responses such as cell elongation. The degradation of the DELLA proteins removes
their inhibitory effect, thus allowing the expression of the genes related to shade
avoidance (Taiz and Zeiger, 2010).
GA has been established as an integral part of the sensing of photoperiod in
plants such as the potato, which requires strict SD conditions to initiate tuberization
(Malladi and Burns, 2007). The most significant observation from this experiment, and
the answer to the third objective of the experiment, was that photoperiod was more
important than all the other treatments in promoting flowering of Bougainvillea
‘Afterglow’. WS promoted flowering under both SD and LD conditions, but the effect was
significant only under SD conditions. It appeared that the effect is additive to the SD
conditions. This concurs with previous findings, where exogenous application of GA
inhibited flowering of various Bougainvillea cultivars under SD photoperiod, and
dikegulac, another GA inhibitor, promoted flowering under SD photoperiod (Aldrich and
Norcini, 1996; Norcini et al., 1993; Tse et al., 1974).
As mentioned, GA plays an integral role in the sensing of photoperiod (Ewing,
1987; Taiz and Zeiger, 2010), while ABA and ethylene both interact at different points
along the GA pathway (Alabadí and Blázquez, 2009; Koshita et al., 1999; Pierik et al.,
2004). All three phytohormones appear to work differently in tissues at different stages
of development. (Verelst et al., 2010) noted that while the ABA-dependent drought
stress response has been repeatedly found to take place in mature leaf cells, in

51
meristems and dividing leaf cells of young leaves, it is GA and ethylene-dependent
pathways that are activated under drought stress. To know if drought stress triggers
flowering in Bougainvillea ‘Afterglow’ through hormonal signaling, we would need to
analyze endogenous levels of ABA and ethylene under degrees of drought stress and
different photoperiods, as well as the changes in GA levels in both young leaves and
mature leaves under both inductive and non-inductive environmental growing
conditions. If we could determine that certain fluctuations in hormonal levels in
responses to these stresses are correlated to the flowering response, we could assess
if the exogenous application of those hormones will simulate the same environmental
stress triggers when they are absent.
Table 5-1. Tukey’s HSD Means separation of number of inflorescences under 6 different treatments and control (LD – No WS, No PGR). Treatments followed by the same letters are not significantly different at α=0.05, n=70
Treatment Inflorescences (mean) Adjusted P-value
SD + WS + No PGR 12.4 A
0.00002
SD + No WS + No PGR 8.2 AB
0.045
LD + No WS + Ethephon 4.9 BC
0.835
LD + WS + No PGR 3.4 C
0.998
LD + No WS + No PGR (Control)
2.4 C
--
LD + No WS + Ethephon + ABA
1.4 C
0.998
LD + No WS + ABA 0.9 C
0.984
SD = Short Day, WS = Water Stress, PGR = Plant Growth Regulators, LD = Long Day, ABA = Exogenous Abscisic Acid

52
CHAPTER 6 HORMONES, FLOWERING AND ABA LEVELS
Introduction
Bougainvillea (Bougainvillea spp.) is a widespread and common woody
evergreen perennial that is used as a landscape ornamental plant in tropical and
subtropical regions of the world. It is greatly valued for its vigor and resistance to pests,
disease, and drought, in addition to its bright floral display of colorful bracts (Kobayashi
et al., 2007).
It is a short day (SD) plant (Hackett and Sachs, 1985), with flowers forming in
apical panicles on the current year’s wood (Ma and Gu, 2010). In sub-tropical/tropical
climates like South Florida, Bougainvillea flowers in fall to late spring t, when the
photoperiod is less than 12-h per day and night-time temperatures are above 21°C
(Schoellhorn and Alvarez, 2002). Ramina and Sachs (1979) hypothesized that flowering
in Bougainvillea was a function of nutrient diversion, and in further studies (Even-Chen
and Sachs, 1980) supported the theory that SD induction was positively correlated to
photosynthetic rates in mature Bougainvillea leaves. Ma and Gu, (2010) built on this
theory and confirmed earlier research by Steffen et al (1988) and (Staden and Dimalla,
1980) that flowering in Bougainvillea was controlled in some way by gibberellic acid
(GA) by diverting nutrient assimilates away from the apical meristem through the
restriction of cytokinin production in the roots.
Water deficit stress (WDS) has been used to promote flowering and control size
in nursery production settings (Kobayashi et al., 2007; Ma and Gu, 2010). Two classical
plant hormones, abscisic acid (ABA) and ethylene are associated with abiotic stress
responses (Taiz and Zeiger, 2010). Ethylene has been associated flowering of

53
Bougainvillea under physical stresses such as shoot bending and by exogenous
application of the plant growth regulator ethephon or 2-chloroethylphosphonic acid (Liu
and Chang, 2010, 2011). ABA is responsible for inducing the loss of guard cell turgor
and thereby closing of stomata and reduction of evapotranspiration in plants that are
under medium to severe WDS (Mansfield, 1987; Walton, 1987). However, no research
has been published on the role it may play in the flowering response of Bougainvillea,
given the apparent effect that mild WDS appears have on triggering of flowering.
We have found in earlier experiments that Bougainvillea ‘Afterglow’ is a SDP that
flowers best under SD conditions of 8-hours, and flowering was suppressed under LD
(14-hours), which is consistent with other cultivars of Bougainvillea × buttiana such as
‘San Diego Red’ (Even-Chen and Sachs, 1980; Joiner et al., 1962). Our first hypothesis
was that increased levels of ABA and ethylene would increase the number of
inflorescences in ‘Afterglow’ under SD and induce flowering under LD conditions. The
first objective of this study was to examine the effect of three rates of exogenous ABA
and ethylene on the flowering response of under both SD and LD photoperiod. We also
hypothesized that endogenous ABA levels would be positively correlated with the
flowering response. The second objective was to analyze the ABA content in the leaves
under both SD and LD, to verify that endogenous ABA content in Bougainvillea was
different under different photoperiods.

54
Materials and Methods
Fifty-six rooted cuttings of Bougainvillea ‘Afterglow’ were transplanted into 10 cm
pots filled with 100% 5mm coarse aquarium zeolite (Pentair Aquatic Eco-systems Inc.,
Apopka, FL, USA). Plants were sprayed with 30 µl of ethephon (25 mL of 1200 µL/L
concentration; Southern Agricultural Insecticides, Inc., Hendersonville, NC) to defoliate
them completely, then pruned to a mean height of 12.7cm (+/- 2.8cm). Plants were
placed under long days (LD) 14-hour photoperiod to prevent flowering prior to the start
of the experiment. This was done by supplementing the natural daylight (around 13
hours) with white LED lights supplying 70 µmol m-1s-1 photosynthetic photon flux
(PPF), measured using a handheld quantum meter (Apogee Instruments, Logan, UT).
To prevent nutrient deficiencies, plants were fertilized with Peters Professional Bloom
Booster (10N-30P2O5-20K2O; JR Peters, Allentown, PA) at 9.4 μg N (nitrogen) once per
week starting three weeks prior to the start of the experiment. We continued to apply the
fertilizer at the same rate once per week through the remainder of the experiment. In
addition to fertilizer, plants were watered with 50 mL of tap water (EC = 516 µS, pH =
8.3) every two days.
The experiment was set up in an open-sided greenhouse exposed to ambient air
temperatures (33.0/25.8°C day/night) and 78.6% relative humidity, at the University of
Florida Fort Lauderdale Research and Education Center in Davie, Florida. The plants
were arranged in a complete randomized block design, with two photoperiod treatments
being the block factor (SD=8-hour photoperiod, LD=14-hour photoperiod). Within each
block there were six treatments and one control. Treatments were three rates (75 µL/L,
150 µL/L, 300 µL/L in deionized water) of ethephon (Florel®; Southern Agricultural

55
Insecticides, Inc., Hendersonville, NC) and ABA (ProTone®; Valent Biosciences,
Libertyville, IL). Controls had no plant hormones applied. SD treatments were
considered started on day 1, being the first afternoon when the plants were covered at
4pm. Hormone treatments on SD plants were applied on day 0, along with LD plants.
Each treatment rate had four replicates, each replicate being a single plant.
All hormone treatments were applied as a foliar spray of 50 mL per plant at the
start of the experiment. Plant size, was determined by the equation below, where H =
height, rounded to the nearest cm, W1 = maximum width of the plant to the nearest cm,
and W2 = width of the plant perpendicular to W1, to the nearest:
Size = H × W1 ×W2 (6-1)
Measurements were recorded on day 1 and day 28 of the experiment. Relative growth
was calculated by dividing the difference between plant sizes on day 1 and day 28 by
initial plant size on day 1.
The number of inflorescences on each plant was counted on day 30. One
inflorescence was defined as an individual thorn-inflorescence axil, regardless of how
many florets were attached to the peduncle.
ABA determination: Leaf tissue from the youngest fully expanded leaves were
collected at 1, 3, 7 and 14 days after treatment. Phytohormone abundance was
determined using gas chromatography – mass spectrometry (GC-MS) adapted from
(Engelberth and Engelberth, 2009; Schmelz et al., 2004).
Analytical grade abscisic acid (ABA) was obtained from Sigma-Aldrich (St. Louis,
MO) to be used as internal standards. Solvents used in this procedure were methanol,
methylene chloride (dichloromethane), and 1-propanol. Reagents were hydrochloric

56
acid (Fisher Scientific, Hampton, NH) and trimethylsilyldiazomethane (TMSD) 2.0 M in
hexanes (Sigma-Aldrich, St. Louis, MO).
The procedure used 200 mg of fresh tissue from each replicate was measured
out and placed in a 2 mL homogenizer vial containing 300 µL of an extraction solution
(1-propanol/deionized water/hydrochloric acid in 2:1:0.002 ratio) and 2.8 mm ceramic
homogenizer beads. The samples were then homogenized in a Bead Ruptor 12 bead
mill (Omni International, Kennesaw, GA) for 30 seconds on high, then 1mL of methylene
chloride was added to each vial and the solution homogenized for another 30 seconds.
The vials were then centrifuged at 6000 g for 10 mins. The organic phase (bottom layer)
was carefully extracted with a glass syringe and all-metal hypodermic needle, and
transferred into a 4 mL screw-capped glass vial equipped with a silicone septum. The
extract was then dried under a low air flow in a fume hood until only a thin film
remained. Two hundred µL of methanol was added back to each sample, along with an
internal standard solution of ABA (10 ng in 10 µL of methanol). Five µL of TMSD was
added to derivatize the phytohormones by trimethylsilylation. The samples were
incubated at 45°C for 30 mins. They were then immediately subjected to vapor-phase
extraction (VPE).
VPE was conducted by inserting a Volatile Collection Trap or VCT (Analytical
Research Systems, Gainesville, FL) into the septum of each vial, along with a 20-gauge
hypodermic needle. The VCT was attached to a Tygon R-3603 tube connected to a
vacuum pump operating at -20kPa. The vials were first placed in a heating block at
80°C for 3 min, then moved to another heating block at 240°C for 2 min under vacuum.
After VPE was completed, the vials with the VCTs still attached were removed from the
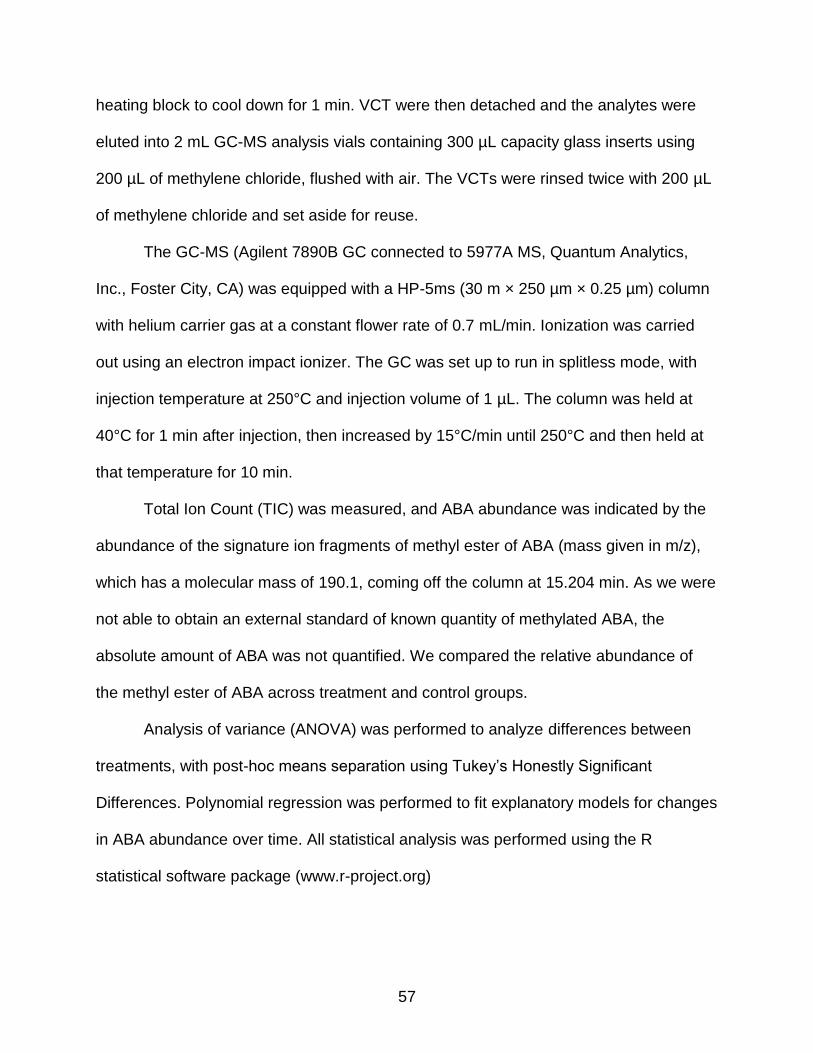
57
heating block to cool down for 1 min. VCT were then detached and the analytes were
eluted into 2 mL GC-MS analysis vials containing 300 µL capacity glass inserts using
200 µL of methylene chloride, flushed with air. The VCTs were rinsed twice with 200 µL
of methylene chloride and set aside for reuse.
The GC-MS (Agilent 7890B GC connected to 5977A MS, Quantum Analytics,
Inc., Foster City, CA) was equipped with a HP-5ms (30 m × 250 µm × 0.25 µm) column
with helium carrier gas at a constant flower rate of 0.7 mL/min. Ionization was carried
out using an electron impact ionizer. The GC was set up to run in splitless mode, with
injection temperature at 250°C and injection volume of 1 µL. The column was held at
40°C for 1 min after injection, then increased by 15°C/min until 250°C and then held at
that temperature for 10 min.
Total Ion Count (TIC) was measured, and ABA abundance was indicated by the
abundance of the signature ion fragments of methyl ester of ABA (mass given in m/z),
which has a molecular mass of 190.1, coming off the column at 15.204 min. As we were
not able to obtain an external standard of known quantity of methylated ABA, the
absolute amount of ABA was not quantified. We compared the relative abundance of
the methyl ester of ABA across treatment and control groups.
Analysis of variance (ANOVA) was performed to analyze differences between
treatments, with post-hoc means separation using Tukey’s Honestly Significant
Differences. Polynomial regression was performed to fit explanatory models for changes
in ABA abundance over time. All statistical analysis was performed using the R
statistical software package (www.r-project.org)

58
Results
Flowering and Growth
There was no difference in relative growth due to photoperiod treatments or
hormone treatments alone. However, there was an interactive effect between
photoperiod and ABA treatments on relative growth. Under LD, relative growth
increased with increasing concentrations of ABA application from 0 to 150µL/L, and
declined from 150 to 300µL/L, while under SD, relative growth increased continually
with increasing concentrations of exogenous ABA (Fig.6-1). Changes in growth due to
ethephon were similar in LD and SD plants. Growth decreased at higher rates of
ethephon application (Fig. 6-2)
There was a significant difference in number of inflorescences on control plants
due to photoperiod, and slight differences due to treatments. Control plants grown under
SD had more inflorescences than plants under LD. Plants grown under SD with ABA075
and ETH150 treatments resulted in more inflorescences than control plants under SD.
Control plants under SD had significantly more flowers than control plants under LD,
which remained completely vegetative (Table 6-1).
Under LD, ABA300 and ETH150 resulted in some flowering. On day 30, ETH300
plants were still recovering vegetative growth, and had no inflorescences.
Although ABA300 and ETH150 did not result in significantly more inflorescences
than controls under LD, they did promote some flowering to a limited extent under LD.
ABA Levels
For plants grown under SD, exogenous ABA treatments showed a direct relation
between the amount of exogenous ABA applied and the overall abundance of ABA. On

59
day 1, ABA300 plants had the greatest abundance of ABA, followed by ABA150, and
ABA07, and control plants. All plants showed a general decrease in ABA levels from
day 1 to day 7 after treatment. ABA300 plants showed the steepest decline in ABA
levels, followed by ABA150, and ABA075. By day 14 after treatment, there were no
significant differences in ABA abundance among all treatments (Fig. 6-3).
For plants under SD and treated with ethephon, the highest abundance of ABA
was found in ETH150 plants, followed by ETH075, ETH300, and control plants. Only
ETH150 treated plants showed a significantly greater abundance of ABA on the first day
after treatment. All plants showed a rapid decline in ABA abundance over the fourteen
days after treatment, with ETH150 plants showing the greatest decline. ABA abundance
on day 14 after treatment did not differ among the treatments (Fig. 6-4).
Plants grown under LD and treated with exogenous ABA had lower abundance of
ABA (about half) compared to SD plants, even on the first day after treatment, although
plants under both photoperiods received the same amount of exogenous ABA (Fig. 6-5
and Fig. 6-4). Plants treated with ABA150 had the greatest abundance of ABA on day 1
after treatment, and rapidly declined over the next 13 days. ABA075 and ABA300 had
the next greatest abundance of ABA, followed by control plants. All plants showed a
rapid decline in ABA over the 14 days after treatment, and there were no differences
among treatments at day 14.
Plants grown under LD and treated with ethephon had the lowest abundance of
endogenous ABA among all groups, with detectable ABA levels at the low end of the
sensitivity of the mass-spectrometer (Fig. 6-6). As in the SD plants, ETH150 plants had
the highest initial abundance of ABA. However, ETH300 plants had the second-highest
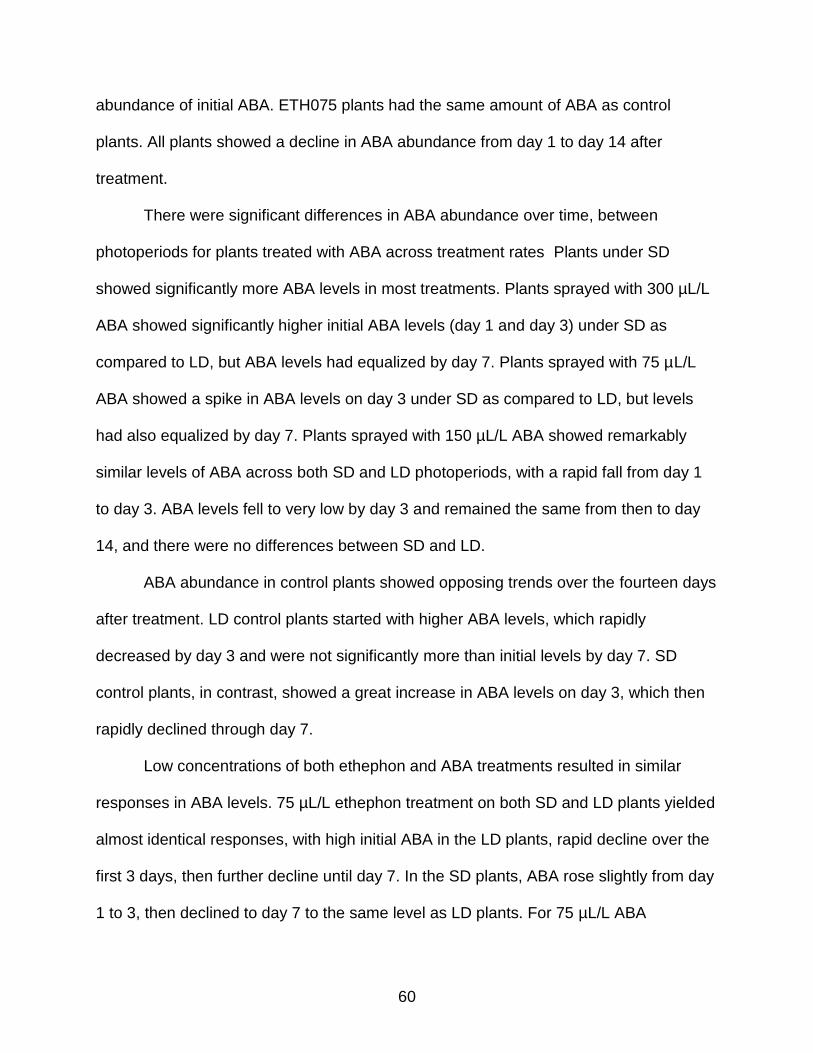
60
abundance of initial ABA. ETH075 plants had the same amount of ABA as control
plants. All plants showed a decline in ABA abundance from day 1 to day 14 after
treatment.
There were significant differences in ABA abundance over time, between
photoperiods for plants treated with ABA across treatment rates Plants under SD
showed significantly more ABA levels in most treatments. Plants sprayed with 300 µL/L
ABA showed significantly higher initial ABA levels (day 1 and day 3) under SD as
compared to LD, but ABA levels had equalized by day 7. Plants sprayed with 75 µL/L
ABA showed a spike in ABA levels on day 3 under SD as compared to LD, but levels
had also equalized by day 7. Plants sprayed with 150 µL/L ABA showed remarkably
similar levels of ABA across both SD and LD photoperiods, with a rapid fall from day 1
to day 3. ABA levels fell to very low by day 3 and remained the same from then to day
14, and there were no differences between SD and LD.
ABA abundance in control plants showed opposing trends over the fourteen days
after treatment. LD control plants started with higher ABA levels, which rapidly
decreased by day 3 and were not significantly more than initial levels by day 7. SD
control plants, in contrast, showed a great increase in ABA levels on day 3, which then
rapidly declined through day 7.
Low concentrations of both ethephon and ABA treatments resulted in similar
responses in ABA levels. 75 µL/L ethephon treatment on both SD and LD plants yielded
almost identical responses, with high initial ABA in the LD plants, rapid decline over the
first 3 days, then further decline until day 7. In the SD plants, ABA rose slightly from day
1 to 3, then declined to day 7 to the same level as LD plants. For 75 µL/L ABA
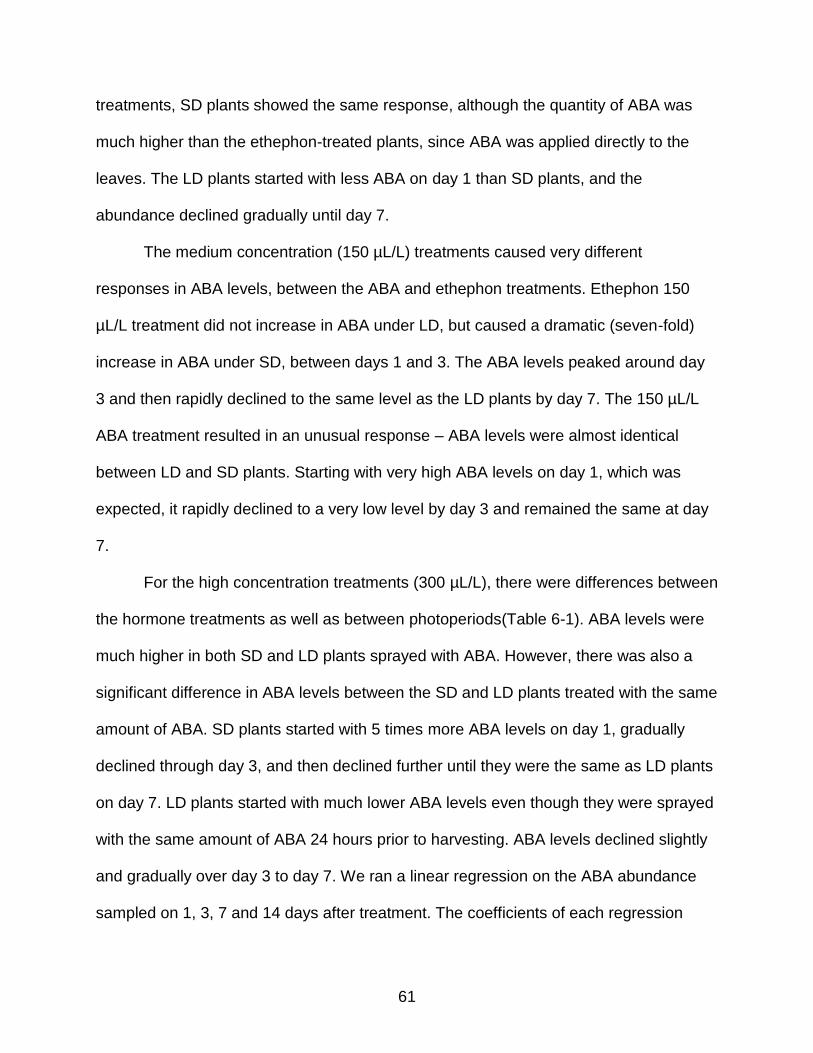
61
treatments, SD plants showed the same response, although the quantity of ABA was
much higher than the ethephon-treated plants, since ABA was applied directly to the
leaves. The LD plants started with less ABA on day 1 than SD plants, and the
abundance declined gradually until day 7.
The medium concentration (150 µL/L) treatments caused very different
responses in ABA levels, between the ABA and ethephon treatments. Ethephon 150
µL/L treatment did not increase in ABA under LD, but caused a dramatic (seven-fold)
increase in ABA under SD, between days 1 and 3. The ABA levels peaked around day
3 and then rapidly declined to the same level as the LD plants by day 7. The 150 µL/L
ABA treatment resulted in an unusual response – ABA levels were almost identical
between LD and SD plants. Starting with very high ABA levels on day 1, which was
expected, it rapidly declined to a very low level by day 3 and remained the same at day
7.
For the high concentration treatments (300 µL/L), there were differences between
the hormone treatments as well as between photoperiods(Table 6-1). ABA levels were
much higher in both SD and LD plants sprayed with ABA. However, there was also a
significant difference in ABA levels between the SD and LD plants treated with the same
amount of ABA. SD plants started with 5 times more ABA levels on day 1, gradually
declined through day 3, and then declined further until they were the same as LD plants
on day 7. LD plants started with much lower ABA levels even though they were sprayed
with the same amount of ABA 24 hours prior to harvesting. ABA levels declined slightly
and gradually over day 3 to day 7. We ran a linear regression on the ABA abundance
sampled on 1, 3, 7 and 14 days after treatment. The coefficients of each regression

62
were plotted on a scatter plot and a polynomial regression was performed on the slopes
to show the relationship between the increasing application rate of ethephon and
exogenous ABA on the change in endogenous ABA levels over the first 14 days after
treatment. The results showed that ABA levels in all plants, including controls, declined
over the first 14 days after treatment. Plants showed greater decline in endogenous
ABA levels when sprayed with between 75 to 150 µL/L of ethephon (Figure 6-7).
Between 150 to 300 µL/L application rates, the decline in endogenous ABA levels was
reduced.
With exogenous ABA applications, there was a similar trend in the change in total
ABA levels in the leaf tissues over the same fourteen-day period. However, the amount
of change in ABA levels was much greater than the ethephon-treated plants. All plants
under exogenous ABA treatments showed a decline in ABA levels over the first fourteen
days after treatment. Plants under LD showed an increasing decline in ABA between 0
to 150 µg/L ABA application, and a reduced decline in ABA from between 150 to 300
µg/L application. Under SD, plants showed an increasing decline in overall ABA level
with increasing application rates of exogenous ABA (Fig. 6-8).
Discussion
We sought to discover if exogenous ABA and ethylene application in the form of
ProTone® and Florel® foliar sprays would promote flowering under non-inductive
conditions. The results from this experiment suggest that photoperiodic inhibition of
flowering in this cultivar of Bougainvillea was the dominant factor in controlling the
flowering response, and the hormone treatments did not contribute significantly to the
promotion of flowering.

63
These results contrast with Liu and Chang (2011), who found that ETH075 could
promote flowering of Bougainvillea ‘Taipei Red’ vegetative shoots. However, those
experiments were conducted in the spring in Taipei under natural daylight conditions,
which would have been SD photoperiods. We found that under sufficiently short
photoperiod (8 hours), control plants with no ethephon applied flowered as much as
those with ETH075.
Photoperiod appeared to be the overriding factor influencing flowering of
Bougainvillea ‘Afterglow’, as shown by the strong inhibitory effect of LD treatment on
flowering. Since ABA300 did induce a slight flowering response in both SD and LD,
while lower concentrations of ABA did not, we suggest that further examination of higher
application rates of ABA might be useful in determining if flowering could be promoted.
The difference in ABA levels across photoperiod was unexpected, especially
under the ABA treatments, given that the amounts of exogenous ABA applied was the
same across photoperiods. This suggests that endogenous ABA levels in Bougainvillea
are different depending of photoperiod, which would be of interest to examine in further
detail. Endogenous ABA in the LD spinach (Spinacia oleracea) was found to be higher
under the inductive LD photoperiod than under non-inductive SD (Zeevaart, 1971).
Growth of Bougainvillea appeared to be affected by exogenous application of ABA,
promoting shoot lengthening under SD, while inhibiting growth under LD. In addition,
flowering was reduced under SD with increasing concentration of exogenous ABA. It
has been found that gibberellic acid (GA) applied to Bougainvillea under SD inhibits
flowering, while application of GA-inhibitors promotes flowering under SD conditions. It
has been established that GA is an inhibitory hormone to flowering in Bougainvillea

64
(Hackett and Sachs, 1985.; Ramina et al., 1979; Tse et al., 1974). It is also known that
GA is a promotor of shoot elongation and cell expansion (Taiz and Zeiger, 2010; Talon
and Zeevaart, 1990). These results in Bougainvillea suggest that excessive ABA has a
promotive effect on endogenous GA, which would explain greater lengthening of shoots,
while suppressing flowering even under inductive SD conditions. This effect appears to
take place only if the amount of exogenous ABA applied is higher than 15 µg per plant,
or 300 µL/L in solution, which represents a significant increase over the normal
endogenous levels of ABA.
Ethylene levels corresponded with ABA levels on day 1 after treatment, with a
weak correlation (R=0.41, p-value = 4.31e-06), suggesting that exogenous ABA
application does not affect ethylene functions directly.
Summary
In this experiment, we used exogenous ABA to simulate the sharp increase in
endogenous ABA when a plant is under WDS. However, under production
circumstances, irrigation upon the first signs of wilting would rapidly reduce the amount
of ABA in the leaves, as observed by Zeevaart (1971) in the case of spinach, whereas
exogenous ABA could be expected to remain in the leaf tissue for an extended period
regardless of the presence or absence of abiotic stresses. Therefore, for future research
it would be pertinent to observe the differences in levels of endogenous ABA in
Bougainvillea under WDS, as well as under SD and LD conditions. The role of
endogenous GA in Bougainvillea is also important to examine as the functionality of
ABA and ethephon on flowering may be regulated by the GA pathway. The next step in
the project would be to examine the effect of exogenous ABA and ethephon application
on the GA levels in flowering and non-flowering Bougainvillea shoots.
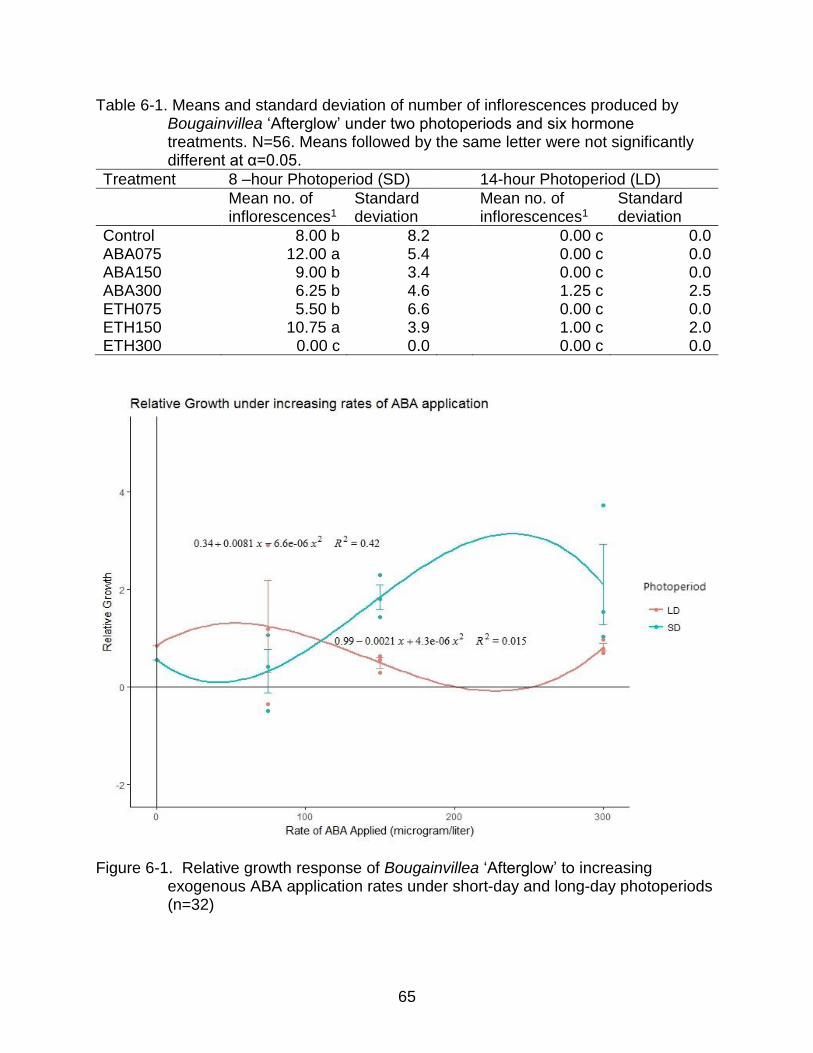
65
Table 6-1. Means and standard deviation of number of inflorescences produced by Bougainvillea ‘Afterglow’ under two photoperiods and six hormone treatments. N=56. Means followed by the same letter were not significantly different at α=0.05.
Treatment 8 –hour Photoperiod (SD) 14-hour Photoperiod (LD)
Mean no. of inflorescences1
Standard deviation
Mean no. of inflorescences1
Standard deviation
Control 8.00 b 8.2 0.00 c 0.0 ABA075 12.00 a 5.4 0.00 c 0.0 ABA150 9.00 b 3.4 0.00 c 0.0 ABA300 6.25 b 4.6 1.25 c 2.5 ETH075 5.50 b 6.6 0.00 c 0.0 ETH150 10.75 a 3.9 1.00 c 2.0 ETH300 0.00 c 0.0 0.00 c 0.0
Figure 6-1. Relative growth response of Bougainvillea ‘Afterglow’ to increasing exogenous ABA application rates under short-day and long-day photoperiods (n=32)

66
Figure 6-2. Relative growth response of Bougainvillea ‘Afterglow’ to increasing rates of ethephon under short-day and long-day photoperiods (n=32).

67
Figure 6-3. Abundance of abscisic acid (ABA) in plants grown under SD (8-hour) photoperiod, over 14 days after exogenous ABA treatment. (trt= treatment, aba=abscisic acid, 75=75 µL/L, 150=150 µL/L, 300=300 µL/L, n=32)

68
Figure 6-4. Abundance of abscisic acid (ABA) in Bougainvillea ‘Afterglow’ grown under SD (8-hour) photoperiod, over 14 days after ethephon treatment. (eth=ethephon, 075=75 µL/L, 150=150 µL/L, 300=300 µL/L, n=32)
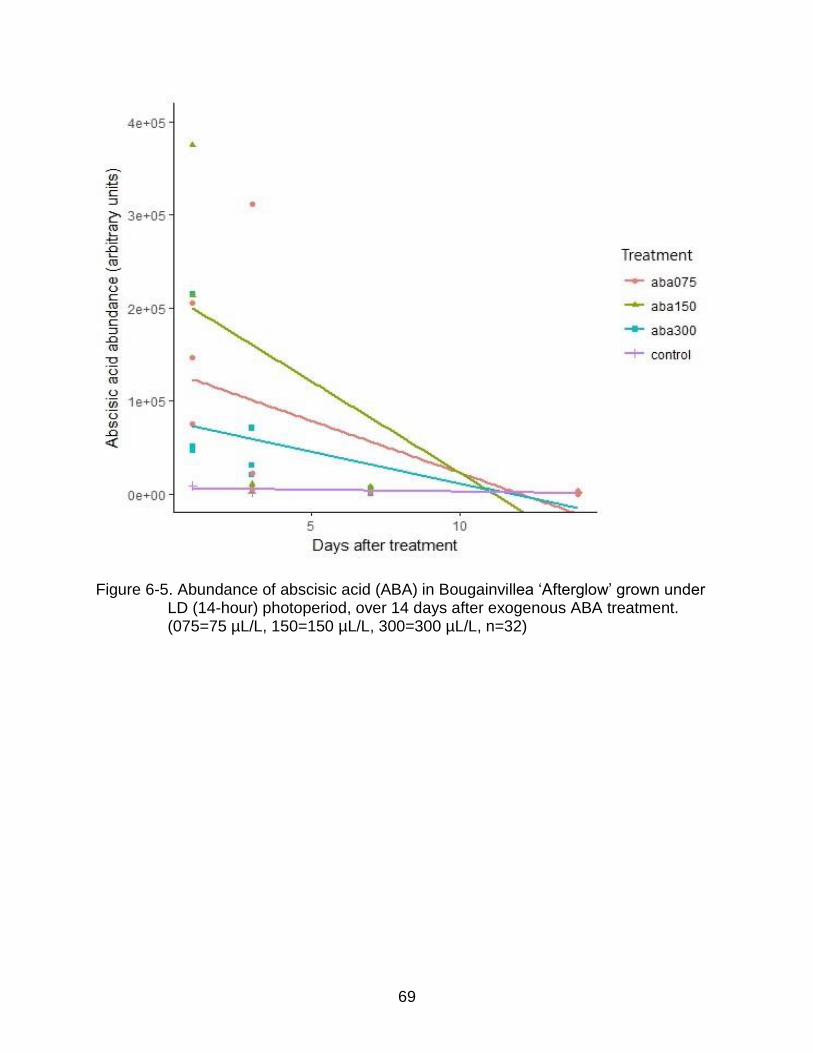
69
Figure 6-5. Abundance of abscisic acid (ABA) in Bougainvillea ‘Afterglow’ grown under LD (14-hour) photoperiod, over 14 days after exogenous ABA treatment. (075=75 µL/L, 150=150 µL/L, 300=300 µL/L, n=32)
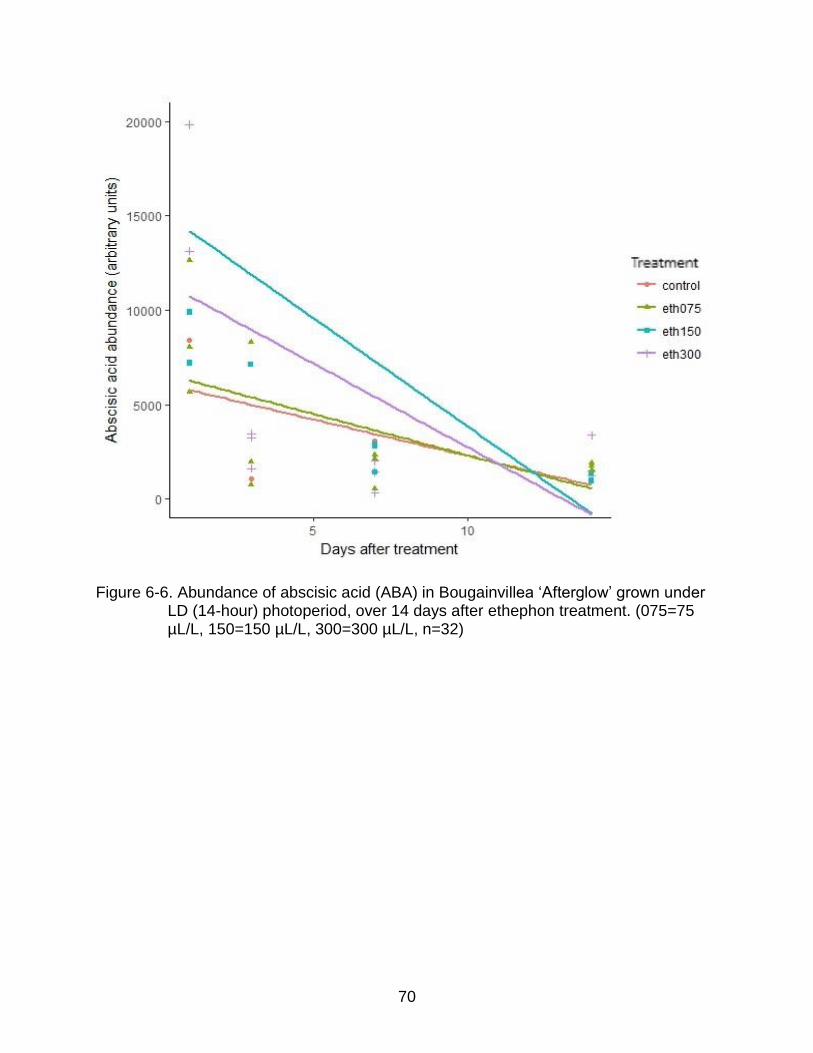
70
Figure 6-6. Abundance of abscisic acid (ABA) in Bougainvillea ‘Afterglow’ grown under LD (14-hour) photoperiod, over 14 days after ethephon treatment. (075=75 µL/L, 150=150 µL/L, 300=300 µL/L, n=32)

71
Figure 6-7. Change in endogenous ABA levels under increasing rates of ethephon application (n=32)

72
Figure 6-8. Change in endogenous ABA levels in Bougainvillea ‘Afterglow’ in response to increasing rates of exogenous ABA application under short-day and long-day photoperiods (n=32).

73
CHAPTER 7 PHOTOPERIOD, EXOGENOUS ABA AND ETHYLENE EFFECTS ON FLOWERING
AND ENDOGENOUS GIBBERELLIC ACID IN BOUGAINVILLEA ‘AFTERGLOW’
Introduction
Flowering response in Bougainvillea ‘Afterglow’ was strongly influenced by
photoperiod, with short-day (SD) photoperiod of 8 hours promoting early and profuse
flowering, while long-day (LD) photoperiod of 14 hours effectively inhibited flowering
under otherwise normal growing conditions.
Gibberellic acid (GA) is known to accumulate in leaf tissue during periods of
darkness in Arabidoposis thaliana, which is a LD plant (Taiz and Zeiger, 2010). GA is
also a flowering promoter in LD plants, such as A. thaliana (Wilson et al., 1992), spinach
(Spinacia oleracea) (Metzger and Zeevaart, 1980), and Silene armeria (Talon and
Zeevaart, 1990). However, its function in the flowering response of SD plants is not
clear. Since exogenous GA has been found to be an inhibitor of flowering in
Bougainvillea under SD (Ramina et al., 1979; Tse et al., 1974), and GA-inhibiting plant
growth regulators (PGR) have been found to promote flowering of some Bougainvillea
cultivars under SD conditions (Aldrich and Norcini, 1996; Karagüzel, 1999; Ma and Gu,
2010), we would expect that endogenous GA would be lower in Bougainvillea growing
under SD and higher in plants grown under LD (Even-Chen et al., 1979). The evidence
from the literature, which comprises indirect testing through GA and GA-inhibitor
application, supports this hypothesis. The first objective of this study was to verify the
hypothesis that endogenous GA in SD was significantly lower than that under LD,
through the direct measurement of GA abundance in the leaf tissue.
In preliminary experiments, we found that some degree of water deficit stress
(WDS) can promote flowering of Bougainvillea under LD conditions (Appendix A). As

74
ABA is known to increase dramatically within 24 hours of WDS onset (Jiang and Zhang,
2002; Zeevaart, 1971), and decrease rapidly once the stress is relieved, we expected
that some level of exogenous ABA application might promote flowering of Bougainvillea
under LD. In LD spinach, it was found that plants under SD had lower endogenous ABA
levels and remained vegetative, while plants under LD had higher ABA levels, and went
into the reproductive phase (Zeevaart, 1971). The second objective of this study was to
examine the endogenous ABA levels under both SD and LD. We expect to find that
plants under SD conditions will have higher levels of endogenous ABA. We found that
exogenous ABA applied at 300 µL/L as a foliar spray had a limited effect of promoting
flowering under LD conditions. As ABA is synthesized in the leaves and roots, and can
be transported from the roots to the shoots when WDS was detected (Malladi and
Burns, 2007), it seems likely that the effect of exogenous ABA application would differ
between a foliar spray and a soil drench method. Therefore, for this study, exogenous
ABA will be applied as a soil drench.
Both exogenous ethylene and ABA appear to promote flowering of Bougainvillea
at low application rates. Therefore, we may expect that these applications have the
effect of inhibiting GA content in Bougainvillea shoots. The third objective of this study
was to examine if the application of exogenous ethylene and ABA at various
concentrations reduced or increased endogenous GA in Bougainvillea.
Materials and Methods
Sixty-five rooted cuttings of Bougainvillea ‘Afterglow’ were transplanted into 10-
cm pots filled with 100% 5 mm coarse aquarium zeolite (Pentair Aquatic Eco-systems
Inc., Apopka, FL, USA). Plants were sprayed with 30 µl of ethephon (25 mL of 1200
µL/L solution; Southern Agricultural Insecticides, Inc., Hendersonville, NC) to defoliate

75
them completely, then pruned to a mean height of 12.7 cm (+/- 2.8 cm). Plants were
then placed under long days (LD) 14-hour photoperiod to prevent flowering prior to the
start of the experiment. This was done by supplementing the natural daylight (around 13
hours) with white LED lights supplying 70 µmol m-1s-1 photosynthetic photon flux
(PPF), measured using a handheld quantum meter (Apogee Instruments, Logan, UT).
To prevent nutrient deficiencies, plants were fertilized with Peters Professional Bloom
Booster (10N-30P2O5-20K2O; JR Peters, Allentown, PA) at 9.4 μg N (nitrogen) once per
week starting three weeks prior to the start of the experiment. We continued to apply the
fertilizer at the same rate once per week through the remainder of the experiment. In
addition to fertilizer, plants were watered with 50 mL of tap water (EC = 516 µS, pH =
8.3) every two days.
The plants were arranged in a complete randomized design on one bench in an
open-sided greenhouse exposed to ambient air temperatures (26.6/17.9°C day/night)
and 76.0% relative humidity, at the University of Florida Fort Lauderdale Research and
Education Center in Davie, Florida.
There were two treatments without any hormones applied – LD control, and SD
control . The SD treatment was carried out by covering the plants with a black plastic 5-
gallon container between 4pm and 8am the following morning, for the duration of the
experiment. Two PGR treatments, ethephon (Florel®; Southern Agricultural
Insecticides, Inc., Hendersonville, NC) and ABA (ProTone®; Valent Biosciences,
Libertyville, IL), were applied on LD plants. Ethephon concentrations applied were 50
µL/L, 75 µL/L, 100 µL/L, 150 µL/L, 200 µL/L, applied as a foliar spray of 25 mL per
plant. Ethephon treatments from hereon will be indicated by “FL” followed by the

76
concentration, e.g. FL50, FL75, …etc. ABA application rates were 50 µL/L, 75 µL/L, 150
µL/L , 300 µL/L, 400 µL/L, and 500 µL/L, applied as a soil drench of 100mL per plant .
ABA treatments from hereon will be indicated as PR50, PR75 …etc. Each treatment
rate, including controls, contained 5 replicates, with each replicate being an individually
potted plant.
The number of inflorescences on each plant was counted on day 48 after
treatment. One inflorescence was defined as an individual thorn-inflorescence axil,
regardless of how many florets were attached to the peduncle.
ABA determination
ABA abundance was determined using gas chromatography – mass
spectrometry (GC-MS) adapted from Engelberth and Engelberth, (2009) and Schmelz
et al., (2004).
Analytical grade abscisic acid (ABA) was obtained from Sigma-Aldrich (St. Louis,
MO) to be used as internal standards. Solvents used in this procedure were methanol,
methylene chloride (dichloromethane), and 1-propanol. Reagents were hydrochloric
acid (Fisher Scientific, Hampton, NH) and trimethylsilyldiazomethane (TMSD) 2.0M in
hexanes (Sigma-Aldrich, St. Louis, MO).
200mg of fresh tissue from each replicate was measured out and placed in a 2
mL homogenizer vial containing 300 µL of an extraction solution (1-propanol/deionized
water/hydrochloric acid in 2:1:0.002 ratio) and 2.8 mm ceramic homogenizer beads. The
samples were then homogenized in a Bead Ruptor 12 bead mill (Omni International,
Kennesaw, GA) for 30 seconds on high, then 1 mL of methylene chloride was added to
each vial and the solution homogenized for another 30 seconds. The vials were then
centrifuged at 6000 g for 10 mins. The organic phase (bottom layer) was carefully

77
extracted with a glass syringe and all-metal hypodermic needle, and transferred into a 4
mL screw-capped glass vial equipped with a silicone septum. The extract was then
dried under a low air flow in a fume hood until only a thin film remained. 200 µL of
methanol was then added back to each sample, along with an internal standard solution
of ABA (10 ng in 10 µL of methanol). 5 µL of TMSD was then added to derivatize the
phytohormones by trimethylsilylation. The samples were incubated at 45°C for 30 mins.
They were then immediately subjected to vapor-phase extraction (VPE).
VPE was conducted by inserting a Volatile Collection Trap or VCT (Analytical
Research Systems, Gainesville, FL) into the septum of each vial, along with a 20-gauge
hypodermic needle. The VCT was attached to a Tygon R-3603 tube connected to a
vacuum pump operating at -20 kPa. The vials were first placed in a heating block at
80°C for 3 min, then moved to another heating block at 240°C for 2 min under vacuum.
After VPE was completed, the vials with the VCTs still attached were removed from the
heating block to cool down for 1 min. VCT were then detached and the analytes were
eluted into 2 mL GC-MS analysis vials containing 300 µL capacity glass inserts using
200 µL of methylene chloride, flushed with air. The VCTs were then rinsed twice with
200 µL of methylene chloride and set aside for reuse.
The GC-MS (Agilent 7890B GC connected to 5977A MS, Quantum Analytics,
Inc., Foster City, CA) was equipped with a HP-5ms (30 m × 250 µm × 0.25 µm) column
with helium carrier gas at a constant flower rate of 0.7 mL/min. Ionization was carried
out using an electron impact ionizer. The GC was set up to run in splitless mode, with
injection temperature at 250°C and injection volume of 1 µL. The column was held at

78
40°C for 1 min after injection, then increased by 15°C/min until 250°C and then held at
that temperature for 10 min.
Total Ion Count (TIC) was measured, and ABA abundance was indicated by the
abundance of the signature ion fragments of methyl ester of ABA (mass given in m/z),
which has a molecular mass of 190.1, coming off the column at 15.204 min. As we were
not able to obtain an external standard of known quantity of methylated ABA, the
absolute amount of ABA was not quantified. We compared the relative abundance of
the methyl ester of ABA across treatment and control groups.
GA determination
The abundance of GA in the leaf tissue was determined using an adapted
version of the spectrophotometric method as developed by Holbrook, Edge and Bailey,
(1961) and further modified by Berríos, Illanes and Aroca, (2004). Chemicals and
reagents used were: Zinc acetate solution (21.9 g zinc acetate dissolved in deionized
water and 1 mL glacial acetic acid, made up to 100 mL); Potassium ferrocyanide
solution (10.6 g analytical grade potassium ferrocyanide dissolved in 100 mL DI water);
dilute hydrochloric acid 35% (HCl); and gibberellic acid (GA3) standard (analytical grade
GA3 dissolved in ethanol at various concentrations for calibration).
Fresh tissue was harvested from plants and 200 mg from each replicate was
weighed out and homogenized in 0.5 mL of methanol, and then centrifuged at 6000 g
for 3 mins. The extract was transferred into a glass vial, to which 1 mL of ethanol and 1
mL of deionized water was added, followed by 1 mL of the zinc acetate solution, and the
mixture vigorous shaken and left to stand for 2 minutes at room temperature. One mL of
the potassium ferrocyanide solution was then added to the mixture and vortexed for 10
seconds, then left to stand for 10 minutes and vortexed for another 10 seconds. The

79
resulting precipitate was filtered using P8 filter paper (Fisher Scientific, Waltham, MA,
USA), and the clear extract retained for analysis. A 500 µL sample of the extract was
transferred into a test tube. When the sample was ready to be analyzed, 800 µL of
dilute HCl was added to the test tube, which was then vigorously shaken, and then
pipetted into a quartz cuvette, to be analyzed in the ultra-violet spectrophotometer (Cary
100, Varian Inc, Palo Alto, CA, USA) with absorbance measured at 254 nm over 2
minutes. The differentials of the resulting curves were measured against a calibration
curve constructed prior to the experiment using known concentrations of GA3 standard
solutions of 0.125, 0.25, 0.5, and 1.0 µg/L. The resulting quotient would be the
concentration of GA in the sample, expressed in µg/L.
ABA and GA abundance was collected on 1, 3, 7, 28 and 48 days after
treatment, when most of the plants that had inflorescences were visibly blooming.1
Linear regression was performed on ABA and GA abundance over time to determine
the rate of change in hormone levels in response to the treatments.
All statistical analysis was performed using the R statistical software package
(www.r-project.org). Tests conducted include analysis of variance (ANOVA), with post-
hoc means separation using Tukey’s Honestly Significant Differences, linear regression
and logistic regression.
1 All treatments showed a high percentage (between 75% to 100%) of defoliation within 72 hours of treatment, except for FL50, FL75 and PR50, which showed minimal defoliation. This resulted in difficulty having enough tissue to collect for analysis of hormones on day 7 after treatment.
80
Results
Flowering Response
Polynomial regression on the number of flowers in response to the increasing
rate of ethephon applications showed that there was a negative relationship between
ethephon rates from 50 to 200 µL/L and flowering. Further increases in rates of
ethephon application resulted in reduced flowering. FL50 plants produced the highest
number of flowers (mean=10.6, P<0.01), which were higher than the SD control
(mean=9.6, P<0.05). Both were significantly higher than the LD control (mean=1.8).
FL50 application on plants grown under LD most closely matched the natural
photoperiod-induced flowering response for the SD plants All other FL treatments
resulted in some flower but the numbers of flowers were not significantly more than the
LD controls (Table 7-1).
FL75 and PR50 also induced more flowering than LD control plants, but were
much fewer than FL50 and SD controls. FL50 and SD plants also started flowering
earlier than all other plants, starting at 35 days after treatment, while the other plants
that did eventually flower only did so from day 45 to day 48.
There was no significant relationship between exogenous ABA application and
flowering response. At low rates between 50 to 150 µL/L of ABA application, there was
some flowering response but these were not significantly different to the control plants
(Fig. 7-2).
High concentration applications of ABA (PR300, PR400 and PR500) induced a
delayed senescence of foliage, leading to complete (100%) loss of leaves by 4 days
after treatment and were slow to recover growth. None of the plants under these
treatments produced any flowers.
81
ABA Levels
There was a significant difference in endogenous ABA levels between SD and
LD control plants (Fig. 7-3). Plants under SD showed an increase in ABA levels over the
first 7 days after treatment, but plants under LD showed no change in endogenous ABA
levels.
Among exogenous ABA treated plants, PR300 plants showed a significant
increase in total ABA, rising exponentially to 9 times more than other treatments at day
7 (Fig. 7-3). PR150 and PR500 plants had an increase in total ABA between day 1 and
3, and decline between day 3 and 7. PR400 plants showed an initial decrease in total
ABA, followed by an increase to the same initial level at day 7. PR75 plants showed a
consistent decrease in total ABA from day 1 to day 7.
Among ethephon treatments, FL100 plants showed the highest increase in
endogenous ABA, followed by FL150 plants. Other ethephon treatments resulted in no
significant changes in endogenous ABA (Fig. 7-5).
GA Levels
There were also differences between treatments in terms of the change in GA levels
over the experimental period of 48 days. Linear regression was run on GA
concentrations sampled on 1, 3, 7, 28 and 48 days after treatment. The coefficients
(slope) of each sample were then plotted on a polynomial regression curve comparing
the amount of change in GA levels at each application rate. Among ethephon
treatments, GA levels decreased over the experimental period (showed a negative
slope) between 0 to 75 µL/L application rates. GA levels increased in response to
increasing ethephon application rates between 75 to 150 µL/L, and decreased in
response to the 200 µL/L application rate (Fig. 7-6). Fig. 7-1 and 7-6 showed mirroring

82
trends. Change in GA levels corresponded with the flowering response under increasing
concentration of ethephon treatments. Between 0 to 75 µL/L of ethephon, plants
showed an increase in number of flowers. Between 75 to 150 µL/L, there were zero or
insignificant inflorescences (P>0.1). At 200 µL/L application rate, there was some
flowering response. Changes in GA levels were inversely related to flowering response.
SD and LD controls showed a significant difference in the change in GA levels,
as was expected. SD control plants, had a marked decrease in GA levels, while LD
control plants had a very slight decrease in GA levels (Table 7-2). More notably, all
treatments that yielded exactly zero flowers (PR300, PR400 and PR500) showed an
increase in GA levels over the 48-day period, instead of a decrease. Among all PGR
treatments, only FL50 (mean = -0.44 µg/L) plants showed a marked decrease in GA
levels compared to controls. However, this decrease was not as significant as the
decrease in SD control plants (mean=-1.09 µg/L). GA levels increased in all ABA
treatments, except for PR50, which had a mean decrease of -0.4 µg/L. The lowest rate
of ABA drench, PR50, led to a decrease in GA levels and resulted in a positive flowering
response. In treatments at rates higher than 50 µg/L, exogenous ABA caused an
increase in overall GA levels, and did not lead to any significant flowering response.
Among ethephon treatments, there were significant differences in the change in
GA levels in plants under FL50 and FL100 treatments. FL50 plants showed the greatest
decrease in GA levels over the experiment, while FL100 plants showed the greatest
increase. FL50 plants, as noted, produced the most flowers, while FL100 plants did not
produce any (mean=0.5). FL150 plants showed a much smaller increase in GA levels,
which also resulted in negligible flowering (mean=0.5). FL75 and FL200 plants both
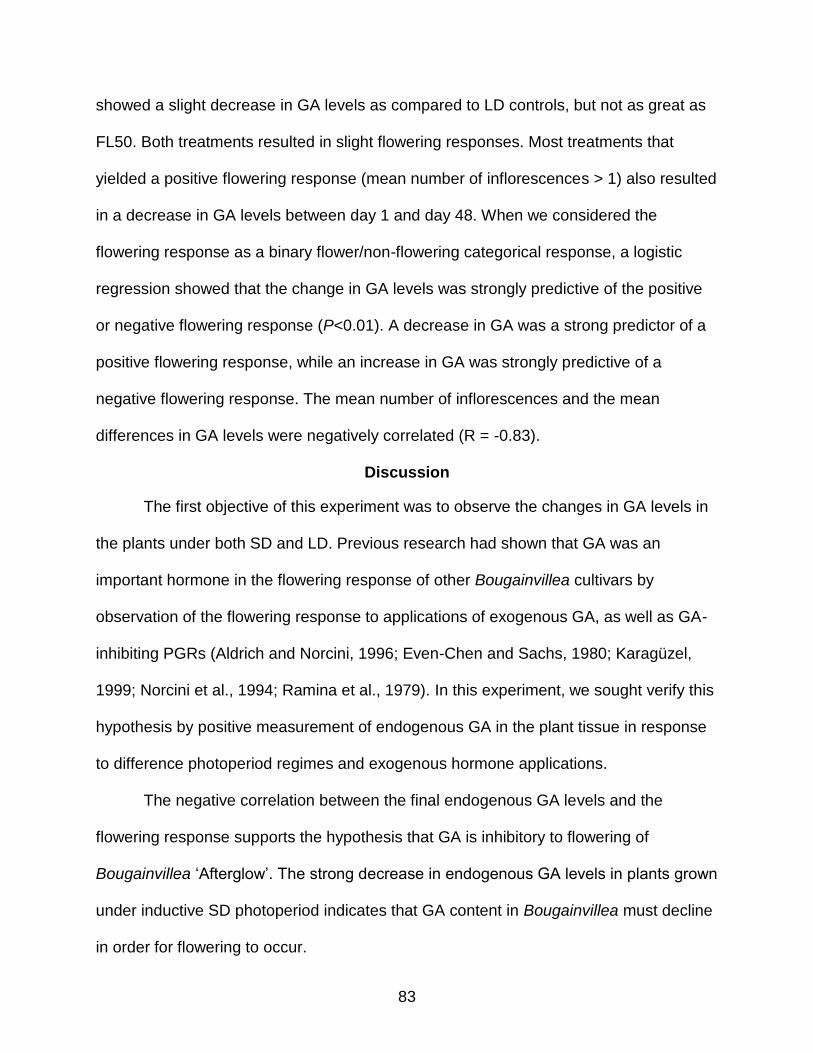
83
showed a slight decrease in GA levels as compared to LD controls, but not as great as
FL50. Both treatments resulted in slight flowering responses. Most treatments that
yielded a positive flowering response (mean number of inflorescences > 1) also resulted
in a decrease in GA levels between day 1 and day 48. When we considered the
flowering response as a binary flower/non-flowering categorical response, a logistic
regression showed that the change in GA levels was strongly predictive of the positive
or negative flowering response (P<0.01). A decrease in GA was a strong predictor of a
positive flowering response, while an increase in GA was strongly predictive of a
negative flowering response. The mean number of inflorescences and the mean
differences in GA levels were negatively correlated (R = -0.83).
Discussion
The first objective of this experiment was to observe the changes in GA levels in
the plants under both SD and LD. Previous research had shown that GA was an
important hormone in the flowering response of other Bougainvillea cultivars by
observation of the flowering response to applications of exogenous GA, as well as GA-
inhibiting PGRs (Aldrich and Norcini, 1996; Even-Chen and Sachs, 1980; Karagüzel,
1999; Norcini et al., 1994; Ramina et al., 1979). In this experiment, we sought verify this
hypothesis by positive measurement of endogenous GA in the plant tissue in response
to difference photoperiod regimes and exogenous hormone applications.
The negative correlation between the final endogenous GA levels and the
flowering response supports the hypothesis that GA is inhibitory to flowering of
Bougainvillea ‘Afterglow’. The strong decrease in endogenous GA levels in plants grown
under inductive SD photoperiod indicates that GA content in Bougainvillea must decline
in order for flowering to occur.

84
The second objective of this experiment was to examine the effect of photoperiod
on endogenous ABA levels in Bougainvillea. The results support the hypothesis that
endogenous ABA is dependent on photoperiod, as SD plants contained a significantly
higher amount of ABA than LD plants. The relationship between ABA and GA is
complicated, but it has been suggested that the hormones are antagonistic as related to
light-sensing and response (Alabadí and Blázquez, 2009; Kojima, 1996; Lau and Deng,
2010). The high endogenous levels of ABA and correspondingly low levels of GA in SD
plants suggests that this is the case in Bougainvillea. The reverse occurs when grown
under LD, as endogenous ABA is low, although in this experiment we did not find that
endogenous GA was any higher than in SD plants.
The last objective of this experiment was to examine the effect of the application
of low rates of ethephon and ABA to plants grown under non-inductive LD photoperiod.
The two hormones were found in previous experiments to promote flowering under SD
conditions and to a limited extent under LD conditions. This experiment found that
application of low rates of both hormones resulted in positive flowering responses as
well as a slight reduction in GA levels. However, as the rate of exogenous hormones
was increased, the effect on GA level gradually reversed. The suppressive effect of
ethylene and ABA on GA in Bougainvillea appears to be dose-dependent. In the
previous chapter, it was noted that high concentrations of exogenous ABA appeared to
promote shoot elongation at the expense of flowering even under otherwise-inductive
SD conditions. In this experiment, we found that higher concentrations of exogenous
ABA had a markedly positive effect on the total GA levels in Bougainvillea over the
experimental period under LD. The plants treated with PR400 and PR500 were greatly

85
inhibited in their growth, as was found in the previous experiment with PR300 plants
grown under LD.
The effect that GA has on flowering in Bougainvillea suggests that its function in
photoperiod sensing is different from the DELLA-mediated PIF5 degradation model
(Cheng et al., 2004; Li et al., 1992; Schwechheimer and Willige, 2009) constructed from
the study of genetic responses in the LD plant Arabidopsis thaliana. Rather than
promote a flowering response under long periods of darkness, GA in Bougainvillea
appears to accumulate under long periods of light and promotes shoot growth.
Summary
In conclusion, the interaction between ABA and ethylene in Bougainvillea is still
unclear, although the results from this experiment and in the previous chapter suggest
that they are bi-directional controllers in terms of flowering. It is very likely that their
signaling involves the GA pathway in Bougainvillea. Ethylene is a promoter of flowering
of Bougainvillea under SD conditions, and can break LD inhibition if applied at a very
low rate of 50 µL/L as a foliar spray. It is notable that ABA appears to be an important
part of the photoperiod response. A low concentration soil drench of 75 to 100 µL/L to
potted Bougainvillea may be able to break LD inhibition, but this still need further
verification. The integration of endogenous ABA and GA signaling is probably important
in understanding the control of flowering time in Bougainvillea ‘Afterglow’.

86
Figure 7-1. Number of inflorescences on Bougainvillea ‘Afterglow’ under increasing rates of ethephon application (n=30).

87
Figure 7-2. Number of inflorescences in Bougainvillea ‘Afterglow’ under increasing rate of exogenous ABA applications (n=30).

88
Figure 7-3. Endogenous levels of ABA in Bougainvillea ‘Afterglow’ under short-day and long-day photoperiods (n=10)

89
Figure 7-4. Change in endogenous ABA levels in Bougainvillea ‘Afterglow’ under
increasing ABA application rates.
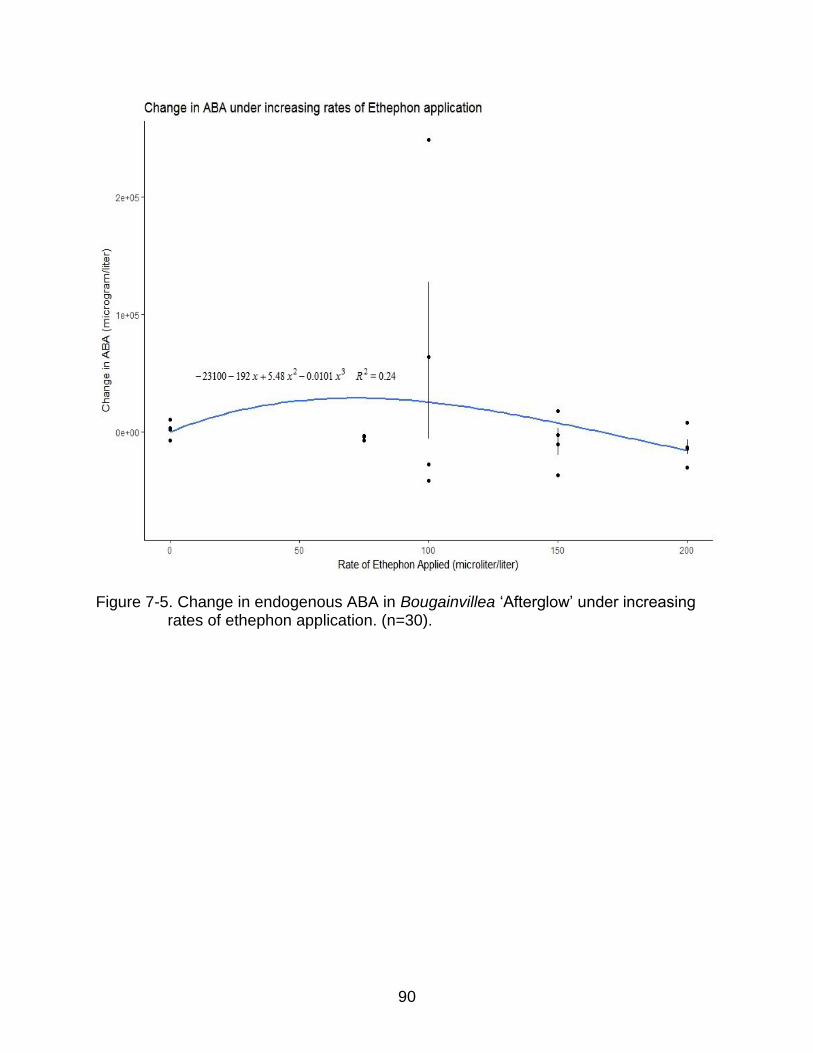
90
Figure 7-5. Change in endogenous ABA in Bougainvillea ‘Afterglow’ under increasing rates of ethephon application. (n=30).
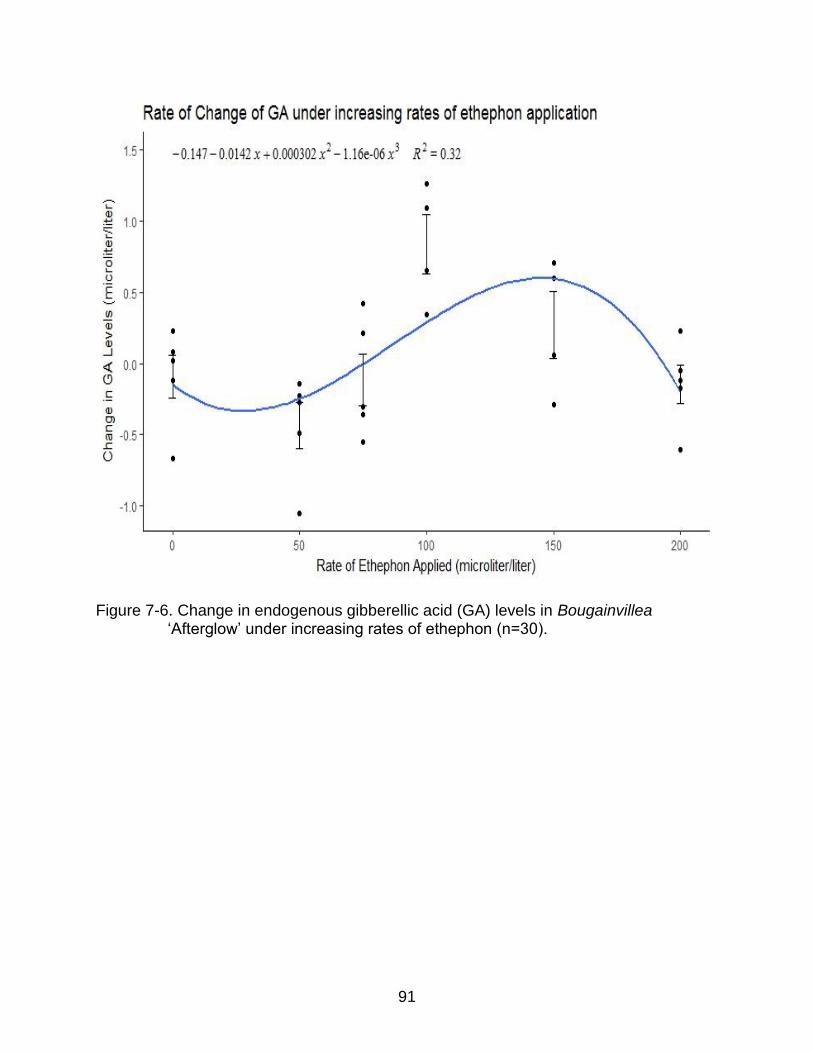
91
Figure 7-6. Change in endogenous gibberellic acid (GA) levels in Bougainvillea ‘Afterglow’ under increasing rates of ethephon (n=30).

92
Table 7-1 Means number of inflorescences. Means followed by the same letter are not significantly different to each other at α=0.05. NS=not significant N=65
Treatment Rate (µL/L)
Mean number of inflorescences
Standard Error
LD 0 1.8 1.32 NS
SD 0 9.6 0.81 A
FL 50 10.6 2.27 A
FL 75 5.2 2.50 B
FL 100 0.5 0.45 NS
FL 150 0.4 0.40 NS
FL 200 3.9 1.56 B
PR 50 4.4 2.20 NS
PR 75 3.0 2.32 NS
PR 150 2.4 1.12 NS
PR 300 0.0 0.00 NS
PR 400 0.0 0.00 NS
PR 500 0.0 0.00 NS
Table 7-2 Differences in GA levels across long-day, short-day, and ethephon and ABA application rates. Means+/- standard errors followed by the same letter are not significantly different to each other at α=0.05. NS=not significant. N=65
Treatment Rate (µL/L)
Mean Coefficient of Change in GA Levels
Standard Error
LD 0 -0.09 NS 0.15
SD 0 -1.05 A 0.29
FL 50 -0.44 NS 0.17
FL 75 -0.12 NS 0.41
FL 100 0.84 B 0.18
FL 150 0.28 NS 0.13
FL 200 -0.19 NS 0.13
PR 50 -0.4 NS 0.14
PR 75 0.05 NS 0.68
PR 150 0.57 NS 0.85
PR 300 0.29 NS 0.11
PR 400 0.35 NS 0.23
PR 500 0.77 B 0.59

93
CHAPTER 8 CONCLUSION
Bougainvillea ‘Afterglow’ was found to be a SDP, like many other cultivars
previously explored in the literature, including ‘Raspberry Ice’, ‘Taipei Red’, ‘Rainbow
Gold’, and ‘San Diego Red’(Even-Chen et al., 1979; Liu and Chang, 2011; Ma and Gu,
2010; J. G. Norcini et al., 1992). Plants flowered much more readily under short days (8
hours) than long days (14 hours). Long days almost completely inhibited flowering in the
absence of any other influencing factors. Photoperiod appeared to be more dominant
environmental cue to flowering for this plant than drought stress, and the response is
apparently mediated by both GA and ABA. Endogenous GA decreased in plants that
flowered under SD, and increased in non-flowering plants under LD. Plants responded
differently to exogenous ABA depending on the photoperiod they were grown in. Plants
grown in SD responded to increasing rates of 0 to 100 µg/L exogenous ABA with a
decrease in endogenous GA, resulting in shorter shoots and an increased flowering
response. When application rates were increased from 100 to 300 µg/L, plants
responded with an increase in endogenous GA, resulting in longer shoots and fewer
flowers. Plants grown under LD responded to exogenous ABA applied at 0 to 75 µg/L as
a drench with decreasing GA, shorter shoots and some flowering. As ABA application
rates increased from 75 to 500 µL/L, endogenous GA increased, and plants did not
flower.
Ethylene could overcome LD inhibition. The application of 50 µL/L ethephon as a
foliar spray on plants grown under LD resulted in a flowering response. The ethephon
application resulted in a decrease in both GA and ABA in treated plants, mirroring the
response found in plants grown under SD. This suggests that ethylene plays a part in

94
the regulation of flowering response in Bougainvillea through the control of the relative
abundance of both ABA and GA. Ethylene appeared to interact with GA differently
under SD and LD. Under LD, increasing ethephon application rates from 0 to 75 µL/L
led to a decrease in GA over the 30 days following treatment, while increasing rates
from 75 to 300 µL/L led to an increase in GA over the same period.
The decrease in GA in plants that flowered suggested that the role of GA in
signaling for the flowering response in Bougainvillea is not dependent on the same
DELLA-protein pathway regulation of PIF5 as in LD plants such as A thaliana.
Bougainvillea grown in the true tropics and near the equator would not
experience the LD inhibitory effect of 14-hour daylengths. Therefore, either ethephon
applied as a foliar spray at 50 µL/L or and exogenous ABA applied as a soil drench at
75 µL/L would probably be sufficient to promote flowering of Bougainvillea planted in the
landscape.
95
APPENDIX A PRELIMINARY EXPERIMENT ON INDUCTION OF FLOWERING BY WATER STRESS
Introduction
Bougainvillea is one of the most common and defining landscape shrubs in
tropical parts of the world. It is a short-day, flowering ornamental woody shrub that is
valued for its ability to thrive under harsh urban conditions (subject to compaction,
pollution, drought, etc). However, it exhibits an unpredictable and often non-
synchronous flowering pattern, especially when there is a lack of distinct variation in
photoperiod, such as in the true tropics. One horticultural practice used to induce
flowering is to subject the plants to slight drought stress2. However, little research has
been done to identify the reason why this seems to trigger flowering, or if indeed it does
trigger flowering at all. The objective of this study was to evaluate the impact of different
levels of drought stress on the flowering of one cultivar of Bougainvillea.
Materials and Methods
Thirty-five rooted Bougainvillea x glabra ‘Afterglow’ cuttings were grown in a 50%
perlite: 50% coir media with 12g of Osmocote® 10-10-10. They were pruned to the
same height and transferred to a growth chamber under 14-hour photoperiod (cool
white fluorescent light on a timer) with temperature set at constant 25°C. Plants were
watered every 2 days with 50 mL of tap water. After 3 weeks of growing in the growth
chamber, plants were subjected to seven levels of water stress (A=50 mL upon wilting,
B=25 mL/2days, C=25 /1day, D=50 mL/2days, E=50 mL/1day, F=100 mL/1day,
G=standing water) where A=very high, B= high, C and D=medium, E=low, F=very low,
and G=saturation. Stomatal conductance was measured using a leaf porometer
(Decagon Devices, model SC-1) as a proxy for water stress. The number of flower buds

96
on each plant was counted at the end of 6 weeks. Pour-through leachates were
analyzed for N, P, andK levels.
Results
Plants grown under medium water stress (50 mL per 2 days) produced more
flowers than those grown under low or high water stress. These results support
published findings that watering in between periods of medium water stress induces
flowering despite long-day conditions.
Figure A-1. Stomatal conductance and mean inflorescences under varying levels of drought stress. Error bars indicate standard errors.(n=35)
Plants grown in standing water were expected to fail due to root rot, but
surprisingly were the earliest to flower, and produced more flowers than plants grown
under all the other treatments. Treatment D (50 mL water every 2 days) resulted in the
highest mean N, P, andK levels and were not significantly different among treatments
9.4
19.212.8
23.4
2.28.2
24.6
0
20
40
60
80
100
120
140
160
180
200
50mL uponwilt
25mL per 2days
25mL per 1day
50mL per 2days
50mL per 1day
100mL per 1day
Standingwater
Mean S
tom
ata
l C
onducta
nce (
blu
e)
/ M
ean n
um
ber
of
Infloere
nscens (
red)
Stomatal Conductance (mmol/m2/s) Number of Flowers

97
except for treatment G. There was probably higher availability of nutrients in Treatment
G (standing water) due to constant wetting of the incorporated controlled-release
fertilizers. All treatments resulted in some flowering response, which was not expected
as 14-hour photoperiod had been previously found to be highly inhibitory to flowering.
Temperature may have played a part in this response, as it has been noted that
Bougainvillea flower in response to lower nighttime temperatures (Hackett and Sachs,
1985). The temperature in this experiment was set to 25°C, which is lower than the
typical ambient temperature in the landscape in the tropics for most of the growing
season (Calle et al., 2010; Rivera and Borchert, 2001). Furthermore, anaerobic stress
may explain the flowering response, which warrants further investigation in relation to
stress hormones and their role in flowering responses.

98
APPENDIX B ETHYLENE CONCENTRATION DATA FROM CHAPTER 6
Figure B-1. Ethylene levels (parts per million) on day 1, day 14, day 28 after treatment, under varying rates of exogenous ABA application. There were no differences between treatments and photoperiod. ▲= Short-day, ■ = Long-day, solid line = linear regression for short-day, dotted line = linear regression for long-day

99
Figure B-2. Ethylene levels (parts per million) on day 1, day 14, day 28 after treatment, under varying rates of exogenous ethephon application. There were no differences between treatments and photoperiod. ▲= Short-day, ■ = Long-day, solid line = linear regression for short-day, dotted line = linear regression for long-day

100
LITERATURE CITED
Achard, P., Baghour, M., Chapple, A., Hedden, P., Straeten, D.V.D., Genschik, P., Moritz, T., and N.P. Harberd. 2007. The plant stress hormone ethylene controls floral transition via DELLA-dependent regulation of floral meristem-identity genes. Proc. Natl. Acad. Sci. 104, 6484–6489.
Alabadí, D. and M.A. Blázquez. 2009. Molecular interactions between light and
hormone signaling to control plant growth. Plant Mol. Biol. 69:409-417. Al-Qubaie, A.I., 2013. Effect of treating Bougainvillea glabra with ethrel, magnesium and
boron on vegetative and flowering traits. J. King Abdulaziz Univ. 24:55–65. Bernier, G., Havelange, A., Houssa, C., Petitjean, A., and P. Lejeune. 1993.
Physiological signals that induce flowering. Plant Cell 5, 1147–1155. Berríos, J., Illanes, A., and G. Aroca. 2004. Spectrophotometric method for determining
gibberellic acid in fermentation broths. Biotechnol. Lett. 26:67–70. Blanchard, M.G., Newton, L.A., Runkle, E.S., Woolard, D., and C.A. Campbell. 2007.
Exogenous applications of abscisic acid improved the postharvest drought tolerance of several annual bedding plants. Acta Hortic. 755:127-133.
Calle, Z., Schlumpberger, B.O., Piedrahita, L., Leftin, A., Hammer, S.A., Tye, A., and R.
Borchert. 2010. Seasonal variation in daily insolation induces synchronous bud break and flowering in the tropics. Trees 24:865–877.
Cheng, H., Qin, L., Lee, S., Fu, X., Richards, D.E., Cao, D., Luo, D., Harberd, N.P., and
J. Peng. 2004. Gibberellin regulates Arabidopsis floral development via suppression of DELLA protein function. Development 131:1055–1064.
Colebrook, E.H., Thomas, S.G., Phillips, A.L., and P. Hedden. 2014. The role of
gibberellin signalling in plant responses to abiotic stress. J. Exp. Biol. 217:67–75. Davies, W.J. and J. Zhang. 1991. Root signals and the regulation of growth and
development of plants in drying soil. Annu. Rev. Plant Physiol. Plant Mol. Biol. 42:55–76.
Engelberth, M.J. and J. Engelberth. 2009. Monitoring plant hormones during stress
responses. J. Vis. Exp. 28:e1127. Even-Chen, Z. and R.M. Sachs. 1980. Photosynthesis as a function of short day
induction and gibberellic acid treatment in Bougainvillea “San Diego Red.” Plant Physiol. 65:65–68.

101
Even-Chen, Z., Sachs, R.M., and W.P. Hackett. 1979. Control of flowering in Bougainvillea “San Diego Red.” Metabolism of benzyladenine and the action of gibberellic acid in relation to short day induction. Plant Physiol. 64:646–651.
Ewing, E.E. 1987. The role of hormones in potato (Solanum tuberosum L.) tuberization,
p. 515–538. In: Davies, P.J. (ed.). Plant hormones and their role in plant growth and development. Kluwer Academic Publishers, Dordrecht , Boston, Hingham, M.A.
Hackett, W.P. and R.M. Sachs. 1985. CRC handbook of flowering. CRC Press, Boca
Raton, Fla. Hedden, P. 2008. Plant biology: Gibberellins close the lid. Nature 456:455–456. Holbrook, A.A., Edge, W.J.W., and F. Bailey.1961. Spectrophotometric method for
determination of gibberellic acid, p. 159–167. In: Gibberellins, Advances in chemistry. American Chemical Society, Washington, DC.
Joiner, J.N., Dickey, R., and T. Sheehan. 1962. Growth and flowering of Bougainvillea
glabra “Sander” as affected by photoperiod and levels of nitrogen and potassium. Proc. Fla. State Hort. Soc. 75: 447–449.
Karagüzel, O. 1999. Effects of paclobutrazol on growth and flowering of Bougainvillea
spectabilis Willd. Turk. J. Agric. For. 23:527–532. Khandaker, M.M., Faruq, G., Rahman, M.M., Sofian-Azirun, M., and A.N. Boyce. 2013.
The influence of 1-triacontanol on the growth, flowering, and quality of potted Bougainvillea plants (Bougainvillea glabra var. Elizabeth angus) under natural conditions. Sci. World J. 2013:e30865.
Kobayashi, K.D., J. McConnell, and J. Griffis. 2007. Bougainvillea. College of Tropical
Agriculture and Human Resources Publication OF-38, University of Hawaii at Manoa, Honolulu, HI.
Kojima, K. 1996. Changes of abscisic acid, indole-3-acetic acid and gibberellin-like
substances in the flowers and developing fruitlets of citrus cultivar “Hyuganatsu.” Sci. Hortic. 65:263–272.
Koshita, Y. and T. Takahara. 2004. Effect of water stress on flower-bud formation and
plant hormone content of satsuma mandarin (Citrus unshiu Marc.). Sci. Hortic. 99:301–307.
Koshita, Y., Takahara, T., Ogata, T., and A. Goto. 1999. Involvement of endogenous plant hormones (IAA, ABA, GAs) in leaves and flower bud formation of satsuma mandarin (Citrus unshiu Marc.). Sci. Hortic. 79:185–194.

102
Lau, O.S. and X.W. Deng. 2010. Plant hormone signaling lightens up: integrators of light and hormones. Curr. Opin. Plant Biol. 13:571–577.
Li, X., Motte, C.E.L., Stewart, C.R., Cloud, N.P., Wear-Bagnall, S., and C.-Z. Jiang.
1992. Determination of IAA and ABA in the same plant sample by a widely applicable method using GC-MS with selected ion monitoring. J. Plant Growth Regul. 11:55–65.
Liu, F.Y. and Y.S. Chang. 2011. Ethephon treatment promotes flower formation in
bougainvillea. Bot. Stud. 52:183–189. Liu, F.Y. and Y.S. Chang. 2010. Effects of shoot bending on ACC content, ethylene
production, growth and flowering of bougainvillea. Plant Growth Regul. 63:37–44. Ma, S. and M. Gu. 2010. Effects of water stress and selected plant growth retardants on
growth and flowering of “Raspberry Ice” Bougainvillea (Bougainvillea spectabilis), in: Proc. XXVIII Intl. Hort. Congr. Sci. Hort. People. 937: 237–242.
Malladi, A. and J.K. Burns. 2007. Communication by plant growth regulators in roots
and shoots of horticultural crops. HortScience. 42:1113–1117. Mansfield, T., 1987. Hormones and regulators of water balance, p. 411–430. In: Davies,
P.J. (ed.). Plant hormones and their role in plant growth and development. Kluwer Academic Publishers, Dordrecht, MA.
Menzel, C.M. 1983. The control of floral initiation in lychee: A review. Sci. Hortic.
21:201–215. Metzger, J.D. and J.A.D. Zeevaart. 1980. Effect of photoperiod on the levels of
endogenous gibberellins in spinach as measured by combined gas chromatography-selected ion current monitoring. Plant Physiol. 66:844–846.
Morgan, J.M. 1984. Osmoregulation and water stress in higher plants. Annu. Rev. Plant
Physiol. 35:299–319. Munns, R. and R. Sharp. 1993. Involvement of abscisic acid in controlling plant growth
in soil of low water potential. Funct. Plant Biol. 20:425–437. Nitsch, C. and J.P. Nitsch. 1969. Floral induction in a short-day plant, Plumbago indica
L., by 2-Chloroethanephosphonic acid. Plant Physiol. 44:1747–1748. Norcini, J.G., Aldrich, J.H., and J.M. McDowell. 1994. Flowering response of
Bougainvillea cultivars to dikegulac. HortScience. 29:282–284.

103
Norcini, J.G., McDowell, J.M., and J.H. Aldrich. 1992. Effect of dikegulac on Bougainvillea flowering under increasing and decreasing daylength. HortScience 27:634–634.
Norcini, J.G., McDowell, J.M., and J.H. Aldrich. 1992. Effect of dikegulac on flowering
and growth of Bougainvillea `Rainbow Gold’. HortScience 27, 35–36. Núñez-Elisea, R. and T.L. Davenport. 1994. Flowering of mango trees in containers as
influenced by seasonal temperature and water stress. Sci. Hortic. 58:57–66. Pierik, R., Cuppens, M.L.C., Voesenek, L.A.C.J., E.J.W. Visser. 2004. Interactions
between ethylene and gibberellins in phytochrome-mediated shade avoidance responses in tobacco. Plant Physiol. 136:2928–2936.
Powell, L.E. 1987. The hormonal control of bud and seed dormancy in woody plants, p.
539–552. In: Davies, P.J. (ed.). Plant hormones and their role in plant growth and development. Kluwer Academic Publishers, Dordrecht, MA.
Quarrie, S.A. and H.G. Jones. 1977. Effects of abscisic acid and water stress on
development and morphology of wheat. J. Exp. Bot. 28:192–203. Ramina, A., Hackett, W.P., and R.M. Sachs. 1979. Flowering in bougainvillea a function
of assimilate supply and nutrient diversion. Plant Physiol. 64:810–813. Ramírez, F. and T.L. Davenport. 2010. Mango (Mangifera indica L.) flowering
physiology. Sci. Hortic. 126:65–72. Rivera, G. and R. Borchert, R. 2001. Induction of flowering in tropical trees by a 30-min
reduction in photoperiod: evidence from field observations and herbarium specimens. Tree Physiol. 21:201–212
Schmelz, E.A., Engelberth, J., Tumlinson, J.H., Block, A., and H.T. Alborn. 2004. The
use of vapor phase extraction in metabolic profiling of phytohormones and other metabolites. Plant J. 39:790–808.
Schoellhorn, R. and E. Alvarez. 2002. Warm climate production guidelines for
bougainvillea (Extension Document No. ENH 874), Institute of Food and Agricultural Sciences Extension. University of Florida, Gainesville, Fla.
Schurr, U. and T. Gollan. 1990. Composition of xylem sap of plants experiencing root
water stress - a descriptive study. Monogr. - Br. Soc. Plant Growth Regul. 201–214.
Schwechheimer, C. and B.C. Willige. 2009. Shedding light on gibberellic acid signalling. Curr. Opin. Plant Biol., Growth and Development, 12: 57–62.
104
Sharp, R.E. and M.E. LeNoble. 2002. ABA, ethylene and the control of shoot and root growth under water stress. J. Exp. Bot. 53:33–37.
Singapore’s Climate Information - Data [WWW Document], n.d. . Natl. Environ. Agency.
URL http://www.nea.gov.sg/weather-climate/climate/singapore%27s-climate-information-data (accessed 5.19.17).
Singh, R., Dubey, R., Sethi, V., and S. Singh. 2013. Effect of various microclimatic
controls on the performance of different varieties of Bougainvillea. Indian J. Ecol. 40: 9–13.
Staden, J. van and G.G. Dimalla. 1980. Endogenous cytokinins in Bougainvillea “San
Diego Red.” III. Effect of photoperiod and gibberellic acid on flowering and cytokinin levels. Bot. Gaz. 141:248–251.
Steffen, J.D., Sachs, R.M., and W.P. Hackett. 1988. Bougainvillea inflorescence
meristem development: comparative action of GA3 in vivo and in vitro. Am. J. Bot. 75:1225–1227.
Taiz, L., Zeiger, E. (eds.). 2010. Plant physiology. 5th ed. Sinauer Associates,
Sunderland, MA. Talon, M. and J.A.D. Zeevaart. 1990. Gibberellins and stem growth as related to
photoperiod in Silene armeria L. Plant Physiol. 92:1094–1100. Trivellini, A., Ferrante, A., Vernieri, P., and G. Serra. 2011. Effects of abscisic acid on
ethylene biosynthesis and perception in Hibiscus rosa-sinensis L. flower development. J. Exp. Bot. 62:5437–5452.
Tse, A.T.Y., Ramina, A., Hackett, W.P., and R.M. Sachs. 1974. Enhanced inflorescence
development in Bougainvillea “San Diego Red” by removal of young leaves and cytokinin treatments. Plant Physiol. 54:404–407.
Verelst, W., Skirycz, A., and D. Inzé. 2010. Abscisic acid, ethylene and gibberellic acid
act at different developmental stages to instruct the adaptation of young leaves to stress. Plant Signal. Behav. 5:473–475.
Walton, D. 1987. Abscisic Acid Biosynthesis and Metabolism, p. 113–131. In: Davies,
P.J. (ed.). Plant hormones and their role in plant growth and development. Kluwer Academic Publishers, Dordrecht, MA.
Waterland, N.L., Campbell, C.A., Finer, J.J., and M.L. Jones. 2010. Abscisic acid
application enhances drought stress tolerance in bedding plants. HortScience 45: 409–413.

105
Wilmowicz, E., Kesy, J., and J. Kopcewicz. 2008. Ethylene and ABA interactions in the regulation of flower induction in Pharbitis nil. J. Plant Physiol. 165:1917–1928.
Yeang, H.Y. 2007. Synchronous flowering of the rubber tree (Hevea brasiliensis)
induced by high solar radiation intensity. New Phytol. 175,:283–289. Yeow, T.S. 2002. The analemma for latitudinally-challenged people. Natl. Univ. Singap.,
Singap., Honors Thesis. Zeevaart, J.A.D. 1971a. Effects of photoperiod on growth rate and endogenous
gibberellins in the long-day rosette plant spinach. Plant Physiol. 47:821–827. Zeevaart, J.A.D. 1971b. (+)-Abscisic acid content of spinach in relation to photoperiod
and water stress. Plant Physiol. 48:86–90.

106
BIOGRAPHICAL SKETCH
The author’s undergraduate majors were history and geography. He graduated
with a Bachelor of Social Sciences (Hon) in geography from the National University of
Singapore, where his honors thesis was on the viability of mixed-use development as a
tool for increasing public transport usage. He was enrolled in the Master of Urban
Horticulture degree at the University of Melbourne, where his research project was on
the use of clove essential oil as a postharvest protectant against Botrytis rot. He
received his Ph.D. in horticultural sciences with a focus on environmental horticulture,
from the University of Florida in the summer of 2017.