Embed Size (px)
Citation preview

Transactions on Modelling and Simulation vol 30, © 2001 WIT Press, www.witpress.com, ISSN 1743-355X
Flow visualisation, pressure measurements and CFD calculations on spike-tipped bodies
J. ~rul i jes ' , P. ~nemrn i ' , K. ~ u n n e ~ , F. ~ e i l e r ' l French-German Research lnstitute of Saint-Louis (ISL) F-68301 Saint-Louis, France EADS Deutschland GmbH, LFK-Lenkjlugkorpersystetne GmbH
0-88039 Friedrichshafen, Germany
Abstract
The requirements imposed by EADS Deutschland GmbH for the design of a new high velocity missile VISHORADS (VeryIShort Range Air Defence System) are the reduction of drag and to obtain reliable information from the opto-electronic embedded sensors at even high angles of attack. The aim of our investigation is to find new spike geometries and to optimise these to reach high angles of attack without losing the drag reduction effect well-known for small angles of attack. Flow visualisation pictures taken with differential interferometry are shown. A classical disk spike geometry is compared with a new spherical spike and the advantages of the latter are discussed. For equal diameters the disk spike proved more efficient below 8' whereas the sphere spike is more efficient beyond this angle of attack. Pressure measurements are presented and compared to the numerical calculations.
1 Introduction
A supersonic flow around a blunt body generates a bow shock which causes high surface pressure and consequently the development of high drag. The pressure on the body surface and consequently the drag can be substantially reduced if, instead of a normal shock, an oblique shock is generated by an aero-spike. The oblique shock compresses and heats the flow less than a normal shock. Additionally, the spike produces a re-circulatory flow separation region that shields the nose from the oncoming flow. This reduces drag as well as tempera- ture and protects the missile's surface with the embedded opto-electronic sensors.
Transactions on Modelling and Simulation vol 30, © 2001 WIT Press, www.witpress.com, ISSN 1743-355X

Transactions on Modelling and Simulation vol 30, © 2001 WIT Press, www.witpress.com, ISSN 1743-355X
146 Conprrtational Methods m d E.~perimental Measures
This is especially needed at high speeds to reduce the heating of the sensors. A disadvantage of using classical spikes is that the reduction on nose drag decreases substantially as the angle of attack increases. High angles of attack must be flown to fulfil the manoeuvrability requirements of state-of-the art missiles.
Preliminary experiments were published in [l-31. The experiments discussed herein have been carried out at a Mach number 4.5 (about 1500 rnh) using one of the ISL high pressure shock tunnels. These shock tunnels enable us to produce high Mach number air flows ranging in pressure and temperature from ground level up to an altitude of about 10 km. The measuring time for the flow conditions shown in this paper is about 1.0 ms.
2 Shock tube facility
Two high-pressure shock tubes with inner diameters of 100 mm, A and B, have been in operation at the ISL shock tube laboratory since 1966 (see Patz [4,5] and Oertel 161). These shock tubes have been used to date as shock tunnels. They consist of a high pressure driver tube, a driven tube and a nozzle attached at its end. A principle sketch of the shock tunnel facility, operated in a reflected mode, is given in Fig. 1 with the high-pressure driver tube and the lower pressure driven tube containing the test gas.
parallel flow nozzle
Figure 1: Principle sketch of shock tunnel facility
A diaphragm separates the driver tube filled with hydrogen or helium from the driven tube containing the test gas which is either air or nitrogen. The driver gas fill pressure used varies from 20 MPa to 60 MPa and the test gas fill pressure from 100 kPa to 600 kPa. After diaphragm bursting, the driver gas expands into the driven tube, producing a shock wave therein and accelerating the gas behind this shock wave to either subsonic or supersonic constant flow speeds, depending on shock tube operation.
A circular parallel flow nozzle having a throat diameter of 50 mm, an exit diameter of 220 mm and a length of 713.5 mm is mounted at the end of tube A, which is used for the experiments discussed in this paper. The nozzle is fixed inside a test section attached to a dump tank which contains the driver and driven gases after firing. Optical windows are placed at both sides of the test section for flow diagnostics.
Transactions on Modelling and Simulation vol 30, © 2001 WIT Press, www.witpress.com, ISSN 1743-355X

Transactions on Modelling and Simulation vol 30, © 2001 WIT Press, www.witpress.com, ISSN 1743-355X
3 Experiments
A generic VISHORADS missile spherical nose model with a diameter of 70 mm was used for the tests. Two different shapes of spikes were compared, i.e., the classical disk spike shown in Fig. 2 and a new spherical spike shown in Fig. 3.
Figure 2: model with disk spike Figure 3: model with sphere spike
The experiments were carried out using N2 as test gas and a mixture of H2 (83.3%) and N2 (16.7%) as driver gas. For the above VISHORADS missile nose models, different spike lengths, diameters of diskslspheres and angles of attack were experimentally tested. To explain the advantages of the sphere spike we chose one geometry and two angles of attack.
Spike length: 70 mm Diameter of diswsphere: 17.5 mm Angles of attack: 0" and 24" Mach number: 4.5 Static pressure: 40 kPa Temperature: 240 K
3.1 Differential interferometer
A conventional and well-proven method used for visualising density differences in flows is differential interferometry (DI) with Wollaston prisms [7-141.
ligM sours S pdariser P1 pdariserP2 rola,thg film
Figure 4: Differential interferometer
The optical set-up, shown in Fig. 4, works with two widened polarised light beams, crossing the gas flow (phase object) as parallel light bundles between the central lenses L2 and L3, with only a small lateral shift e.
Transactions on Modelling and Simulation vol 30, © 2001 WIT Press, www.witpress.com, ISSN 1743-355X

Transactions on Modelling and Simulation vol 30, © 2001 WIT Press, www.witpress.com, ISSN 1743-355X
The light coming from the light source S (in our case a multi air-spark) is circular polarised or polarised linearly with the first polariser P1 at 45" with respect to the optical axes of the Wollaston prism. Then, it is focused by the first lens L1 into the Wollaston prism W1 which splits the beam into two beam parts. This splitting is sketched in principle in Fig. 4. Every single light beam passing through the first Wollaston prism W1 is symmetrically split and each refracted by an angle E into two rays of perpendicular linear polarisation, both separated by the angle 2 ~ . The shift e depends on E and the focal length f of the lens L2 by the relation e =2 f E.
If the original ray is of circular polarisation or polarised linearly at 45' with respect to the optical axes of the prism, the partial output beams are coherent and have equal intensities. The second polariser P2 (analyser) allows the two light beams to interfere on the image plane (in our case a rotating film) of the phase object, which is usually located at the centre of the flow pattern. With light intensity changes dI on the image plane the differential interferometer visualises changes d(Acp)0 of the optical path differences Acp between the two light bundles passing the flow. These optical path difference changes are caused by variations of the refractive index difference An(C)3 due to the varying gas density distributions Ap(C). The interference fringes appearing on the image plane are usually adjusted to infinite fringe spacing, i.e., the flow picture initially shows a homogeneous light intensity distribution which is given as
If fringes are needed, the Wollaston prisms must be moved out of the focus of the two central lenses L2 and L3, respectively and the light intensity distribution becomes depending on C' in form of
2 Av(Z') 1=Pcos - . 2
When operated with only a small shear of the order of some tenth of a milli- metre between the interfering light bundles, differential interferometry becomes an interesting alternative to classical visualisation techniques like schlieren and shadowgraph. It has the great advantage that there is no diffraction at a knife's edge as in the case of a schlieren system and when compared to shadowgraphy, that the phase object is in focus. Furthermore the differential interferometer has a number of additional important advantages compared to a classical reference beam "absolute" interferometer, e.g., Mach-Zehnder: It is relatively insensitive to vibrations and to imperfections of the optical components used, it is composed of fairly inexpensive parts, it is very easy to handle and offers a great flexibility in visualising many different types of flow phenomena.
3.2 Flow visualisation
Flow visualisation was done by means of differential interferometry as described by Smeets and George [9] and Smeets [10]. This optical measuring technique
Transactions on Modelling and Simulation vol 30, © 2001 WIT Press, www.witpress.com, ISSN 1743-355X

Transactions on Modelling and Simulation vol 30, © 2001 WIT Press, www.witpress.com, ISSN 1743-355X
allows the visualisation of density gradient fields. We visualized the flow by a series of framing pictures taken with a rotating drum camera. For these framing pictures the flow is focused on the rotating film and eight parallax-free successive air sparks are used as light source. The time interval between the sparks is adjustable and the start is triggered by the incident shock wave. In this paper we show only one of the eight pictures taken always at about the same time after triggering.
Missile nose models with a disc spike and a sphere spike are shown in Fig. 4 and Fig. 5 for an angle of attack of 0". The bow wave and detachment zones in front of the missile nose model can be clearly recognized by light intensity differences in the interferograms.
Figure 4: Disk spike (incidence 0") Figure 5: Sphere spike (incidence 0")
Comparing Fig. 4 with Fig. 5 it can be seen that at an angle of attack of 0" the flow patterns in front of the bodies are quite similar, only the distance between bow wave and shoulder of the body is shorter for the sphere spike. For the same flow conditions, Fig. 6 and Fig. 7 show differential interferograms for an angle - - of attack of 24".
Figure 6: Disk spike (incidence 24") Figure 7: Sphere spike (incidence 24")
Transactions on Modelling and Simulation vol 30, © 2001 WIT Press, www.witpress.com, ISSN 1743-355X

Transactions on Modelling and Simulation vol 30, © 2001 WIT Press, www.witpress.com, ISSN 1743-355X
The flow pattern is different in the two cases. Differences can be clearly seen in the bow shock wave in front of the spike and near the centre of the spherical forebody. The detachment of the flow at a spike with sphere is less abrupt than at the classical disk. Consequently higher angles of attack can be flown with sphere spikes. The pressure on the shoulder of the body (for equal disk and sphere diameters) is higher for the sphere, but as the drag of a sphere is lower than that of a disk, a larger sphere will compensate this handicap with the advantage of a smoother flow detachment.
3.3 Pressure measurements
Some problems encountered while measuring pressures at the surface of the blunt body prompted us to modify the measuring technique used. The diameter of the flush mounted PCB 113A21 pressure gauges used for the preliminary experiments [l-31 was 5.5 mm. The pressure data obtained with these gauges showed that the measuring surface was too large to provide quantitatively accurate information to validate computer codes. This is especially the case in the middle of the blunt spherical body where the pressure gradients are large. Therefore, the pressure measurements presented here were carried out with a new generic VISHORADS missile nose model with the same dimensions as for the preliminary experiments, but using more and smaller pressure gauges. We now use ten pressure transducers with a diameter of 2 mm (measuring diameter 1 mm). Instead of being flush mounted, these transducers are located behind a small hole of 0.5 mm diameter and 1.5 mm length. Fig. 8 shows schematically the position of the ten pressure gauges KULITE XCQ-080-35 used. On the rear upper side of the cylindrical part of the model an additional measuring gauge is shown (PCB 113A21).
Figure 8: VISHORADS missile model with 11 pressure gauges
4 Numerical calculations
Numerical calculations of the steady state flow field around the two spike-tipped missile nose models are conducted by means of the 3-D compressible turbulent CFX-TASCflow code [15]. This code is based on Reynolds averaged Navier- Stokes equations [l61 and the k-E turbulence model [l71 is used to close the equations system. The computations presented herein have been carried out for
Transactions on Modelling and Simulation vol 30, © 2001 WIT Press, www.witpress.com, ISSN 1743-355X

Transactions on Modelling and Simulation vol 30, © 2001 WIT Press, www.witpress.com, ISSN 1743-355X
the Mach number and spike geometries tested and for angles of attack of 0" to 30".
5 Results and discussion
Fig. 9 depicts the comparison between interferogram pictures and computations (over-printed constant-pressure lines) of the flow field around the missiles without incidence; the CFD code predicts the experimental flow structure accurately. Note the above mentioned difference between the bow shock geometry of the spikes, especially the location of the interaction between the spike shock and the shock in front of the hemispherical part of the missile.
Figure 9: Comparison experiment-computation: a = 0"
Fig. 10 shows the same comparison for an angle of attack of 20"; again a very good agreement between the numerical simulation and the experiment is found.
Figure 10 : Comparison experiment-computation: a = 20"
Transactions on Modelling and Simulation vol 30, © 2001 WIT Press, www.witpress.com, ISSN 1743-355X

Transactions on Modelling and Simulation vol 30, © 2001 WIT Press, www.witpress.com, ISSN 1743-355X
Fig. 11 show comparisons between calculated missile nose pressure coefficients and corresponding measured values for an angle of attack of 20". Curves for disk and sphere spikes are shown for the windward and leeward sides as well as for middle of the missile model. A very good agreement between the calculated curves and the experimental data, given by the solid symbols, can be seen. The main pressure gradients are found from the nose tip (X = 70) up to around 8 mm along the missile axis, corresponding to a cap area of about 30" of the missile nose.
A Measurement disk: windward slde 6- Computallon disk: wlndward side W Measurement disk: leeward side 0 Computallon disk leeward slde
Measurement disk: middle 0 Computation disk: middle A Measurement sphere: windward side A Computation sphere: wlnward side W Measurement rphere: leeward slde -8- Computation sphere: leeward side
2 ~ 0 Measurement sphere: middle Computation sphere: middle
195 0 0
130
0,5 ., -.. .J *
030 B = - ~ B = B * ~
Figure 11: Pressure coefficient for the disk-sphere spikes at 20" angle of attack
It is not possible to determine the missile drag coefficient by pressure measurement extrapolation due to the small number of transducers used. However this is possible with the numerical simulation. The successful experiment-computation comparison enables us to maintain that the computation predicts the missile drag coefficient qualitatively very well.
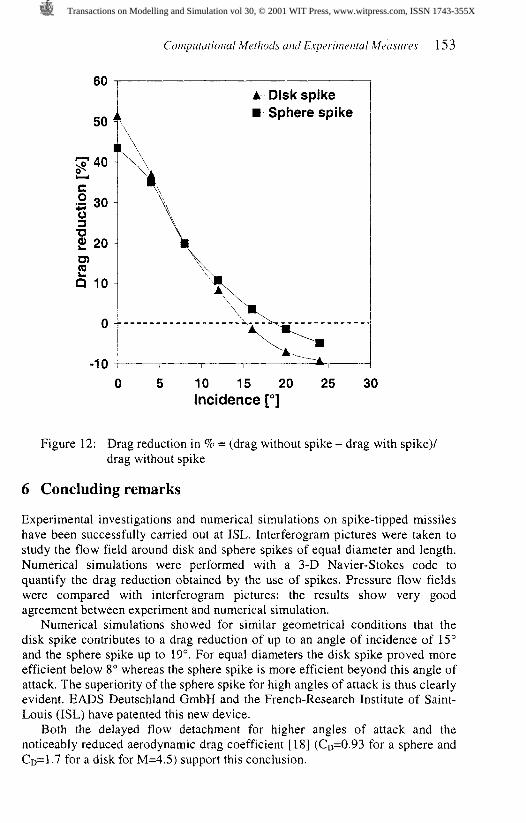
Fig. 12 depicts the computed forebody drag coefficient for all studied geometries. A drag reduction of about 50% is obtained for the disk spike-tipped missile and of about 43% for the sphere spike-tipped missile at zero angle of attack. While the disk spike reduces the missile drag up to angles of attack of 15", the sphere spike does so up to 19'. Beyond 15", respectively 19" the studied spikes are not efficient any more. The disk spike is (for the same diameter) more efficient than the sphere spike for angles of attack lower than 8". For higher angles of attack the sphere spike becomes more efficient.
Transactions on Modelling and Simulation vol 30, © 2001 WIT Press, www.witpress.com, ISSN 1743-355X
Transactions on Modelling and Simulation vol 30, © 2001 WIT Press, www.witpress.com, ISSN 1743-355X
A Disk spike -m- Sphere spike
0 5 10 15 20 25 30 Incidence ["l
Figure 12: Drag reduction in % = (drag without spike - drag with spike)/ drag without spike
6 Concluding remarks
Experimental investigations and numerical simulations on spike-tipped missiles have been successfully carried out at ISL. Interferogram pictures were taken to study the flow field around disk and sphere spikes of equal diameter and length. Numerical simulations were performed with a 3-D Navier-Stokes code to quantify the drag reduction obtained by the use of spikes. Pressure flow fields were compared with interferogram pictures: the results show very good agreement between experiment and numerical simulation.
Numerical simulations showed for similar geometrical conditions that the disk spike contributes to a drag reduction of up to an angle of incidence of 15" and the sphere spike up to 19". For equal diameters the disk spike proved more efficient below 8" whereas the sphere spike is more efficient beyond this angle of attack. The superiority of the sphere spike for high angles of attack is thus clearly evident. EADS Deutschland GmbH and the French-Research Institute of Saint- Louis (ISL) have patented this new device.
Both the delayed flow detachment for higher angles of attack and the noticeably reduced aerodynamic drag coefficient [l81 (CD=0.93 for a sphere and CD=l .7 for a disk for M=4.5) support this conclusion.
Transactions on Modelling and Simulation vol 30, © 2001 WIT Press, www.witpress.com, ISSN 1743-355X

Transactions on Modelling and Simulation vol 30, © 2001 WIT Press, www.witpress.com, ISSN 1743-355X
154 Conlputational Methods and E.yerin~ental Mea~uws
References
Srulijes J., Runne K. & Seiler F. Messungen an einer Flugkorpernase mit Spike im grol3en Stossrohr-Windkanal des ISL. AG STAB Jahresbericht 1999,1999. Srulijes J., Runne K. & Seiler F. Flow Visualization and Pressure Measurements on Spike-Tipped Bodies. 21" A I M Aerodynamic Measurement Technology and Ground Testing Conference, AIAA 2000- 2520,2000. Srulijes J., Runne K. & Seiler F. Flow Visualization on Spike-Tipped Bodies". 9Ih International Symposium on Flow Visualization, Edinburgh, U. K., 2000. Patz G. Das HyperschallstoBrohrlabor des ISL, 3. Teil: StoBrohr B. ISL- Report N 30/70,1970. Patz G. Das Hyperschallstol3rohrlabor des ISL, 2. Teil: Stol3rohr A. ISL- Report N 27/71, 197 1. Oertel H. StoJrohre Springer Verlag, Wien- New York, 1966. Oertel H. High speed photography of hypersonic phenomena by a schlieren interferometric method. Proceedings 5th International Congress on High Speed Photography, Washington (DC), 1960. Merzkirch W. A simple schlieren interferometer system AIAA J. 3, pp. 1974-76, 1965. Smeets G. & George A. Anwendungen des Laserdifferentialinterferometers in der Gasdynamik. ISL- Report R 28/73, 1973. Smeets G. Interferometry. ISL-Report CO 214/90, 1990. Carlomagno G. M. A Wollaston prism interferometer used as a reference beam interferometer Proceedings 4th Int. Symposium on Flow Visuali- zation, Paris, pp. 105-10, 1986. Srulijes J. & Seiler F. A review of some visualization experiments carried out at the ISL shock tubes Proceedings 4th Int. Symposium on Flow Visualization, Paris, pp. 91-97, 1986. Merzkirch W. Flow Visualization, Academic Press, New York and London, 1974 & 2nd edition, Academic Press Orlando, 1987. Oertel H. Sen. & Oertel H. jun. Optische Stromungsmesstechnik, G. Braun, Karlsruhe, 1989. CFX-TASCflow Computational Fluid Dynamic Software AEA Technolo- gy Engineering Software, Ltd., Waterloo, Ontario, Canada, 2000. Cebeci T. & Smith A.M.O. Analysis of turbulent Boundary Layers Academic Press, Inc., New-York, USA, 1974. Launder B.E. & Spalding D.B. The Numerical Computation of Turbulent Flows. Comp. Meth. Appl. Mech. Eng., Vol. 3, pp. 269-289, 1974. Hoerner S.F. Fluid Dynamic Drag Published by the Author, 1965.
Transactions on Modelling and Simulation vol 30, © 2001 WIT Press, www.witpress.com, ISSN 1743-355X


![What flow visualisation can teach us about reactor design What? Flow visualisation can teach us about reactor design? Hugh Stitt [1] & Peter Jackson [2]](https://img.dokumen.tips/doc/110x75/56649e885503460f94b8c84d/what-flow-visualisation-can-teach-us-about-reactor-design-what-flow-visualisation.jpg)