Embed Size (px)
Citation preview

HAL Id: hal-01702068https://hal.archives-ouvertes.fr/hal-01702068
Submitted on 6 Feb 2018
HAL is a multi-disciplinary open accessarchive for the deposit and dissemination of sci-entific research documents, whether they are pub-lished or not. The documents may come fromteaching and research institutions in France orabroad, or from public or private research centers.
L’archive ouverte pluridisciplinaire HAL, estdestinée au dépôt et à la diffusion de documentsscientifiques de niveau recherche, publiés ou non,émanant des établissements d’enseignement et derecherche français ou étrangers, des laboratoirespublics ou privés.
Flow visualisation around a horizontal cylinder near aplane wall and subject to waves
Dominique Mouazé, Michel Bélorgey
To cite this version:Dominique Mouazé, Michel Bélorgey. Flow visualisation around a horizontal cylinder near aplane wall and subject to waves. Applied Ocean Research, Elsevier, 2003, 25 (4), pp.195-211.�10.1016/j.apor.2004.01.001�. �hal-01702068�

Flow Visualisation around a horizontal cylinder near a plane wall and
subject to waves
D. Mouazéa,* – M. Bélorgeyb
aDepartment of Civil and Environmental Engineering, University of Southampton, Highfield, Southampton, SO17 1BJ, UK
bMorphodynamique Continentale et Côtière – 24, rue des Tilleuls - F-14000 Caen – France
Abstract
This study is motivated by the description and the understanding of the vortices formation and
development near a cylinder subject to waves and under the influence of the bed. The results presents a
classification of flow types for different gap-to-diameter ratio and for two cylinder diameters (D1 = 10 cm
and D2 = 4 cm, 0.8m long) according to a systematic wave conditions range. The flow visualisations
reveal different mechanisms of separation, development and growth of vortices depending on the
Keulegan Carpenter number (0.5 < KC < 26) and the influence of the bed proximity.
A flow asymmetry was observed between the crest and the trough of the wave and a stronger vortex
activity downstream the cylinder especially for the highest gap-diameter ratios. Furthermore the vortices
are rotating preferentially in the same sense than the orbital motion. The flow tends to become more
similar to a planar oscillating flow when the cylinder is closer to the bed.
The emergence of instabilities in the wake of the cylinder for the highest wave amplitude leads us to
measure the velocities in the cylinder axis in order to quantify three-dimensional effects.
Keywords: Cylindrical structures; Flow induced by waves; Wake instabilities, Visualisations.
Nomenclature
Cr crest of the wave
D cylinder diameter
DQD Down Quarter Downstream

DQU Down Quarter Upstream
e gap between the cylinder and the bottom
H wave height
KC Keulegan Carpenter number
Re Reynolds number
Si flow regime scheme i
T wave period
Tr trough of the wave
U maximum velocity
UQD Up Quarter Downstream
UQU Up Quarter Upstream
Zi zone of the flow regime i
β ratio between Re and KC
kinematic viscosity
1. Introduction
Forces exerted on pipelines under the action of a wave generated flow, and the related response of the
cylinders, have been extensively studied mainly for reliability purposes (Sarpkaya and Isaacson, [24]).
Numerous studies (continuous or oscillating flow, simulation of the orbital motion, theoretical and
numerical methods) were carried out especially on the strength and vortex separation analysis around a
tube in order to improve the design of pipelines (Sumer and Fredsøe, [29]). Few studies take part directly
in the case of a wave flow.
By studying the flow around an oscillating cylinder in a fluid at rest, Keulegan and Carpenter [15]
established a dimensionless number KC which represents the amplitude of the motion relatively to the
scale of the tube:
D
UTKC ,
in which U is the maximum velocity, T is the wave period, D is the diameter of the cylinder.

The use of "U tube" for generating a 2D sinusoidal flow permits to reveal the important factors which
control the vortex shedding. With these experimental facilities, Sarpkaya [23] defined the frequency
parameter β:
KC
Re
Bearman et al. [1, 2, 3] described the motion of vortices for a large range of KC numbers. Theirs
conclusions show that the history of the wake is an important parameter which influences the next flow
patterns by the return of the "earlier phase" vortices toward the body. Williamson [32] and Sarpkaya [25]
give a classification of different flow regimes around the cylinder according to KC intervals. Other
authors, Sawamoto et al. [26], Obasaju et al. [20] and Jensen [13], used seeding particles to visualize the
flow and to propose a classification of the different regimes. Hayashi et al. [9], Medeiros at al. [17, 18]
realized a velocity field mapping around a cylinder with a Laser Doppler Velocimeter. They show
different modes of development of the vortices in the upper part and the lower part of the cylinder. The
Particle Image Velocimetry allows the quantifying and the dynamic study of the whole velocity field and
vorticity around the structure. With this technique, Bruce and Easson [5], Sibetheros et al. [27], show
irregular features of the vortex shedding for KC between 10 and 25.
Sarpkaya [25], Tatsuno and Bearman [31] noticed the presence of three-dimensional instabilities, for
small KC, in the forms of mushrooms filaments developing in the cylinder axis. This feature of the flow
has been revealed by Honji [10] with an electrochemical precipitation technique. Sunahara and Kinoshita
[30] indicate the transition from a two-dimensional flow to an unstable flow for a KC between 0.5 and 1.
When KC reaches 2.5, the boundary layer becomes turbulent (Re > 5.103, β >2.5.103)
The first studies dealing with the influence of the bed on the flow around a cylinder are qualitative
(Bearman and Zdravkovich [4], Grass et al. [7]) and confirm the limit of the bed effect for e/D lower than
0.3. Large recirculation areas appears on both side of the cylinder for the lowest gap to diameter ratios,
and furthermore the frequency of the vortex shedding (characterised by the Strouhal number St) is
lowered. These results are confirmed by a recent study using flow visualisations, hot films and PIV to
investigate the flow around a cylinder (in current) close to a wall (Price et al. [21]). These authors show
the suppression of the gap flow and no regular vortex shedding for e/D < 0.125. Sumer et al. [28] realized
an extensive study of the wall influences on a cylinder placed in a oscillating flow. Their conclusions

pointed out that the vortex shedding is suppressed for a gap lower than 0.1D and for a low KC (KC < 20).
Under the influence of the bed, vortices at the top and the foot of the cylinder are getting closer and
interact at high frequency.
2. Experimental Set-up
Visualisation methods adapted to flume can be used for a qualitative study of the flow around a
cylindrical structure subject to wave action. This method gives access to a global representation of the
phenomenon both in a spatial plane (separation point, vortex size, recirculation and high velocity zones)
and in a temporal plane (event periodicity, instabilities).
With the help of Laser Doppler velocity measurements, the Keulegan Carpenter regimes were determined
as a function of the wave height, and also as a function the Reynolds number (
UDRe , with the
kinematic viscosity.) for the two cylinders.
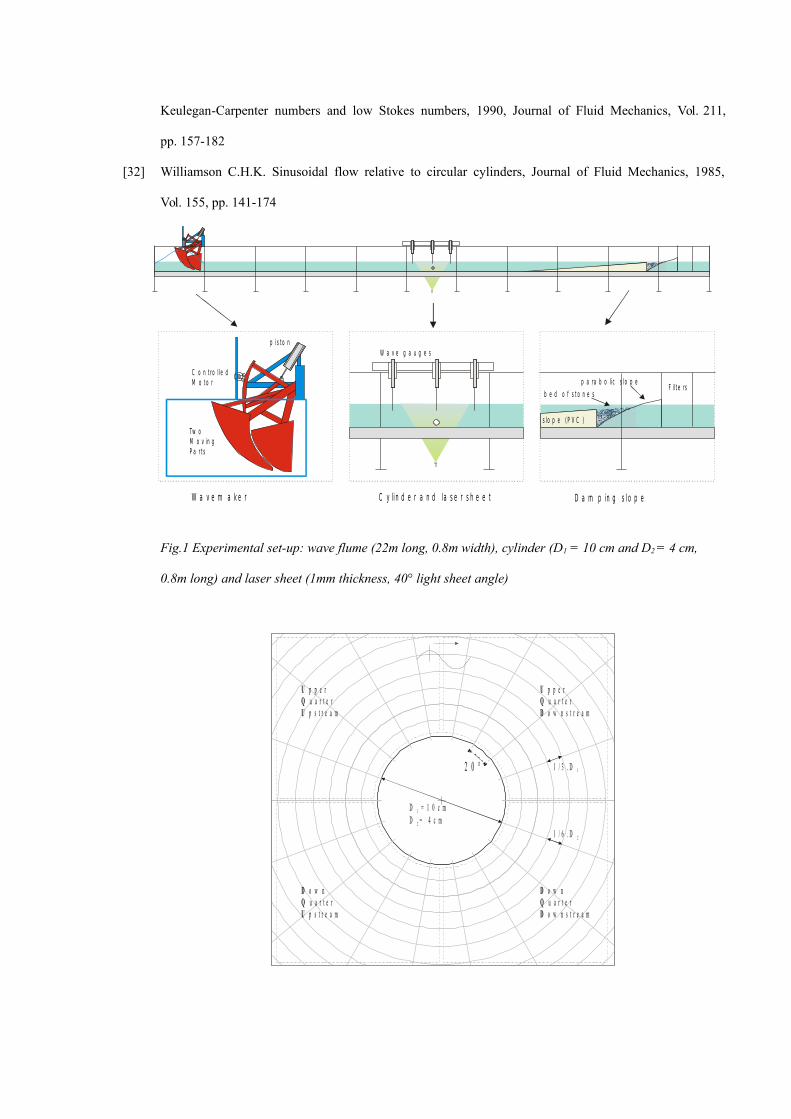
The experimental investigations take place in a wave flume (22 meters long, 0.8m width and 0.5m water-
depth) where regular waves are performed (Fig. 1). The qualitative measurements are achieved using a
laser sheet technique (1mm thickness, 40° light sheet angle) and particles seeding (Polyamide,
Ø = 112μm, ρ = 1060kg/m3). The cylinders are transparent (Plexiglas) and filled with water in order to
minimise the hidden part of the flow in the shadow of the cylinder.
A grid is superimposed to the photographs (35mm and medium format) and video recordings (CCD) in
order to analyse the images and to obtain a detailed pattern of the flow. The space is radially divided into
20° segments converging toward the centre of the cylinder. Concentric circles are drawn each 1/3 rd of D1
or each 1/6th of D2 for bias correction induced by the different refractive indices (air, glass, water) between
the position of the laser sheet and the record apparatus.
The studied area is divided into four parts as shown in figure 2:
-the Up Quarter Upstream (UQU),
-the Down Quarter Upstream (DQU),
-the Up Quarter Downstream (UQD),

-the Down Quarter Downstream (DQD).
The positive sense of the vortices rotation is clockwise on the figures, like the sense of the orbital motion.
3. Flow regimes for D = 4cm
For the configuration e/D = 3 (with e the gap between the flume bottom and the cylinder), the flow
around the cylinder is not under the influence of the flume bottom. Consequently more flow patterns are
present for e/D = 3 than the cases of smaller gap-diameter ratios. For e/D = 0.5, 0.1 and 0, the influence of
the bed is pronounced and the flow regimes are more similar to each other for different wave periods.
3.1 e/D = 3.0
Five zones can be distinguished on the graphs KC = f (Re) (Fig. 3). A transitional flow appears two times
(zones T3/4 and between T4 and T5) between two fixed flow regimes.
zone 1: no separation (Fig.4)
The cylinder influences the orbital motion in an area close to its surface till 1/6 th of the diameter. In this
area the particles are submitted to an elliptical movement with an amplitude extending from 20° to 80° in
the UQD during one wave period. An undisturbed orbital motion is observed outside this area.
zone 2: appearance of circulation (Fig.5 to 7)
In this part, the separation phenomenon appears downstream to the cylinder during the crest phase of the
wave. A complete circulation is apparent for a wave period of one second and a wave height H = 0.08m.
For a same range of KC and for similar experimental conditions, Lambert [16] observes and concludes
that the circulation around the obstacle is significant.
The influence area of the cylinder stretches to 0.5D in the crest phase, and decreases to 1/6 th D during the
trough. The particles spread out in "feather form" in the UQD.
For the highest KC numbers, we notice the appearance and the growth of an anti-clockwise vortex in the
UQD. This eddy is accompanied by another one of the opposite sense (DQD) which disappears for the
highest wave heights.
zone 3: formation and development of the vortex in the UQD (Fig.8 to 11)
As the KC number increases, an anti-clockwise vortex is created in the DQD until 0.5D during the crest

phase, and then is moving toward the bed. A second vortex (in the UQD) is distinctly predominant and
develops until 5/3rd of D. Then it displaces toward the bed during the trough phase.
During the trough, an anti-clockwise vortex is forming until 0.5D and then moves downstream toward the
free surface.
In the lower limits of the zone 3, the flow around the cylinder is completely symmetric and is composed
of two contra-rotating vortex which extend to 1/3rd of D either for the crest and trough of the waves
zones T3/4, T4/5 : transition (Fig.12 to 17)
Between the zones 3 and 4, like between 4 and 5, a transition between the flow schemes can be observed.
These narrow areas present some variable and unsteady flow types.
During the crest phase, two contra-rotating vortices are formed downstream to the cylinder and extend till
0.5D. The vortex in the UQD is ejected downstream, when its contrary is brought back below the cylinder
sweeping its surface during the interval crest/trough. At the trough, an anti-clockwise vortex can be
formed until ¼ D and then be diffused (T = 1.50s) or be displaced downstream toward the free surface
(T = 2.00s). For the highest studied period (T = 2.66s, H = 0.08m, scheme S2'), the characteristic flows of
this transitory zone are succeeding during 10 waves and then are alternated with another scheme
(T = 2.66s, H = 0.08m, scheme S3') during 20 waves.
zone 4: asymmetric vortices (Fig.18 and 19)
From a similar scheme (zone T3/4), we can notice the growth of the vortices and the constant stretching of
the one in the UQD until 4/3rd D during the crest phase. For all the studied periods, the DQD vortex
sweeps the surface under the cylinder, when its opposite (UQD) is either diffused for the lowest periods
(T = 1.33s, T = 1.50s), or carried downstream up to the cylinder for the highest periods (T = 2.00s). For
these cases, the trough phase is composed of two contra-rotating vortices upstream to the cylinder. The
vortex, which is developing in the DQU, is passing round the cylinder surface and is pulled out toward
the free surface.
For the highest period (T = 2.00s, H = 0.10m), the flow around the cylinder is composed of a succession
of schemes (mainly three) during a certain number of waves.
zone 5: instability of the flow (Fig.20 to 26)
For these conditions, the structure of the flow does not present continuous features with time but is
composed of sequence of different diagrams which are followed themselves during a certain number of

waves. These instabilities come from the flow itself at high KC numbers and especially from the three
dimensional effects (see part 5).
The first diagram (noticed S1) is similar to the one explained in the zone 4.
The second pattern (noticed S2) is similar to the one developed for the transition areas (zone T3/4 and T4/5)
for the crest phase. For the trough, one vortex is forming upward (scheme S2) or two contra-rotating
(scheme S2'). The third diagram (noticed S3) is composed of one clockwise vortex which is passing
around from the upper upstream quarter during the crest phase.
The diagrams (crest/trough) are symmetric along a vertical axis passing the centre of the cylinder. An
extension of the diagrams S3 shows a development by a pairing of vortices (noticed S3').
Table 1 presents an evaluation of the number of waves which are succeeding for a certain scheme. For
example, for a wave period of 2.66 seconds and a wave height of 0.10 meter, the scheme S1 is going on
during 3 to 4 waves, then the case S2' is following during 2 to 3 waves and then the diagram S3' is taking
place during 10 to 12 waves.
3.2 e/D = 0.5
Closer to the bed channel, the vertical component of the velocities is less important. The flow regimes are
more similar to an oscillating flow. As the gap decreases, the numbers of different schemes decreases and
the patterns become more and more simple. The flows are more symmetric between the crest and the
trough and the different zones are easier to define. We can distinguish five distinct zones (Fig. 27), the
fifth presenting unsteady features:
zone 1: oscillating flow without separation (Fig.28)
The particles near the upper surface of the cylinder are subjected to an elliptical movement covering 40°
(to 60°) of deflection during one period.
zone 2: beginning of the separation (Fig. 29 and 30)
During the crest phase, we can notice the appearance of detachment until 1/6thD direct downstream. The
same symmetric scheme appears for the trough.
zone 3: formation of asymmetric vortices (Fig.31 and 32)
Two contra-rotating vortices are formed either for the crest or for the trough of the waves. Downstream,
the vortex located in the UQD grows continuously from 1/6 th D to ½ D without detachment. Its

counterpart does not extend and is dissipated.
During the trough phase, the predominant eddy is developed in the DQU and extends to 2/3 rdD. We can
observe that the particles under the cylinder are submitted to high acceleration. At the upper limit of this
zone, the vortices (in DQU and in DQD) tend to be formed more and more away from the cylinder.
zone 4: vortex shedding (Fig. 33)
During the crest phase, the most interesting and visible phenomenon is the detachment of the anti-
clockwise vortex in the DQD (near the bed). It moves from 4/3rd D to four diameters, and then is coming
back to the cylinder during the trough phase. Its life duration (constant size, strong vorticity) is quite long,
almost one period. The vortex in the UQD grows continuously from 1/6th D to one diameter but remains
attached on the cylinder. We can notice the formation of a third vortex (anticlockwise) in the DQD which
size remains constant (1/6th D).
The trough phase presents a symmetric scheme to the crest with respect to a vertical axis (on the centre of
the cylinder). The detached vortex is spread to 2.5D.
zone 5: unsteady area (Fig.34 and 35)
We have noticed the alternation of two patterns in the crest phase. The first one is a typical scheme
composed of two contra-rotating vortices (symmetric) which are extending to one diameter. Their life
duration is very short.
The second scheme shows a predominant clockwise eddy in the UQD. It stretches up to one diameter but
does not detach. It seems, due to its size, to prevent any formation of other structure in the lower
downstream quarter. The trough phase is stable and similar to the zone 4.
3.3 e/D = 0.1
This condition looks like to the case e/D = 0.5. We can distinguish four zones (Fig.36) with very similar
schemes. Nevertheless we can notice that no vortex shedding appears anymore:
zone 1: flow without separation (Fig.37)
The flow is similar to the one in the zone 1 for e/D = 0.5. Some particles travel through the upper part of
the cylinder from 60° to 80° of deflection. The particles are submitted to a strong acceleration between
the bed and the cylinder.
zone 2: appearance of separation (Fig.38 and 39)

In this area, the diagrams during the crest and the trough are similar and the flow is like the case e/D = 0.5
(zone 2). The layer in which the separation occurs spreads until 1/6 th D. The main difference with
e/D = 0.5 is the presence of attached vortices near the bed. Their scale is small (1/6thD).
zone 3: extension of a predominant vortex(Fig.40 and 41)
The vortex in the UQD grows until 4/3rd D and its contrary remains close to the tube (1/6th D). A "jet like"
flow is formed between the bed and the cylinder:
zone 4: unsteady phase
The patterns are similar to the case e/D = 0.5 (zone 5) but without the vortex shedding.
3.4 e/D ~ 0
The first zones will not be detailed as long as they are similar to the case e/D = 0.1. However, a fifth zone
(Fig. 42) is added to these conditions. There is no vortex shedding anymore and the scale of the vortex is
relatively important (8/3D). Separation can still occur from the cylinder near the bed as the cylinder is not
completely laying on the bottom (e/D ~ 0).
zone 5: stable condition (Fig.43 and 44)
It corresponds to the case T = 2.66s for the wave height higher than 0.06m. In the crest phase, a big scale
vortex (clockwise) is forming downstream up to two diameters. During the trough, a pair of vortex is
created. The bigger one is symmetric to the one for the crest and the other one (clockwise) is sweep out in
the UQU up to 3 diameters. The life duration of these vortices is long, almost one period.
4. Flow regimes for D = 10cm
For the present case, the wake around the cylinder has been studied for three configurations (e/D = 0.5 –
0.1 – 0).
4.1 e/D = 0.5
We can notice that the number of wake schemes (Fig. 46) is less important and presents few complexities.
The sequence of the flow diagrams is quite similar than for the smaller diameter at the same gap to
diameter ratio. There is neither vortex shedding nor zone of instability.
zone 1: oscillation

The particles near the cylinder oscillate from 10° to 60° of amplitude at the upper and lower part of the
cylinder.
zone 2: beginning of separation (Fig.47 and 48)
The oscillating particles remain on a 1/6D layer thickness. Small vortices appear and are quickly diffused.
The crest and trough phases are symmetric.
zone 3: transitory zone (Fig.49 and 50)
The schemes are symmetric for both horizontal and vertical axis and for all the phases of the waves. The
influence area of the cylinder extends to 1/3rdD which corresponds to the scale of the vortices. The
particles are then led away downstream or upstream to a horizontal axis.
zone 4: non-symmetric flow (Fig.51 and 52)
During the crest phase, the formation of the vortices is symmetric along a horizontal axis. Their size is
varying from 1/3rrd D (T = 2.66s, H = 0.11m) to 2/3rd D (T = 2.00s, H = 0.18m). During the trough, the first
that develops, sizes 2/3rd D in the UQU. A second one is then formed in the DQU (4/3 rd D height).
Between this two situations, we observe the presence of two symmetric eddies (T=2.00s, H = 0.17m).
4.2 e/D = 0.1
Three zones are distinguished (Fig. 53). The schemes are simple, and the flow patterns are symmetric
between the different phases of the wave. Small vortices appear which were not present for the smaller
cylinder. We can notice that the spatial resolution is improved due to a bigger scale of the cylinder which
allows an easier flow detection.
zone 1: no separation
The particles are oscillating only at the upper part of the cylinder (10° to 60° of amplitude). The particles
located in the DQD and the DQD are static.
zone 2: separation (Fig.54 and 55)
The influence area of the cylinder extends to the whole circumference. The particles till 1/3 rdD are
submitted to an oscillatory movement. The crest and trough phases are symmetric. Small vortices (up to
2/3rdD) are formed in the gap.
zone 3: vortex shed from the gap (Fig.56 and 57)
During the crest phase, the vortex from the UQD grows till 2/3rd D. The eddy growing from the bed side is
shed up to two diameters and keeps its strength during a half period before being diffused. Its size reaches

almost 1D.
4.3 e/D ~ 0
Three zones are identifiable (Fig. 58). The two first are similar to the previous cases. The third presents
new flow features of the flow:
zone 3: formation of vortices in the upper area of the cylinder (Fig.59 and 60)
The vortex from the UQD grows until 4/3rd D to the detriment of the eddy developed near the bed where a
jet takes place. The crest and trough phases are symmetric.
5. Analysis of the three dimensional effects
The aim of this study is to clarify the instability of the flow regimes in time observed by the visualisations
(see part 3.1, zone 5). One explanation could be the influence of a velocity component in the transverse
direction of the wave channel. We have also observed a non-linear distribution of the seeding particles
under the cylinder in form of cells.
For a Keulegan Carpenter number equal to 1.5, the seeding remains under the cylinder (D = 10cm) on its
vertical axis but the distribution of the sediment is not uniform. When the KC number increases, the
seeding remains at two diameters upstream to the cylinder (KC = 3.1) and are launched in suspension for
higher KC number. The transverse velocities are acquired by using a LDV probe placed under the bed of
the wave channel. The measuring volume is located at the same elevation as the centre of the cylinder, at
0.5D downstream from the nearest cylinder surface, and at one third of the cylinder length from the side
wall of the flume. The results (Fig. 45) can be divided into three areas:
-the first area (0 < KC < 3) shows a slight increase of the transverse velocity and then an
insignificant three dimensional effect,
-for 3 < KC < 5, a transitory regime occurs where a raising of the transverse velocity level
takes place,
-for the highest KC numbers, the transverse velocity remains constant as the horizontal
velocities increase.
The two dimensional flow near the surface of a cylinder develops three dimensionality in forms
of mushrooms streaks when the KC is higher than unity (Re = 1000). In our case, the three-dimensional

effects appear for a higher range (KC > 3) than observed by Honji [10] or Sarpkaya [25]. The main
explanation of that difference is the effect of the wall (e/D = 0.5) in addition to a wavy flow.
Unfortunately no visualisations could confirm the development of Honji instabilities for this study.
6. Conclusion
These results can be compared almost only with those obtained for oscillatory flow. Sumer &
Fredsøe [29] have presented extensive analysis and demonstrated, as we do it for the case of a wave-
generated flow, the influence of the Reynolds number on the flow regime around a cylinder.
The visualisations performed in the wave flume show that the influence of the orbital motion cannot lead
to a creeping flow such as is generated in a U-tube. Chaplin [6] draws similar conclusions with a
simulated orbital motion of a cylinder in a still water tank. If we omit the bottom influence (case e/D = 3),
the phenomenon of separation takes place for the same KC band as that observed by Jensen and Roll [14]
and Sumer & Fredsøe [29]. However, the formation of symmetric vortices only appears in transitional
zones and for a high amplitude wave (5 < KC < 14), whereas Bearman [1] and Williamson [32] observed
these phenomenon for a KC close to 4.
The apparition of symmetric vortices for higher KC values is consistent with the results obtained by
Obasaju et al. [20] and Jensen [13] which notice an unstable character in the stream schemes. Grass et
al. [8] (KC = 10, Re = 2.61.104) also pointed out the unsteady property of the flow according to the
oscillatory motion phases. Studies dealing with instability sources allow the conclusion that these
phenomenons are generated by the flow itself. We have been able to show the apparition of longitudinal
velocities from a critical zone (3 < KC < 4). Such results are consistent with those of Tatsuno and
Bearman [31] demonstrating a flow deformation towards three-dimensional characteristics for KC > 3.
As the gap-to-diameter ratio decreases, we observe an increasing importance of a "wall vortex", some
zones of high velocities in the gap, and a simplification of the vortex schemes. The extensive studies
performed by Jacobsen et al. [11] and Sumer et al. [28] lead to the same conclusions but they also
evidence that the vortex do not come off from the wall cylinder for low gap-to-diameter values. In the
case of a wave-generated flow, the orbital motion takes back to the cylinder the vortices that come off, or
maintains them at a constant distance. For e/D = 0.1, the vortex developed in the upper part of the

cylinder cross through the path of the vortex which develops close to the wall and ejects it from the
structure. Thus, these two processes cannot be considered as real vortex shedding.
In spite of little studies in flume, our observations are consistent with the works of Jarno [12]
(2 < KC < 3) and Sakout [22] (KC = 5, e/D = 0.5 and 0.09) which pointed out a non-symmetry between
the crest and trough phenomenon as well as a more developed vortex activity up-stream to the structure.
In the same wave flume, Lambert [16] (KC = 5.7) reported results similar to our observations : an
increasing vortex activity with a decreasing distance between the cylinder and the free surface, and a
preferential formation of vortex the rotation direction of which is the same as that of the orbital motion.
Though the flow pattern follows the same trend for the two cylinder diameters with KC and Re, some
differences still remain. Further works are underway to represent this kind of flow in waves with the
adequate non-dimensional numbers. Despite the fact that no simultaneous record of the forces acting on
the pipeline near the sea-bed was undertaken for this study, the flow patterns represented in this work
provide good indications to relate the time series (especially the peaks) of the lift force with the
occurrence of vortices. The position and the strength of the vortices below the cylinder placed near the
bed point out the outset location of erosion (and in a way the erosion rate) initiated on an initially flat soft
bed.
References
[1] Bearman P.W. Vortex trajectories in oscillatory flow, Proceedings Separated Flow around Marine
Structures, The Norwegian Institute of Technology, 1985, pp. 133-152
[2] Bearman P.W., Graham J.M.R. Vortex shedding from bluff bodies in oscillatory flow: A report on
Euromech 119, Journal of Fluid Mechanics, 1980, Vol. 99, p. 225
[3] Bearman P.W., Graham J.M.R., Naylor P., Obasaju E.D. The role of vortices in oscillatory flow about
bluff bodies, International Symposium on Hydrodynamics in Ocean Engineering, 1981, pp. 621-644
[4] Bearman P.W., Zdravkovich M.M. Flow around a circular cylinder near a plane boundary, Journal of
Fluid Mechanics, 1978, Vol. 89, Part 1, pp. 33-47
[5] Bruce T., Easson W.J. The kinematics of wave induced flows around near-bed pipelines, Coastal
Engineering, Proceedings of the 23rd International Conference, 1992, pp. 2991-2998
[6] Chaplin J.R. On the irrotational flow around a circular cylinder in waves, Journal of Applied Mechanics,

Transactions of the ASME, 1981, Vol. 48, N°4, pp. 689-694
[7] Grass A.J., Raven P.W.J., Stuart R.J., Bray J.A. The influence of boundary layer velocity gradients and
bed proximity on vortex shedding from free spanning pipelines, Journal of Energy Resources Technology,
1984, Transactions of the ASME, Vol. 106, pp. 70-78
[8] Grass A.J., Simons R.R., Cavanagh N.J. Vortex-induced velocity enhancement in the wave-flow field
around cylinders, Proceedings 6th International Offshore Mechanics and Arctic Engineering Symposium,
1987, Vol. 2, pp. 155-164
[9] Hayashi T., Ohashi M. A dynamical and visual study on the oscillatory turbulent boundary layer, 3rd
Symposium on Turbulent Shear Flow, 1981, pp. 81-86
[10] Honji H. Streaked flow around an oscillating circular cylinder, Journal of Fluid Mechanics, 1981,
Vol. 107, pp. 509-520
[11] Jacobsen V., Bryndum M.B., Fredsøe J. Determination of flow kinematics close to marine pipelines and
their use in stability calculations, Proceedings of the 16th Annual Offshore Technology Conference, 1984,
Houston, Paper OTC 4833, Vol. 3, pp. 481-492
[12] Jarno A. Interaction houle-cylindre à faible nombre de Keulegan Carpenter, PhD Thesis, 1989, University
of Le Havre
[13] Jensen B.L. Experimental investigation of turbulent oscillatory boundary layers, Series paper N. 45, 1989,
Technical University of Denmark
[14] Jensen B.L., Roll P. Visualization of the flow around cylinders at small KC numbers, Institute of
Hydrodynamic and Hydraulic Engineering, Technical University of Denmark, 1989, Progress Report
Vol. 69, pp. 79-88
[15] Keulegan G.H., Carpenter L.H. Forces on cylinders and plates in an oscillating fluid, Journal of Research
of the National Bureau of Standards, 1958, Vol. 60, pp. 423-440
[16] Lambert E. Analyse des effets de proximité dans l'action de la houle sur un couple de cylindres
horizontaux, PhD Thesis, 1994, University of Le Havre
[17] Medeiros E.F., Brandao M.P., Miksad R.W. Experimental near field flow maps of a cylinder in a reversing
flow, Proceedings of the Seventh International Offshore and Polar Engineering Conference, 1997, Vol. 3,
pp. 710-717
[18] Medeiros E.F., Miksad R.W., Clemens N.T. A lift force model featuring velocity measurements around a

cylinder in a reversing flow, Proceedings of the 6th International Offshore and Polar Engineering
Conference, 1996, Los Angeles, Vol. 3, pp. 471-477
[19] Mouazé D. Etude expérimentale de la couche limite générée par la houle autour d'un cylindre, PhD
Thesis, 2001, University of Caen
[20] Obasaju E.D., Bearman P.W., Graham J.M.R. A study of forces, circulation and vortex patterns around a
circular cylinder in oscillating flow, Journal of Fluid Mechanics, 1988, Vol. 196, pp. 467-494
[21] Price S.J., Sumner D., Smith J.G., Leong K., Païdoussis M.P. Flow visualization around a circular
cylinder near to a plane wall, Journal of Fluids and Structures, 2002, Vol. 16, pp. 175-191
[22] Sakout A. Analyse des actions de la houle sur un cylindre horizontal à proximité d'une paroi plane, PhD
Thesis, 1992, University of Le Havre
[23] Sarpkaya T. Forces on cylinders near a plane boundary in a sinusoidally oscillating fluid, Journal of Ship
Research, Transactions of the ASME, 1976, pp. 499-505
[24] Sarpkaya T., Isaacson M. Mechanics of wave forces on offshore structures, Van Nostrand Reinhold
Company, Litton Educational Publishing, 1981
[25] Sarpkaya T. Force on a circular cylinder in viscous oscillatory flow at low Keulegan-Carpenter numbers,
Journal of Fluid Mechanics, 1986, Vol. 165, pp. 61-71
[26] Sawamoto M., Kikuchi K., Ohba M., Kashiwai J. Forces on a circular cylinder in an oscillatory flow,
Coastal Engineering in Japan, 1980, Vol. 23, pp. 147-158
[27] Sibetheros I.A., Miksad R.W., Ventre A.V., Lambrakos K.F. Flow mapping of the reversing vortex wake
of a cylinder in planar harmonic flow, Proceedings of the 4th International Offshore and Polar Engineering
Conference, 1994, Osaka, Vol. 3, pp. 406-412
[28] Sumer B.M., Jensen B.L., Fredsøe J. Effect of a plane boundary on oscillatory flow around a circular
cylinder, Journal of Fluid Mechanics, 1991, Vol. 225, pp. 271-300
[29] Sumer B.M., Fredsøe J. Flow around a cylinder in oscillatory flows, Advanced Series on Ocean
Engineering: Hydrodynamics around cylindrical structures, 1997, Vol. 12, Chap. 3
[30] Sunahara S., Kinoshita T. Flow around circular cylinder oscillating at low Keulegan-Carpenter Number,
Proceedings of the 4th International Offshore and Polar Engineering Conference, 1994, Osaka, Vol. 3,
pp. 476-483
[31] Tatsuno M., Bearman P.W. A visual study of the flow around an oscillating circular cylinder at low
Keulegan-Carpenter numbers and low Stokes numbers, 1990, Journal of Fluid Mechanics, Vol. 211,
pp. 157-182
[32] Williamson C.H.K. Sinusoidal flow relative to circular cylinders, Journal of Fluid Mechanics, 1985,
Vol. 155, pp. 141-174
W a v e m a k e r C y li n d e r a n d la s e r s h e e t D a m p in g s l o p e
Tw o M o v in g P a r t s
p i s t o n
F i lt e rs
W a v e g a u g e s
C o n t ro l le dM o t o r
s lo p e ( P V C )
b e d o f s t o n e s
p a ra b o l ic s lo p e
Fig.1 Experimental set-up: wave flume (22m long, 0.8m width), cylinder (D1 = 10 cm and D2 = 4 cm,
0.8m long) and laser sheet (1mm thickness, 40° light sheet angle)
2 0 ° 1 / 3 . D 1
U
U
p p e r
p s t r e a mQ u a r t e r
UQD
p p e ru a r t e ro w n s t r e a m
DQD
o w nu a r t e ro w n s t r e a m
DQU
o w nu a r t e rp s t r e a m
D = 1 0 c mD = 4 c m
1
2
1 / 6 . D 2

Fig.2 Definition of the divided space around the cylinder
On the following graphs, "Cr" means the crest phase of the wave, "Tr" means the trough phase of the
wave, "Z" means the zone delimited on the global flow graphs Re=f(KC).
2 0 0 0 4 0 0 0 6 0 0 0 8 0 0 0 1 0 0 0 0 1 2 0 0 0 1 4 0 0 0 1 6 0 0 0
0
2
4
6
8
1 0
1 2
1 4
1 6
1 8
2 0
2 2
2 4
2 6
K C
R e
¾
Fig.3 Flow regimes in the case D = 4cm and e/D = 3.0
Fig.4 T=1.33s, H=0.03m, Cr, Z1 Photo. 1 T=1.00s, H=0.04m
Fig.5 T=1.00s, H=0.08m, Cr, Z2 Fig.6 T=1.33s, H=0.06m, Cr, Z2

Fig.7 T=1.00s, H=0.12m, Cr, Z2 Fig.8 T=1.50s, H=0.11m, Cr, Z3
Fig.9 T=1.50s, H=0.11m, Tr, Z3 Fig.10 T=2.00s, H=0.03m, Cr, Z3
Fig.11 T=2.00s, H=0.03m, Tr, Z3
Fig.12 T=2.00s, H=0.09m, Cr, Z3/4 Fig.13 T=2.00s, H=0.09m, Tr, Z3/4
Fig.14 S2', T=2.66s, H=0.08m, Cr, Z3/4 Fig.15 S2', T=2.66s, H=0.08m, Tr, Z3/4

Fig.16 S3', T=2.66s, H=0.08m, Cr, Z3/4 Photo. 2 T=2.50s, H=0.08m
Fig.17 S3', T=2.66s, H=0.08m, Tr, Z3/4 Fig.18 S1, T=2.00s, H=0.10m, Cr, Z4
Fig.19 S1, T=2.00s, H=0.10m, Tr, Z4 Fig.20 S1, T=2.00s, H=0.12m, Cr, Z5
Fig.21 S1, T=2.00s, H=0.12 m, Tr, Z5 Fig.22 S2, T=2.00s, H=0.10m, Cr, Z5

Fig.23 S2, T=2.00s, H=0.10m, Tr, Z5 Photo. 3 T=2.00s, H=0.10m
Fig.24 S3, T=2.00s, H=0.10m, Cr, Z5 Photo. 4 T=2.00s, H=0.10m
Fig.25 S3, T=2.00s, H=0.10m, Tr, Z5 Photo. 5 T=2.00s, H=0.10m
Fig.26 S3’, T=2.00s, H=0.10m, Cr, Z5 Photo. 6 T=2.00s, H=0.10m

T(s) H (cm) S1 S2 S2' S3 S3'
10 2 to 3 2 to 3 2 to 3
11 13 to 14 3 to 4
12 3 to 4 2 to 3 10 to 12
14 2 to 4 2 to 4 2 to 4
15 4 to 5 1 to 2 4 to 5
8 10 20
9 2 to 3 25
10 3 to 4 2 to 3 10 to 12
11 3 to 4 3 to 4
2,00
2,66
Table 1: Number of waves for each succeeding scheme
2 0 0 0 4 0 0 0 6 0 0 0 8 0 0 0 1 0 0 0 0 1 2 0 0 0 1 4 0 0 0 1 6 0 0 0
0
2
4
6
8
1 0
1 2
1 4
1 6
1 8
2 0
2 2
2 4
2 6
K C
R e
Fig.27 Flow regimes in the case D = 4cm and e/D = 0.5
Fig.28 T=2.00s, H=0.01m, Cr, Z1 Fig.29 T=1.50s, H=0.05m, Cr, Z2

Fig.30 T=1.50s, H=0.05m, Tr, Z2 Fig.31 T=1.50s, H=0.09m, Cr, Z3
Fig.32 T=1.50s, H=0.09m, Tr, Z3 Fig.33 T=2.00s, H=0.13m, Cr, Z4
Fig.34 1, T=2.66s, H=0.10m, Cr, Z5 Fig.35 T=2.66s, H=0.10m, Cr, Z5
Photo. 7 T=2.50s, H=0.10m

2 0 0 0 4 0 0 0 6 0 0 0 8 0 0 0 1 0 0 0 0 1 2 0 0 0 1 4 0 0 0 1 6 0 0 0
0
2
4
6
8
1 0
1 2
1 4
1 6
1 8
2 0
2 2
2 4
2 6
K C
R e
Fig.36 Flow regimes in the case D=4cm and e/D=0.1
Fig.37 T=1.50s, H=0.03m, Cr, Z1 Fig.38 T=1.50s, H=0.05m, Cr, Z2
Fig.39 T=1.50s, H=0.05m, Tr, Z2
Fig.40 T=2.00s, H=0.12m, Cr, Z3 Fig.41 T=2.00s, H=0.12m, Tr, Z3

2 0 0 0 4 0 0 0 6 0 0 0 8 0 0 0 1 0 0 0 0 1 2 0 0 0 1 4 0 0 0 1 6 0 0 0
0
2
4
6
8
1 0
1 2
1 4
1 6
1 8
2 0
2 2
2 4
2 6
K C
R e
Fig.42 Flow regimes in the case D = 4cm and e/D ~ 0
Fig.43 T=2.66s, H=0.11m, Cr, Z5 Fig.44 T=2.66s, H=0.11m, Tr, Z5
0 2 4 6 8 10
0,2
0,3
0,4
0,5W/U
KC
Fig.45 Ratio between transversal velocities W and longitudinal velocities U as a function of KC

5 0 0 0 1 0 0 0 0 1 5 0 0 0 2 0 0 0 0 2 5 0 0 0 3 0 0 0 0 3 5 0 0 0 4 0 0 0 0
0
2
4
6
8
1 0
R e
K C
Fig.46 Flow regimes in the case D=10cm and e/D=0.5
Fig.47 T=1.50s, H=0.06m, Cr, Z2 Fig.48 T=1.50s, H=0.06m, Tr, Z2
Fig.49 T=2.00s, H=0.10m, Cr, Z3 Photo. 8 T=2.00s, H=0.10m

Fig.50 T=2.00s, H=0.10m, Tr, Z3
Fig.51 T=2.66s, H=0.11m, Cr, Z4 Fig.52 T=2.66s, H=0.11m, Tr, Z4
5 0 0 0 1 0 0 0 0 1 5 0 0 0 2 0 0 0 0 2 5 0 0 0 3 0 0 0 0 3 5 0 0 0 4 0 0 0 0
0
2
4
6
8
1 0
R e
K C
Fig.53 Flow regimes in the case D = 10cm and e/D = 0.1
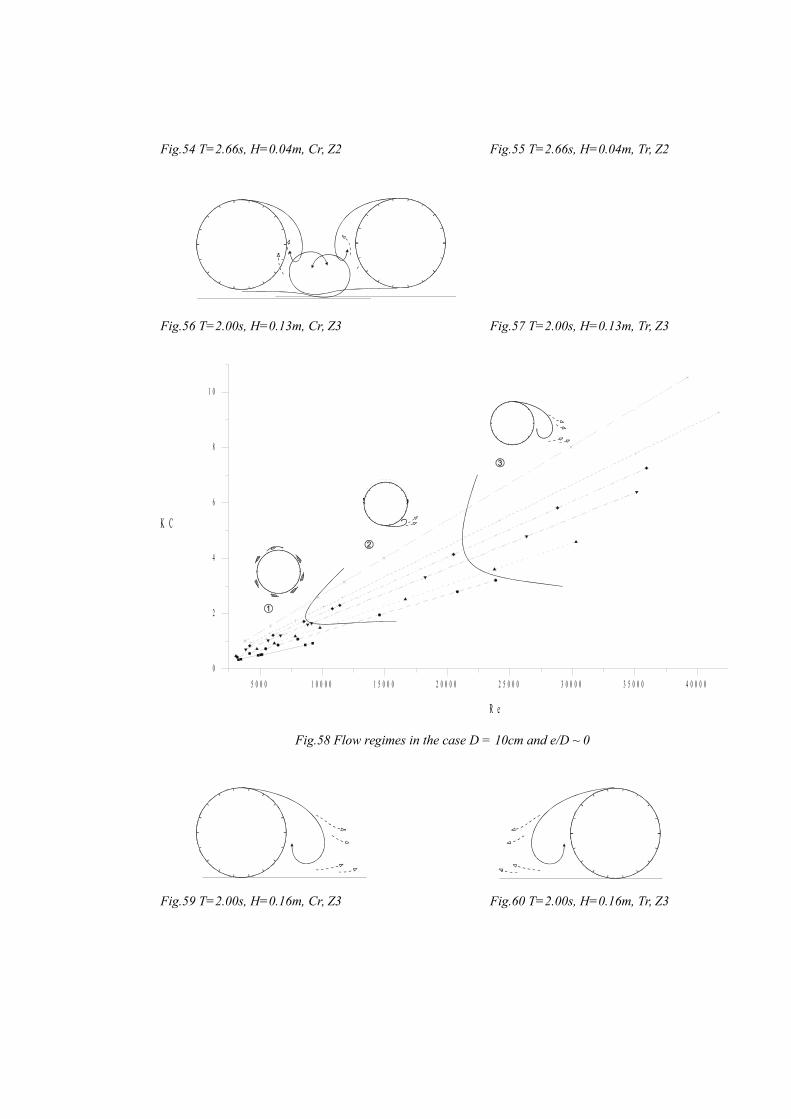
Fig.54 T=2.66s, H=0.04m, Cr, Z2 Fig.55 T=2.66s, H=0.04m, Tr, Z2
Fig.56 T=2.00s, H=0.13m, Cr, Z3 Fig.57 T=2.00s, H=0.13m, Tr, Z3
5 0 0 0 1 0 0 0 0 1 5 0 0 0 2 0 0 0 0 2 5 0 0 0 3 0 0 0 0 3 5 0 0 0 4 0 0 0 0
0
2
4
6
8
1 0
R e
K C
Fig.58 Flow regimes in the case D = 10cm and e/D ~ 0
Fig.59 T=2.00s, H=0.16m, Cr, Z3 Fig.60 T=2.00s, H=0.16m, Tr, Z3


