Embed Size (px)
Citation preview

1
ONLINE DATA SUPPLEMENTARY MATERIAL
Supplementary Methods
Synchronizing the computational algorithm with time-dependent 3-D images:
A sequence of images to capture the beating heart was acquired by high-speed scanning via four steps:
(1) The image sequences to capture a specific section of the heart were
split into multiple periods, and the individual periods were processed. Since
the Zebrafish heart rates were often not in synchrony with the scanning time,
we minimized the difference in the least square intensity with respect to the
periodic hypothesis (T) by estimating the period of each sub-sequence.1, 2 We
scanned the fish to ensure that the individual sequence of images cover 4 to 5
cardiac cycles. During post-data processing, the first and last periods were discarded to ensure data integrity. The
images capturing the heart at the same instantaneous moment in different periods were correlated. By using this
correlation, we adopted the following cost function to estimate the period:
𝐷 𝑧! ,𝑇! = { 𝐼! 𝑥!, 𝑧! , 𝜏!(!) − 𝐼! 𝑥, 𝑧! , 𝜏!(!)!+ 𝜏!! − 𝜏!!!!
!/𝑇!!}!/!!!!!
!!!!∈!! (1), where D denotes the
cost function of fitting a period hypothesis, Im the captured image, τ’ the time instance when the image is captured,
zk the z-direction index of a slice, and xm is a vector denoting the pixel index.
(2) We calculated the relative shift to serve as an indent between image sequences. Despite the identical
periods, two image sequences might not be aligned. As mentioned above, the scanning operation proceeded from
section to section, and there was an idle time between sections to allow for camera adjustment. When the scanner
was ready to capture the next section, the heart was not necessarily in the same cardiac cycle as that of the previous
section. The two sections had to be aligned before the 3-D structure reconstruction. This phenomenon was called
relative shift determination. Two adjacent sections of the heart should have similar appearances. We exploited this
similarity and formulated the relative shift determination in the form of quadratic minimization:3
𝑠 = 𝐼! 𝑥, 𝑧! , 𝑡 − 𝐼! 𝑥, 𝑧!! , 𝑡 − 𝑠 !𝑑𝑡𝑑𝑥!!
!! (2), where Qk,k’ denotes a cost function of fitting a relative
shift hypothesis, R the possible spatial neighborhood, L the total time of image capturing, and s the relative shift
hypothesis.
Flow chart 2

2
(3) Next, we converted the relative shift to the absolute shift with respect to the first image sequence. Although
relative shift could be used to align two adjacent frames, all of the frames were aligned to reconstruct the entire heart.
Upon obtaining all relative shifts, a relation to align the next section given the previous section was built. This
recurrent relation was transformed into an absolute relation by solving a linear equation (not shown) using the
pseudo-inverse approach as previously described.4
Supplementary Tables
Table S1. Coefficients of variation at end-diastole
Control Gata1a MO injected
Gata1a MO + Nrg1 mRNA AG1478 treated
50hpf 15.0% 9.4% 6.7% 12.9% 75hpf 11.5% 12.4% 15.3% 14.2% 100hpf 5.2% 12.7% 6.6% 9.5%
Table S2. Primers for the in vitro experiments
Human Hes1: Forward TGAGCCAGCTGAAAACACTG
Backward GTGCGCACCTCGGTATTAAC
Human Hey1: Forward GTTCGGCTCTAGGTTCCATGT
Backward CGTCGGCGCTTCTCAATTATTC
Human Jag1 Forward CAAAGTGTGCCTCAAGGAGTATCAGTCC
Backward GAAAGGCAGCACGATGCGGTTG
Human Jag2 Forward ATGCGACACTCGCTCGAT
Backward GTCGTCATCCCCTTCCAGTT
Human Dll1 Forward CAGGGTTGCACACTTTCTCC
Backward GCACGGACCTCAAGTACTCC
Human Dll3 Forward CCTGCGCGCTGAATGTC
Backward CATCGAAACCTGGAGAGAGG
Human Dll4 Forward CGACAGGTGCAGGTGTAGC
Backward TACTTGTGATGAGGGCTGGG

3
Table S3. Human Nrg1 PCS2+ cloning primers:
hNrg1-Clone
Forward TCTTTTTGCAGGATCCACCATGGAGATTTATTCCCCAGA
CATGTCTG
Backward GAGAGGCCTTGAATTCCTATTCAGGCAGAGACAGAAAG
GGAGTG
Table S4. Primers for in vivo experiments
Zebrafish Jag1 Forward CCGCGTATGTTTGAAGGAGTATCAGTCG
Backward CAGCACGATCCGGGTTTTGTCG
Zebrafish Jag2 Forward AGCCCTAGCAAAACGAGCGACG
Backward GCGTGAATGTGCCGTTCGATCAA
Zebrafish Dll4 Forward CAAAGTGGGAAGCAGACAGAGCTAAGG
Backward CGGTCATCCCTGGGTGTGCATT
Zebrafish BMP10 Forward GCATCAAGGGGCCACTCGTGTAGA
Backward TCGTCTCACTCCACTAGGTCCCATACTG
Zebrafish ErbB2 Forward GATCAGGACTGCCAAACATTGACGTCT
Backward AGCAGCACACTGAACATGGCAGCA
Zebrafish Nrg-1 Forward GTGTGTTTGTCCCTGTGGACGCGT
Backward CCTCCTGGAGCTTCCCCTCAAACA
Zebrafish Notch1b Forward CAGAGAGTGGAGGCACAGTGCAATCC
Backward GCCGTCCCATTCACACTCTGCATT

4
Figure S1.

5
Figure S2
6
Figure S3.
7
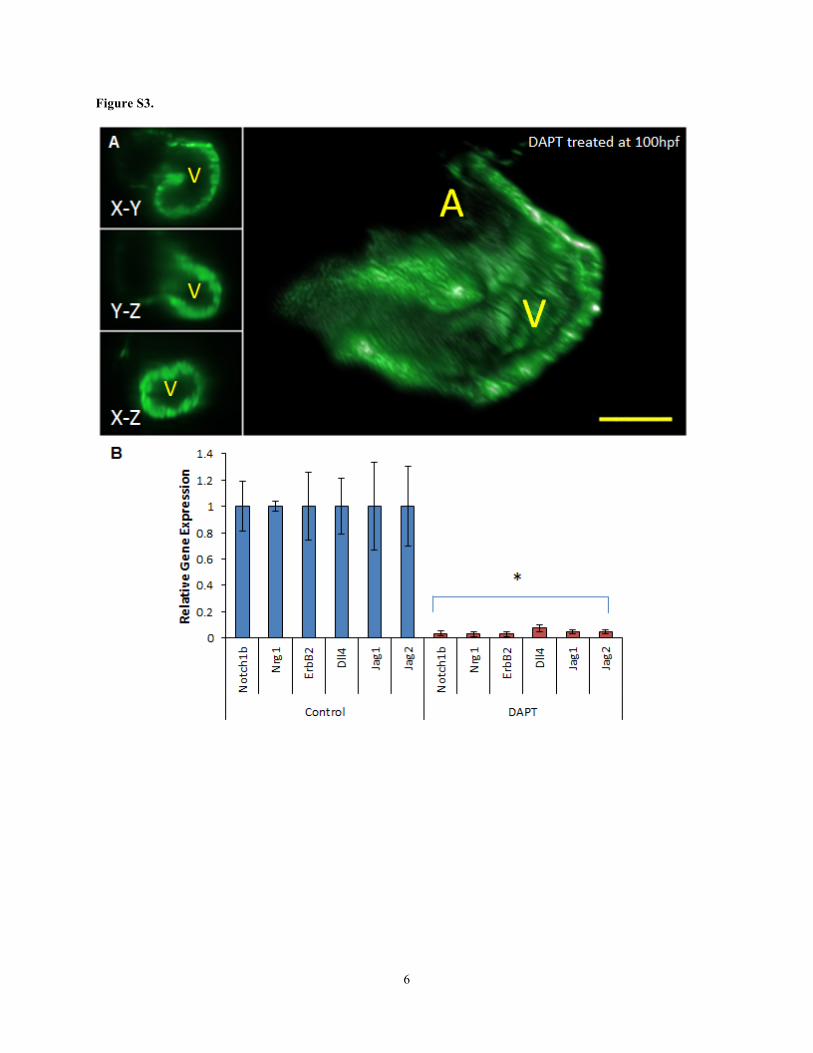
Figure S4

8
Figure S5

9
Figure S6

10
Supplementary Figure Legends.
Figure S1. Our in-house Fluorescent Light-Sheet Microscopy (LSM) and 3-D images. (A) Optical components for
the LSM set-up include the laser source(s), illuminating and detecting lenses, and a high-frame rate CMOS camera.
(B) A zoomed-in image highlights the sample at the orthogonal intersection between the detecting and illuminating
lenses. (C) 3-D LSM images reveal the hepatic cell network at the mm scale, (D) the branching airway at the
sub-millimeter scale, (E) the sprouting human umbilical endothelial cells grown in Matrigel, as well as (F) the entire
zebrafish embryo imaged at the micron scale.
Figure S2. Schematic diagram of LSM system. Our in-house LSM consists of an illumination and a detection unit. A
laser beam (blue line) from one or more lasers is collected and focused by the beam expander to optimize the beam
size. A cylindrical lens (CL) converts the laser beam to a sheet of laser light that can transversely illuminate a thin
section of sample (A) (B). The sample is mounted at the intersection between illumination lens (IL) and detection
lens (DL). The illuminated 2-D thin section (fluorescent detection in green) is captured by the high-frame rate
sCMOS camera (C). Note that the illumination axis is orthogonal to the detection axis. The illumination optics is
designed to illuminate a very thin volume around the focal plane of the detection objective. M: Mirror, BS: Beam
splitter, BE: Beam expander, TL: Tube lens.
Figure S3. γ-secretase inhibitor (DAPT) prevented transmigration of NICD to inhibit Notch signaling and
trabeculation. (A) Treatment with DAPT blocked trabeculation. (B) Notch-related mRNA expression was
down-regulated in DAPT-treated fish. (t-test, *p < 0.05, n=5). A: Atrium, V: Ventricle.
Figure S4. Regional strain measurements. (A) Trabecular (yellow lines) and non-trabecular (red lines) regions
from controls as well as their combined myocardial segment (purple lines) are illustrated at end-systole and
end-diastole. (B) ErbB signaling inhibitor (AG1478) treatment inhibited trabeculation. Non-trabeculated
myocardium (dark blue lines) and the combined myocardial segment (sky blue line) are illustrated at end-systole and
end-diastole. (C) Segmental strain curves from trabeculated control regions (red lines), non-trabeculated control
regions (yellow lines) and AG1478–treated non-trabeculated regions (dark blue lines) are illustrated. (D)

11
Comparing the combined strain between controls (purple) and AG1478 treatment (sky blue) illustrates the decrease
in contractility in response to AG1478.
Figure S5. Contractile function in response to wea mutation. (A) The wea mutants developed reduced strain rates
when compared to the wild type. Injection of Nrg1 mRNA moderately restored strain rates. Strain remained at zero
during diastole. (B) The wea mutants developed a reduced ventricular volume when compared to the wild type. The
ventricular contractility (volume change) was partially restored with Nrg1 mRNA injection at 1-4 cell stage.
Figure S6. Cloning and verification of human Nrg-1 (zNrg-1) mRNA for zebrafish. (A) Human Nrg-1 (hNrg-1)
cDNA was cloned into pCS2+ vector at the multiple cloning sites. (B) HEK293 cells were transfected with vector
alone or two clones from the pCS2-hNrg-1 plasmids. Cell lysates were applied to perform the Western blots with
anti-Nrg-1 antibody. Both pCS2-hNrg-1 clones expressed Nrg-1 protein at the anticipated band size.

12
Supplementary Video Legends
Video S1. Control heart scan
Video S2. Gata1a MO heart scan
Video S3. Rescued by Nrg-1
Video S4. Tnnt2a MO heart scan
Video S5. Cloche mutant heart scan
Video S6. Blood circulation from control zebrafish
Video S7. Blood circulation from EPO mRNA injected zerbafish
Video S8. 4-D beating zebrafish heart image

13
Supplemental References
1. Dworetsky M. A period-finding method for sparse randomly spaced observations or “how long is a piece of
string?”. Monthly Notices of the Royal Astronomical Society. 1983;203:917-924
2. Stellingwerf R. Period determination using phase dispersion minimization. The Astrophysical Journal.
1978;224:953-960
3. Thevenaz P, Ruttimann UE, Unser M. A pyramid approach to subpixel registration based on intensity.
Image Processing, IEEE Transactions on. 1998;7:27-41
4. Liebling M, Forouhar AS, Gharib M, Fraser SE, Dickinson ME. Four-dimensional cardiac imaging in
living embryos via postacquisition synchronization of nongated slice sequences. Journal of biomedical
optics. 2005;10:054001