Embed Size (px)
Citation preview
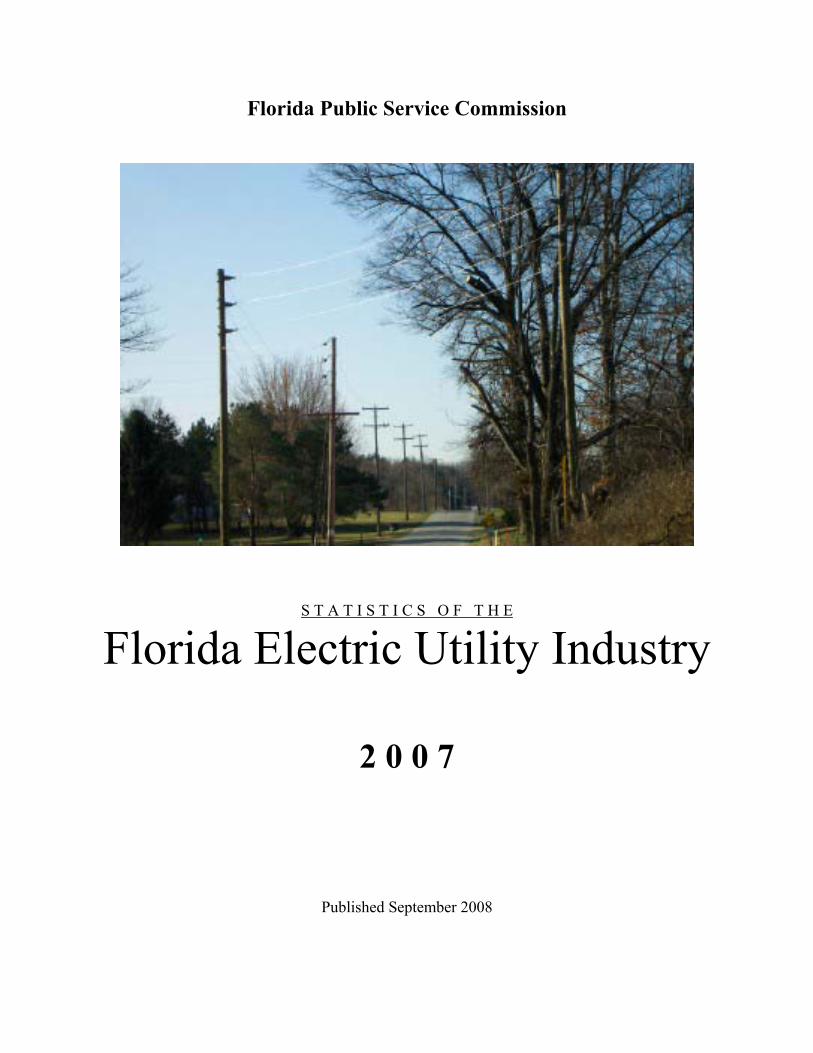
Florida Public Service Commission
S T A T I S T I C S O F T H E
Florida Electric Utility Industry
2 0 0 7
Published September 2008

STATISTICS OF THE FLORIDA ELECTRIC UTILITY INDUSTRY
2007
In partial fulfillment of Section 377.703, Florida Statutes, this publication provides a single comprehensive source of statistics on Florida's electric utility industry.
Information was compiled primarily from three sources: the Federal Energy Information Administration, the Florida Reliability Coordinating Council, and Florida electric utilities. The Florida Public Service Commission has not audited the data and cannot verify its accuracy. Information compiled from electric utilities may be incomplete or inaccurate; therefore totals may deviate from totals reported by other institutions. This report compiled by the Florida Public Service Commission’s Office of Public Information
Please contact 850-413-6482 with any questions.

i
TABLE OF CONTENTS
Figure Table Page INTRODUCTION 1 Florida Sources of Electricity by Type of Ownership 1 Maps of Service Areas and Plant Locations 2 Investor-Owned Electric Utilities 23 Municipal Electric Utilities 34 Rural Electric Cooperatives 4 Florida Electric Utility Industry - 2007 (Company Listing) 5 Counties Served by Generating Electric Utilities - 2007 6 Counties Served by Nongenerating Electric Utilities - 2007 7
SUMMARY OF FINANCIAL STATISTICS FOR INVESTOR-OWNED UTILITIES (IOUs)
1 Summary Statistics - 2003-2007 8 2 Allowed and Actual Rates of Return - 2003-2007 10 Average per Book Rate of Return Average Adjusted Rate of Return Required Rate of Return Adjusted Jurisdictional Year-End Rate Base 3 Sources of Revenue - 2003-2007 11 4 Uses of Revenue - 2003-2007 12 5 Proprietary Capital and Long-Term Debt - 2007 13 6 Financial Integrity Indicators - 2003-2007 14 Times Interest Earned with AFUDC Times Interest Earned without AFUDC AFUDC as a Percentage of Net Income Interest Coverage Ratio Percent Internally Generated Funds
NET GENERATION 7 Net Generation by Type of Ownership - 1993-2007 15 8 Net Energy for Load by Fuel Type and Other Sources - 1993-2007 16 9 Interchange and Generation by Fuel Type - 2007-2017 17 10 Interchange and Generation by Fuel Type - (Percentage Basis) - 2007-
2017 18
GENERATNG CAPACITY AND CAPABILITY
11 Installed Nameplate Capacity/Summer Net Capability by Prime Mover - 1993-2007
19
12 Installed Nameplate Capacity/Summer Net Capability by Type of Ownership - 1993-2007
20
13 Installed Winter Net Capacity/Summer Net Capability by Utility 2003-2007
21
14 Summer Net Capability by Prime Mover by Utility – 2007 22 15 Nuclear Generating Units – 2007 23
ii
16 Monthly Peak Demand – 2007 24 17 Annual Peak Demand - 1993-2007 26 18 Summer and Winter Peak Demand - Projected - 2008-2017 27 19 Load Factors by Generating Utilities – 2007 28
FUEL ANALYSIS 20 Fuel Requirements - 1993-2007 29 21 Fuel Requirements - Projected – 2007-2017 30
CONSUMPTION 22 Monthly Consumption by Class of Service – 2007 31 23 Consumption by Class of Service by Utility – 2007 32 24 Average Annual Consumption per Customer by Class of Service By
Utility – 2007 33
25 Sale for Resale by Selected Utility – 2007 34 26 Consumption by Utility – 2003-2007 35 27 Total Consumption and Percentage Change by Class of Service - 1998-
2007 36
28 Consumption as a Percentage of Total by Class of Service - 1993-2007 37
REVENUES 29 Monthly Revenues by Class of Service by Selected Utility – 2007 38 30 Customer Revenues by Class of Service - 1993-2007 39 31 Customer Revenues as a Percentage of Total by Class of Service - 1993-
2007 40
NUMBER OF CUSTOMERS
32 Monthly Number of Customers by Class of Service by Selected Utility – 2007
41
33 Average Number of Customers by Class of Service by Utility – 2007 42 34 Average Number of Customers by Utility - 2003-2007 43 35 Average Number of Customers and Percentage Change
by Class of Service - 1998-2007 44
36 Population and Customers for Select Investor-Owned Utilities - 1998-2017
45
PRICES
37 Price of Residential Service - December 31, 2007 46 38 Price of Commercial and Industrial Service - December 31, 2007 49
ECONOMIC AND FINANCIAL INDICATORS 39 Population Estimates - 1998-2007 52 40 Population Projections - 2010-2030 52
41 Consumer Price Index All Urban Consumers, Annual Rate of Change - 1998-2007 53
42 For All Items and Fuel and Other Utilities - 1998-2007 53

iii
43
Producer Price IndexTotal Finished Goods & Capital Equipment - 1998-2007 54
APPENDIX Abbreviations and Terminology 55 Glossary of Electric Utility Terms 57


INTRODUCTION

1
F i g u r e 1
FLORIDA SOURCES OF ELECTRICITYBY TYPE OF OWNERSHIP
Investor-Owned Electric Utilities
Source:Florida Public Service Commission
2
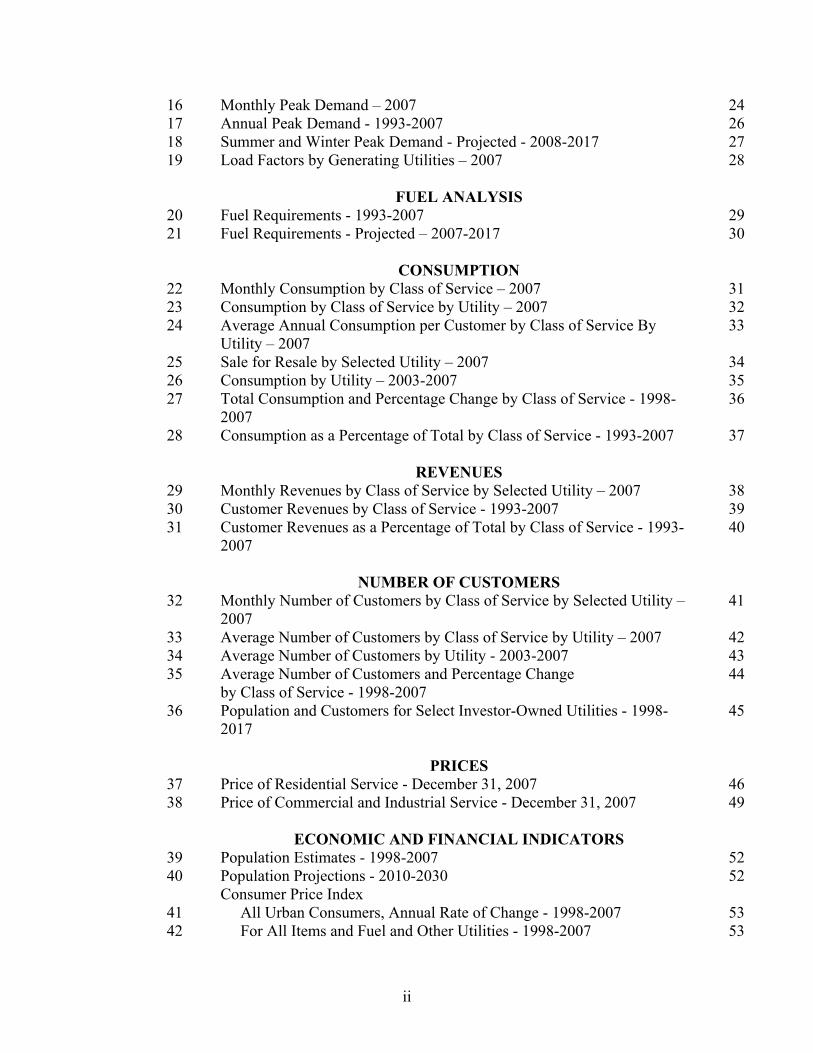
F i g u r e 2
Approximate Company Service Areas
Service areas are approximations.Information on this map should be used only as a general guideline.For more detailed information, contact individual utilities.
4
1
125
6
13
2
4
2
4
3
7
10
9
121
6 3
3
9
11
11
1
1
15
13
14
8
2
8
7
5
54
10
1
2
23
Cape CanaveralCutlerFort MyersLauderdaleManateeMartinPort EvergladesPutnamRivieraSanfordSt. JohnsSt. LucieTurkey PointScherer (Georgia)
AncloteAvon Park (ECS)BayboroCrystal RiverDeBaryHigginsHines Energy ComplexIntercession CityP.L. BartowPort St. Joe (ECS)Rio PinarSuwannee RiverTiger BayTurnerUniversity of Florida
1.2.3.4.5.6.7.8.9.10.11.12.13.14.
1.2.3.4.5.6.7.8.9.10.11.12.13.14.15.
1.2.3.4.5.6.
1.2.
A. Florida Power & Light Company
D. Gulf Power Company
B. Progress Energy Florida E. Florida Public Utilities Corporation
Big BendGannonHookers PointPhillipsPolk
CristLansing SmithPea RidgeScholzDaniel (Mississippi)Scherer (Georgia)
FernandinaMarianna
Steam GenerationNuclearInternal Combustion or Gas TurbineIOU Headquarters
Not Serviced by Investor-Owned Utilities
1.2.3.4.5.
C. Tampa Electric Company
UTILITIES AND POWER PLANT SITES
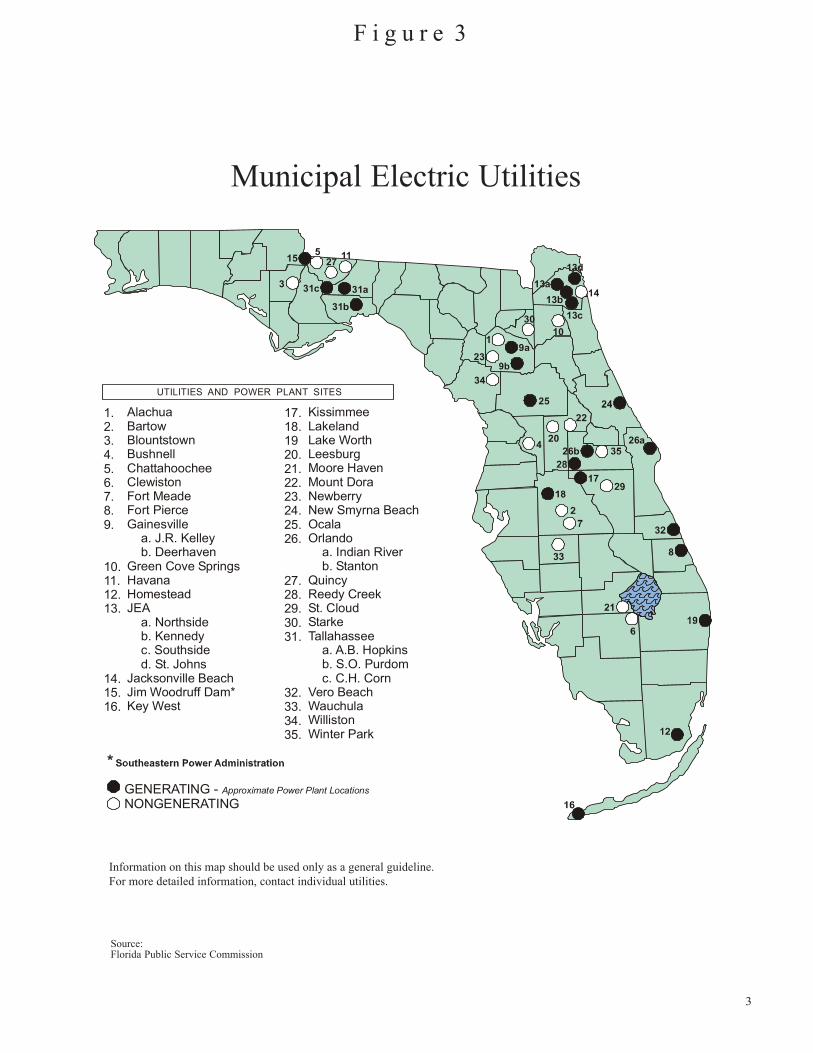
Municipal Electric Utilities
3
Source:Florida Public Service Commission
F i g u r e 3
Information on this map should be used only as a general guideline.For more detailed information, contact individual utilities.
GENERATING - NONGENERATING
Approximate Power Plant Locations
26b26a
13a
31b
5
13b
13d
31a3
13c
112715
22
9b23
10
20
25
1
30
4
34
9a
14
KissimmeeLakelandLake WorthLeesburgMoore HavenMount DoraNewberryNew Smyrna BeachOcala Orlando a. Indian River b. StantonQuincyReedy CreekSt. CloudStarkeTallahassee a. A.B. Hopkins b. S.O. Purdom c. C.H. CornVero BeachWauchulaWillistonWinter Park
AlachuaBartowBlountstownBushnellChattahoocheeClewistonFort MeadeFort PierceGainesville a. J.R. Kelley b. DeerhavenGreen Cove SpringsHavanaHomesteadJEA a. Northside b. Kennedy c. Southside d. St. JohnsJacksonville BeachJim Woodruff Dam*Key West
1.2.3.4.5.6.7.8.9.
10.11.12.13.
14.15.16.
17.18.1920.21.22.23.24.25.26.
27.28.29.30.31.
32.33.34.35.
31c
UTILITIES AND POWER PLANT SITES
4
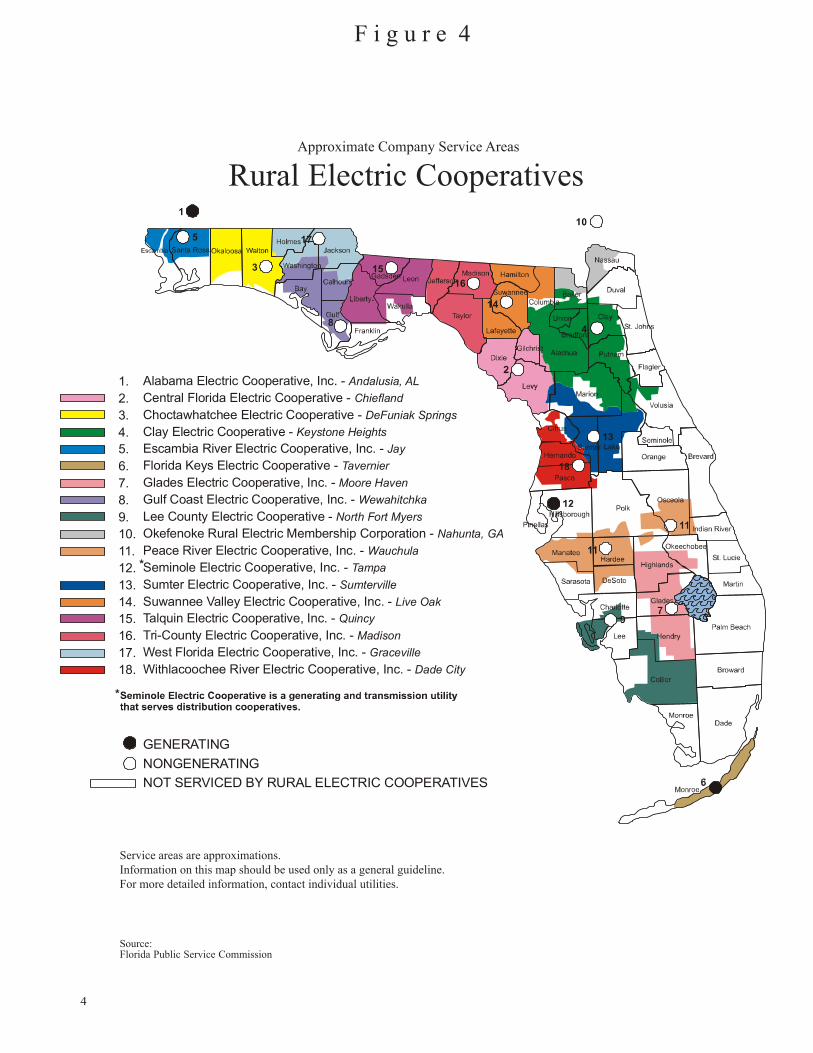
Rural Electric Cooperatives
Source:Florida Public Service Commission
F i g u r e 4
Approximate Company Service Areas
Service areas are approximations.Information on this map should be used only as a general guideline.For more detailed information, contact individual utilities.
GENERATINGNONGENERATINGNOT SERVICED BY RURAL ELECTRIC COOPERATIVES
1.2.3.4.5.6.7.8.9.10.11.12.13.14.15.16.17.18.
Alabama Electric Cooperative, Inc. - Central Florida Electric Cooperative - Choctawhatchee Electric Cooperative - Clay Electric Cooperative - Escambia River Electric Cooperative, Inc. - Florida Keys Electric Cooperative - Glades Electric Cooperative, Inc. - Gulf Coast Electric Cooperative, Inc. - Lee County Electric Cooperative - Okefenoke Rural Electric Membership Corporation - Peace River Electric Cooperative, Inc. - Seminole Electric Cooperative, Inc. - Sumter Electric Cooperative, Inc. - Suwannee Valley Electric Cooperative, Inc. - Talquin Electric Cooperative, Inc. - Tri-County Electric Cooperative, Inc. - West Florida Electric Cooperative, Inc. - Withlacoochee River Electric Cooperative, Inc. -
Andalusia, ALChiefland
DeFuniak SpringsKeystone Heights
Jay Tavernier Moore Haven
WewahitchkaNorth Fort Myers
Nahunta, GAWauchula
TampaSumterville
Live OakQuincy
MadisonGraceville
Dade City
5
4
3
17
1
8
1516
14
*
*
5
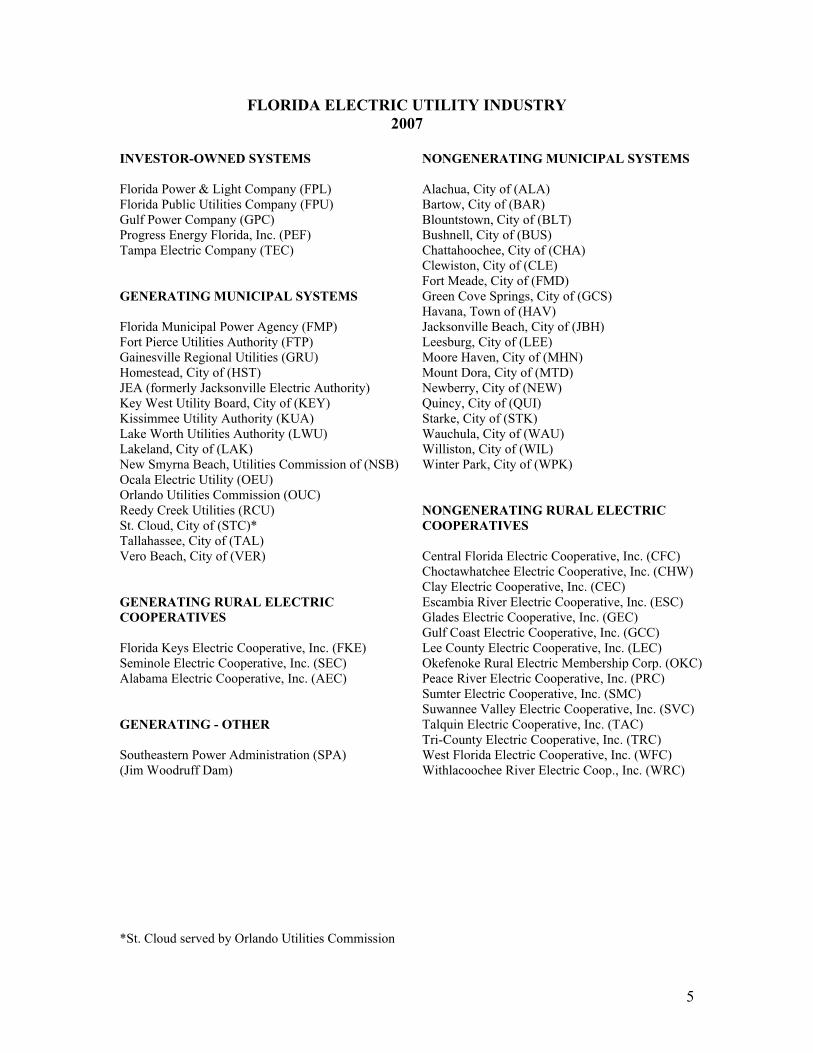
FLORIDA ELECTRIC UTILITY INDUSTRY 2007
INVESTOR-OWNED SYSTEMS Florida Power & Light Company (FPL) Florida Public Utilities Company (FPU) Gulf Power Company (GPC) Progress Energy Florida, Inc. (PEF) Tampa Electric Company (TEC) GENERATING MUNICIPAL SYSTEMS Florida Municipal Power Agency (FMP) Fort Pierce Utilities Authority (FTP) Gainesville Regional Utilities (GRU) Homestead, City of (HST) JEA (formerly Jacksonville Electric Authority) Key West Utility Board, City of (KEY) Kissimmee Utility Authority (KUA) Lake Worth Utilities Authority (LWU) Lakeland, City of (LAK) New Smyrna Beach, Utilities Commission of (NSB) Ocala Electric Utility (OEU) Orlando Utilities Commission (OUC) Reedy Creek Utilities (RCU) St. Cloud, City of (STC)* Tallahassee, City of (TAL) Vero Beach, City of (VER) GENERATING RURAL ELECTRIC COOPERATIVES Florida Keys Electric Cooperative, Inc. (FKE) Seminole Electric Cooperative, Inc. (SEC) Alabama Electric Cooperative, Inc. (AEC) GENERATING - OTHER Southeastern Power Administration (SPA) (Jim Woodruff Dam)
NONGENERATING MUNICIPAL SYSTEMS Alachua, City of (ALA) Bartow, City of (BAR) Blountstown, City of (BLT) Bushnell, City of (BUS) Chattahoochee, City of (CHA) Clewiston, City of (CLE) Fort Meade, City of (FMD) Green Cove Springs, City of (GCS) Havana, Town of (HAV) Jacksonville Beach, City of (JBH) Leesburg, City of (LEE) Moore Haven, City of (MHN) Mount Dora, City of (MTD) Newberry, City of (NEW) Quincy, City of (QUI) Starke, City of (STK) Wauchula, City of (WAU) Williston, City of (WIL) Winter Park, City of (WPK) NONGENERATING RURAL ELECTRIC COOPERATIVES Central Florida Electric Cooperative, Inc. (CFC) Choctawhatchee Electric Cooperative, Inc. (CHW) Clay Electric Cooperative, Inc. (CEC) Escambia River Electric Cooperative, Inc. (ESC) Glades Electric Cooperative, Inc. (GEC) Gulf Coast Electric Cooperative, Inc. (GCC) Lee County Electric Cooperative, Inc. (LEC) Okefenoke Rural Electric Membership Corp. (OKC) Peace River Electric Cooperative, Inc. (PRC) Sumter Electric Cooperative, Inc. (SMC) Suwannee Valley Electric Cooperative, Inc. (SVC) Talquin Electric Cooperative, Inc. (TAC) Tri-County Electric Cooperative, Inc. (TRC) West Florida Electric Cooperative, Inc. (WFC) Withlacoochee River Electric Coop., Inc. (WRC)
*St. Cloud served by Orlando Utilities Commission
6
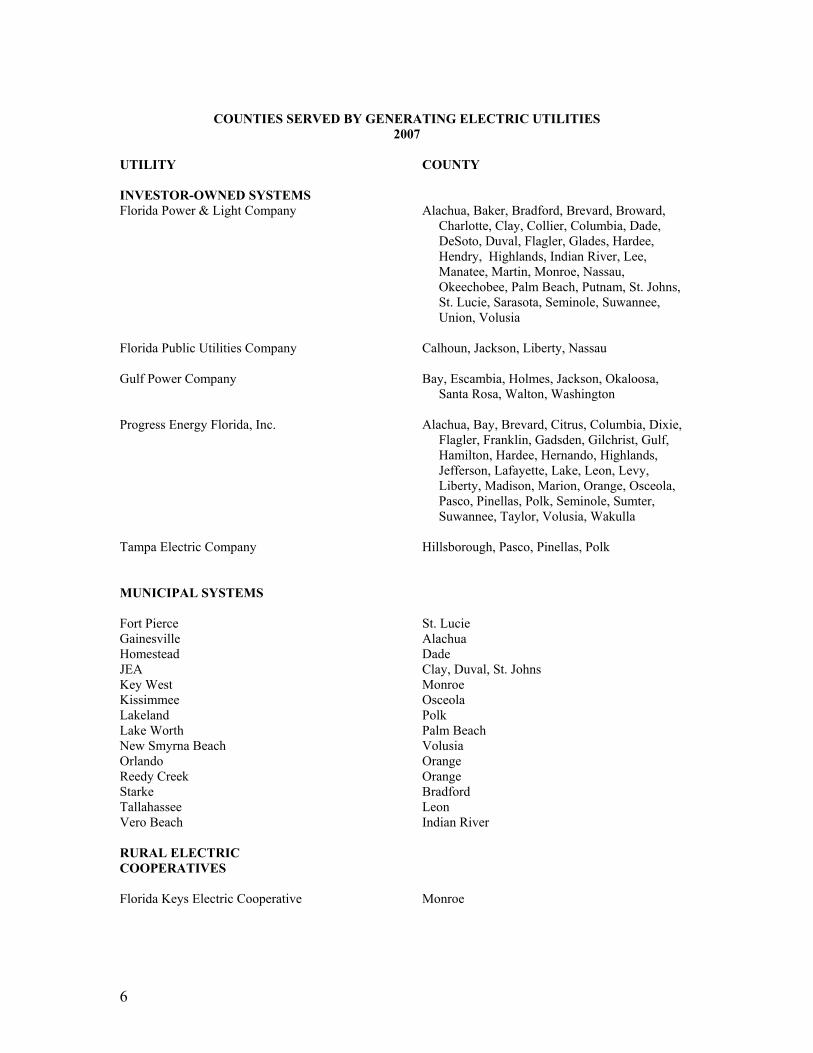
COUNTIES SERVED BY GENERATING ELECTRIC UTILITIES
2007 UTILITY
COUNTY
INVESTOR-OWNED SYSTEMS Florida Power & Light Company Florida Public Utilities Company Gulf Power Company Progress Energy Florida, Inc. Tampa Electric Company
Alachua, Baker, Bradford, Brevard, Broward, Charlotte, Clay, Collier, Columbia, Dade, DeSoto, Duval, Flagler, Glades, Hardee, Hendry, Highlands, Indian River, Lee, Manatee, Martin, Monroe, Nassau, Okeechobee, Palm Beach, Putnam, St. Johns, St. Lucie, Sarasota, Seminole, Suwannee, Union, Volusia Calhoun, Jackson, Liberty, Nassau Bay, Escambia, Holmes, Jackson, Okaloosa, Santa Rosa, Walton, Washington Alachua, Bay, Brevard, Citrus, Columbia, Dixie, Flagler, Franklin, Gadsden, Gilchrist, Gulf, Hamilton, Hardee, Hernando, Highlands, Jefferson, Lafayette, Lake, Leon, Levy, Liberty, Madison, Marion, Orange, Osceola, Pasco, Pinellas, Polk, Seminole, Sumter, Suwannee, Taylor, Volusia, Wakulla Hillsborough, Pasco, Pinellas, Polk
MUNICIPAL SYSTEMS
Fort Pierce Gainesville Homestead JEA Key West Kissimmee Lakeland Lake Worth New Smyrna Beach Orlando Reedy Creek Starke Tallahassee Vero Beach
St. Lucie Alachua Dade Clay, Duval, St. Johns Monroe Osceola Polk Palm Beach Volusia Orange Orange Bradford Leon Indian River
RURAL ELECTRIC COOPERATIVES
Florida Keys Electric Cooperative
Monroe
7
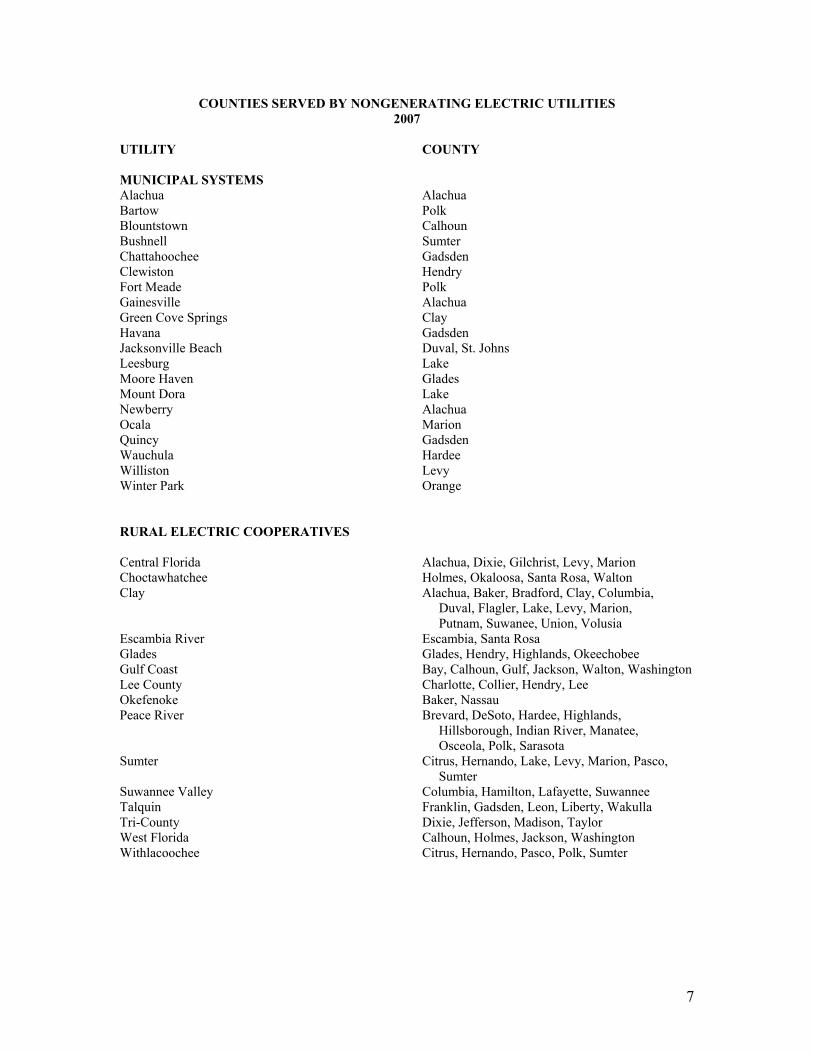
COUNTIES SERVED BY NONGENERATING ELECTRIC UTILITIES 2007
UTILITY MUNICIPAL SYSTEMS Alachua Bartow Blountstown Bushnell Chattahoochee Clewiston Fort Meade Gainesville Green Cove Springs Havana Jacksonville Beach Leesburg Moore Haven Mount Dora Newberry Ocala Quincy Wauchula Williston Winter Park
COUNTY Alachua Polk Calhoun Sumter Gadsden Hendry Polk Alachua Clay Gadsden Duval, St. Johns Lake Glades Lake Alachua Marion Gadsden Hardee Levy Orange
RURAL ELECTRIC COOPERATIVES Central Florida Choctawhatchee Clay Escambia River Glades Gulf Coast Lee County Okefenoke Peace River Sumter Suwannee Valley Talquin Tri-County West Florida Withlacoochee
Alachua, Dixie, Gilchrist, Levy, Marion Holmes, Okaloosa, Santa Rosa, Walton Alachua, Baker, Bradford, Clay, Columbia, Duval, Flagler, Lake, Levy, Marion, Putnam, Suwanee, Union, Volusia Escambia, Santa Rosa Glades, Hendry, Highlands, Okeechobee Bay, Calhoun, Gulf, Jackson, Walton, Washington Charlotte, Collier, Hendry, Lee Baker, Nassau Brevard, DeSoto, Hardee, Highlands, Hillsborough, Indian River, Manatee, Osceola, Polk, Sarasota Citrus, Hernando, Lake, Levy, Marion, Pasco, Sumter Columbia, Hamilton, Lafayette, Suwannee Franklin, Gadsden, Leon, Liberty, Wakulla Dixie, Jefferson, Madison, Taylor Calhoun, Holmes, Jackson, Washington Citrus, Hernando, Pasco, Polk, Sumter

SUMMARY OF FINANCIAL STATISTICS FORINVESTOR-OWNED UTILITIES (IOUs)

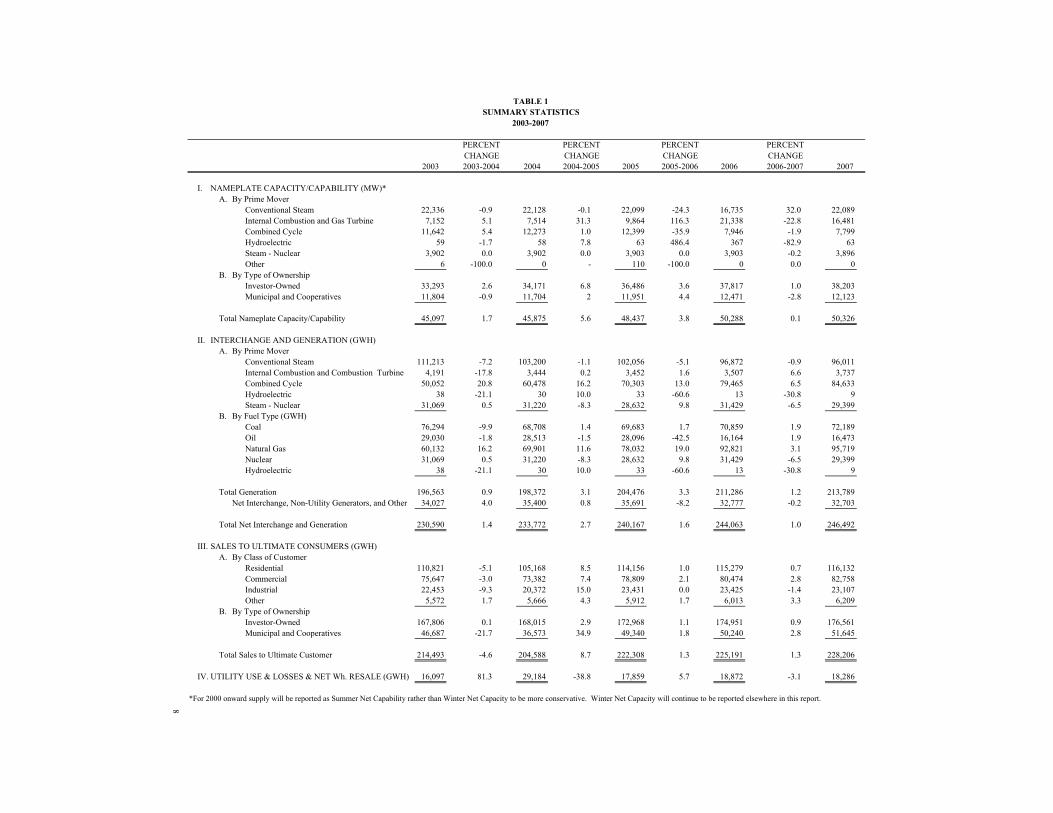
TABLE 1SUMMARY STATISTICS
2003-2007
PERCENT PERCENT PERCENT PERCENTCHANGE CHANGE CHANGE CHANGE
2003 2003-2004 2004 2004-2005 2005 2005-2006 2006 2006-2007 2007
I. NAMEPLATE CAPACITY/CAPABILITY (MW)*A. By Prime Mover
Conventional Steam 22,336 -0.9 22,128 -0.1 22,099 -24.3 16,735 32.0 22,089Internal Combustion and Gas Turbine 7,152 5.1 7,514 31.3 9,864 116.3 21,338 -22.8 16,481Combined Cycle 11,642 5.4 12,273 1.0 12,399 -35.9 7,946 -1.9 7,799Hydroelectric 59 -1.7 58 7.8 63 486.4 367 -82.9 63Steam - Nuclear 3,902 0.0 3,902 0.0 3,903 0.0 3,903 -0.2 3,896Other 6 -100.0 0 - 110 -100.0 0 0.0 0
B. By Type of OwnershipInvestor-Owned 33,293 2.6 34,171 6.8 36,486 3.6 37,817 1.0 38,203Municipal and Cooperatives 11,804 -0.9 11,704 2 11,951 4.4 12,471 -2.8 12,123
Total Nameplate Capacity/Capability 45,097 1.7 45,875 5.6 48,437 3.8 50,288 0.1 50,326
II. INTERCHANGE AND GENERATION (GWH)A. By Prime Mover
Conventional Steam 111,213 -7.2 103,200 -1.1 102,056 -5.1 96,872 -0.9 96,011Internal Combustion and Combustion Turbine 4,191 -17.8 3,444 0.2 3,452 1.6 3,507 6.6 3,737 Combined Cycle 50,052 20.8 60,478 16.2 70,303 13.0 79,465 6.5 84,633 Hydroelectric 38 -21.1 30 10.0 33 -60.6 13 -30.8 9Steam - Nuclear 31,069 0.5 31,220 -8.3 28,632 9.8 31,429 -6.5 29,399
B. By Fuel Type (GWH)Coal 76,294 -9.9 68,708 1.4 69,683 1.7 70,859 1.9 72,189Oil 29,030 -1.8 28,513 -1.5 28,096 -42.5 16,164 1.9 16,473Natural Gas 60,132 16.2 69,901 11.6 78,032 19.0 92,821 3.1 95,719Nuclear 31,069 0.5 31,220 -8.3 28,632 9.8 31,429 -6.5 29,399Hydroelectric 38 -21.1 30 10.0 33 -60.6 13 -30.8 9
Total Generation 196,563 0.9 198,372 3.1 204,476 3.3 211,286 1.2 213,789Net Interchange, Non-Utility Generators, and Other 34,027 4.0 35,400 0.8 35,691 -8.2 32,777 -0.2 32,703
Total Net Interchange and Generation 230,590 1.4 233,772 2.7 240,167 1.6 244,063 1.0 246,492
III. SALES TO ULTIMATE CONSUMERS (GWH)A. By Class of Customer
Residential 110,821 -5.1 105,168 8.5 114,156 1.0 115,279 0.7 116,132Commercial 75,647 -3.0 73,382 7.4 78,809 2.1 80,474 2.8 82,758Industrial 22,453 -9.3 20,372 15.0 23,431 0.0 23,425 -1.4 23,107Other 5,572 1.7 5,666 4.3 5,912 1.7 6,013 3.3 6,209
B. By Type of OwnershipInvestor-Owned 167,806 0.1 168,015 2.9 172,968 1.1 174,951 0.9 176,561Municipal and Cooperatives 46,687 -21.7 36,573 34.9 49,340 1.8 50,240 2.8 51,645
Total Sales to Ultimate Customer 214,493 -4.6 204,588 8.7 222,308 1.3 225,191 1.3 228,206
IV. UTILITY USE & LOSSES & NET Wh. RESALE (GWH) 16,097 81.3 29,184 -38.8 17,859 5.7 18,872 -3.1 18,286
*For 2000 onward supply will be reported as Summer Net Capability rather than Winter Net Capacity to be more conservative. Winter Net Capacity will continue to be reported elsewhere in this report.
8
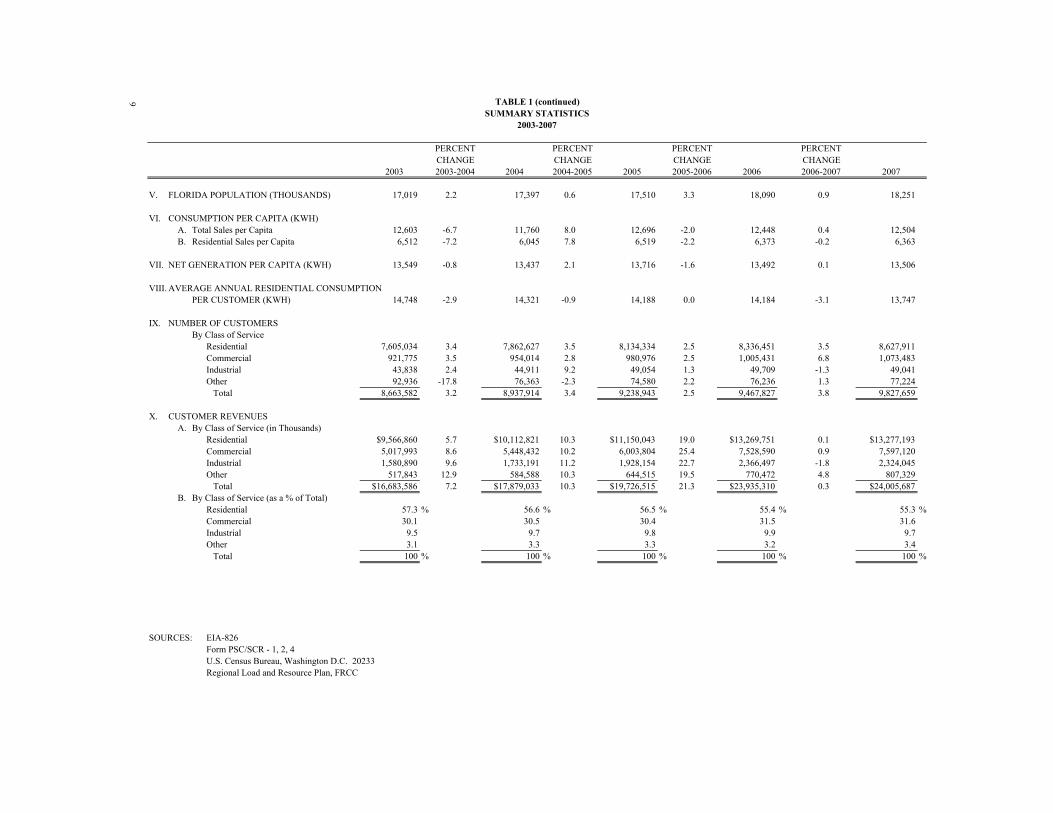
9 TABLE 1 (continued)SUMMARY STATISTICS
2003-2007
PERCENT PERCENT PERCENT PERCENTCHANGE CHANGE CHANGE CHANGE
2003 2003-2004 2004 2004-2005 2005 2005-2006 2006 2006-2007 2007
V. FLORIDA POPULATION (THOUSANDS) 17,019 2.2 17,397 0.6 17,510 3.3 18,090 0.9 18,251
VI. CONSUMPTION PER CAPITA (KWH)A. Total Sales per Capita 12,603 -6.7 11,760 8.0 12,696 -2.0 12,448 0.4 12,504B. Residential Sales per Capita 6,512 -7.2 6,045 7.8 6,519 -2.2 6,373 -0.2 6,363
VII. NET GENERATION PER CAPITA (KWH) 13,549 -0.8 13,437 2.1 13,716 -1.6 13,492 0.1 13,506
VIII. AVERAGE ANNUAL RESIDENTIAL CONSUMPTIONPER CUSTOMER (KWH) 14,748 -2.9 14,321 -0.9 14,188 0.0 14,184 -3.1 13,747
IX. NUMBER OF CUSTOMERSBy Class of Service
Residential 7,605,034 3.4 7,862,627 3.5 8,134,334 2.5 8,336,451 3.5 8,627,911Commercial 921,775 3.5 954,014 2.8 980,976 2.5 1,005,431 6.8 1,073,483Industrial 43,838 2.4 44,911 9.2 49,054 1.3 49,709 -1.3 49,041Other 92,936 -17.8 76,363 -2.3 74,580 2.2 76,236 1.3 77,224 Total 8,663,582 3.2 8,937,914 3.4 9,238,943 2.5 9,467,827 3.8 9,827,659
X. CUSTOMER REVENUESA. By Class of Service (in Thousands)
Residential $9,566,860 5.7 $10,112,821 10.3 $11,150,043 19.0 $13,269,751 0.1 $13,277,193Commercial 5,017,993 8.6 5,448,432 10.2 6,003,804 25.4 7,528,590 0.9 7,597,120Industrial 1,580,890 9.6 1,733,191 11.2 1,928,154 22.7 2,366,497 -1.8 2,324,045Other 517,843 12.9 584,588 10.3 644,515 19.5 770,472 4.8 807,329 Total $16,683,586 7.2 $17,879,033 10.3 $19,726,515 21.3 $23,935,310 0.3 $24,005,687
B. By Class of Service (as a % of Total)Residential 57.3 % 56.6 % 56.5 % 55.4 % 55.3 %Commercial 30.1 30.5 30.4 31.5 31.6Industrial 9.5 9.7 9.8 9.9 9.7Other 3.1 3.3 3.3 3.2 3.4 Total 100 % 100 % 100 % 100 % 100 %
SOURCES: EIA-826Form PSC/SCR - 1, 2, 4U.S. Census Bureau, Washington D.C. 20233Regional Load and Resource Plan, FRCC
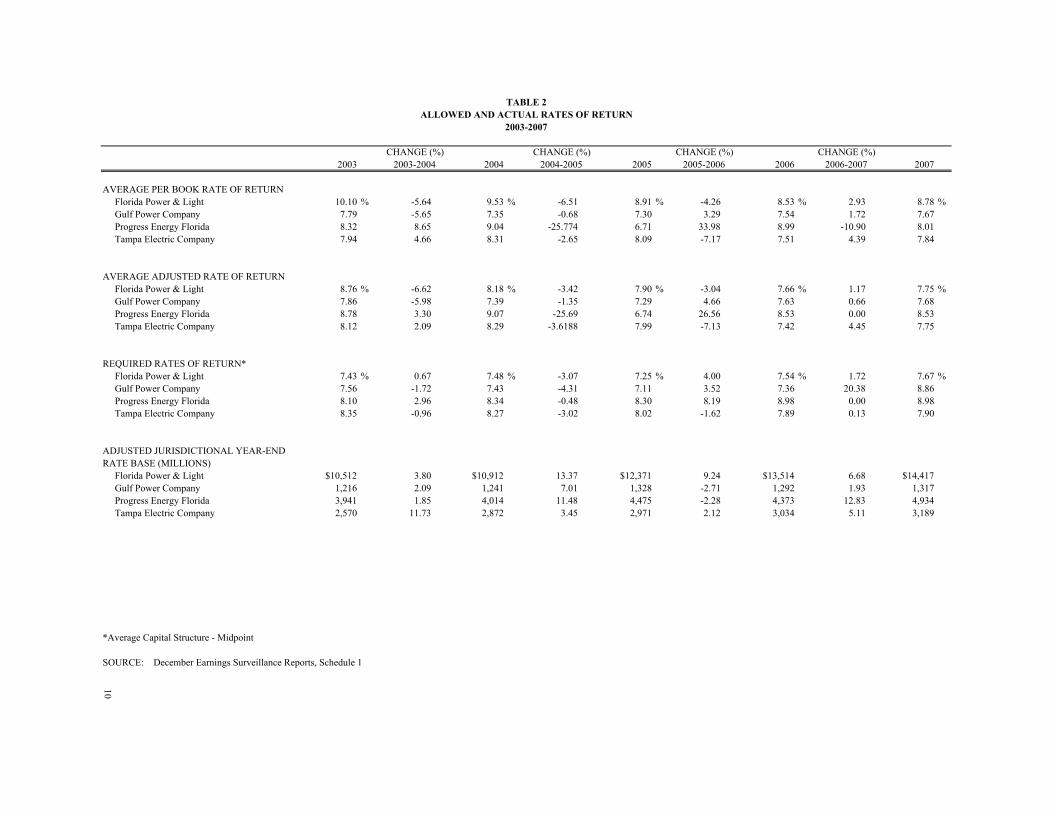
TABLE 2ALLOWED AND ACTUAL RATES OF RETURN
2003-2007
CHANGE (%) CHANGE (%) CHANGE (%) CHANGE (%)2003 2003-2004 2004 2004-2005 2005 2005-2006 2006 2006-2007 2007
AVERAGE PER BOOK RATE OF RETURN Florida Power & Light 10.10 % -5.64 9.53 % -6.51 8.91 % -4.26 8.53 % 2.93 8.78 % Gulf Power Company 7.79 -5.65 7.35 -0.68 7.30 3.29 7.54 1.72 7.67 Progress Energy Florida 8.32 8.65 9.04 -25.774 6.71 33.98 8.99 -10.90 8.01 Tampa Electric Company 7.94 4.66 8.31 -2.65 8.09 -7.17 7.51 4.39 7.84
AVERAGE ADJUSTED RATE OF RETURN Florida Power & Light 8.76 % -6.62 8.18 % -3.42 7.90 % -3.04 7.66 % 1.17 7.75 % Gulf Power Company 7.86 -5.98 7.39 -1.35 7.29 4.66 7.63 0.66 7.68 Progress Energy Florida 8.78 3.30 9.07 -25.69 6.74 26.56 8.53 0.00 8.53 Tampa Electric Company 8.12 2.09 8.29 -3.6188 7.99 -7.13 7.42 4.45 7.75
REQUIRED RATES OF RETURN* Florida Power & Light 7.43 % 0.67 7.48 % -3.07 7.25 % 4.00 7.54 % 1.72 7.67 % Gulf Power Company 7.56 -1.72 7.43 -4.31 7.11 3.52 7.36 20.38 8.86 Progress Energy Florida 8.10 2.96 8.34 -0.48 8.30 8.19 8.98 0.00 8.98 Tampa Electric Company 8.35 -0.96 8.27 -3.02 8.02 -1.62 7.89 0.13 7.90
ADJUSTED JURISDICTIONAL YEAR-END RATE BASE (MILLIONS) Florida Power & Light $10,512 3.80 $10,912 13.37 $12,371 9.24 $13,514 6.68 $14,417 Gulf Power Company 1,216 2.09 1,241 7.01 1,328 -2.71 1,292 1.93 1,317 Progress Energy Florida 3,941 1.85 4,014 11.48 4,475 -2.28 4,373 12.83 4,934 Tampa Electric Company 2,570 11.73 2,872 3.45 2,971 2.12 3,034 5.11 3,189
*Average Capital Structure - Midpoint
SOURCE: December Earnings Surveillance Reports, Schedule 1
10
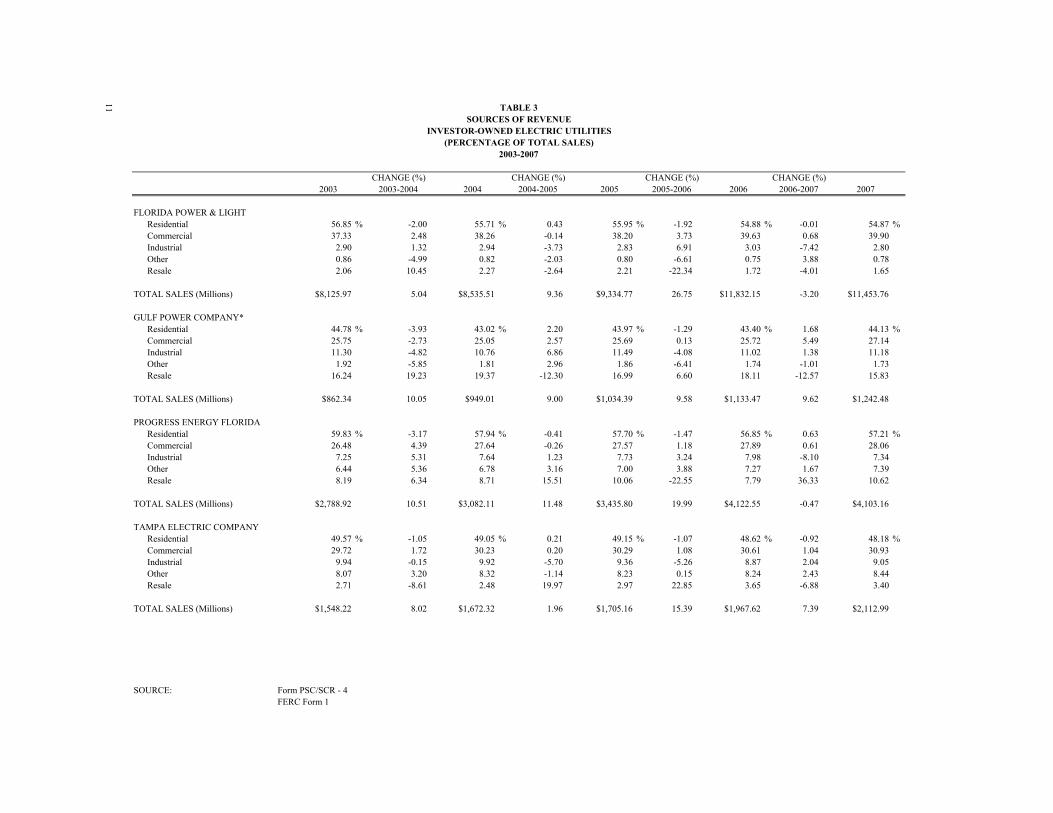
11 TABLE 3SOURCES OF REVENUE
INVESTOR-OWNED ELECTRIC UTILITIES(PERCENTAGE OF TOTAL SALES)
2003-2007
CHANGE (%) CHANGE (%) CHANGE (%) CHANGE (%)2003 2003-2004 2004 2004-2005 2005 2005-2006 2006 2006-2007 2007
FLORIDA POWER & LIGHT Residential 56.85 % -2.00 55.71 % 0.43 55.95 % -1.92 54.88 % -0.01 54.87 % Commercial 37.33 2.48 38.26 -0.14 38.20 3.73 39.63 0.68 39.90 Industrial 2.90 1.32 2.94 -3.73 2.83 6.91 3.03 -7.42 2.80 Other 0.86 -4.99 0.82 -2.03 0.80 -6.61 0.75 3.88 0.78 Resale 2.06 10.45 2.27 -2.64 2.21 -22.34 1.72 -4.01 1.65
TOTAL SALES (Millions) $8,125.97 5.04 $8,535.51 9.36 $9,334.77 26.75 $11,832.15 -3.20 $11,453.76
GULF POWER COMPANY* Residential 44.78 % -3.93 43.02 % 2.20 43.97 % -1.29 43.40 % 1.68 44.13 % Commercial 25.75 -2.73 25.05 2.57 25.69 0.13 25.72 5.49 27.14 Industrial 11.30 -4.82 10.76 6.86 11.49 -4.08 11.02 1.38 11.18 Other 1.92 -5.85 1.81 2.96 1.86 -6.41 1.74 -1.01 1.73 Resale 16.24 19.23 19.37 -12.30 16.99 6.60 18.11 -12.57 15.83
TOTAL SALES (Millions) $862.34 10.05 $949.01 9.00 $1,034.39 9.58 $1,133.47 9.62 $1,242.48
PROGRESS ENERGY FLORIDA Residential 59.83 % -3.17 57.94 % -0.41 57.70 % -1.47 56.85 % 0.63 57.21 % Commercial 26.48 4.39 27.64 -0.26 27.57 1.18 27.89 0.61 28.06 Industrial 7.25 5.31 7.64 1.23 7.73 3.24 7.98 -8.10 7.34 Other 6.44 5.36 6.78 3.16 7.00 3.88 7.27 1.67 7.39 Resale 8.19 6.34 8.71 15.51 10.06 -22.55 7.79 36.33 10.62
TOTAL SALES (Millions) $2,788.92 10.51 $3,082.11 11.48 $3,435.80 19.99 $4,122.55 -0.47 $4,103.16
TAMPA ELECTRIC COMPANY Residential 49.57 % -1.05 49.05 % 0.21 49.15 % -1.07 48.62 % -0.92 48.18 % Commercial 29.72 1.72 30.23 0.20 30.29 1.08 30.61 1.04 30.93 Industrial 9.94 -0.15 9.92 -5.70 9.36 -5.26 8.87 2.04 9.05 Other 8.07 3.20 8.32 -1.14 8.23 0.15 8.24 2.43 8.44 Resale 2.71 -8.61 2.48 19.97 2.97 22.85 3.65 -6.88 3.40
TOTAL SALES (Millions) $1,548.22 8.02 $1,672.32 1.96 $1,705.16 15.39 $1,967.62 7.39 $2,112.99
SOURCE: Form PSC/SCR - 4FERC Form 1
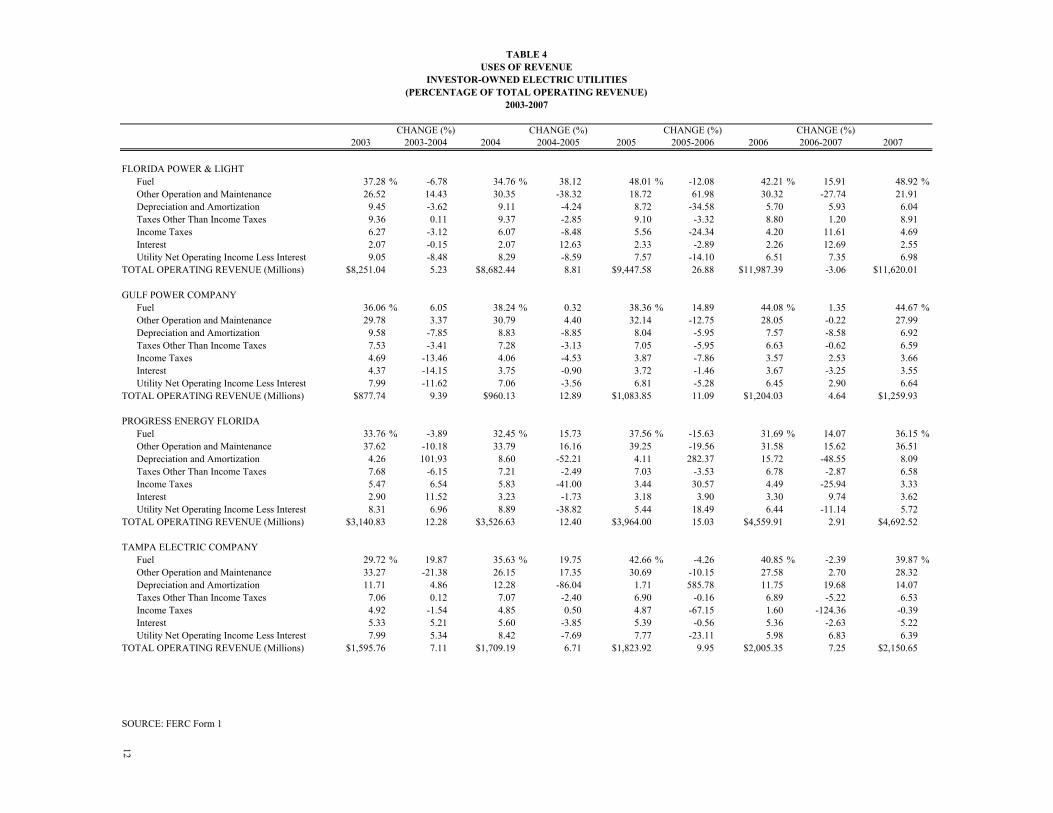
TABLE 4USES OF REVENUE
INVESTOR-OWNED ELECTRIC UTILITIES(PERCENTAGE OF TOTAL OPERATING REVENUE)
2003-2007
CHANGE (%) CHANGE (%) CHANGE (%) CHANGE (%)2003 2004 2005 2006 2006-2007 2007
FLORIDA POWER & LIGHT Fuel 37.28 % -6.78 34.76 % 38.12 48.01 % -12.08 42.21 % 15.91 48.92 % Other Operation and Maintenance 26.52 14.43 30.35 -38.32 18.72 61.98 30.32 -27.74 21.91 Depreciation and Amortization 9.45 -3.62 9.11 -4.24 8.72 -34.58 5.70 5.93 6.04 Taxes Other Than Income Taxes 9.36 0.11 9.37 -2.85 9.10 -3.32 8.80 1.20 8.91 Income Taxes 6.27 -3.12 6.07 -8.48 5.56 -24.34 4.20 11.61 4.69 Interest 2.07 -0.15 2.07 12.63 2.33 -2.89 2.26 12.69 2.55 Utility Net Operating Income Less Interest 9.05 -8.48 8.29 -8.59 7.57 -14.10 6.51 7.35 6.98TOTAL OPERATING REVENUE (Millions) $8,251.04 5.23 $8,682.44 8.81 $9,447.58 26.88 $11,987.39 -3.06 $11,620.01
GULF POWER COMPANY Fuel 36.06 % 6.05 38.24 % 0.32 38.36 % 14.89 44.08 % 1.35 44.67 % Other Operation and Maintenance 29.78 3.37 30.79 4.40 32.14 -12.75 28.05 -0.22 27.99 Depreciation and Amortization 9.58 -7.85 8.83 -8.85 8.04 -5.95 7.57 -8.58 6.92 Taxes Other Than Income Taxes 7.53 -3.41 7.28 -3.13 7.05 -5.95 6.63 -0.62 6.59 Income Taxes 4.69 -13.46 4.06 -4.53 3.87 -7.86 3.57 2.53 3.66 Interest 4.37 -14.15 3.75 -0.90 3.72 -1.46 3.67 -3.25 3.55 Utility Net Operating Income Less Interest 7.99 -11.62 7.06 -3.56 6.81 -5.28 6.45 2.90 6.64TOTAL OPERATING REVENUE (Millions) $877.74 9.39 $960.13 12.89 $1,083.85 11.09 $1,204.03 4.64 $1,259.93
PROGRESS ENERGY FLORIDA Fuel 33.76 % -3.89 32.45 % 15.73 37.56 % -15.63 31.69 % 14.07 36.15 % Other Operation and Maintenance 37.62 -10.18 33.79 16.16 39.25 -19.56 31.58 15.62 36.51 Depreciation and Amortization 4.26 101.93 8.60 -52.21 4.11 282.37 15.72 -48.55 8.09 Taxes Other Than Income Taxes 7.68 -6.15 7.21 -2.49 7.03 -3.53 6.78 -2.87 6.58 Income Taxes 5.47 6.54 5.83 -41.00 3.44 30.57 4.49 -25.94 3.33 Interest 2.90 11.52 3.23 -1.73 3.18 3.90 3.30 9.74 3.62 Utility Net Operating Income Less Interest 8.31 6.96 8.89 -38.82 5.44 18.49 6.44 -11.14 5.72TOTAL OPERATING REVENUE (Millions) $3,140.83 12.28 $3,526.63 12.40 $3,964.00 15.03 $4,559.91 2.91 $4,692.52
TAMPA ELECTRIC COMPANY Fuel 29.72 % 19.87 35.63 % 19.75 42.66 % -4.26 40.85 % -2.39 39.87 % Other Operation and Maintenance 33.27 -21.38 26.15 17.35 30.69 -10.15 27.58 2.70 28.32 Depreciation and Amortization 11.71 4.86 12.28 -86.04 1.71 585.78 11.75 19.68 14.07 Taxes Other Than Income Taxes 7.06 0.12 7.07 -2.40 6.90 -0.16 6.89 -5.22 6.53 Income Taxes 4.92 -1.54 4.85 0.50 4.87 -67.15 1.60 -124.36 -0.39 Interest 5.33 5.21 5.60 -3.85 5.39 -0.56 5.36 -2.63 5.22 Utility Net Operating Income Less Interest 7.99 5.34 8.42 -7.69 7.77 -23.11 5.98 6.83 6.39TOTAL OPERATING REVENUE (Millions) $1,595.76 7.11 $1,709.19 6.71 $1,823.92 9.95 $2,005.35 7.25 $2,150.65
SOURCE: FERC Form 1
12
2003-2004 2004-2005 2005-2006
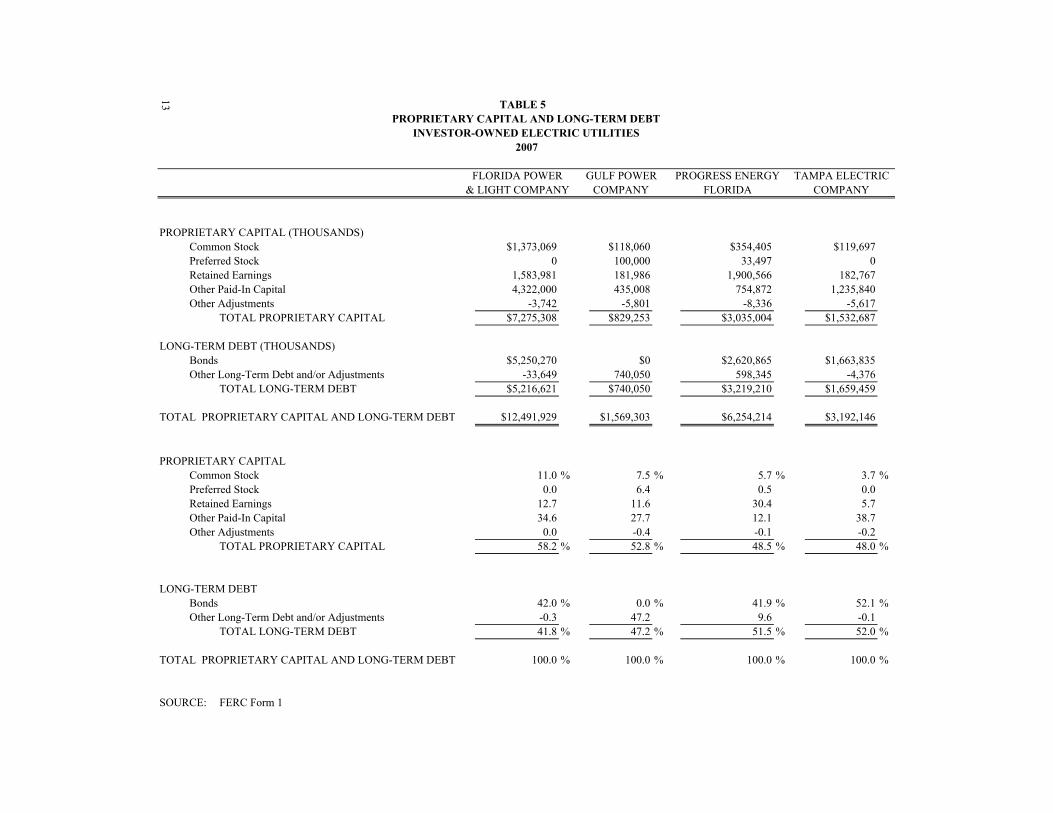
13 TABLE 5 PROPRIETARY CAPITAL AND LONG-TERM DEBT
INVESTOR-OWNED ELECTRIC UTILITIES2007
FLORIDA POWER GULF POWER PROGRESS ENERGY TAMPA ELECTRIC& LIGHT COMPANY COMPANY FLORIDA COMPANY
PROPRIETARY CAPITAL (THOUSANDS)Common Stock $1,373,069 $118,060 $354,405 $119,697Preferred Stock 0 100,000 33,497 0Retained Earnings 1,583,981 181,986 1,900,566 182,767Other Paid-In Capital 4,322,000 435,008 754,872 1,235,840Other Adjustments -3,742 -5,801 -8,336 -5,617
TOTAL PROPRIETARY CAPITAL $7,275,308 $829,253 $3,035,004 $1,532,687
LONG-TERM DEBT (THOUSANDS)Bonds $5,250,270 $0 $2,620,865 $1,663,835Other Long-Term Debt and/or Adjustments -33,649 740,050 598,345 -4,376
TOTAL LONG-TERM DEBT $5,216,621 $740,050 $3,219,210 $1,659,459
TOTAL PROPRIETARY CAPITAL AND LONG-TERM DEBT $12,491,929 $1,569,303 $6,254,214 $3,192,146
PROPRIETARY CAPITALCommon Stock 11.0 % 7.5 % 5.7 % 3.7 %Preferred Stock 0.0 6.4 0.5 0.0Retained Earnings 12.7 11.6 30.4 5.7Other Paid-In Capital 34.6 27.7 12.1 38.7Other Adjustments 0.0 -0.4 -0.1 -0.2
TOTAL PROPRIETARY CAPITAL 58.2 % 52.8 % 48.5 % 48.0 %
LONG-TERM DEBTBonds 42.0 % 0.0 % 41.9 % 52.1 %Other Long-Term Debt and/or Adjustments -0.3 47.2 9.6 -0.1
TOTAL LONG-TERM DEBT 41.8 % 47.2 % 51.5 % 52.0 %
TOTAL PROPRIETARY CAPITAL AND LONG-TERM DEBT 100.0 % 100.0 % 100.0 % 100.0 %
SOURCE: FERC Form 1
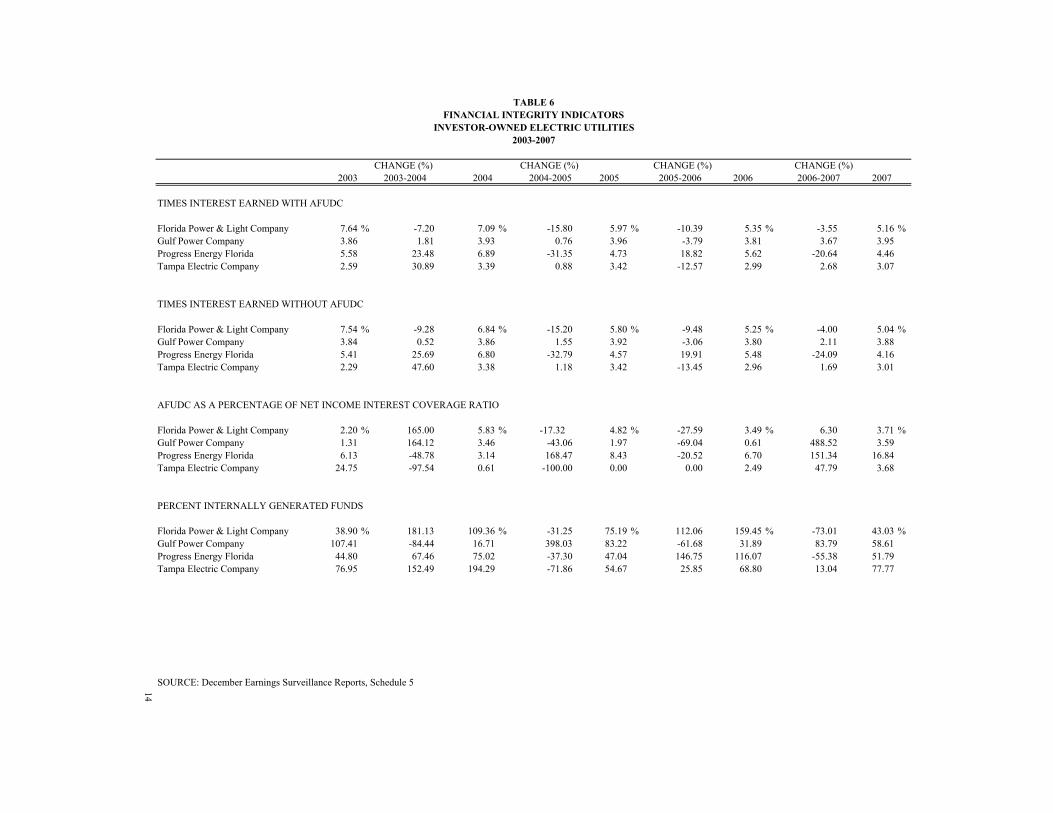
TABLE 6FINANCIAL INTEGRITY INDICATORS
INVESTOR-OWNED ELECTRIC UTILITIES2003-2007
CHANGE (%) CHANGE (%)2003 2003-2004 2004 2004-2005 2005 2005-2006 2006 2006-2007 2007
TIMES INTEREST EARNED WITH AFUDC
Florida Power & Light Company 7.64 % -7.20 7.09 % -15.80 5.97 % -10.39 5.35 % -3.55 5.16 %Gulf Power Company 3.86 1.81 3.93 0.76 3.96 -3.79 3.81 3.67 3.95Progress Energy Florida 5.58 23.48 6.89 -31.35 4.73 18.82 5.62 -20.64 4.46Tampa Electric Company 2.59 30.89 3.39 0.88 3.42 -12.57 2.99 2.68 3.07
TIMES INTEREST EARNED WITHOUT AFUDC
Florida Power & Light Company 7.54 % -9.28 6.84 % -15.20 5.80 % -9.48 5.25 % -4.00 5.04 %Gulf Power Company 3.84 0.52 3.86 1.55 3.92 -3.06 3.80 2.11 3.88Progress Energy Florida 5.41 25.69 6.80 -32.79 4.57 19.91 5.48 -24.09 4.16Tampa Electric Company 2.29 47.60 3.38 1.18 3.42 -13.45 2.96 1.69 3.01
AFUDC AS A PERCENTAGE OF NET INCOME INTEREST COVERAGE RATIO
Florida Power & Light Company 2.20 % 165.00 5.83 % -17.32 4.82 % -27.59 3.49 % 6.30 3.71 %Gulf Power Company 1.31 164.12 3.46 -43.06 1.97 -69.04 0.61 488.52 3.59Progress Energy Florida 6.13 -48.78 3.14 168.47 8.43 -20.52 6.70 151.34 16.84Tampa Electric Company 24.75 -97.54 0.61 -100.00 0.00 0.00 2.49 47.79 3.68
PERCENT INTERNALLY GENERATED FUNDS
Florida Power & Light Company 38.90 % 181.13 109.36 % -31.25 75.19 % 112.06 159.45 % -73.01 43.03 %Gulf Power Company 107.41 -84.44 16.71 398.03 83.22 -61.68 31.89 83.79 58.61Progress Energy Florida 44.80 67.46 75.02 -37.30 47.04 146.75 116.07 -55.38 51.79Tampa Electric Company 76.95 152.49 194.29 -71.86 54.67 25.85 68.80 13.04 77.77
SOURCE: December Earnings Surveillance Reports, Schedule 514
CHANGE (%) CHANGE (%)


NET GENERATION

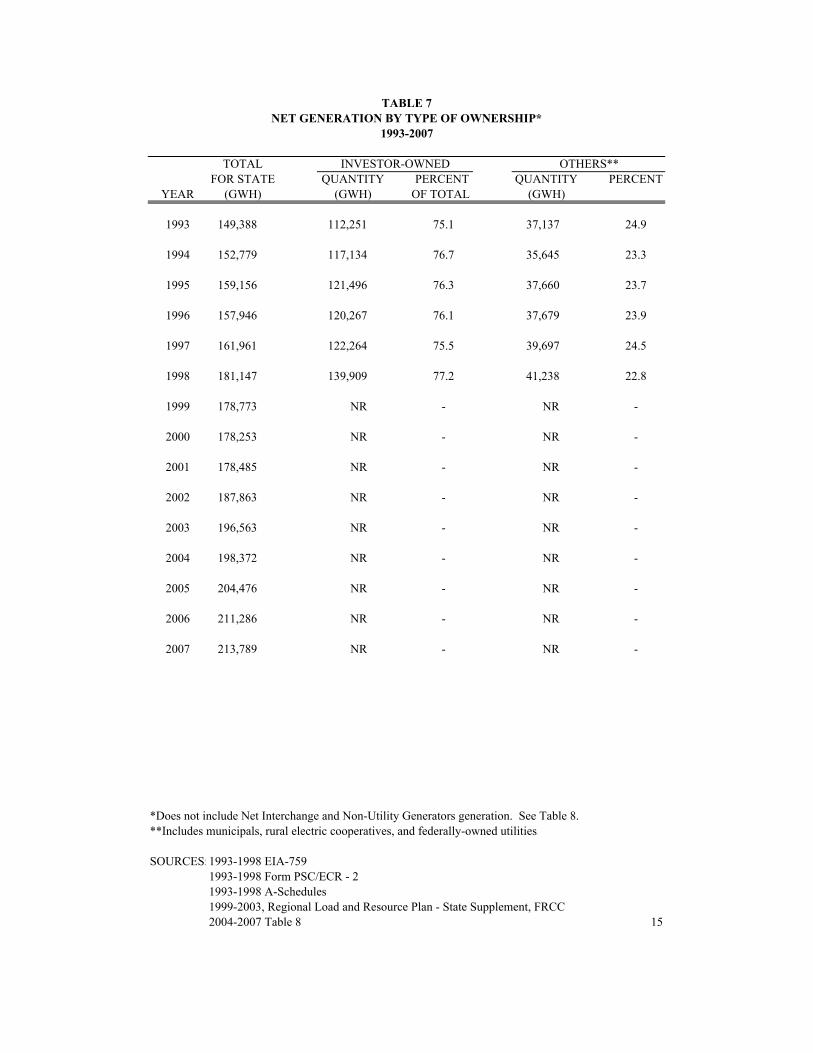
TABLE 7NET GENERATION BY TYPE OF OWNERSHIP*
1993-2007
TOTAL INVESTOR-OWNED OTHERS**FOR STATE QUANTITY PERCENT QUANTITY PERCENT
YEAR (GWH) (GWH) OF TOTAL (GWH)
1993 149,388 112,251 75.1 37,137 24.9
1994 152,779 117,134 76.7 35,645 23.3
1995 159,156 121,496 76.3 37,660 23.7
1996 157,946 120,267 76.1 37,679 23.9
1997 161,961 122,264 75.5 39,697 24.5
1998 181,147 139,909 77.2 41,238 22.8
1999 178,773 NR - NR -
2000 178,253 NR - NR -
2001 178,485 NR - NR -
2002 187,863 NR - NR -
2003 196,563 NR - NR -
2004 198,372 NR - NR -
2005 204,476 NR - NR -
2006 211,286 NR - NR -
2007 213,789 NR - NR -
*Does not include Net Interchange and Non-Utility Generators generation. See Table 8.**Includes municipals, rural electric cooperatives, and federally-owned utilities.
SOURCES:1993-1998 EIA-759 1993-1998 Form PSC/ECR - 21993-1998 A-Schedules1999-2003, Regional Load and Resource Plan - State Supplement, FRCC2004-2007 Table 8 15
16
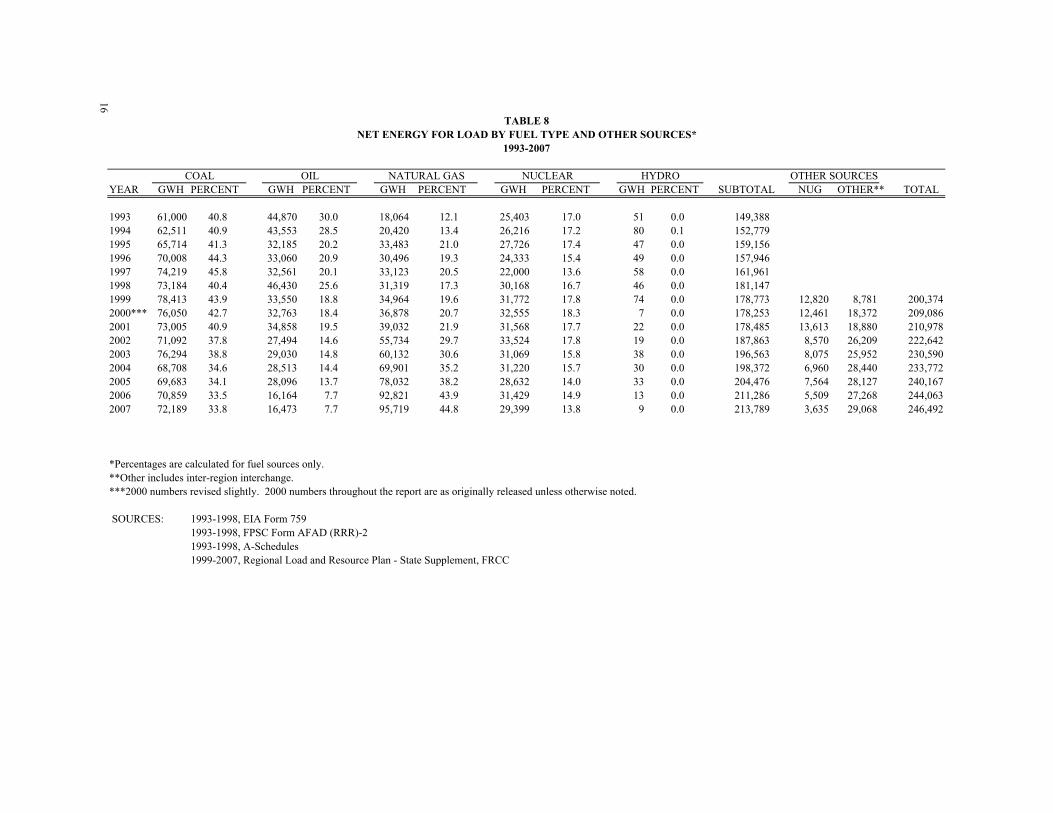
TABLE 8NET ENERGY FOR LOAD BY FUEL TYPE AND OTHER SOURCES*
1993-2007
COAL OIL NATURAL GAS NUCLEAR HYDRO OTHER SOURCESYEAR GWH PERCENT GWH PERCENT GWH PERCENT GWH PERCENT GWH PERCENT SUBTOTAL NUG OTHER** TOTAL
1993 61,000 40.8 44,870 30.0 18,064 12.1 25,403 17.0 51 0.0 149,3881994 62,511 40.9 43,553 28.5 20,420 13.4 26,216 17.2 80 0.1 152,7791995 65,714 41.3 32,185 20.2 33,483 21.0 27,726 17.4 47 0.0 159,1561996 70,008 44.3 33,060 20.9 30,496 19.3 24,333 15.4 49 0.0 157,9461997 74,219 45.8 32,561 20.1 33,123 20.5 22,000 13.6 58 0.0 161,9611998 73,184 40.4 46,430 25.6 31,319 17.3 30,168 16.7 46 0.0 181,1471999 78,413 43.9 33,550 18.8 34,964 19.6 31,772 17.8 74 0.0 178,773 12,820 8,781 200,3742000*** 76,050 42.7 32,763 18.4 36,878 20.7 32,555 18.3 7 0.0 178,253 12,461 18,372 209,0862001 73,005 40.9 34,858 19.5 39,032 21.9 31,568 17.7 22 0.0 178,485 13,613 18,880 210,9782002 71,092 37.8 27,494 14.6 55,734 29.7 33,524 17.8 19 0.0 187,863 8,570 26,209 222,6422003 76,294 38.8 29,030 14.8 60,132 30.6 31,069 15.8 38 0.0 196,563 8,075 25,952 230,5902004 68,708 34.6 28,513 14.4 69,901 35.2 31,220 15.7 30 0.0 198,372 6,960 28,440 233,7722005 69,683 34.1 28,096 13.7 78,032 38.2 28,632 14.0 33 0.0 204,476 7,564 28,127 240,1672006 70,859 33.5 16,164 7.7 92,821 43.9 31,429 14.9 13 0.0 211,286 5,509 27,268 244,0632007 72,189 33.8 16,473 7.7 95,719 44.8 29,399 13.8 9 0.0 213,789 3,635 29,068 246,492
*Percentages are calculated for fuel sources only.**Other includes inter-region interchange.***2000 numbers revised slightly. 2000 numbers throughout the report are as originally released unless otherwise noted.
SOURCES: 1993-1998, EIA Form 7591993-1998, FPSC Form AFAD (RRR)-21993-1998, A-Schedules 1999-2007, Regional Load and Resource Plan - State Supplement, FRCC
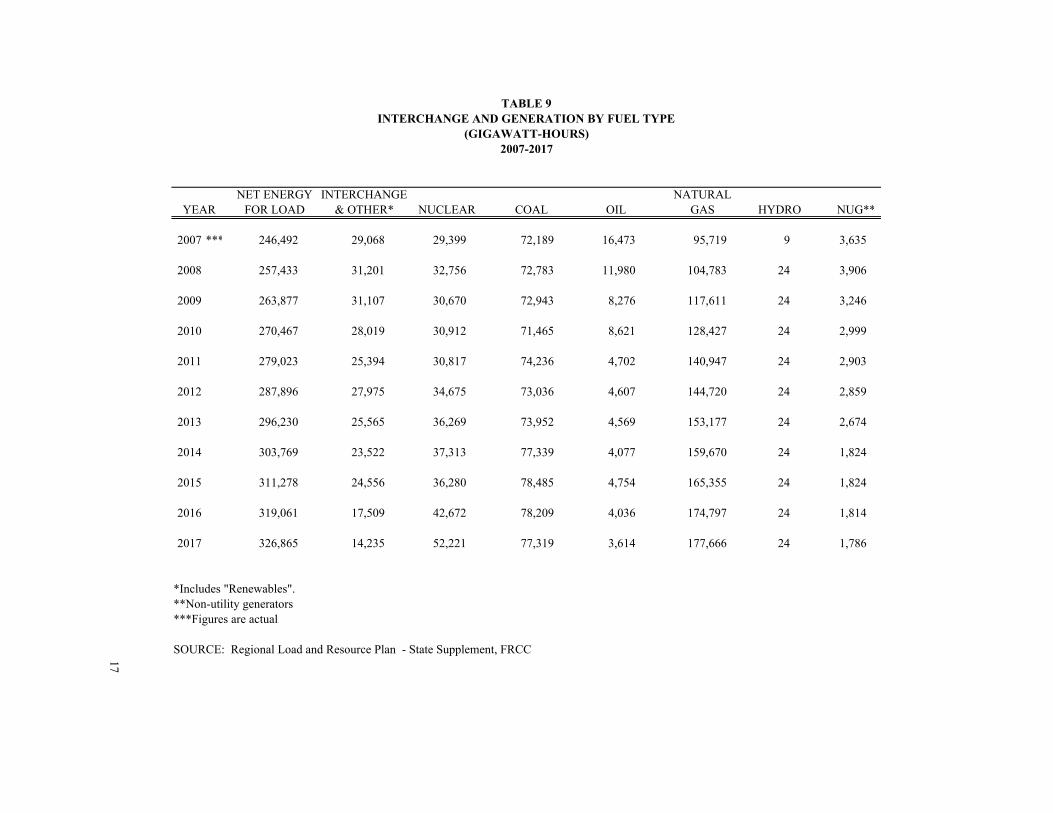
TABLE 9INTERCHANGE AND GENERATION BY FUEL TYPE
(GIGAWATT-HOURS)2007-2017
NET ENERGY INTERCHANGE NATURALYEAR FOR LOAD & OTHER* NUCLEAR COAL OIL GAS HYDRO NUG**
2007 *** 246,492 29,068 29,399 72,189 16,473 95,719 9 3,635
2008 257,433 31,201 32,756 72,783 11,980 104,783 24 3,906
2009 263,877 31,107 30,670 72,943 8,276 117,611 24 3,246
2010 270,467 28,019 30,912 71,465 8,621 128,427 24 2,999
2011 279,023 25,394 30,817 74,236 4,702 140,947 24 2,903
2012 287,896 27,975 34,675 73,036 4,607 144,720 24 2,859
2013 296,230 25,565 36,269 73,952 4,569 153,177 24 2,674
2014 303,769 23,522 37,313 77,339 4,077 159,670 24 1,824
2015 311,278 24,556 36,280 78,485 4,754 165,355 24 1,824
2016 319,061 17,509 42,672 78,209 4,036 174,797 24 1,814
2017 326,865 14,235 52,221 77,319 3,614 177,666 24 1,786
*Includes "Renewables".**Non-utility generators.***Figures are actual.
SOURCE: Regional Load and Resource Plan - State Supplement, FRCC17
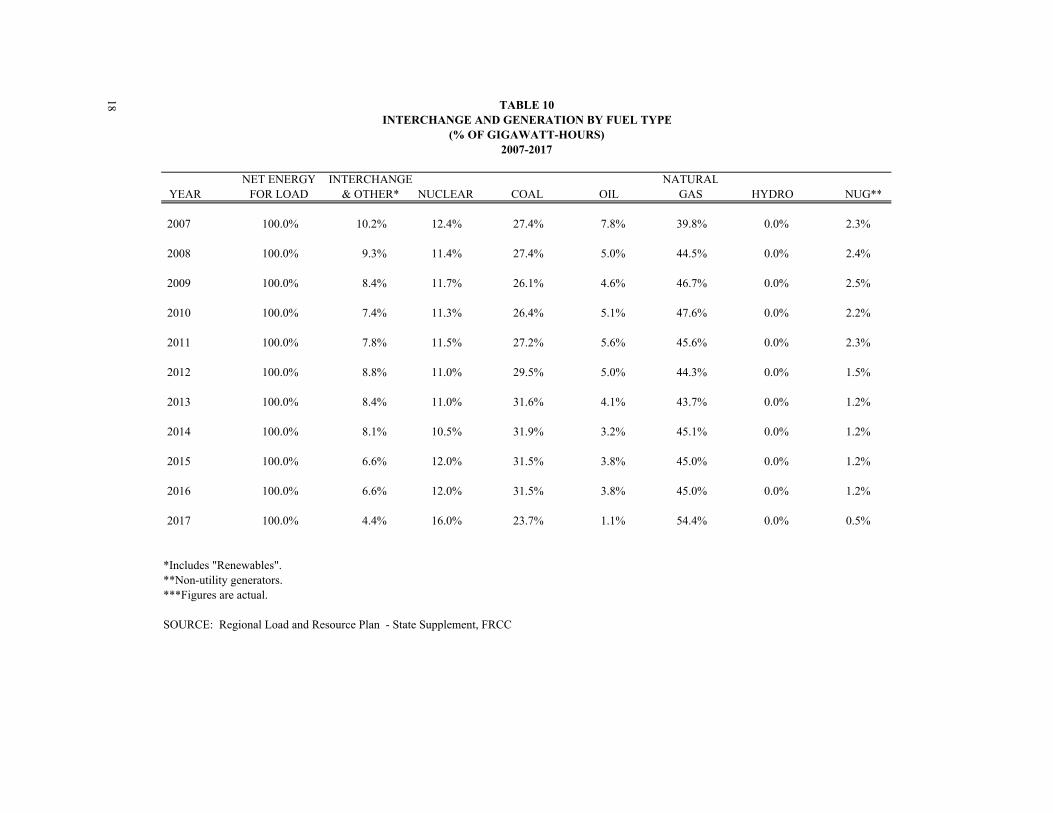
18 TABLE 10INTERCHANGE AND GENERATION BY FUEL TYPE
(% OF GIGAWATT-HOURS)2007-2017
NET ENERGY INTERCHANGE NATURALYEAR FOR LOAD & OTHER* NUCLEAR COAL OIL GAS HYDRO NUG**
2007 100.0% 10.2% 12.4% 27.4% 7.8% 39.8% 0.0% 2.3%
2008 100.0% 9.3% 11.4% 27.4% 5.0% 44.5% 0.0% 2.4%
2009 100.0% 8.4% 11.7% 26.1% 4.6% 46.7% 0.0% 2.5%
2010 100.0% 7.4% 11.3% 26.4% 5.1% 47.6% 0.0% 2.2%
2011 100.0% 7.8% 11.5% 27.2% 5.6% 45.6% 0.0% 2.3%
2012 100.0% 8.8% 11.0% 29.5% 5.0% 44.3% 0.0% 1.5%
2013 100.0% 8.4% 11.0% 31.6% 4.1% 43.7% 0.0% 1.2%
2014 100.0% 8.1% 10.5% 31.9% 3.2% 45.1% 0.0% 1.2%
2015 100.0% 6.6% 12.0% 31.5% 3.8% 45.0% 0.0% 1.2%
2016 100.0% 6.6% 12.0% 31.5% 3.8% 45.0% 0.0% 1.2%
2017 100.0% 4.4% 16.0% 23.7% 1.1% 54.4% 0.0% 0.5%
*Includes "Renewables".**Non-utility generators.***Figures are actual.
SOURCE: Regional Load and Resource Plan - State Supplement, FRCC
GENERATING CAPACITY AND CAPABILITY

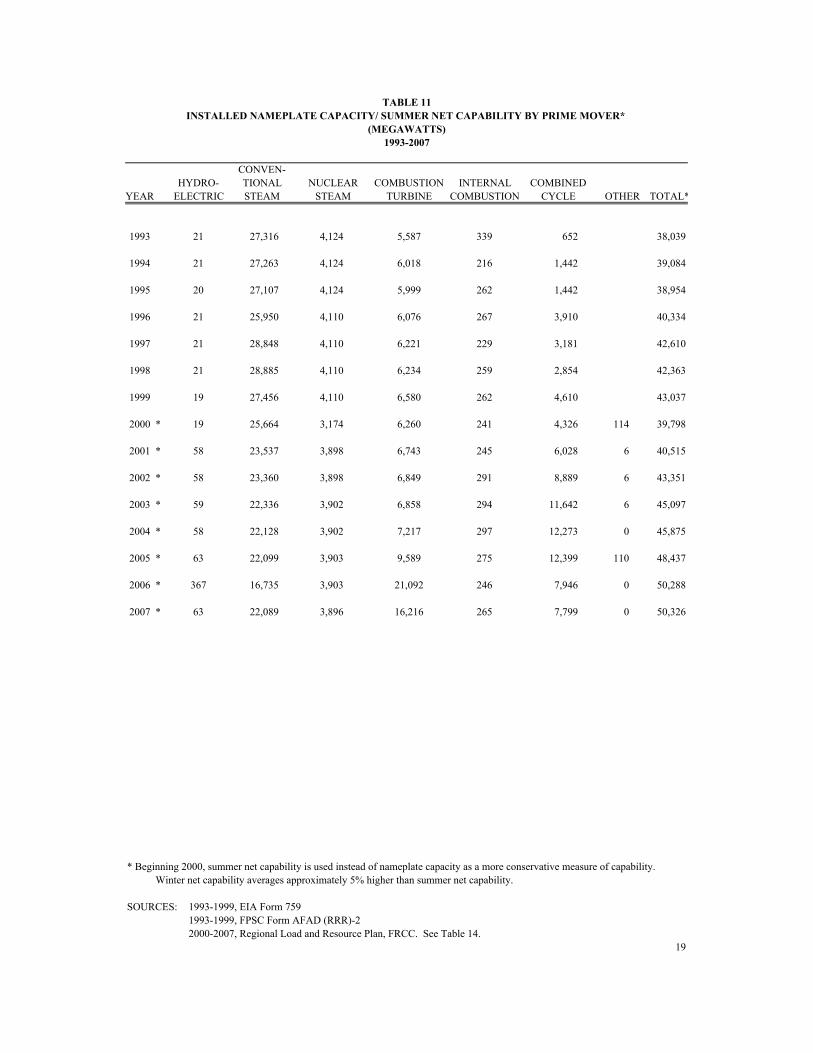
TABLE 11INSTALLED NAMEPLATE CAPACITY/ SUMMER NET CAPABILITY BY PRIME MOVER*
(MEGAWATTS)1993-2007
CONVEN-HYDRO- TIONAL NUCLEAR COMBUSTION INTERNAL COMBINED
YEAR ELECTRIC STEAM STEAM TURBINE COMBUSTION CYCLE OTHER TOTAL*
1993 21 27,316 4,124 5,587 339 652 38,039
1994 21 27,263 4,124 6,018 216 1,442 39,084
1995 20 27,107 4,124 5,999 262 1,442 38,954
1996 21 25,950 4,110 6,076 267 3,910 40,334
1997 21 28,848 4,110 6,221 229 3,181 42,610
1998 21 28,885 4,110 6,234 259 2,854 42,363
1999 19 27,456 4,110 6,580 262 4,610 43,037
2000 * 19 25,664 3,174 6,260 241 4,326 114 39,798
2001 * 58 23,537 3,898 6,743 245 6,028 6 40,515
2002 * 58 23,360 3,898 6,849 291 8,889 6 43,351
2003 * 59 22,336 3,902 6,858 294 11,642 6 45,097
2004 * 58 22,128 3,902 7,217 297 12,273 0 45,875
2005 * 63 22,099 3,903 9,589 275 12,399 110 48,437
2006 * 367 16,735 3,903 21,092 246 7,946 0 50,288
2007 * 63 22,089 3,896 16,216 265 7,799 0 50,326
* Beginning 2000, summer net capability is used instead of nameplate capacity as a more conservative measure of capability. Winter net capability averages approximately 5% higher than summer net capability.
SOURCES: 1993-1999, EIA Form 759 1993-1999, FPSC Form AFAD (RRR)-2 2000-2007, Regional Load and Resource Plan, FRCC. See Table 14.
19
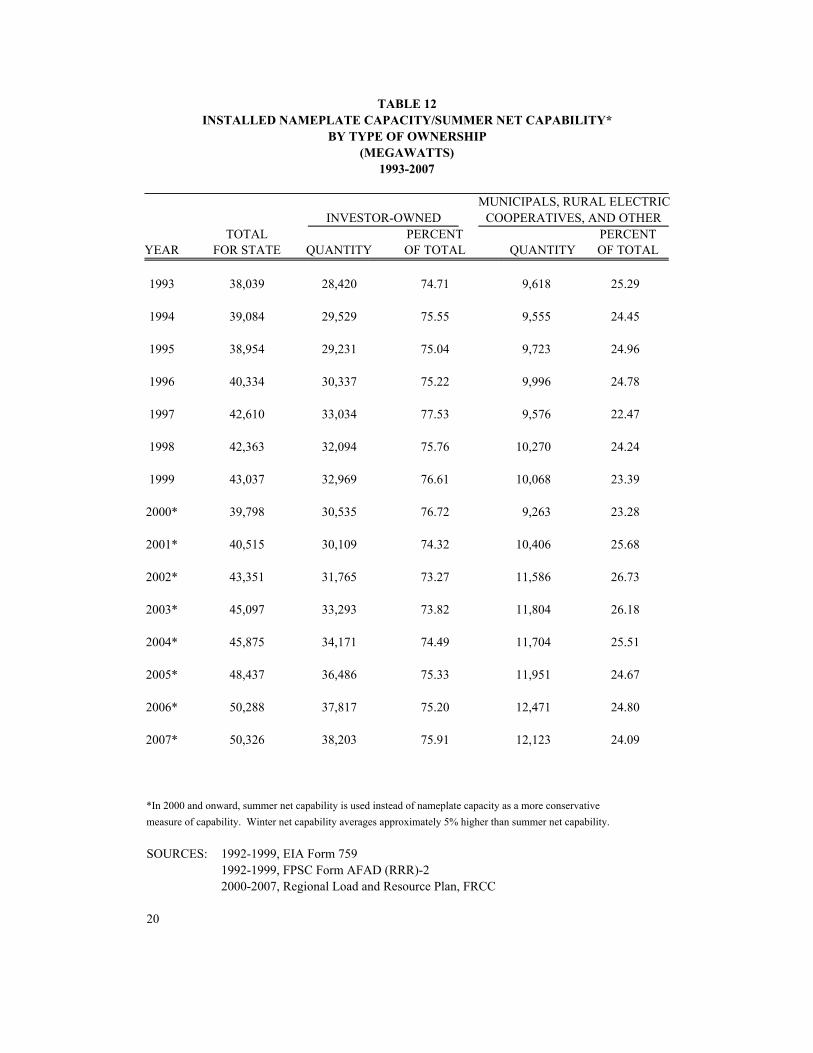
TABLE 12INSTALLED NAMEPLATE CAPACITY/SUMMER NET CAPABILITY*
BY TYPE OF OWNERSHIP(MEGAWATTS)
1993-2007
MUNICIPALS, RURAL ELECTRICINVESTOR-OWNED COOPERATIVES, AND OTHER
TOTAL PERCENT PERCENTYEAR FOR STATE QUANTITY OF TOTAL QUANTITY OF TOTAL
1993 38,039 28,420 74.71 9,618 25.29
1994 39,084 29,529 75.55 9,555 24.45
1995 38,954 29,231 75.04 9,723 24.96
1996 40,334 30,337 75.22 9,996 24.78
1997 42,610 33,034 77.53 9,576 22.47
1998 42,363 32,094 75.76 10,270 24.24
1999 43,037 32,969 76.61 10,068 23.39
2000* 39,798 30,535 76.72 9,263 23.28
2001* 40,515 30,109 74.32 10,406 25.68
2002* 43,351 31,765 73.27 11,586 26.73
2003* 45,097 33,293 73.82 11,804 26.18
2004* 45,875 34,171 74.49 11,704 25.51
2005* 48,437 36,486 75.33 11,951 24.67
2006* 50,288 37,817 75.20 12,471 24.80
2007* 50,326 38,203 75.91 12,123 24.09
*In 2000 and onward, summer net capability is used instead of nameplate capacity as a more conservative measure of capability. Winter net capability averages approximately 5% higher than summer net capability.
SOURCES: 1992-1999, EIA Form 7591992-1999, FPSC Form AFAD (RRR)-22000-2007, Regional Load and Resource Plan, FRCC
20
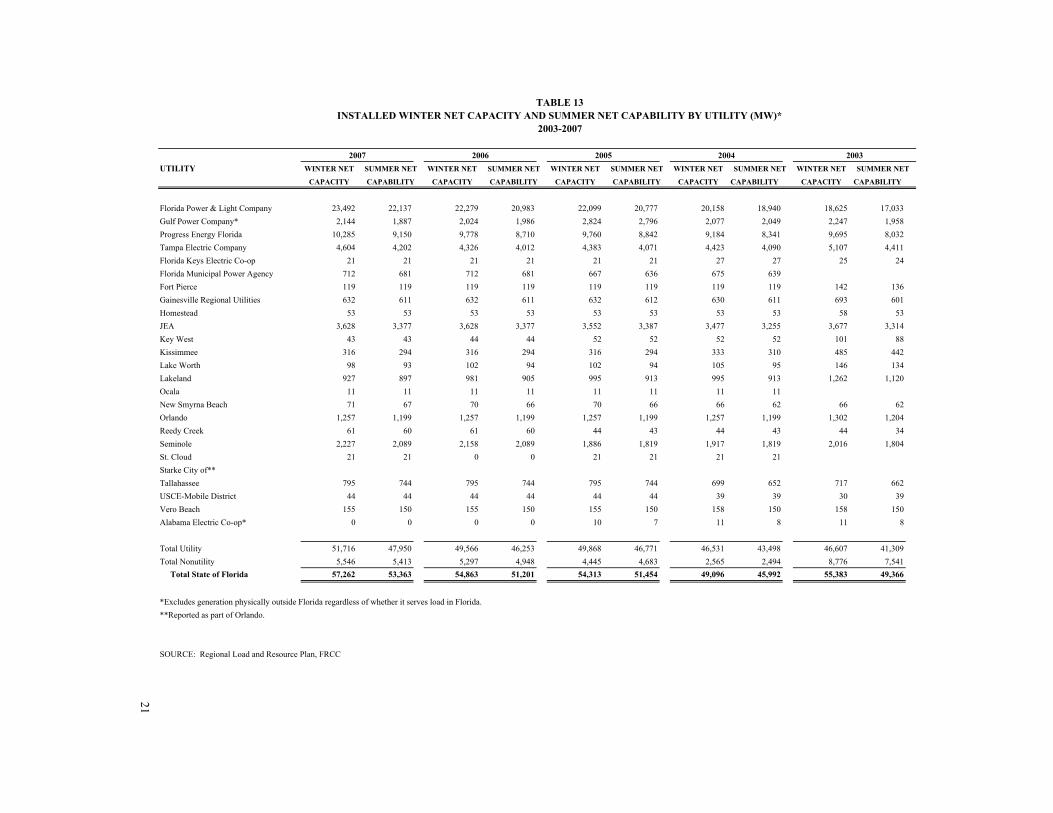
TABLE 13INSTALLED WINTER NET CAPACITY AND SUMMER NET CAPABILITY BY UTILITY (MW)*
2003-2007
2007 2006 2005 2004 2003UTILITY WINTER NET SUMMER NET WINTER NET SUMMER NET WINTER NET SUMMER NET WINTER NET SUMMER NET WINTER NET SUMMER NET
CAPACITY CAPABILITY CAPACITY CAPABILITY CAPACITY CAPABILITY CAPACITY CAPABILITY CAPACITY CAPABILITY
Florida Power & Light Company 23,492 22,137 22,279 20,983 22,099 20,777 20,158 18,940 18,625 17,033Gulf Power Company* 2,144 1,887 2,024 1,986 2,824 2,796 2,077 2,049 2,247 1,958Progress Energy Florida 10,285 9,150 9,778 8,710 9,760 8,842 9,184 8,341 9,695 8,032Tampa Electric Company 4,604 4,202 4,326 4,012 4,383 4,071 4,423 4,090 5,107 4,411Florida Keys Electric Co-op 21 21 21 21 21 21 27 27 25 24Florida Municipal Power Agency 712 681 712 681 667 636 675 639Fort Pierce 119 119 119 119 119 119 119 119 142 136Gainesville Regional Utilities 632 611 632 611 632 612 630 611 693 601Homestead 53 53 53 53 53 53 53 53 58 53JEA 3,628 3,377 3,628 3,377 3,552 3,387 3,477 3,255 3,677 3,314Key West 43 43 44 44 52 52 52 52 101 88Kissimmee 316 294 316 294 316 294 333 310 485 442Lake Worth 98 93 102 94 102 94 105 95 146 134Lakeland 927 897 981 905 995 913 995 913 1,262 1,120Ocala 11 11 11 11 11 11 11 11New Smyrna Beach 71 67 70 66 70 66 66 62 66 62Orlando 1,257 1,199 1,257 1,199 1,257 1,199 1,257 1,199 1,302 1,204Reedy Creek 61 60 61 60 44 43 44 43 44 34Seminole 2,227 2,089 2,158 2,089 1,886 1,819 1,917 1,819 2,016 1,804St. Cloud 21 21 0 0 21 21 21 21Starke City of**Tallahassee 795 744 795 744 795 744 699 652 717 662USCE-Mobile District 44 44 44 44 44 44 39 39 30 39Vero Beach 155 150 155 150 155 150 158 150 158 150Alabama Electric Co-op* 0 0 0 0 10 7 11 8 11 8
Total Utility 51,716 47,950 49,566 46,253 49,868 46,771 46,531 43,498 46,607 41,309Total Nonutility 5,546 5,413 5,297 4,948 4,445 4,683 2,565 2,494 8,776 7,541 Total State of Florida 57,262 53,363 54,863 51,201 54,313 51,454 49,096 45,992 55,383 49,366
*Excludes generation physically outside Florida regardless of whether it serves load in Florida.**Reported as part of Orlando.
SOURCE: Regional Load and Resource Plan, FRCC
21
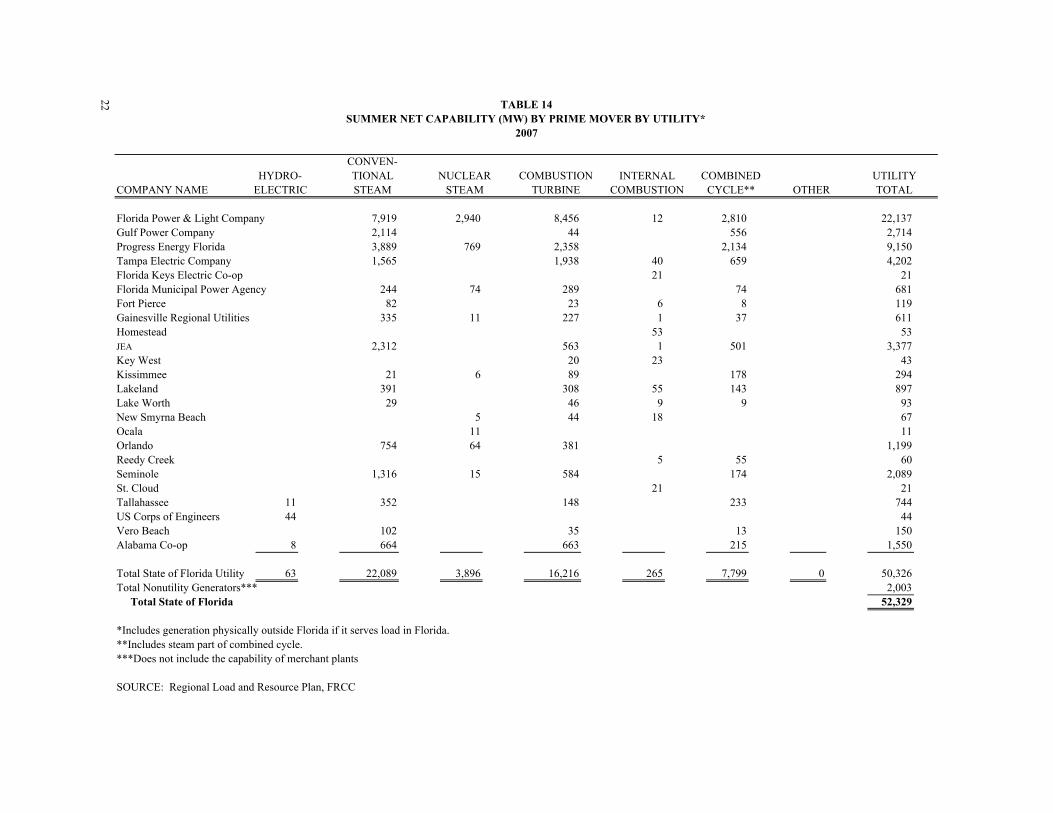
22 TABLE 14SUMMER NET CAPABILITY (MW) BY PRIME MOVER BY UTILITY*
2007
CONVEN-HYDRO- TIONAL NUCLEAR COMBUSTION INTERNAL COMBINED UTILITY
COMPANY NAME ELECTRIC STEAM STEAM TURBINE COMBUSTION CYCLE** OTHER TOTAL
Florida Power & Light Company 7,919 2,940 8,456 12 2,810 22,137Gulf Power Company 2,114 44 556 2,714Progress Energy Florida 3,889 769 2,358 2,134 9,150Tampa Electric Company 1,565 1,938 40 659 4,202Florida Keys Electric Co-op 21 21Florida Municipal Power Agency 244 74 289 74 681Fort Pierce 82 23 6 8 119Gainesville Regional Utilities 335 11 227 1 37 611Homestead 53 53JEA 2,312 563 1 501 3,377Key West 20 23 43Kissimmee 21 6 89 178 294Lakeland 391 308 55 143 897Lake Worth 29 46 9 9 93New Smyrna Beach 5 44 18 67Ocala 11 11Orlando 754 64 381 1,199Reedy Creek 5 55 60Seminole 1,316 15 584 174 2,089St. Cloud 21 21Tallahassee 11 352 148 233 744US Corps of Engineers 44 44Vero Beach 102 35 13 150Alabama Co-op 8 664 663 215 1,550
Total State of Florida Utility 63 22,089 3,896 16,216 265 7,799 0 50,326Total Nonutility Generators*** 2,003 Total State of Florida 52,329
*Includes generation physically outside Florida if it serves load in Florida.**Includes steam part of combined cycle.***Does not include the capability of merchant plants
SOURCE: Regional Load and Resource Plan, FRCC
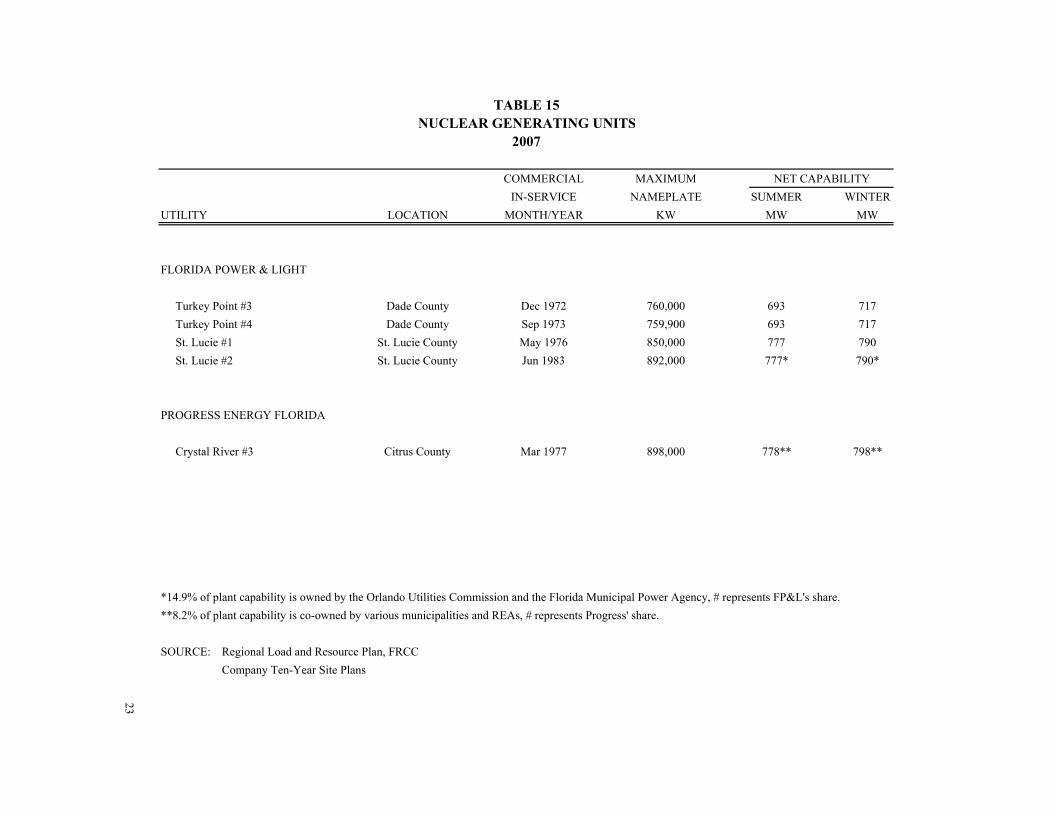
TABLE 15NUCLEAR GENERATING UNITS
2007
COMMERCIAL MAXIMUM NET CAPABILITYIN-SERVICE NAMEPLATE SUMMER WINTER
UTILITY LOCATION MONTH/YEAR KW MW MW
FLORIDA POWER & LIGHT
Turkey Point #3 Dade County Dec 1972 760,000 693 717 Turkey Point #4 Dade County Sep 1973 759,900 693 717 St. Lucie #1 St. Lucie County May 1976 850,000 777 790 St. Lucie #2 St. Lucie County Jun 1983 892,000 777* 790*
PROGRESS ENERGY FLORIDA
Crystal River #3 Citrus County Mar 1977 898,000 778** 798**
*14.9% of plant capability is owned by the Orlando Utilities Commission and the Florida Municipal Power Agency, # represents FP&L's share.**8.2% of plant capability is co-owned by various municipalities and REAs, # represents Progress' share.
SOURCE: Regional Load and Resource Plan, FRCCCompany Ten-Year Site Plans
23
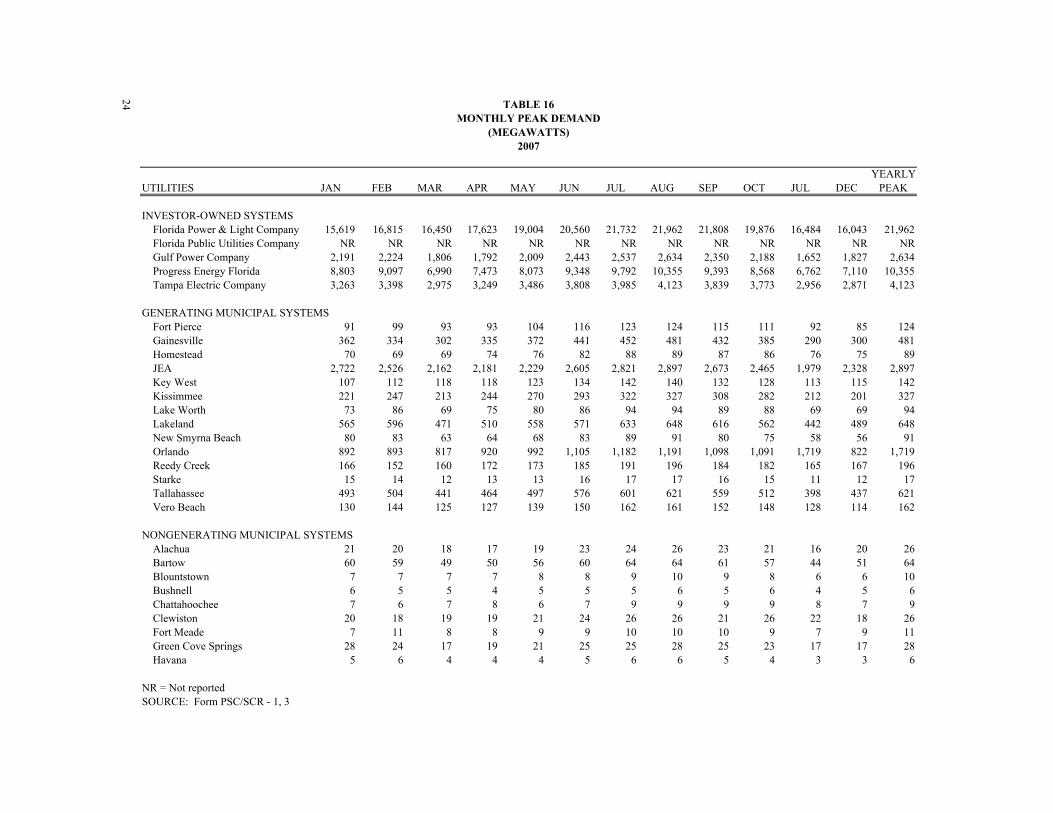
24 TABLE 16MONTHLY PEAK DEMAND
(MEGAWATTS)2007
YEARLYUTILITIES JAN FEB MAR APR MAY JUN JUL AUG SEP OCT JUL DEC PEAK
INVESTOR-OWNED SYSTEMS Florida Power & Light Company 15,619 16,815 16,450 17,623 19,004 20,560 21,732 21,962 21,808 19,876 16,484 16,043 21,962 Florida Public Utilities Company NR NR NR NR NR NR NR NR NR NR NR NR NR Gulf Power Company 2,191 2,224 1,806 1,792 2,009 2,443 2,537 2,634 2,350 2,188 1,652 1,827 2,634 Progress Energy Florida 8,803 9,097 6,990 7,473 8,073 9,348 9,792 10,355 9,393 8,568 6,762 7,110 10,355 Tampa Electric Company 3,263 3,398 2,975 3,249 3,486 3,808 3,985 4,123 3,839 3,773 2,956 2,871 4,123
GENERATING MUNICIPAL SYSTEMS Fort Pierce 91 99 93 93 104 116 123 124 115 111 92 85 124 Gainesville 362 334 302 335 372 441 452 481 432 385 290 300 481 Homestead 70 69 69 74 76 82 88 89 87 86 76 75 89 JEA 2,722 2,526 2,162 2,181 2,229 2,605 2,821 2,897 2,673 2,465 1,979 2,328 2,897 Key West 107 112 118 118 123 134 142 140 132 128 113 115 142 Kissimmee 221 247 213 244 270 293 322 327 308 282 212 201 327 Lake Worth 73 86 69 75 80 86 94 94 89 88 69 69 94 Lakeland 565 596 471 510 558 571 633 648 616 562 442 489 648 New Smyrna Beach 80 83 63 64 68 83 89 91 80 75 58 56 91 Orlando 892 893 817 920 992 1,105 1,182 1,191 1,098 1,091 1,719 822 1,719 Reedy Creek 166 152 160 172 173 185 191 196 184 182 165 167 196 Starke 15 14 12 13 13 16 17 17 16 15 11 12 17 Tallahassee 493 504 441 464 497 576 601 621 559 512 398 437 621 Vero Beach 130 144 125 127 139 150 162 161 152 148 128 114 162
NONGENERATING MUNICIPAL SYSTEMS Alachua 21 20 18 17 19 23 24 26 23 21 16 20 26 Bartow 60 59 49 50 56 60 64 64 61 57 44 51 64 Blountstown 7 7 7 7 8 8 9 10 9 8 6 6 10 Bushnell 6 5 5 4 5 5 5 6 5 6 4 5 6 Chattahoochee 7 6 7 8 6 7 9 9 9 9 8 7 9 Clewiston 20 18 19 19 21 24 26 26 21 26 22 18 26 Fort Meade 7 11 8 8 9 9 10 10 10 9 7 9 11 Green Cove Springs 28 24 17 19 21 25 25 28 25 23 17 17 28 Havana 5 6 4 4 4 5 6 6 5 4 3 3 6
NR = Not reportedSOURCE: Form PSC/SCR - 1, 3
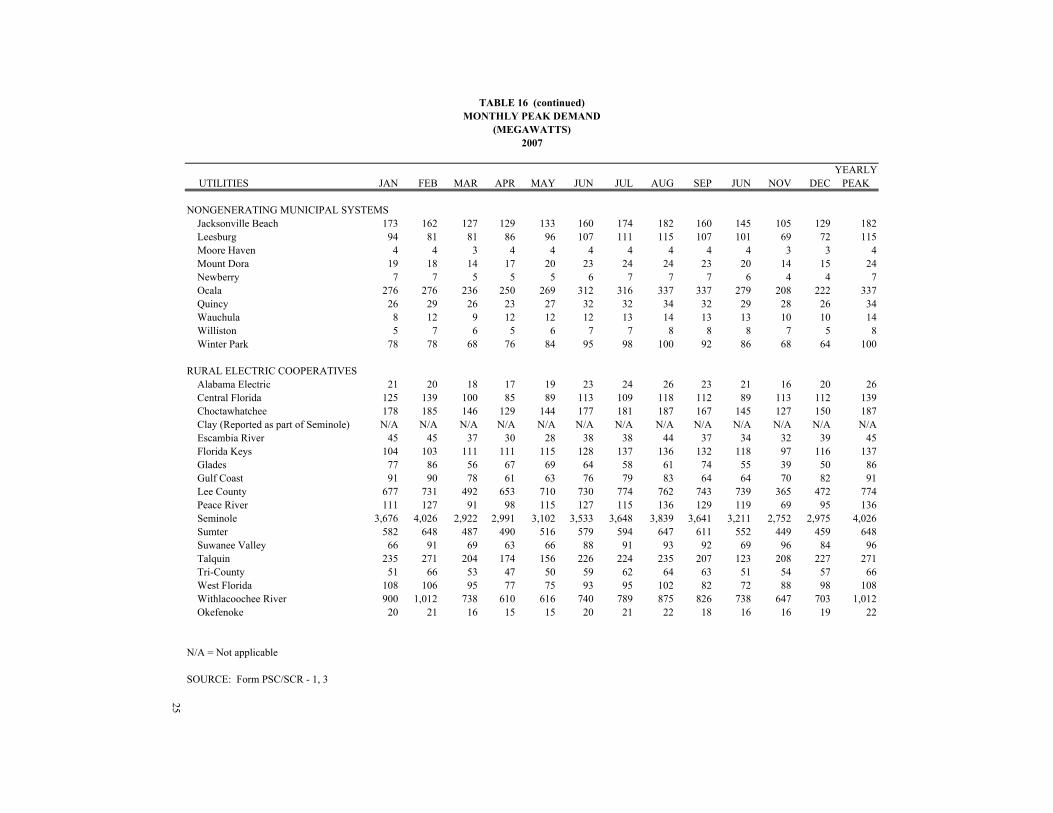
TABLE 16 (continued)MONTHLY PEAK DEMAND
(MEGAWATTS)2007
YEARLYUTILITIES JAN FEB MAR APR MAY JUN JUL AUG SEP JUN NOV DEC PEAK
NONGENERATING MUNICIPAL SYSTEMS Jacksonville Beach 173 162 127 129 133 160 174 182 160 145 105 129 182 Leesburg 94 81 81 86 96 107 111 115 107 101 69 72 115 Moore Haven 4 4 3 4 4 4 4 4 4 4 3 3 4 Mount Dora 19 18 14 17 20 23 24 24 23 20 14 15 24 Newberry 7 7 5 5 5 6 7 7 7 6 4 4 7 Ocala 276 276 236 250 269 312 316 337 337 279 208 222 337 Quincy 26 29 26 23 27 32 32 34 32 29 28 26 34 Wauchula 8 12 9 12 12 12 13 14 13 13 10 10 14 Williston 5 7 6 5 6 7 7 8 8 8 7 5 8 Winter Park 78 78 68 76 84 95 98 100 92 86 68 64 100
RURAL ELECTRIC COOPERATIVES Alabama Electric 21 20 18 17 19 23 24 26 23 21 16 20 26 Central Florida 125 139 100 85 89 113 109 118 112 89 113 112 139 Choctawhatchee 178 185 146 129 144 177 181 187 167 145 127 150 187 Clay (Reported as part of Seminole) N/A N/A N/A N/A N/A N/A N/A N/A N/A N/A N/A N/A N/A Escambia River 45 45 37 30 28 38 38 44 37 34 32 39 45 Florida Keys 104 103 111 111 115 128 137 136 132 118 97 116 137 Glades 77 86 56 67 69 64 58 61 74 55 39 50 86 Gulf Coast 91 90 78 61 63 76 79 83 64 64 70 82 91 Lee County 677 731 492 653 710 730 774 762 743 739 365 472 774 Peace River 111 127 91 98 115 127 115 136 129 119 69 95 136 Seminole 3,676 4,026 2,922 2,991 3,102 3,533 3,648 3,839 3,641 3,211 2,752 2,975 4,026 Sumter 582 648 487 490 516 579 594 647 611 552 449 459 648 Suwanee Valley 66 91 69 63 66 88 91 93 92 69 96 84 96 Talquin 235 271 204 174 156 226 224 235 207 123 208 227 271 Tri-County 51 66 53 47 50 59 62 64 63 51 54 57 66 West Florida 108 106 95 77 75 93 95 102 82 72 88 98 108 Withlacoochee River 900 1,012 738 610 616 740 789 875 826 738 647 703 1,012 Okefenoke 20 21 16 15 15 20 21 22 18 16 16 19 22
N/A = Not applicable
SOURCE: Form PSC/SCR - 1, 3
25
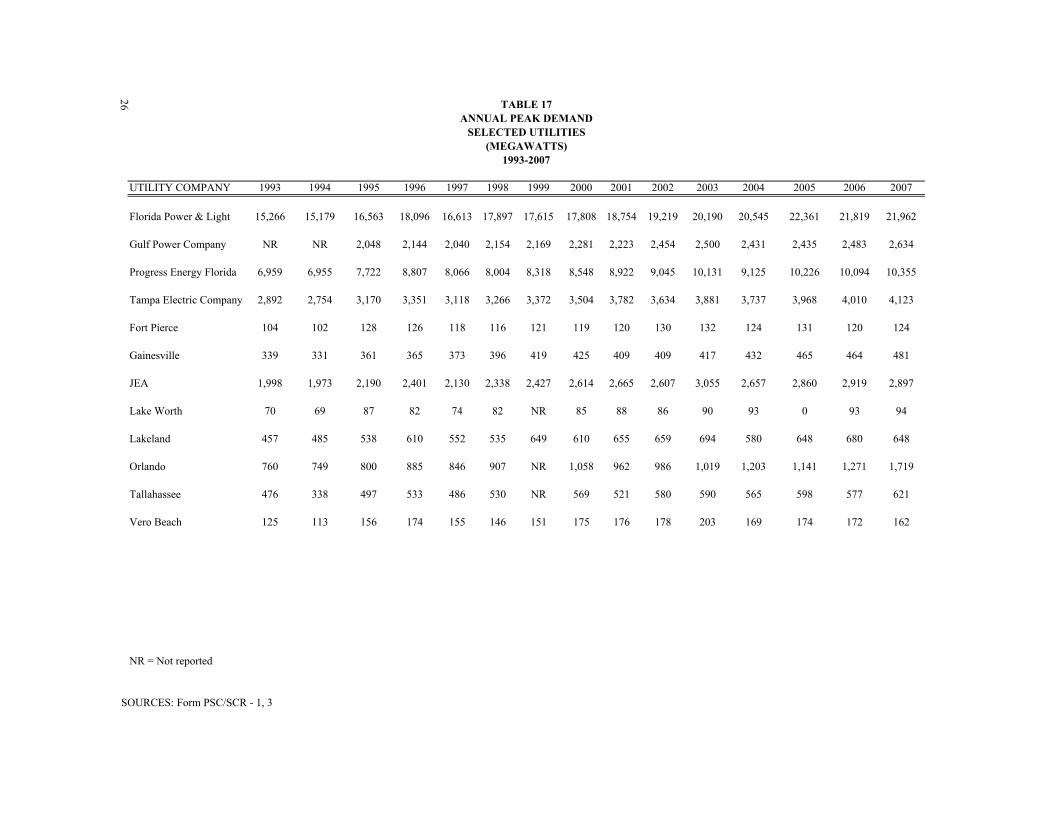
26 TABLE 17ANNUAL PEAK DEMAND
SELECTED UTILITIES(MEGAWATTS)
1993-2007
UTILITY COMPANY 1993 1994 1995 1996 1997 1998 1999 2000 2001 2002 2003 2004 2005 2006 2007
Florida Power & Light 15,266 15,179 16,563 18,096 16,613 17,897 17,615 17,808 18,754 19,219 20,190 20,545 22,361 21,819 21,962
Gulf Power Company NR NR 2,048 2,144 2,040 2,154 2,169 2,281 2,223 2,454 2,500 2,431 2,435 2,483 2,634
Progress Energy Florida 6,959 6,955 7,722 8,807 8,066 8,004 8,318 8,548 8,922 9,045 10,131 9,125 10,226 10,094 10,355
Tampa Electric Company 2,892 2,754 3,170 3,351 3,118 3,266 3,372 3,504 3,782 3,634 3,881 3,737 3,968 4,010 4,123
Fort Pierce 104 102 128 126 118 116 121 119 120 130 132 124 131 120 124
Gainesville 339 331 361 365 373 396 419 425 409 409 417 432 465 464 481
JEA 1,998 1,973 2,190 2,401 2,130 2,338 2,427 2,614 2,665 2,607 3,055 2,657 2,860 2,919 2,897
Lake Worth 70 69 87 82 74 82 NR 85 88 86 90 93 0 93 94
Lakeland 457 485 538 610 552 535 649 610 655 659 694 580 648 680 648
Orlando 760 749 800 885 846 907 NR 1,058 962 986 1,019 1,203 1,141 1,271 1,719
Tallahassee 476 338 497 533 486 530 NR 569 521 580 590 565 598 577 621
Vero Beach 125 113 156 174 155 146 151 175 176 178 203 169 174 172 162
NR = Not reported
SOURCES: Form PSC/SCR - 1, 3
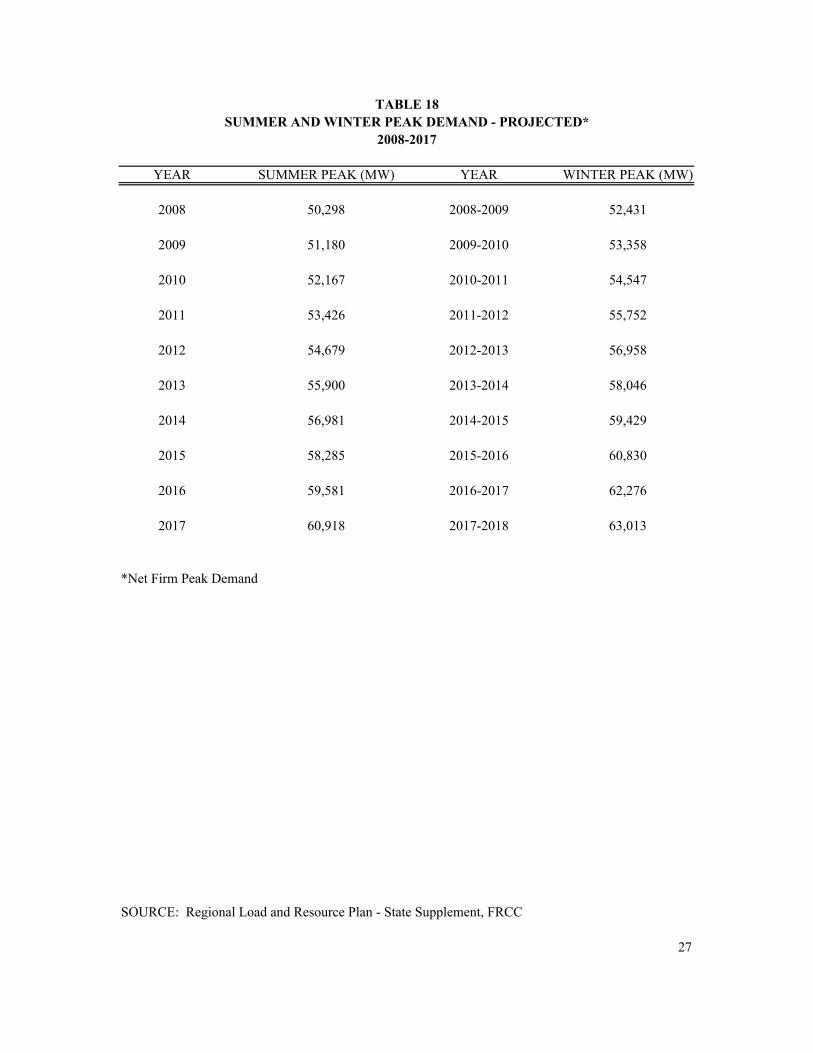
TABLE 18SUMMER AND WINTER PEAK DEMAND - PROJECTED*
2008-2017
YEAR SUMMER PEAK (MW) YEAR WINTER PEAK (MW)
2008 50,298 2008-2009 52,431
2009 51,180 2009-2010 53,358
2010 52,167 2010-2011 54,547
2011 53,426 2011-2012 55,752
2012 54,679 2012-2013 56,958
2013 55,900 2013-2014 58,046
2014 56,981 2014-2015 59,429
2015 58,285 2015-2016 60,830
2016 59,581 2016-2017 62,276
2017 60,918 2017-2018 63,013
*Net Firm Peak Demand
SOURCE: Regional Load and Resource Plan - State Supplement, FRCC
27
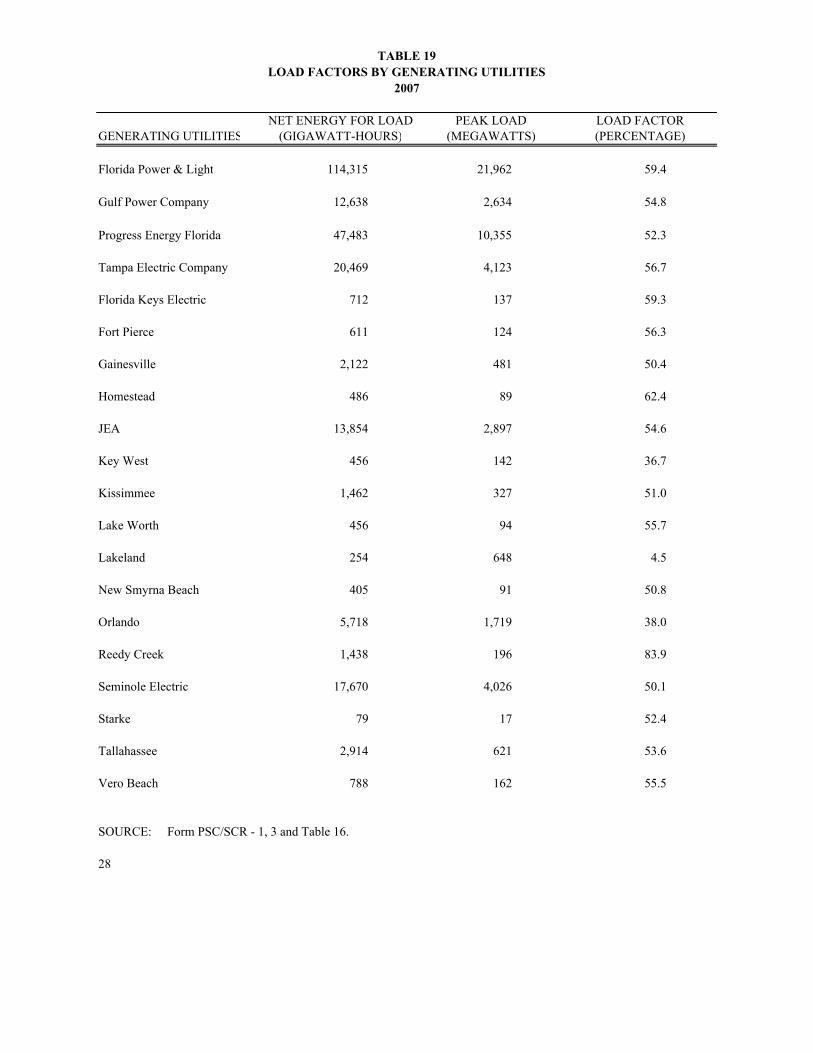
TABLE 19LOAD FACTORS BY GENERATING UTILITIES
2007
NET ENERGY FOR LOAD PEAK LOAD LOAD FACTORGENERATING UTILITIES (GIGAWATT-HOURS) (MEGAWATTS) (PERCENTAGE)
Florida Power & Light 114,315 21,962 59.4
Gulf Power Company 12,638 2,634 54.8
Progress Energy Florida 47,483 10,355 52.3
Tampa Electric Company 20,469 4,123 56.7
Florida Keys Electric 712 137 59.3
Fort Pierce 611 124 56.3
Gainesville 2,122 481 50.4
Homestead 486 89 62.4
JEA 13,854 2,897 54.6
Key West 456 142 36.7
Kissimmee 1,462 327 51.0
Lake Worth 456 94 55.7
Lakeland 254 648 4.5
New Smyrna Beach 405 91 50.8
Orlando 5,718 1,719 38.0
Reedy Creek 1,438 196 83.9
Seminole Electric 17,670 4,026 50.1
Starke 79 17 52.4
Tallahassee 2,914 621 53.6
Vero Beach 788 162 55.5
SOURCE: Form PSC/SCR - 1, 3 and Table 16.
28

FUEL ANALYSIS

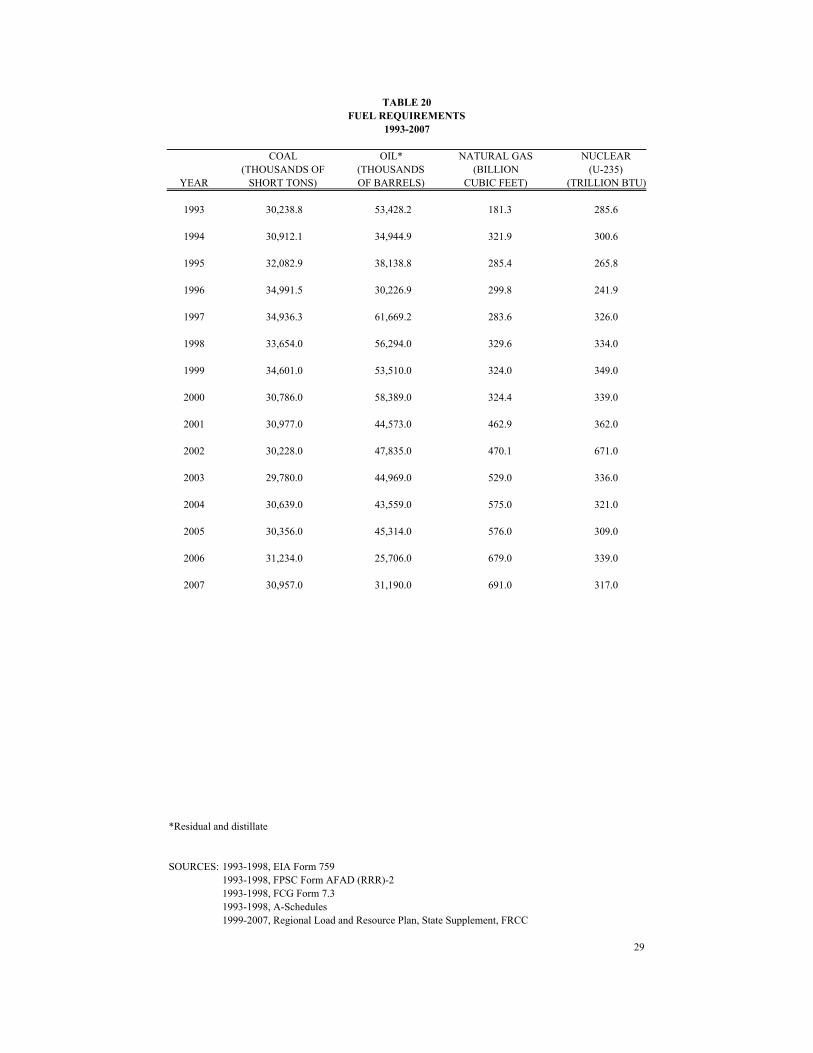
TABLE 20FUEL REQUIREMENTS
1993-2007
COAL OIL* NATURAL GAS NUCLEAR(THOUSANDS OF (THOUSANDS (BILLION (U-235)
YEAR SHORT TONS) OF BARRELS) CUBIC FEET) (TRILLION BTU)
1993 30,238.8 53,428.2 181.3 285.6
1994 30,912.1 34,944.9 321.9 300.6
1995 32,082.9 38,138.8 285.4 265.8
1996 34,991.5 30,226.9 299.8 241.9
1997 34,936.3 61,669.2 283.6 326.0
1998 33,654.0 56,294.0 329.6 334.0
1999 34,601.0 53,510.0 324.0 349.0
2000 30,786.0 58,389.0 324.4 339.0
2001 30,977.0 44,573.0 462.9 362.0
2002 30,228.0 47,835.0 470.1 671.0
2003 29,780.0 44,969.0 529.0 336.0
2004 30,639.0 43,559.0 575.0 321.0
2005 30,356.0 45,314.0 576.0 309.0
2006 31,234.0 25,706.0 679.0 339.0
2007 30,957.0 31,190.0 691.0 317.0
*Residual and distillate
SOURCES: 1993-1998, EIA Form 7591993-1998, FPSC Form AFAD (RRR)-21993-1998, FCG Form 7.31993-1998, A-Schedules 1999-2007, Regional Load and Resource Plan, State Supplement, FRCC
29
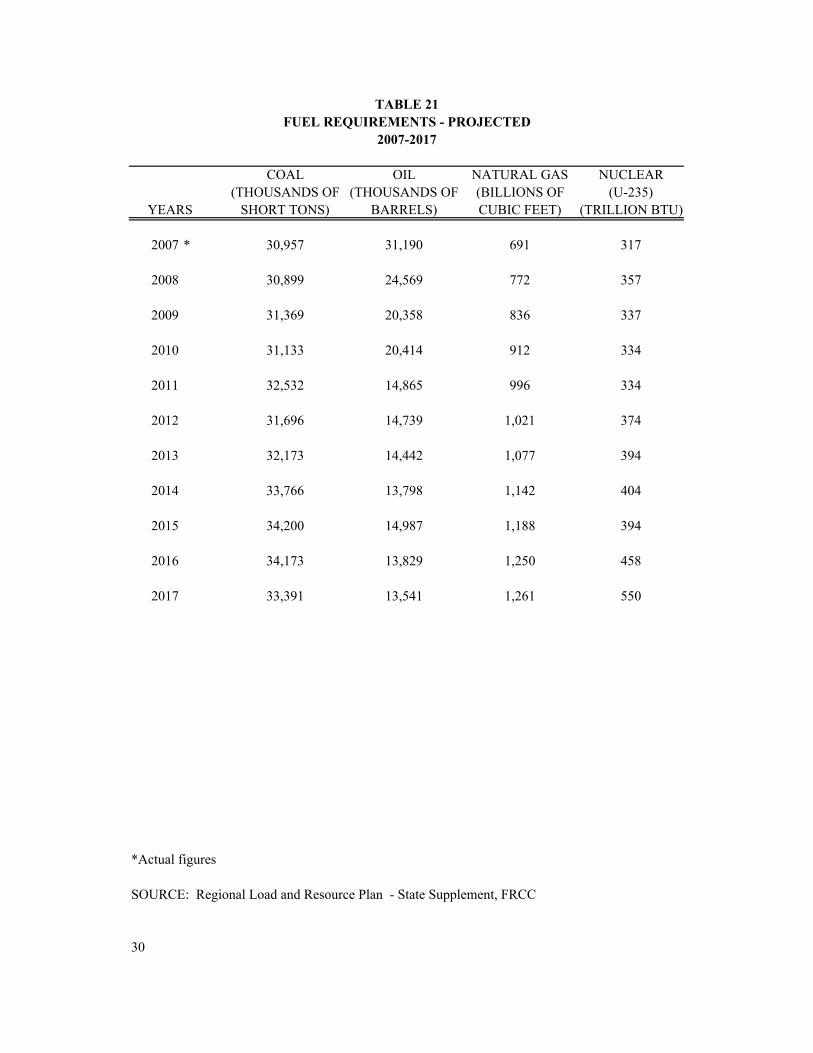
TABLE 21FUEL REQUIREMENTS - PROJECTED
2007-2017
COAL OIL NATURAL GAS NUCLEAR(THOUSANDS OF (THOUSANDS OF (BILLIONS OF (U-235)
YEARS SHORT TONS) BARRELS) CUBIC FEET) (TRILLION BTU)
2007 * 30,957 31,190 691 317
2008 30,899 24,569 772 357
2009 31,369 20,358 836 337
2010 31,133 20,414 912 334
2011 32,532 14,865 996 334
2012 31,696 14,739 1,021 374
2013 32,173 14,442 1,077 394
2014 33,766 13,798 1,142 404
2015 34,200 14,987 1,188 394
2016 34,173 13,829 1,250 458
2017 33,391 13,541 1,261 550
*Actual figures
SOURCE: Regional Load and Resource Plan - State Supplement, FRCC
30

CONSUMPTION

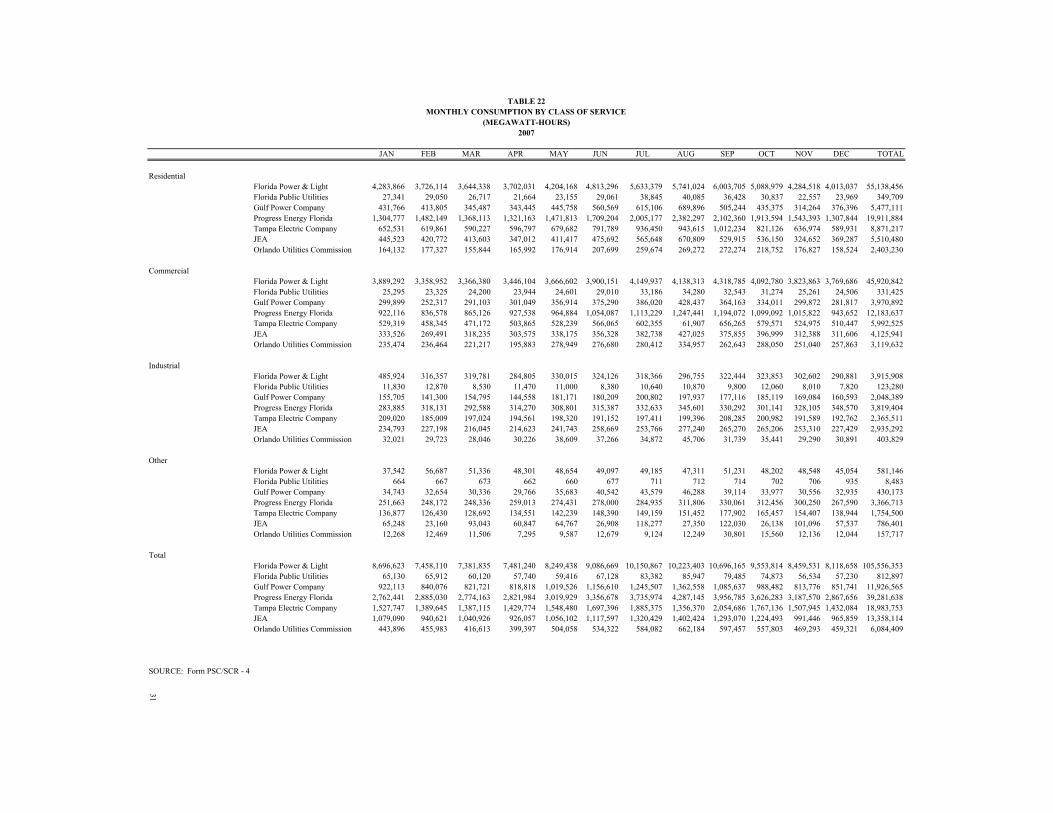
TABLE 22MONTHLY CONSUMPTION BY CLASS OF SERVICE
(MEGAWATT-HOURS)2007
JAN FEB MAR APR MAY JUN JUL AUG SEP OCT NOV DEC TOTAL
ResidentialFlorida Power & Light 4,283,866 3,726,114 3,644,338 3,702,031 4,204,168 4,813,296 5,633,379 5,741,024 6,003,705 5,088,979 4,284,518 4,013,037 55,138,456Florida Public Utilities 27,341 29,050 26,717 21,664 23,155 29,061 38,845 40,085 36,428 30,837 22,557 23,969 349,709Gulf Power Company 431,766 413,805 345,487 343,445 445,758 560,569 615,106 689,896 505,244 435,375 314,264 376,396 5,477,111Progress Energy Florida 1,304,777 1,482,149 1,368,113 1,321,163 1,471,813 1,709,204 2,005,177 2,382,297 2,102,360 1,913,594 1,543,393 1,307,844 19,911,884Tampa Electric Company 652,531 619,861 590,227 596,797 679,682 791,789 936,450 943,615 1,012,234 821,126 636,974 589,931 8,871,217JEA 445,523 420,772 413,603 347,012 411,417 475,692 565,648 670,809 529,915 536,150 324,652 369,287 5,510,480Orlando Utilities Commission 164,132 177,327 155,844 165,992 176,914 207,699 259,674 269,272 272,274 218,752 176,827 158,524 2,403,230
CommercialFlorida Power & Light 3,889,292 3,358,952 3,366,380 3,446,104 3,666,602 3,900,151 4,149,937 4,138,313 4,318,785 4,092,780 3,823,863 3,769,686 45,920,842Florida Public Utilities 25,295 23,325 24,200 23,944 24,601 29,010 33,186 34,280 32,543 31,274 25,261 24,506 331,425Gulf Power Company 299,899 252,317 291,103 301,049 356,914 375,290 386,020 428,437 364,163 334,011 299,872 281,817 3,970,892Progress Energy Florida 922,116 836,578 865,126 927,538 964,884 1,054,087 1,113,229 1,247,441 1,194,072 1,099,092 1,015,822 943,652 12,183,637Tampa Electric Company 529,319 458,345 471,172 503,865 528,239 566,065 602,355 61,907 656,265 579,571 524,975 510,447 5,992,525JEA 333,526 269,491 318,235 303,575 338,175 356,328 382,738 427,025 375,855 396,999 312,388 311,606 4,125,941Orlando Utilities Commission 235,474 236,464 221,217 195,883 278,949 276,680 280,412 334,957 262,643 288,050 251,040 257,863 3,119,632
IndustrialFlorida Power & Light 485,924 316,357 319,781 284,805 330,015 324,126 318,366 296,755 322,444 323,853 302,602 290,881 3,915,908Florida Public Utilities 11,830 12,870 8,530 11,470 11,000 8,380 10,640 10,870 9,800 12,060 8,010 7,820 123,280Gulf Power Company 155,705 141,300 154,795 144,558 181,171 180,209 200,802 197,937 177,116 185,119 169,084 160,593 2,048,389Progress Energy Florida 283,885 318,131 292,588 314,270 308,801 315,387 332,633 345,601 330,292 301,141 328,105 348,570 3,819,404Tampa Electric Company 209,020 185,009 197,024 194,561 198,320 191,152 197,411 199,396 208,285 200,982 191,589 192,762 2,365,511JEA 234,793 227,198 216,045 214,623 241,743 258,669 253,766 277,240 265,270 265,206 253,310 227,429 2,935,292Orlando Utilities Commission 32,021 29,723 28,046 30,226 38,609 37,266 34,872 45,706 31,739 35,441 29,290 30,891 403,829
OtherFlorida Power & Light 37,542 56,687 51,336 48,301 48,654 49,097 49,185 47,311 51,231 48,202 48,548 45,054 581,146Florida Public Utilities 664 667 673 662 660 677 711 712 714 702 706 935 8,483Gulf Power Company 34,743 32,654 30,336 29,766 35,683 40,542 43,579 46,288 39,114 33,977 30,556 32,935 430,173Progress Energy Florida 251,663 248,172 248,336 259,013 274,431 278,000 284,935 311,806 330,061 312,456 300,250 267,590 3,366,713Tampa Electric Company 136,877 126,430 128,692 134,551 142,239 148,390 149,159 151,452 177,902 165,457 154,407 138,944 1,754,500JEA 65,248 23,160 93,043 60,847 64,767 26,908 118,277 27,350 122,030 26,138 101,096 57,537 786,401Orlando Utilities Commission 12,268 12,469 11,506 7,295 9,587 12,679 9,124 12,249 30,801 15,560 12,136 12,044 157,717
TotalFlorida Power & Light 8,696,623 7,458,110 7,381,835 7,481,240 8,249,438 9,086,669 10,150,867 10,223,403 10,696,165 9,553,814 8,459,531 8,118,658 105,556,353Florida Public Utilities 65,130 65,912 60,120 57,740 59,416 67,128 83,382 85,947 79,485 74,873 56,534 57,230 812,897Gulf Power Company 922,113 840,076 821,721 818,818 1,019,526 1,156,610 1,245,507 1,362,558 1,085,637 988,482 813,776 851,741 11,926,565Progress Energy Florida 2,762,441 2,885,030 2,774,163 2,821,984 3,019,929 3,356,678 3,735,974 4,287,145 3,956,785 3,626,283 3,187,570 2,867,656 39,281,638Tampa Electric Company 1,527,747 1,389,645 1,387,115 1,429,774 1,548,480 1,697,396 1,885,375 1,356,370 2,054,686 1,767,136 1,507,945 1,432,084 18,983,753JEA 1,079,090 940,621 1,040,926 926,057 1,056,102 1,117,597 1,320,429 1,402,424 1,293,070 1,224,493 991,446 965,859 13,358,114Orlando Utilities Commission 443,896 455,983 416,613 399,397 504,058 534,322 584,082 662,184 597,457 557,803 469,293 459,321 6,084,409
SOURCE: Form PSC/SCR - 4
31
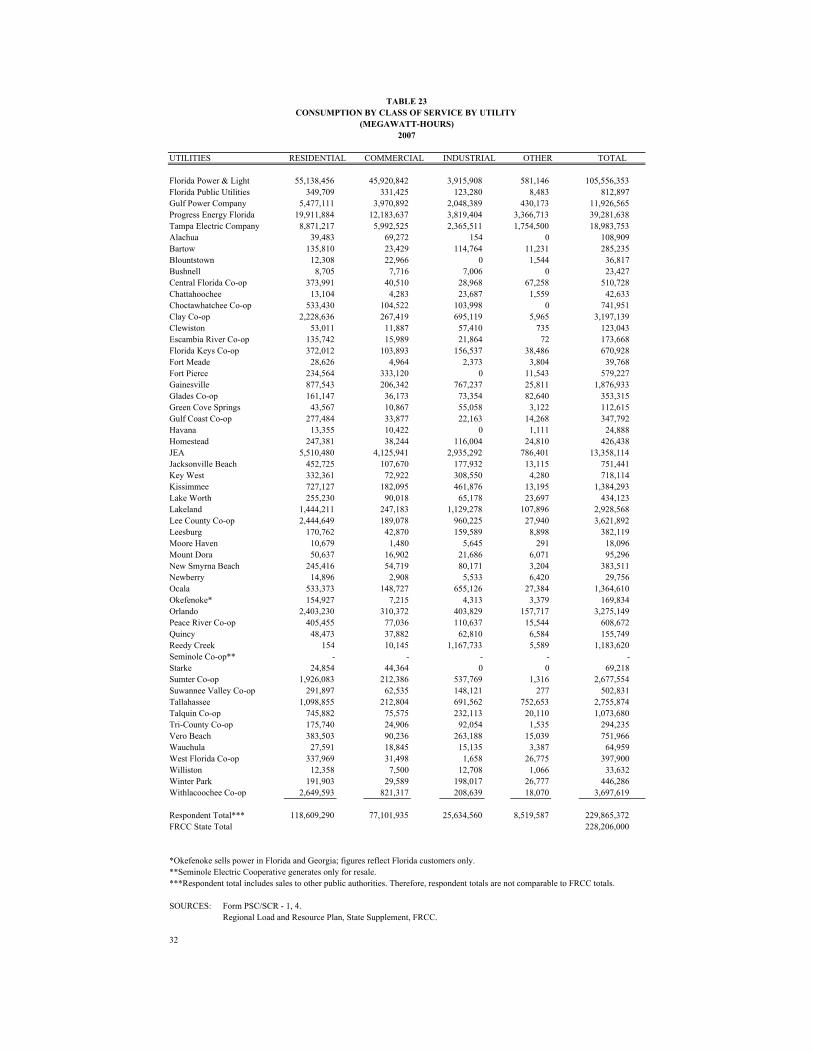
TABLE 23CONSUMPTION BY CLASS OF SERVICE BY UTILITY
(MEGAWATT-HOURS)2007
UTILITIES RESIDENTIAL COMMERCIAL INDUSTRIAL OTHER TOTAL
Florida Power & Light 55,138,456 45,920,842 3,915,908 581,146 105,556,353Florida Public Utilities 349,709 331,425 123,280 8,483 812,897Gulf Power Company 5,477,111 3,970,892 2,048,389 430,173 11,926,565Progress Energy Florida 19,911,884 12,183,637 3,819,404 3,366,713 39,281,638Tampa Electric Company 8,871,217 5,992,525 2,365,511 1,754,500 18,983,753Alachua 39,483 69,272 154 0 108,909Bartow 135,810 23,429 114,764 11,231 285,235Blountstown 12,308 22,966 0 1,544 36,817Bushnell 8,705 7,716 7,006 0 23,427Central Florida Co-op 373,991 40,510 28,968 67,258 510,728Chattahoochee 13,104 4,283 23,687 1,559 42,633Choctawhatchee Co-op 533,430 104,522 103,998 0 741,951Clay Co-op 2,228,636 267,419 695,119 5,965 3,197,139Clewiston 53,011 11,887 57,410 735 123,043Escambia River Co-op 135,742 15,989 21,864 72 173,668Florida Keys Co-op 372,012 103,893 156,537 38,486 670,928Fort Meade 28,626 4,964 2,373 3,804 39,768Fort Pierce 234,564 333,120 0 11,543 579,227Gainesville 877,543 206,342 767,237 25,811 1,876,933Glades Co-op 161,147 36,173 73,354 82,640 353,315Green Cove Springs 43,567 10,867 55,058 3,122 112,615Gulf Coast Co-op 277,484 33,877 22,163 14,268 347,792Havana 13,355 10,422 0 1,111 24,888Homestead 247,381 38,244 116,004 24,810 426,438JEA 5,510,480 4,125,941 2,935,292 786,401 13,358,114Jacksonville Beach 452,725 107,670 177,932 13,115 751,441Key West 332,361 72,922 308,550 4,280 718,114Kissimmee 727,127 182,095 461,876 13,195 1,384,293Lake Worth 255,230 90,018 65,178 23,697 434,123Lakeland 1,444,211 247,183 1,129,278 107,896 2,928,568Lee County Co-op 2,444,649 189,078 960,225 27,940 3,621,892Leesburg 170,762 42,870 159,589 8,898 382,119Moore Haven 10,679 1,480 5,645 291 18,096Mount Dora 50,637 16,902 21,686 6,071 95,296New Smyrna Beach 245,416 54,719 80,171 3,204 383,511Newberry 14,896 2,908 5,533 6,420 29,756Ocala 533,373 148,727 655,126 27,384 1,364,610Okefenoke* 154,927 7,215 4,313 3,379 169,834Orlando 2,403,230 310,372 403,829 157,717 3,275,149Peace River Co-op 405,455 77,036 110,637 15,544 608,672Quincy 48,473 37,882 62,810 6,584 155,749Reedy Creek 154 10,145 1,167,733 5,589 1,183,620Seminole Co-op** - - - - -Starke 24,854 44,364 0 0 69,218Sumter Co-op 1,926,083 212,386 537,769 1,316 2,677,554Suwannee Valley Co-op 291,897 62,535 148,121 277 502,831Tallahassee 1,098,855 212,804 691,562 752,653 2,755,874Talquin Co-op 745,882 75,575 232,113 20,110 1,073,680Tri-County Co-op 175,740 24,906 92,054 1,535 294,235Vero Beach 383,503 90,236 263,188 15,039 751,966Wauchula 27,591 18,845 15,135 3,387 64,959West Florida Co-op 337,969 31,498 1,658 26,775 397,900Williston 12,358 7,500 12,708 1,066 33,632Winter Park 191,903 29,589 198,017 26,777 446,286Withlacoochee Co-op 2,649,593 821,317 208,639 18,070 3,697,619
Respondent Total*** 118,609,290 77,101,935 25,634,560 8,519,587 229,865,372FRCC State Total 228,206,000
*Okefenoke sells power in Florida and Georgia; figures reflect Florida customers only.**Seminole Electric Cooperative generates only for resale.***Respondent total includes sales to other public authorities. Therefore, respondent totals are not comparable to FRCC totals.
SOURCES: Form PSC/SCR - 1, 4.Regional Load and Resource Plan, State Supplement, FRCC.
32
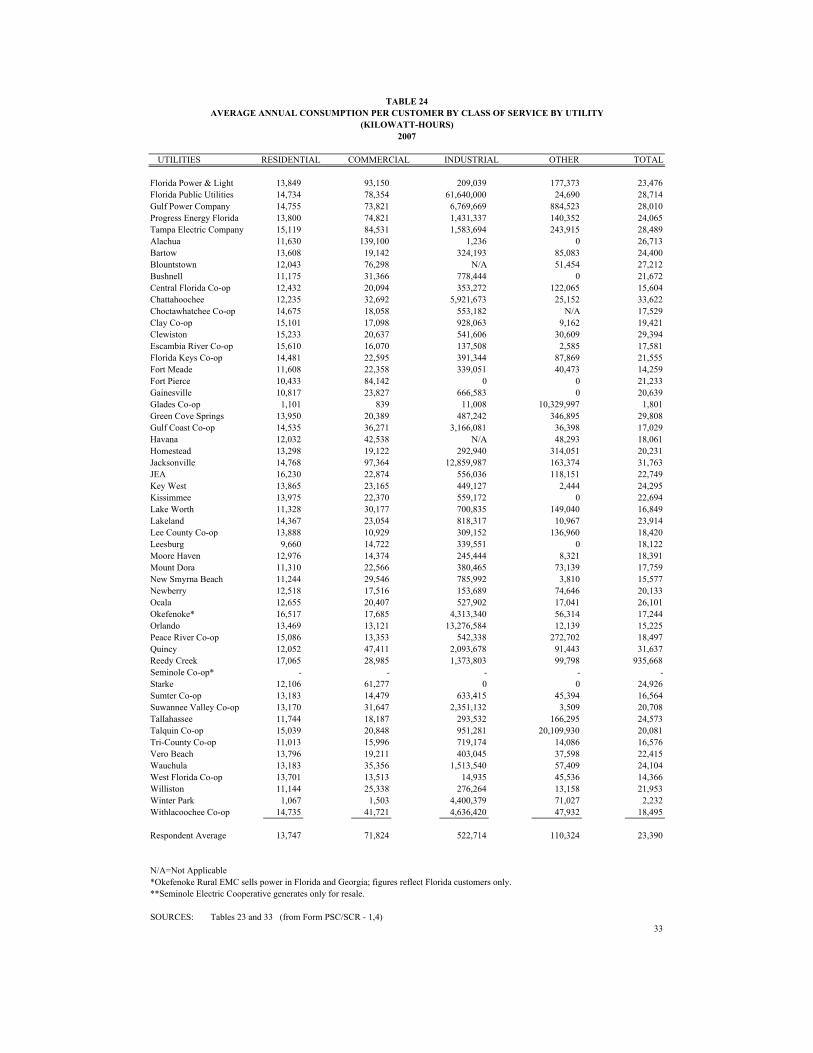
TABLE 24AVERAGE ANNUAL CONSUMPTION PER CUSTOMER BY CLASS OF SERVICE BY UTILITY
(KILOWATT-HOURS)2007
UTILITIES RESIDENTIAL COMMERCIAL INDUSTRIAL OTHER TOTAL
Florida Power & Light 13,849 93,150 209,039 177,373 23,476Florida Public Utilities 14,734 78,354 61,640,000 24,690 28,714Gulf Power Company 14,755 73,821 6,769,669 884,523 28,010Progress Energy Florida 13,800 74,821 1,431,337 140,352 24,065Tampa Electric Company 15,119 84,531 1,583,694 243,915 28,489Alachua 11,630 139,100 1,236 0 26,713Bartow 13,608 19,142 324,193 85,083 24,400Blountstown 12,043 76,298 N/A 51,454 27,212Bushnell 11,175 31,366 778,444 0 21,672Central Florida Co-op 12,432 20,094 353,272 122,065 15,604Chattahoochee 12,235 32,692 5,921,673 25,152 33,622Choctawhatchee Co-op 14,675 18,058 553,182 N/A 17,529Clay Co-op 15,101 17,098 928,063 9,162 19,421Clewiston 15,233 20,637 541,606 30,609 29,394Escambia River Co-op 15,610 16,070 137,508 2,585 17,581Florida Keys Co-op 14,481 22,595 391,344 87,869 21,555Fort Meade 11,608 22,358 339,051 40,473 14,259Fort Pierce 10,433 84,142 0 0 21,233Gainesville 10,817 23,827 666,583 0 20,639Glades Co-op 1,101 839 11,008 10,329,997 1,801Green Cove Springs 13,950 20,389 487,242 346,895 29,808Gulf Coast Co-op 14,535 36,271 3,166,081 36,398 17,029Havana 12,032 42,538 N/A 48,293 18,061Homestead 13,298 19,122 292,940 314,051 20,231Jacksonville 14,768 97,364 12,859,987 163,374 31,763JEA 16,230 22,874 556,036 118,151 22,749Key West 13,865 23,165 449,127 2,444 24,295Kissimmee 13,975 22,370 559,172 0 22,694Lake Worth 11,328 30,177 700,835 149,040 16,849Lakeland 14,367 23,054 818,317 10,967 23,914Lee County Co-op 13,888 10,929 309,152 136,960 18,420Leesburg 9,660 14,722 339,551 0 18,122Moore Haven 12,976 14,374 245,444 8,321 18,391Mount Dora 11,310 22,566 380,465 73,139 17,759New Smyrna Beach 11,244 29,546 785,992 3,810 15,577Newberry 12,518 17,516 153,689 74,646 20,133Ocala 12,655 20,407 527,902 17,041 26,101Okefenoke* 16,517 17,685 4,313,340 56,314 17,244Orlando 13,469 13,121 13,276,584 12,139 15,225Peace River Co-op 15,086 13,353 542,338 272,702 18,497Quincy 12,052 47,411 2,093,678 91,443 31,637Reedy Creek 17,065 28,985 1,373,803 99,798 935,668Seminole Co-op* - - - - -Starke 12,106 61,277 0 0 24,926Sumter Co-op 13,183 14,479 633,415 45,394 16,564Suwannee Valley Co-op 13,170 31,647 2,351,132 3,509 20,708Tallahassee 11,744 18,187 293,532 166,295 24,573Talquin Co-op 15,039 20,848 951,281 20,109,930 20,081Tri-County Co-op 11,013 15,996 719,174 14,086 16,576Vero Beach 13,796 19,211 403,045 37,598 22,415Wauchula 13,183 35,356 1,513,540 57,409 24,104West Florida Co-op 13,701 13,513 14,935 45,536 14,366Williston 11,144 25,338 276,264 13,158 21,953Winter Park 1,067 1,503 4,400,379 71,027 2,232Withlacoochee Co-op 14,735 41,721 4,636,420 47,932 18,495
Respondent Average 13,747 71,824 522,714 110,324 23,390
N/A=Not Applicable*Okefenoke Rural EMC sells power in Florida and Georgia; figures reflect Florida customers only.**Seminole Electric Cooperative generates only for resale.
SOURCES: Tables 23 and 33 (from Form PSC/SCR - 1,4)33
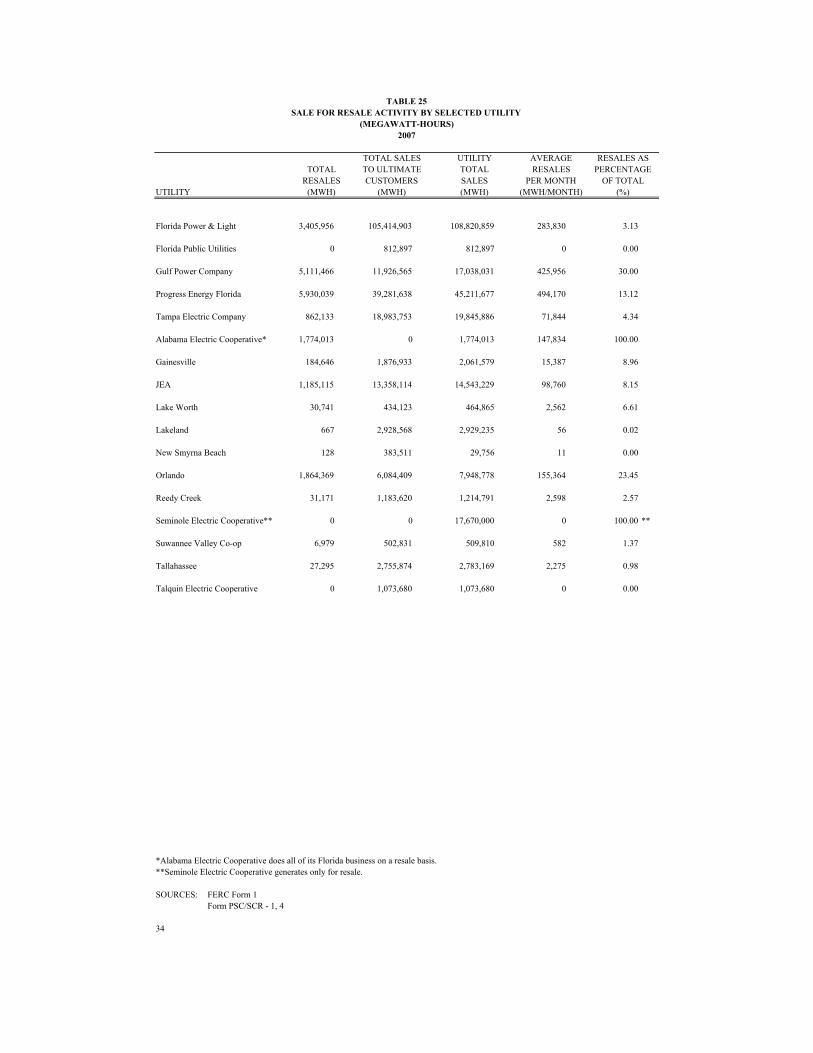
TABLE 25SALE FOR RESALE ACTIVITY BY SELECTED UTILITY
(MEGAWATT-HOURS)2007
TOTAL SALES UTILITY AVERAGE RESALES ASTOTAL TO ULTIMATE TOTAL RESALES PERCENTAGE
RESALES CUSTOMERS SALES PER MONTH OF TOTALUTILITY (MWH) (MWH) (MWH) (MWH/MONTH) (%)
Florida Power & Light 3,405,956 105,414,903 108,820,859 283,830 3.13
Florida Public Utilities 0 812,897 812,897 0 0.00
Gulf Power Company 5,111,466 11,926,565 17,038,031 425,956 30.00
Progress Energy Florida 5,930,039 39,281,638 45,211,677 494,170 13.12
Tampa Electric Company 862,133 18,983,753 19,845,886 71,844 4.34
Alabama Electric Cooperative* 1,774,013 0 1,774,013 147,834 100.00
Gainesville 184,646 1,876,933 2,061,579 15,387 8.96
JEA 1,185,115 13,358,114 14,543,229 98,760 8.15
Lake Worth 30,741 434,123 464,865 2,562 6.61
Lakeland 667 2,928,568 2,929,235 56 0.02
New Smyrna Beach 128 383,511 29,756 11 0.00
Orlando 1,864,369 6,084,409 7,948,778 155,364 23.45
Reedy Creek 31,171 1,183,620 1,214,791 2,598 2.57
Seminole Electric Cooperative** 0 0 17,670,000 0 100.00 **
Suwannee Valley Co-op 6,979 502,831 509,810 582 1.37
Tallahassee 27,295 2,755,874 2,783,169 2,275 0.98
Talquin Electric Cooperative 0 1,073,680 1,073,680 0 0.00
*Alabama Electric Cooperative does all of its Florida business on a resale basis.**Seminole Electric Cooperative generates only for resale.
SOURCES: FERC Form 1Form PSC/SCR - 1, 4
34
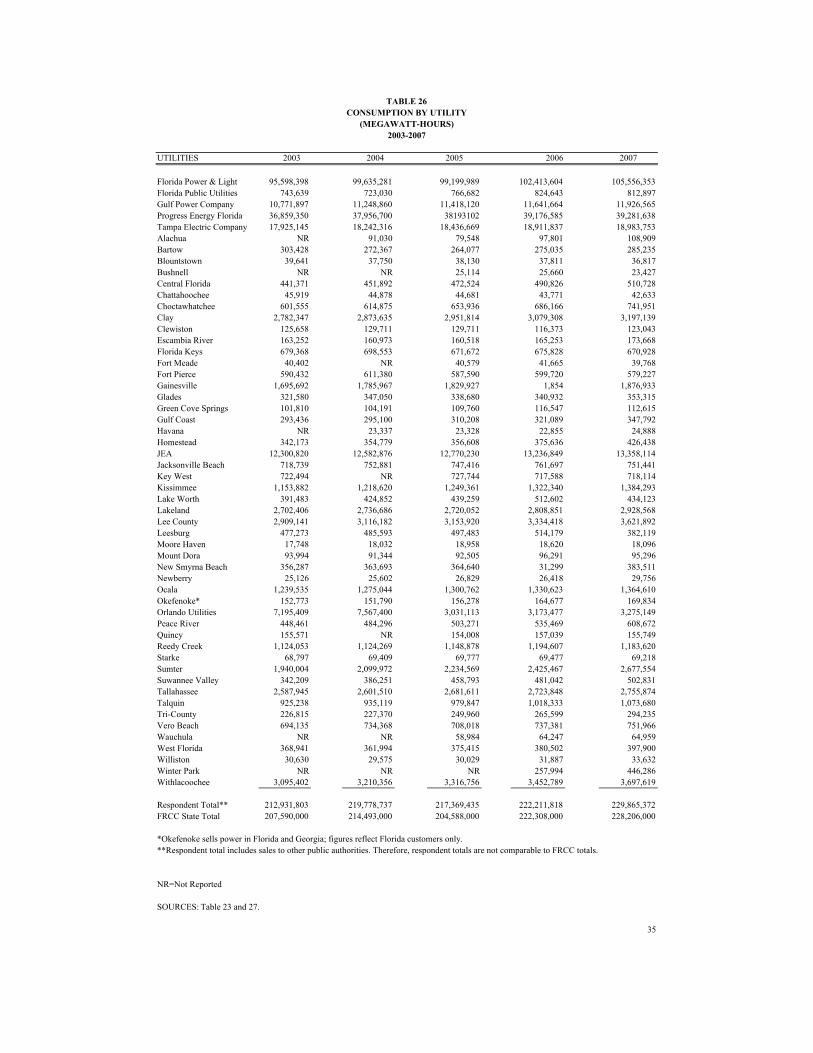
TABLE 26CONSUMPTION BY UTILITY
(MEGAWATT-HOURS)2003-2007
UTILITIES 2003 2004 2005 2006 2007
Florida Power & Light 95,598,398 99,635,281 99,199,989 102,413,604 105,556,353Florida Public Utilities 743,639 723,030 766,682 824,643 812,897Gulf Power Company 10,771,897 11,248,860 11,418,120 11,641,664 11,926,565Progress Energy Florida 36,859,350 37,956,700 38193102 39,176,585 39,281,638Tampa Electric Company 17,925,145 18,242,316 18,436,669 18,911,837 18,983,753Alachua NR 91,030 79,548 97,801 108,909Bartow 303,428 272,367 264,077 275,035 285,235Blountstown 39,641 37,750 38,130 37,811 36,817Bushnell NR NR 25,114 25,660 23,427Central Florida 441,371 451,892 472,524 490,826 510,728Chattahoochee 45,919 44,878 44,681 43,771 42,633Choctawhatchee 601,555 614,875 653,936 686,166 741,951Clay 2,782,347 2,873,635 2,951,814 3,079,308 3,197,139Clewiston 125,658 129,711 129,711 116,373 123,043Escambia River 163,252 160,973 160,518 165,253 173,668Florida Keys 679,368 698,553 671,672 675,828 670,928Fort Meade 40,402 NR 40,579 41,665 39,768Fort Pierce 590,432 611,380 587,590 599,720 579,227Gainesville 1,695,692 1,785,967 1,829,927 1,854 1,876,933Glades 321,580 347,050 338,680 340,932 353,315Green Cove Springs 101,810 104,191 109,760 116,547 112,615Gulf Coast 293,436 295,100 310,208 321,089 347,792Havana NR 23,337 23,328 22,855 24,888Homestead 342,173 354,779 356,608 375,636 426,438JEA 12,300,820 12,582,876 12,770,230 13,236,849 13,358,114Jacksonville Beach 718,739 752,881 747,416 761,697 751,441Key West 722,494 NR 727,744 717,588 718,114Kissimmee 1,153,882 1,218,620 1,249,361 1,322,340 1,384,293Lake Worth 391,483 424,852 439,259 512,602 434,123Lakeland 2,702,406 2,736,686 2,720,052 2,808,851 2,928,568Lee County 2,909,141 3,116,182 3,153,920 3,334,418 3,621,892Leesburg 477,273 485,593 497,483 514,179 382,119Moore Haven 17,748 18,032 18,958 18,620 18,096Mount Dora 93,994 91,344 92,505 96,291 95,296New Smyrna Beach 356,287 363,693 364,640 31,299 383,511Newberry 25,126 25,602 26,829 26,418 29,756Ocala 1,239,535 1,275,044 1,300,762 1,330,623 1,364,610Okefenoke* 152,773 151,790 156,278 164,677 169,834Orlando Utilities 7,195,409 7,567,400 3,031,113 3,173,477 3,275,149Peace River 448,461 484,296 503,271 535,469 608,672Quincy 155,571 NR 154,008 157,039 155,749Reedy Creek 1,124,053 1,124,269 1,148,878 1,194,607 1,183,620Starke 68,797 69,409 69,777 69,477 69,218Sumter 1,940,004 2,099,972 2,234,569 2,425,467 2,677,554Suwannee Valley 342,209 386,251 458,793 481,042 502,831Tallahassee 2,587,945 2,601,510 2,681,611 2,723,848 2,755,874Talquin 925,238 935,119 979,847 1,018,333 1,073,680Tri-County 226,815 227,370 249,960 265,599 294,235Vero Beach 694,135 734,368 708,018 737,381 751,966Wauchula NR NR 58,984 64,247 64,959West Florida 368,941 361,994 375,415 380,502 397,900Williston 30,630 29,575 30,029 31,887 33,632Winter Park NR NR NR 257,994 446,286Withlacoochee 3,095,402 3,210,356 3,316,756 3,452,789 3,697,619
Respondent Total** 212,931,803 219,778,737 217,369,435 222,211,818 229,865,372FRCC State Total 207,590,000 214,493,000 204,588,000 222,308,000 228,206,000
*Okefenoke sells power in Florida and Georgia; figures reflect Florida customers only.**Respondent total includes sales to other public authorities. Therefore, respondent totals are not comparable to FRCC totals.
NR=Not Reported
SOURCES: Table 23 and 27.
35
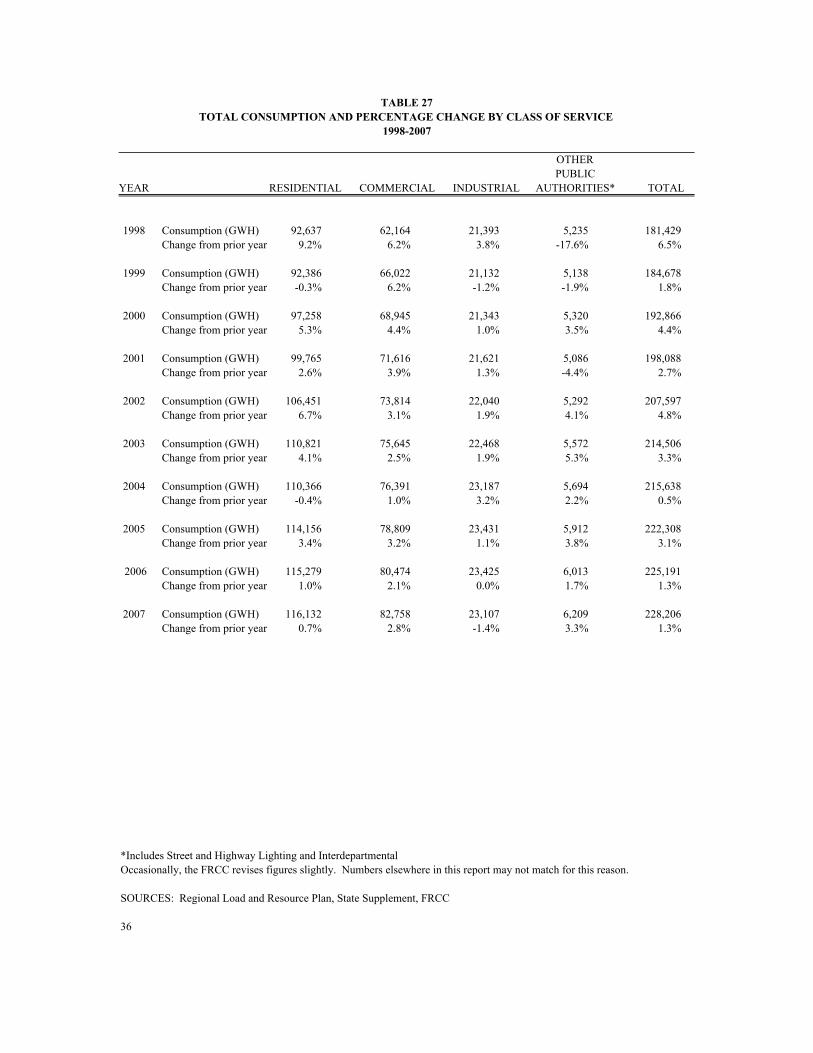
TABLE 27TOTAL CONSUMPTION AND PERCENTAGE CHANGE BY CLASS OF SERVICE
1998-2007
OTHERPUBLIC
YEAR RESIDENTIAL COMMERCIAL INDUSTRIAL AUTHORITIES* TOTAL
1998 Consumption (GWH) 92,637 62,164 21,393 5,235 181,429Change from prior year 9.2% 6.2% 3.8% -17.6% 6.5%
1999 Consumption (GWH) 92,386 66,022 21,132 5,138 184,678Change from prior year -0.3% 6.2% -1.2% -1.9% 1.8%
2000 Consumption (GWH) 97,258 68,945 21,343 5,320 192,866Change from prior year 5.3% 4.4% 1.0% 3.5% 4.4%
2001 Consumption (GWH) 99,765 71,616 21,621 5,086 198,088Change from prior year 2.6% 3.9% 1.3% -4.4% 2.7%
2002 Consumption (GWH) 106,451 73,814 22,040 5,292 207,597Change from prior year 6.7% 3.1% 1.9% 4.1% 4.8%
2003 Consumption (GWH) 110,821 75,645 22,468 5,572 214,506Change from prior year 4.1% 2.5% 1.9% 5.3% 3.3%
2004 Consumption (GWH) 110,366 76,391 23,187 5,694 215,638Change from prior year -0.4% 1.0% 3.2% 2.2% 0.5%
2005 Consumption (GWH) 114,156 78,809 23,431 5,912 222,308Change from prior year 3.4% 3.2% 1.1% 3.8% 3.1%
2006 Consumption (GWH) 115,279 80,474 23,425 6,013 225,191Change from prior year 1.0% 2.1% 0.0% 1.7% 1.3%
2007 Consumption (GWH) 116,132 82,758 23,107 6,209 228,206Change from prior year 0.7% 2.8% -1.4% 3.3% 1.3%
*Includes Street and Highway Lighting and InterdepartmentalOccasionally, the FRCC revises figures slightly. Numbers elsewhere in this report may not match for this reason.
SOURCES: Regional Load and Resource Plan, State Supplement, FRCC
36
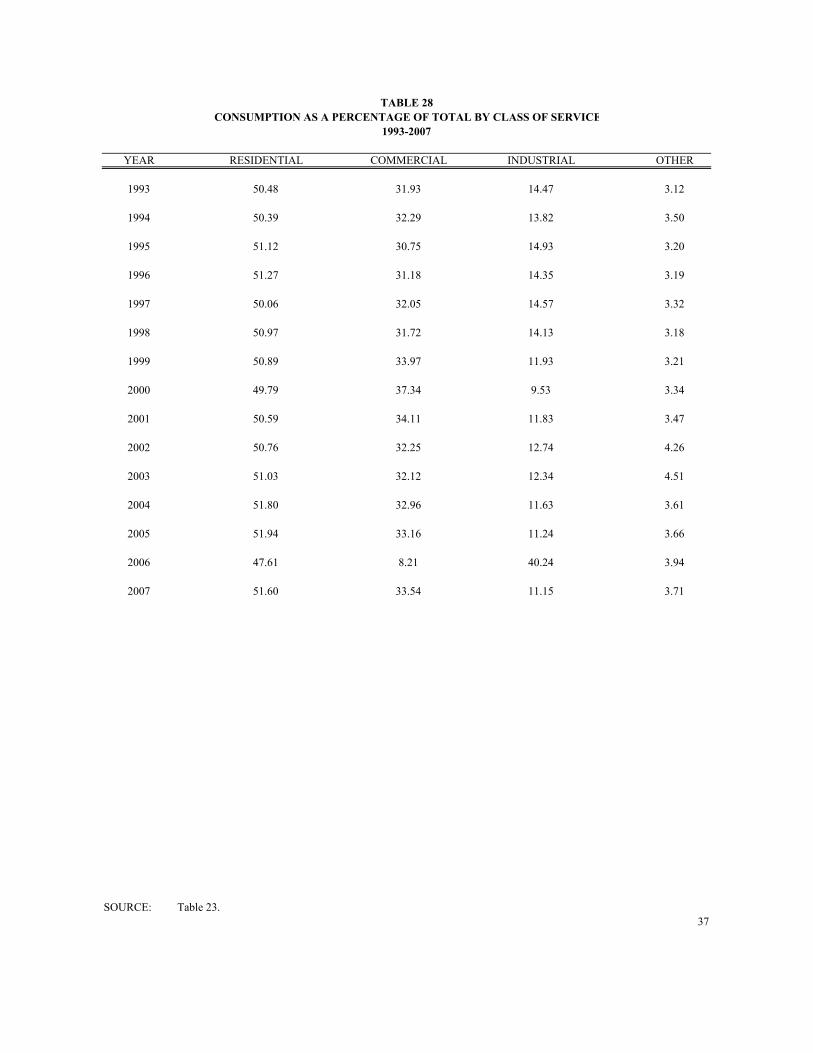
TABLE 28CONSUMPTION AS A PERCENTAGE OF TOTAL BY CLASS OF SERVICE
1993-2007
YEAR RESIDENTIAL COMMERCIAL INDUSTRIAL OTHER
1993 50.48 31.93 14.47 3.12
1994 50.39 32.29 13.82 3.50
1995 51.12 30.75 14.93 3.20
1996 51.27 31.18 14.35 3.19
1997 50.06 32.05 14.57 3.32
1998 50.97 31.72 14.13 3.18
1999 50.89 33.97 11.93 3.21
2000 49.79 37.34 9.53 3.34
2001 50.59 34.11 11.83 3.47
2002 50.76 32.25 12.74 4.26
2003 51.03 32.12 12.34 4.51
2004 51.80 32.96 11.63 3.61
2005 51.94 33.16 11.24 3.66
2006 47.61 8.21 40.24 3.94
2007 51.60 33.54 11.15 3.71
SOURCE: Table 23.37


REVENUES

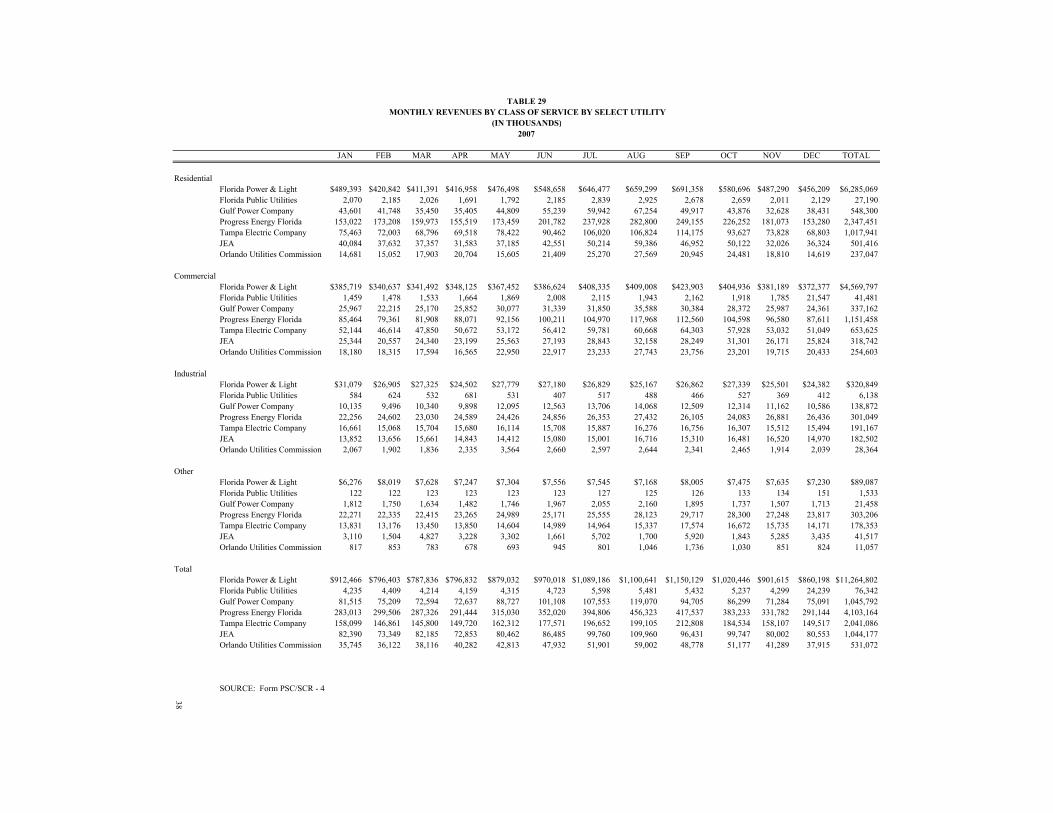
TABLE 29
(IN THOUSANDS)2007
JAN FEB MAR APR MAY JUN JUL AUG SEP OCT NOV DEC TOTAL
ResidentialFlorida Power & Light $489,393 $420,842 $411,391 $416,958 $476,498 $548,658 $646,477 $659,299 $691,358 $580,696 $487,290 $456,209 $6,285,069Florida Public Utilities 2,070 2,185 2,026 1,691 1,792 2,185 2,839 2,925 2,678 2,659 2,011 2,129 27,190Gulf Power Company 43,601 41,748 35,450 35,405 44,809 55,239 59,942 67,254 49,917 43,876 32,628 38,431 548,300Progress Energy Florida 153,022 173,208 159,973 155,519 173,459 201,782 237,928 282,800 249,155 226,252 181,073 153,280 2,347,451Tampa Electric Company 75,463 72,003 68,796 69,518 78,422 90,462 106,020 106,824 114,175 93,627 73,828 68,803 1,017,941JEA 40,084 37,632 37,357 31,583 37,185 42,551 50,214 59,386 46,952 50,122 32,026 36,324 501,416Orlando Utilities Commission 14,681 15,052 17,903 20,704 15,605 21,409 25,270 27,569 20,945 24,481 18,810 14,619 237,047
CommercialFlorida Power & Light $385,719 $340,637 $341,492 $348,125 $367,452 $386,624 $408,335 $409,008 $423,903 $404,936 $381,189 $372,377 $4,569,797Florida Public Utilities 1,459 1,478 1,533 1,664 1,869 2,008 2,115 1,943 2,162 1,918 1,785 21,547 41,481Gulf Power Company 25,967 22,215 25,170 25,852 30,077 31,339 31,850 35,588 30,384 28,372 25,987 24,361 337,162Progress Energy Florida 85,464 79,361 81,908 88,071 92,156 100,211 104,970 117,968 112,560 104,598 96,580 87,611 1,151,458Tampa Electric Company 52,144 46,614 47,850 50,672 53,172 56,412 59,781 60,668 64,303 57,928 53,032 51,049 653,625JEA 25,344 20,557 24,340 23,199 25,563 27,193 28,843 32,158 28,249 31,301 26,171 25,824 318,742Orlando Utilities Commission 18,180 18,315 17,594 16,565 22,950 22,917 23,233 27,743 23,756 23,201 19,715 20,433 254,603
IndustrialFlorida Power & Light $31,079 $26,905 $27,325 $24,502 $27,779 $27,180 $26,829 $25,167 $26,862 $27,339 $25,501 $24,382 $320,849Florida Public Utilities 584 624 532 681 531 407 517 488 466 527 369 412 6,138Gulf Power Company 10,135 9,496 10,340 9,898 12,095 12,563 13,706 14,068 12,509 12,314 11,162 10,586 138,872Progress Energy Florida 22,256 24,602 23,030 24,589 24,426 24,856 26,353 27,432 26,105 24,083 26,881 26,436 301,049Tampa Electric Company 16,661 15,068 15,704 15,680 16,114 15,708 15,887 16,276 16,756 16,307 15,512 15,494 191,167JEA 13,852 13,656 15,661 14,843 14,412 15,080 15,001 16,716 15,310 16,481 16,520 14,970 182,502Orlando Utilities Commission 2,067 1,902 1,836 2,335 3,564 2,660 2,597 2,644 2,341 2,465 1,914 2,039 28,364
OtherFlorida Power & Light $6,276 $8,019 $7,628 $7,247 $7,304 $7,556 $7,545 $7,168 $8,005 $7,475 $7,635 $7,230 $89,087Florida Public Utilities 122 122 123 123 123 123 127 125 126 133 134 151 1,533Gulf Power Company 1,812 1,750 1,634 1,482 1,746 1,967 2,055 2,160 1,895 1,737 1,507 1,713 21,458Progress Energy Florida 22,271 22,335 22,415 23,265 24,989 25,171 25,555 28,123 29,717 28,300 27,248 23,817 303,206Tampa Electric Company 13,831 13,176 13,450 13,850 14,604 14,989 14,964 15,337 17,574 16,672 15,735 14,171 178,353JEA 3,110 1,504 4,827 3,228 3,302 1,661 5,702 1,700 5,920 1,843 5,285 3,435 41,517Orlando Utilities Commission 817 853 783 678 693 945 801 1,046 1,736 1,030 851 824 11,057
TotalFlorida Power & Light $912,466 $796,403 $787,836 $796,832 $879,032 $970,018 $1,089,186 $1,100,641 $1,150,129 $1,020,446 $901,615 $860,198 $11,264,802Florida Public Utilities 4,235 4,409 4,214 4,159 4,315 4,723 5,598 5,481 5,432 5,237 4,299 24,239 76,342Gulf Power Company 81,515 75,209 72,594 72,637 88,727 101,108 107,553 119,070 94,705 86,299 71,284 75,091 1,045,792Progress Energy Florida 283,013 299,506 287,326 291,444 315,030 352,020 394,806 456,323 417,537 383,233 331,782 291,144 4,103,164Tampa Electric Company 158,099 146,861 145,800 149,720 162,312 177,571 196,652 199,105 212,808 184,534 158,107 149,517 2,041,086JEA 82,390 73,349 82,185 72,853 80,462 86,485 99,760 109,960 96,431 99,747 80,002 80,553 1,044,177Orlando Utilities Commission 35,745 36,122 38,116 40,282 42,813 47,932 51,901 59,002 48,778 51,177 41,289 37,915 531,072
SOURCE: Form PSC/SCR - 4
38
MONTHLY REVENUES BY CLASS OF SERVICE BY SELECT UTILITY
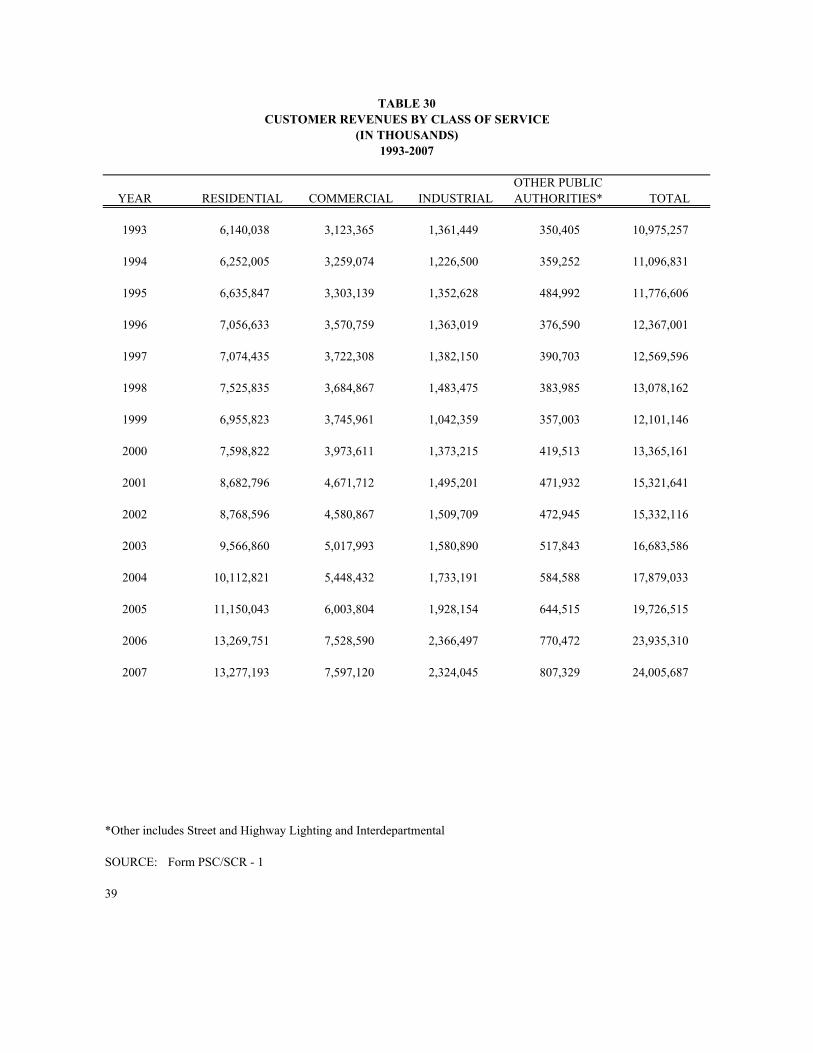
TABLE 30CUSTOMER REVENUES BY CLASS OF SERVICE
(IN THOUSANDS)1993-2007
OTHER PUBLICYEAR RESIDENTIAL COMMERCIAL INDUSTRIAL AUTHORITIES* TOTAL
1993 6,140,038 3,123,365 1,361,449 350,405 10,975,257
1994 6,252,005 3,259,074 1,226,500 359,252 11,096,831
1995 6,635,847 3,303,139 1,352,628 484,992 11,776,606
1996 7,056,633 3,570,759 1,363,019 376,590 12,367,001
1997 7,074,435 3,722,308 1,382,150 390,703 12,569,596
1998 7,525,835 3,684,867 1,483,475 383,985 13,078,162
1999 6,955,823 3,745,961 1,042,359 357,003 12,101,146
2000 7,598,822 3,973,611 1,373,215 419,513 13,365,161
2001 8,682,796 4,671,712 1,495,201 471,932 15,321,641
2002 8,768,596 4,580,867 1,509,709 472,945 15,332,116
2003 9,566,860 5,017,993 1,580,890 517,843 16,683,586
2004 10,112,821 5,448,432 1,733,191 584,588 17,879,033
2005 11,150,043 6,003,804 1,928,154 644,515 19,726,515
2006 13,269,751 7,528,590 2,366,497 770,472 23,935,310
2007 13,277,193 7,597,120 2,324,045 807,329 24,005,687
*Other includes Street and Highway Lighting and Interdepartmental
SOURCE: Form PSC/SCR - 1
39
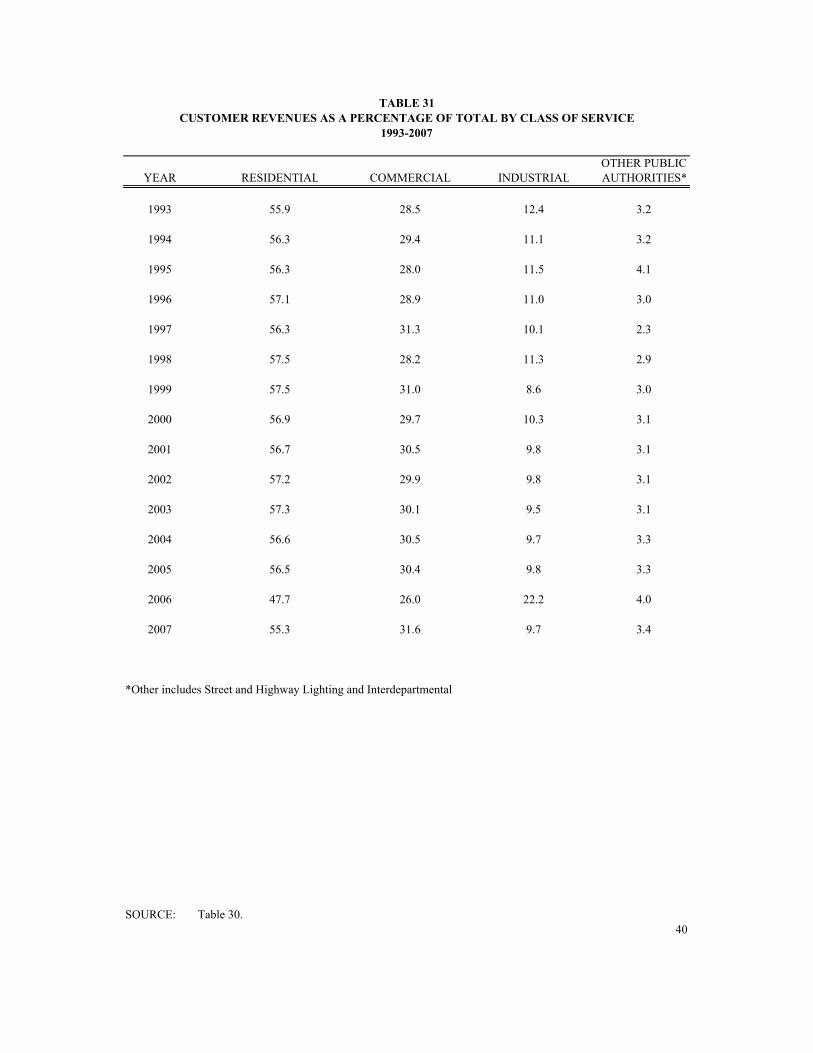
TABLE 31CUSTOMER REVENUES AS A PERCENTAGE OF TOTAL BY CLASS OF SERVICE
1993-2007
OTHER PUBLICYEAR RESIDENTIAL COMMERCIAL INDUSTRIAL AUTHORITIES*
1993 55.9 28.5 12.4 3.2
1994 56.3 29.4 11.1 3.2
1995 56.3 28.0 11.5 4.1
1996 57.1 28.9 11.0 3.0
1997 56.3 31.3 10.1 2.3
1998 57.5 28.2 11.3 2.9
1999 57.5 31.0 8.6 3.0
2000 56.9 29.7 10.3 3.1
2001 56.7 30.5 9.8 3.1
2002 57.2 29.9 9.8 3.1
2003 57.3 30.1 9.5 3.1
2004 56.6 30.5 9.7 3.3
2005 56.5 30.4 9.8 3.3
2006 47.7 26.0 22.2 4.0
2007 55.3 31.6 9.7 3.4
*Other includes Street and Highway Lighting and Interdepartmental
SOURCE: Table 30.40


NUMBER OF CUSTOMERS

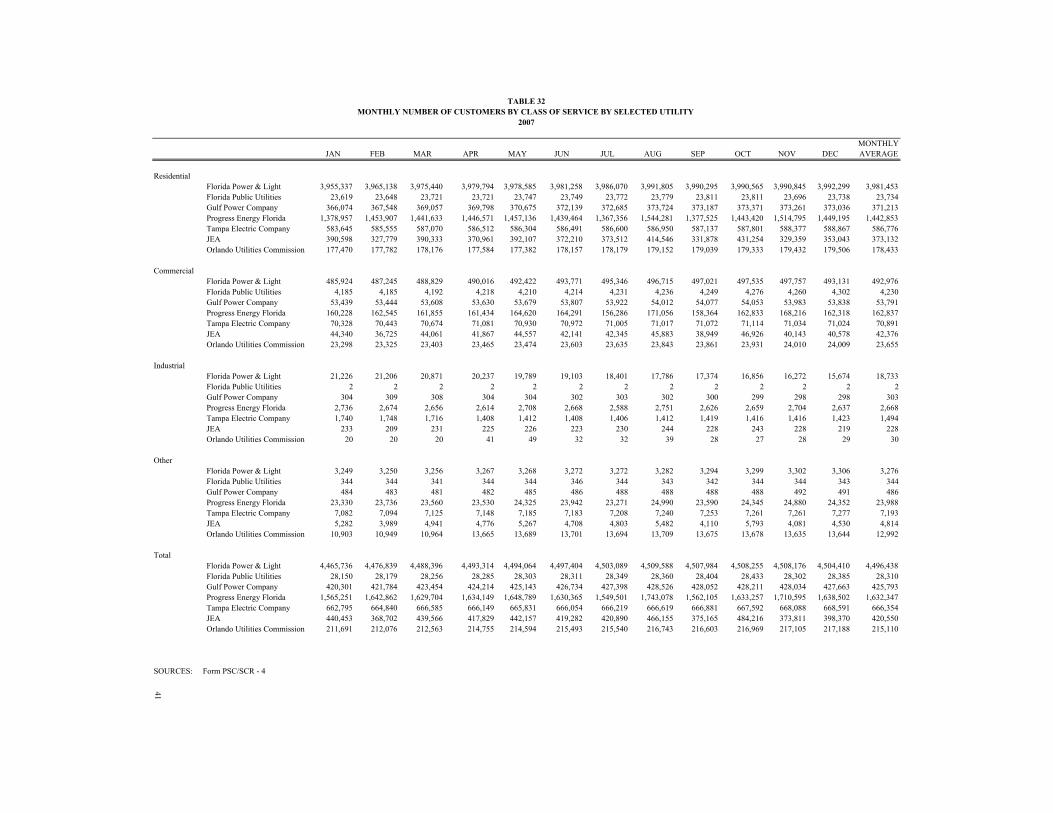
TABLE 32MONTHLY NUMBER OF CUSTOMERS BY CLASS OF SERVICE BY SELECTED UTILITY
2007
MONTHLYJAN FEB MAR APR MAY JUN JUL AUG SEP OCT NOV DEC AVERAGE
Residential Florida Power & Light 3,955,337 3,965,138 3,975,440 3,979,794 3,978,585 3,981,258 3,986,070 3,991,805 3,990,295 3,990,565 3,990,845 3,992,299 3,981,453Florida Public Utilities 23,619 23,648 23,721 23,721 23,747 23,749 23,772 23,779 23,811 23,811 23,696 23,738 23,734Gulf Power Company 366,074 367,548 369,057 369,798 370,675 372,139 372,685 373,724 373,187 373,371 373,261 373,036 371,213Progress Energy Florida 1,378,957 1,453,907 1,441,633 1,446,571 1,457,136 1,439,464 1,367,356 1,544,281 1,377,525 1,443,420 1,514,795 1,449,195 1,442,853Tampa Electric Company 583,645 585,555 587,070 586,512 586,304 586,491 586,600 586,950 587,137 587,801 588,377 588,867 586,776JEA 390,598 327,779 390,333 370,961 392,107 372,210 373,512 414,546 331,878 431,254 329,359 353,043 373,132Orlando Utilities Commission 177,470 177,782 178,176 177,584 177,382 178,157 178,179 179,152 179,039 179,333 179,432 179,506 178,433
CommercialFlorida Power & Light 485,924 487,245 488,829 490,016 492,422 493,771 495,346 496,715 497,021 497,535 497,757 493,131 492,976Florida Public Utilities 4,185 4,185 4,192 4,218 4,210 4,214 4,231 4,236 4,249 4,276 4,260 4,302 4,230Gulf Power Company 53,439 53,444 53,608 53,630 53,679 53,807 53,922 54,012 54,077 54,053 53,983 53,838 53,791Progress Energy Florida 160,228 162,545 161,855 161,434 164,620 164,291 156,286 171,056 158,364 162,833 168,216 162,318 162,837Tampa Electric Company 70,328 70,443 70,674 71,081 70,930 70,972 71,005 71,017 71,072 71,114 71,034 71,024 70,891JEA 44,340 36,725 44,061 41,867 44,557 42,141 42,345 45,883 38,949 46,926 40,143 40,578 42,376Orlando Utilities Commission 23,298 23,325 23,403 23,465 23,474 23,603 23,635 23,843 23,861 23,931 24,010 24,009 23,655
Industrial Florida Power & Light 21,226 21,206 20,871 20,237 19,789 19,103 18,401 17,786 17,374 16,856 16,272 15,674 18,733Florida Public Utilities 2 2 2 2 2 2 2 2 2 2 2 2 2Gulf Power Company 304 309 308 304 304 302 303 302 300 299 298 298 303Progress Energy Florida 2,736 2,674 2,656 2,614 2,708 2,668 2,588 2,751 2,626 2,659 2,704 2,637 2,668Tampa Electric Company 1,740 1,748 1,716 1,408 1,412 1,408 1,406 1,412 1,419 1,416 1,416 1,423 1,494JEA 233 209 231 225 226 223 230 244 228 243 228 219 228Orlando Utilities Commission 20 20 20 41 49 32 32 39 28 27 28 29 30
Other
Florida Power & Light 3,249 3,250 3,256 3,267 3,268 3,272 3,272 3,282 3,294 3,299 3,302 3,306 3,276Florida Public Utilities 344 344 341 344 344 346 344 343 342 344 344 343 344Gulf Power Company 484 483 481 482 485 486 488 488 488 488 492 491 486Progress Energy Florida 23,330 23,736 23,560 23,530 24,325 23,942 23,271 24,990 23,590 24,345 24,880 24,352 23,988Tampa Electric Company 7,082 7,094 7,125 7,148 7,185 7,183 7,208 7,240 7,253 7,261 7,261 7,277 7,193JEA 5,282 3,989 4,941 4,776 5,267 4,708 4,803 5,482 4,110 5,793 4,081 4,530 4,814Orlando Utilities Commission 10,903 10,949 10,964 13,665 13,689 13,701 13,694 13,709 13,675 13,678 13,635 13,644 12,992
Total Florida Power & Light 4,465,736 4,476,839 4,488,396 4,493,314 4,494,064 4,497,404 4,503,089 4,509,588 4,507,984 4,508,255 4,508,176 4,504,410 4,496,438Florida Public Utilities 28,150 28,179 28,256 28,285 28,303 28,311 28,349 28,360 28,404 28,433 28,302 28,385 28,310Gulf Power Company 420,301 421,784 423,454 424,214 425,143 426,734 427,398 428,526 428,052 428,211 428,034 427,663 425,793Progress Energy Florida 1,565,251 1,642,862 1,629,704 1,634,149 1,648,789 1,630,365 1,549,501 1,743,078 1,562,105 1,633,257 1,710,595 1,638,502 1,632,347Tampa Electric Company 662,795 664,840 666,585 666,149 665,831 666,054 666,219 666,619 666,881 667,592 668,088 668,591 666,354JEA 440,453 368,702 439,566 417,829 442,157 419,282 420,890 466,155 375,165 484,216 373,811 398,370 420,550Orlando Utilities Commission 211,691 212,076 212,563 214,755 214,594 215,493 215,540 216,743 216,603 216,969 217,105 217,188 215,110
SOURCES: Form PSC/SCR - 4
41
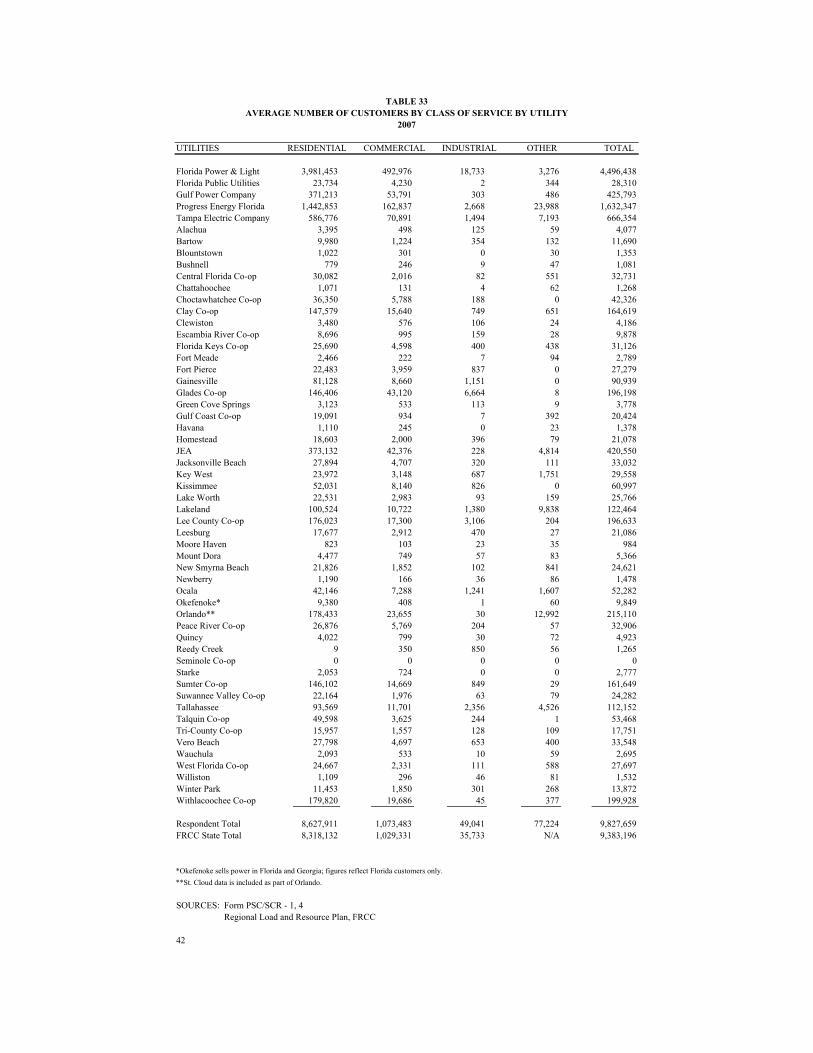
TABLE 33AVERAGE NUMBER OF CUSTOMERS BY CLASS OF SERVICE BY UTILITY
2007
UTILITIES RESIDENTIAL COMMERCIAL INDUSTRIAL OTHER TOTAL
Florida Power & Light 3,981,453 492,976 18,733 3,276 4,496,438Florida Public Utilities 23,734 4,230 2 344 28,310Gulf Power Company 371,213 53,791 303 486 425,793Progress Energy Florida 1,442,853 162,837 2,668 23,988 1,632,347Tampa Electric Company 586,776 70,891 1,494 7,193 666,354Alachua 3,395 498 125 59 4,077Bartow 9,980 1,224 354 132 11,690Blountstown 1,022 301 0 30 1,353Bushnell 779 246 9 47 1,081Central Florida Co-op 30,082 2,016 82 551 32,731Chattahoochee 1,071 131 4 62 1,268Choctawhatchee Co-op 36,350 5,788 188 0 42,326Clay Co-op 147,579 15,640 749 651 164,619Clewiston 3,480 576 106 24 4,186Escambia River Co-op 8,696 995 159 28 9,878Florida Keys Co-op 25,690 4,598 400 438 31,126Fort Meade 2,466 222 7 94 2,789Fort Pierce 22,483 3,959 837 0 27,279Gainesville 81,128 8,660 1,151 0 90,939Glades Co-op 146,406 43,120 6,664 8 196,198Green Cove Springs 3,123 533 113 9 3,778Gulf Coast Co-op 19,091 934 7 392 20,424Havana 1,110 245 0 23 1,378Homestead 18,603 2,000 396 79 21,078JEA 373,132 42,376 228 4,814 420,550Jacksonville Beach 27,894 4,707 320 111 33,032Key West 23,972 3,148 687 1,751 29,558Kissimmee 52,031 8,140 826 0 60,997Lake Worth 22,531 2,983 93 159 25,766Lakeland 100,524 10,722 1,380 9,838 122,464Lee County Co-op 176,023 17,300 3,106 204 196,633Leesburg 17,677 2,912 470 27 21,086Moore Haven 823 103 23 35 984Mount Dora 4,477 749 57 83 5,366New Smyrna Beach 21,826 1,852 102 841 24,621Newberry 1,190 166 36 86 1,478Ocala 42,146 7,288 1,241 1,607 52,282Okefenoke* 9,380 408 1 60 9,849Orlando** 178,433 23,655 30 12,992 215,110Peace River Co-op 26,876 5,769 204 57 32,906Quincy 4,022 799 30 72 4,923Reedy Creek 9 350 850 56 1,265Seminole Co-op 0 0 0 0 0Starke 2,053 724 0 0 2,777Sumter Co-op 146,102 14,669 849 29 161,649Suwannee Valley Co-op 22,164 1,976 63 79 24,282Tallahassee 93,569 11,701 2,356 4,526 112,152Talquin Co-op 49,598 3,625 244 1 53,468Tri-County Co-op 15,957 1,557 128 109 17,751Vero Beach 27,798 4,697 653 400 33,548Wauchula 2,093 533 10 59 2,695West Florida Co-op 24,667 2,331 111 588 27,697Williston 1,109 296 46 81 1,532Winter Park 11,453 1,850 301 268 13,872Withlacoochee Co-op 179,820 19,686 45 377 199,928
Respondent Total 8,627,911 1,073,483 49,041 77,224 9,827,659FRCC State Total 8,318,132 1,029,331 35,733 N/A 9,383,196
*Okefenoke sells power in Florida and Georgia; figures reflect Florida customers only.**St. Cloud data is included as part of Orlando.
SOURCES: Form PSC/SCR - 1, 4 Regional Load and Resource Plan, FRCC
42
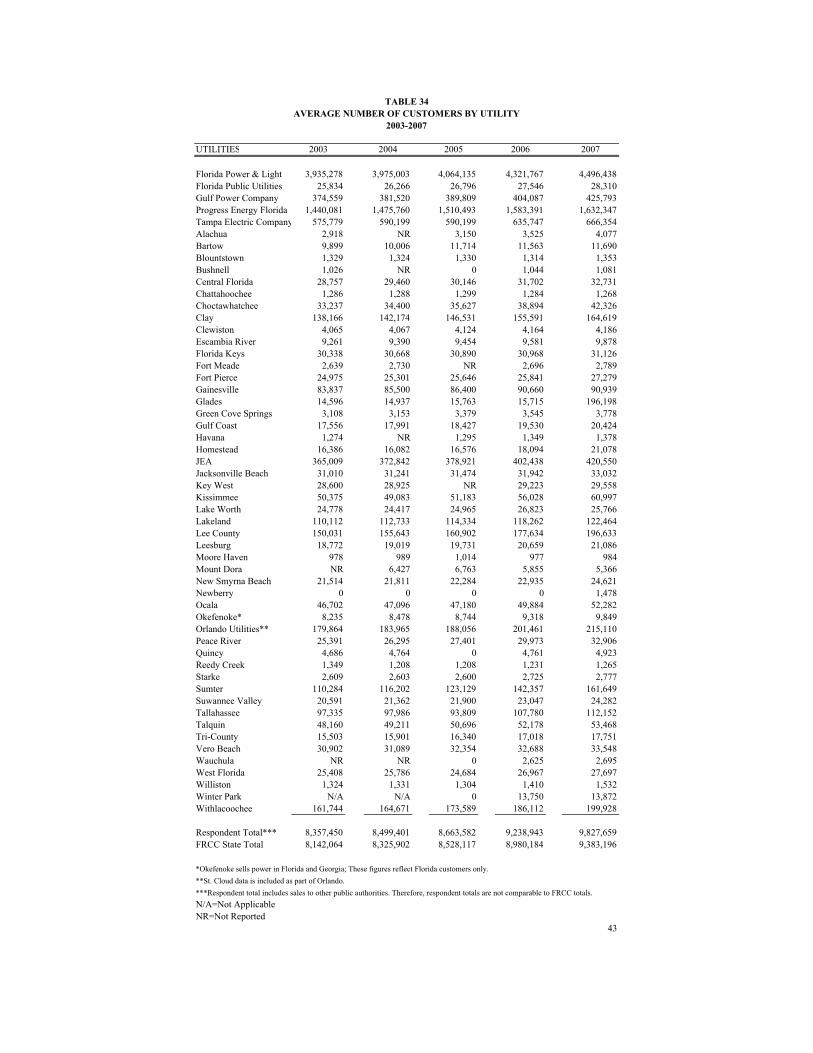
TABLE 34AVERAGE NUMBER OF CUSTOMERS BY UTILITY
2003-2007
UTILITIES 2003 2004 2005 2006 2007
Florida Power & Light 3,935,278 3,975,003 4,064,135 4,321,767 4,496,438Florida Public Utilities 25,834 26,266 26,796 27,546 28,310Gulf Power Company 374,559 381,520 389,809 404,087 425,793Progress Energy Florida 1,440,081 1,475,760 1,510,493 1,583,391 1,632,347Tampa Electric Company 575,779 590,199 590,199 635,747 666,354Alachua 2,918 NR 3,150 3,525 4,077Bartow 9,899 10,006 11,714 11,563 11,690Blountstown 1,329 1,324 1,330 1,314 1,353Bushnell 1,026 NR 0 1,044 1,081Central Florida 28,757 29,460 30,146 31,702 32,731Chattahoochee 1,286 1,288 1,299 1,284 1,268Choctawhatchee 33,237 34,400 35,627 38,894 42,326Clay 138,166 142,174 146,531 155,591 164,619Clewiston 4,065 4,067 4,124 4,164 4,186Escambia River 9,261 9,390 9,454 9,581 9,878Florida Keys 30,338 30,668 30,890 30,968 31,126Fort Meade 2,639 2,730 NR 2,696 2,789Fort Pierce 24,975 25,301 25,646 25,841 27,279Gainesville 83,837 85,500 86,400 90,660 90,939Glades 14,596 14,937 15,763 15,715 196,198Green Cove Springs 3,108 3,153 3,379 3,545 3,778Gulf Coast 17,556 17,991 18,427 19,530 20,424Havana 1,274 NR 1,295 1,349 1,378Homestead 16,386 16,082 16,576 18,094 21,078JEA 365,009 372,842 378,921 402,438 420,550Jacksonville Beach 31,010 31,241 31,474 31,942 33,032Key West 28,600 28,925 NR 29,223 29,558Kissimmee 50,375 49,083 51,183 56,028 60,997Lake Worth 24,778 24,417 24,965 26,823 25,766Lakeland 110,112 112,733 114,334 118,262 122,464Lee County 150,031 155,643 160,902 177,634 196,633Leesburg 18,772 19,019 19,731 20,659 21,086Moore Haven 978 989 1,014 977 984Mount Dora NR 6,427 6,763 5,855 5,366New Smyrna Beach 21,514 21,811 22,284 22,935 24,621Newberry 0 0 0 0 1,478Ocala 46,702 47,096 47,180 49,884 52,282Okefenoke* 8,235 8,478 8,744 9,318 9,849Orlando Utilities** 179,864 183,965 188,056 201,461 215,110Peace River 25,391 26,295 27,401 29,973 32,906Quincy 4,686 4,764 0 4,761 4,923Reedy Creek 1,349 1,208 1,208 1,231 1,265Starke 2,609 2,603 2,600 2,725 2,777Sumter 110,284 116,202 123,129 142,357 161,649Suwannee Valley 20,591 21,362 21,900 23,047 24,282Tallahassee 97,335 97,986 93,809 107,780 112,152Talquin 48,160 49,211 50,696 52,178 53,468Tri-County 15,503 15,901 16,340 17,018 17,751Vero Beach 30,902 31,089 32,354 32,688 33,548Wauchula NR NR 0 2,625 2,695West Florida 25,408 25,786 24,684 26,967 27,697Williston 1,324 1,331 1,304 1,410 1,532Winter Park N/A N/A 0 13,750 13,872Withlacoochee 161,744 164,671 173,589 186,112 199,928
Respondent Total*** 8,357,450 8,499,401 8,663,582 9,238,943 9,827,659FRCC State Total 8,142,064 8,325,902 8,528,117 8,980,184 9,383,196
*Okefenoke sells power in Florida and Georgia; These figures reflect Florida customers only.**St. Cloud data is included as part of Orlando.***Respondent total includes sales to other public authorities. Therefore, respondent totals are not comparable to FRCC totals.N/A=Not ApplicableNR=Not Reported
43
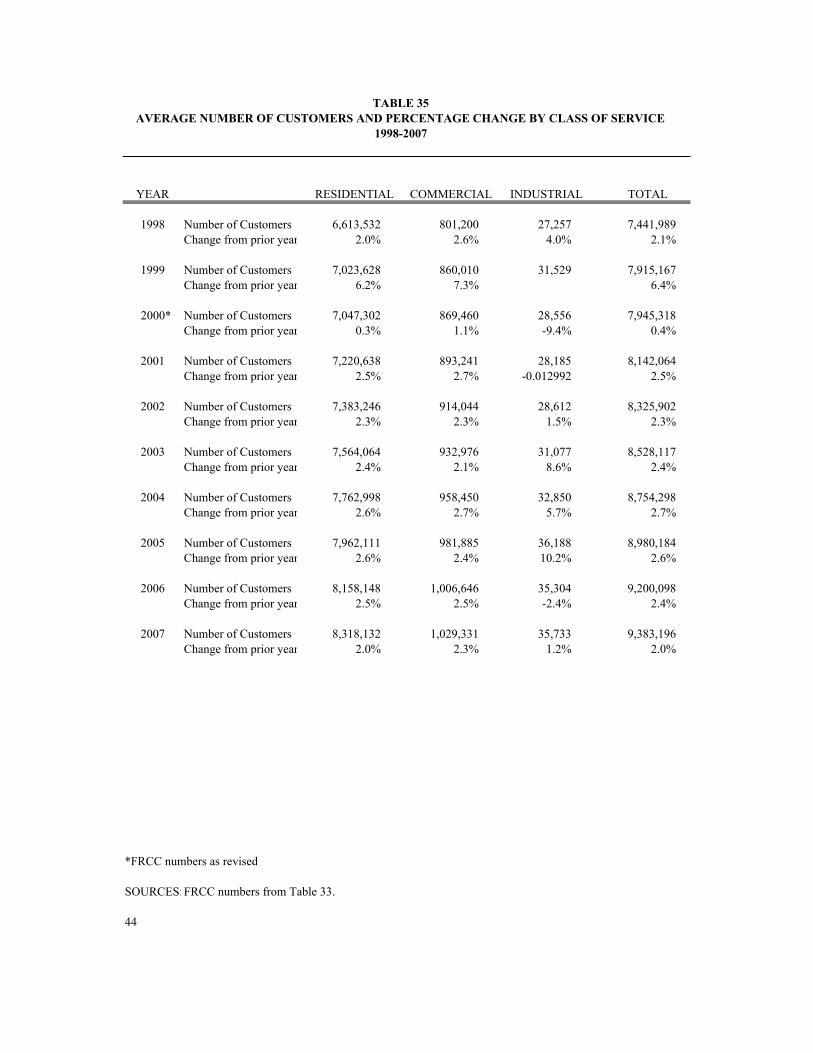
TABLE 35AVERAGE NUMBER OF CUSTOMERS AND PERCENTAGE CHANGE BY CLASS OF SERVICE
1998-2007
YEAR RESIDENTIAL COMMERCIAL INDUSTRIAL TOTAL
1998 Number of Customers 6,613,532 801,200 27,257 7,441,989Change from prior year 2.0% 2.6% 4.0% 2.1%
1999 Number of Customers 7,023,628 860,010 31,529 7,915,167Change from prior year 6.2% 7.3% 6.4%
2000* Number of Customers 7,047,302 869,460 28,556 7,945,318Change from prior year 0.3% 1.1% -9.4% 0.4%
2001 Number of Customers 7,220,638 893,241 28,185 8,142,064Change from prior year 2.5% 2.7% -0.012992 2.5%
2002 Number of Customers 7,383,246 914,044 28,612 8,325,902Change from prior year 2.3% 2.3% 1.5% 2.3%
2003 Number of Customers 7,564,064 932,976 31,077 8,528,117Change from prior year 2.4% 2.1% 8.6% 2.4%
2004 Number of Customers 7,762,998 958,450 32,850 8,754,298Change from prior year 2.6% 2.7% 5.7% 2.7%
2005 Number of Customers 7,962,111 981,885 36,188 8,980,184Change from prior year 2.6% 2.4% 10.2% 2.6%
2006 Number of Customers 8,158,148 1,006,646 35,304 9,200,098Change from prior year 2.5% 2.5% -2.4% 2.4%
2007 Number of Customers 8,318,132 1,029,331 35,733 9,383,196Change from prior year 2.0% 2.3% 1.2% 2.0%
*FRCC numbers as revised
SOURCES:FRCC numbers from Table 33.
44
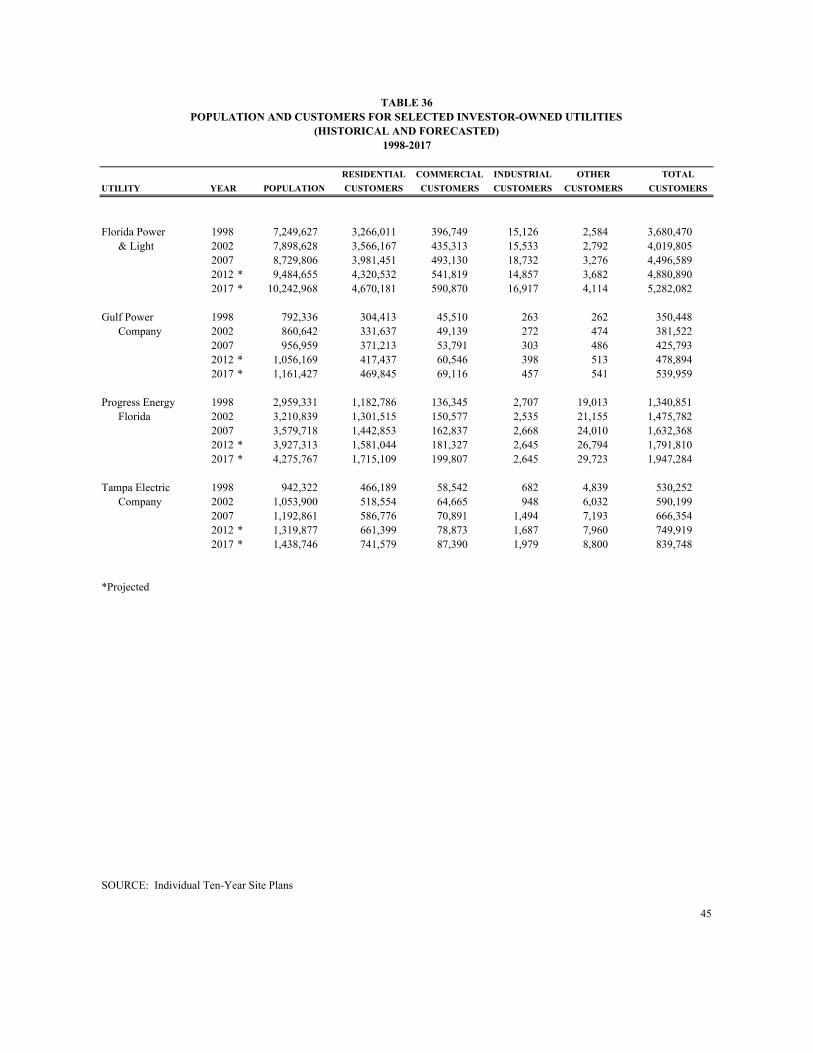
TABLE 36POPULATION AND CUSTOMERS FOR SELECTED INVESTOR-OWNED UTILITIES
(HISTORICAL AND FORECASTED)1998-2017
RESIDENTIAL COMMERCIAL INDUSTRIAL OTHER TOTALUTILITY YEAR POPULATION CUSTOMERS CUSTOMERS
Florida Power 1998 7,249,627 3,266,011 396,749 15,126 2,584 3,680,470 & Light 2002 7,898,628 3,566,167 435,313 15,533 2,792 4,019,805
2007 8,729,806 3,981,451 493,130 18,732 3,276 4,496,5892012 * 9,484,655 4,320,532 541,819 14,857 3,682 4,880,8902017 * 10,242,968 4,670,181 590,870 16,917 4,114 5,282,082
Gulf Power 1998 792,336 304,413 45,510 263 262 350,448 Company 2002 860,642 331,637 49,139 272 474 381,522
2007 956,959 371,213 53,791 303 486 425,7932012 * 1,056,169 417,437 60,546 398 513 478,8942017 * 1,161,427 469,845 69,116 457 541 539,959
Progress Energy 1998 2,959,331 1,182,786 136,345 2,707 19,013 1,340,851 Florida 2002 3,210,839 1,301,515 150,577 2,535 21,155 1,475,782
2007 3,579,718 1,442,853 162,837 2,668 24,010 1,632,3682012 * 3,927,313 1,581,044 181,327 2,645 26,794 1,791,8102017 * 4,275,767 1,715,109 199,807 2,645 29,723 1,947,284
Tampa Electric 1998 942,322 466,189 58,542 682 4,839 530,252 Company 2002 1,053,900 518,554 64,665 948 6,032 590,199
2007 1,192,861 586,776 70,891 1,494 7,193 666,3542012 * 1,319,877 661,399 78,873 1,687 7,960 749,9192017 * 1,438,746 741,579 87,390 1,979 8,800 839,748
*Projected
SOURCE: Individual Ten-Year Site Plans
45
CUSTOMERS CUSTOMERS CUSTOMERS


PRICES

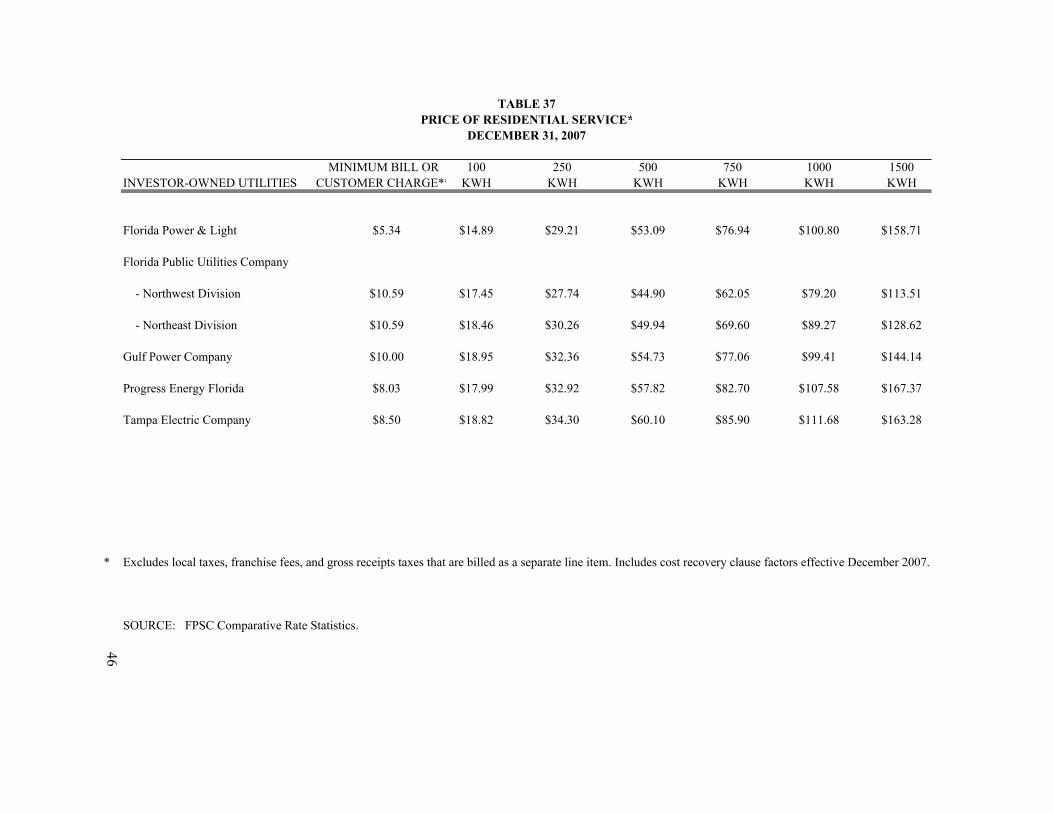
TABLE 37PRICE OF RESIDENTIAL SERVICE*
DECEMBER 31, 2007
MINIMUM BILL OR 100 250 500 750 1000 1500INVESTOR-OWNED UTILITIES CUSTOMER CHARGE** KWH KWH KWH KWH KWH KWH
Florida Power & Light $5.34 $14.89 $29.21 $53.09 $76.94 $100.80 $158.71
Florida Public Utilities Company
- Northwest Division $10.59 $17.45 $27.74 $44.90 $62.05 $79.20 $113.51
- Northeast Division $10.59 $18.46 $30.26 $49.94 $69.60 $89.27 $128.62
Gulf Power Company $10.00 $18.95 $32.36 $54.73 $77.06 $99.41 $144.14
Progress Energy Florida $8.03 $17.99 $32.92 $57.82 $82.70 $107.58 $167.37
Tampa Electric Company $8.50 $18.82 $34.30 $60.10 $85.90 $111.68 $163.28
* Excludes local taxes, franchise fees, and gross receipts taxes that are billed as a separate line item. Includes cost recovery clause factors effective December 2007.
SOURCE: FPSC Comparative Rate Statistics.
46
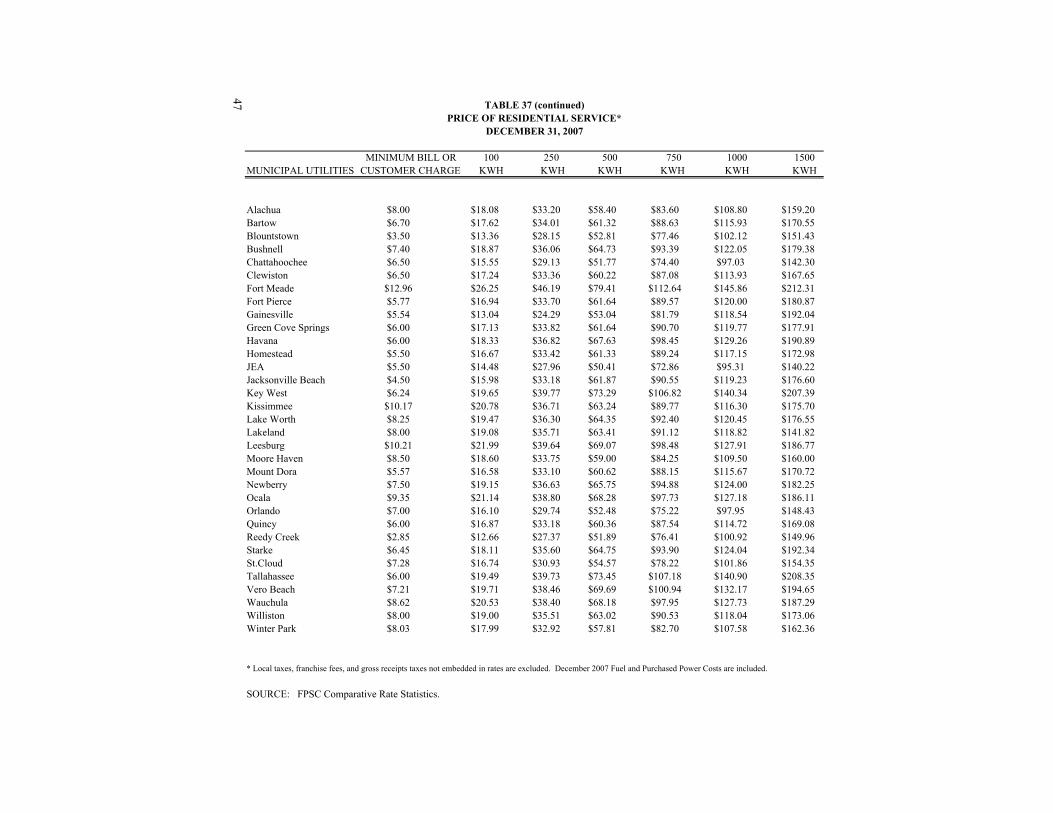
47 TABLE 37 (continued)PRICE OF RESIDENTIAL SERVICE*
DECEMBER 31, 2007
MINIMUM BILL OR 100 250 500 750 1000 1500MUNICIPAL UTILITIES CUSTOMER CHARGE KWH KWH KWH KWH KWH KWH
Alachua $8.00 $18.08 $33.20 $58.40 $83.60 $108.80 $159.20Bartow $6.70 $17.62 $34.01 $61.32 $88.63 $115.93 $170.55Blountstown $3.50 $13.36 $28.15 $52.81 $77.46 $102.12 $151.43Bushnell $7.40 $18.87 $36.06 $64.73 $93.39 $122.05 $179.38Chattahoochee $6.50 $15.55 $29.13 $51.77 $74.40 $97.03 $142.30Clewiston $6.50 $17.24 $33.36 $60.22 $87.08 $113.93 $167.65Fort Meade $12.96 $26.25 $46.19 $79.41 $112.64 $145.86 $212.31Fort Pierce $5.77 $16.94 $33.70 $61.64 $89.57 $120.00 $180.87Gainesville $5.54 $13.04 $24.29 $53.04 $81.79 $118.54 $192.04Green Cove Springs $6.00 $17.13 $33.82 $61.64 $90.70 $119.77 $177.91Havana $6.00 $18.33 $36.82 $67.63 $98.45 $129.26 $190.89Homestead $5.50 $16.67 $33.42 $61.33 $89.24 $117.15 $172.98JEA $5.50 $14.48 $27.96 $50.41 $72.86 $95.31 $140.22Jacksonville Beach $4.50 $15.98 $33.18 $61.87 $90.55 $119.23 $176.60Key West $6.24 $19.65 $39.77 $73.29 $106.82 $140.34 $207.39Kissimmee $10.17 $20.78 $36.71 $63.24 $89.77 $116.30 $175.70Lake Worth $8.25 $19.47 $36.30 $64.35 $92.40 $120.45 $176.55Lakeland $8.00 $19.08 $35.71 $63.41 $91.12 $118.82 $141.82Leesburg $10.21 $21.99 $39.64 $69.07 $98.48 $127.91 $186.77Moore Haven $8.50 $18.60 $33.75 $59.00 $84.25 $109.50 $160.00Mount Dora $5.57 $16.58 $33.10 $60.62 $88.15 $115.67 $170.72Newberry $7.50 $19.15 $36.63 $65.75 $94.88 $124.00 $182.25Ocala $9.35 $21.14 $38.80 $68.28 $97.73 $127.18 $186.11Orlando $7.00 $16.10 $29.74 $52.48 $75.22 $97.95 $148.43Quincy $6.00 $16.87 $33.18 $60.36 $87.54 $114.72 $169.08Reedy Creek $2.85 $12.66 $27.37 $51.89 $76.41 $100.92 $149.96Starke $6.45 $18.11 $35.60 $64.75 $93.90 $124.04 $192.34St.Cloud $7.28 $16.74 $30.93 $54.57 $78.22 $101.86 $154.35Tallahassee $6.00 $19.49 $39.73 $73.45 $107.18 $140.90 $208.35Vero Beach $7.21 $19.71 $38.46 $69.69 $100.94 $132.17 $194.65Wauchula $8.62 $20.53 $38.40 $68.18 $97.95 $127.73 $187.29Williston $8.00 $19.00 $35.51 $63.02 $90.53 $118.04 $173.06Winter Park $8.03 $17.99 $32.92 $57.81 $82.70 $107.58 $162.36
* Local taxes, franchise fees, and gross receipts taxes not embedded in rates are excluded. December 2007 Fuel and Purchased Power Costs are included.
SOURCE: FPSC Comparative Rate Statistics.
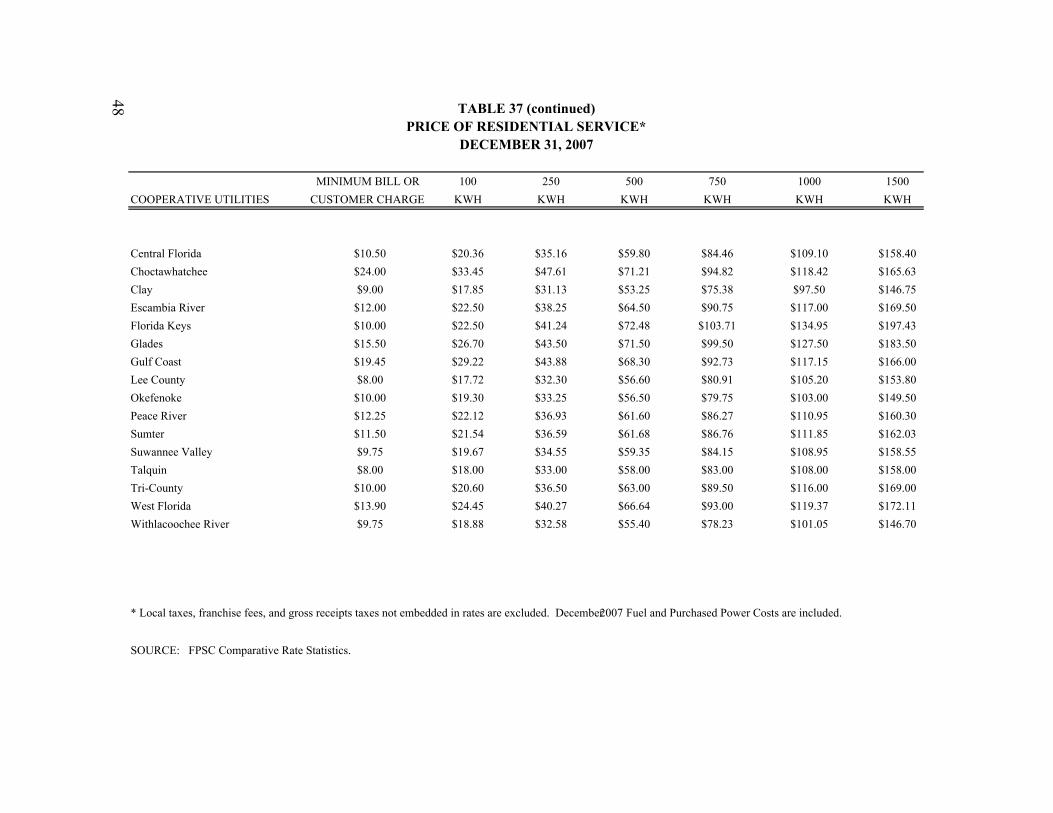
48 TABLE 37 (continued)PRICE OF RESIDENTIAL SERVICE*
DECEMBER 31, 2007
MINIMUM BILL OR 100 250 500 750 1000 1500COOPERATIVE UTILITIES CUSTOMER CHARGE KWH KWH KWH KWH KWH KWH
Central Florida $10.50 $20.36 $35.16 $59.80 $84.46 $109.10 $158.40Choctawhatchee $24.00 $33.45 $47.61 $71.21 $94.82 $118.42 $165.63Clay $9.00 $17.85 $31.13 $53.25 $75.38 $97.50 $146.75Escambia River $12.00 $22.50 $38.25 $64.50 $90.75 $117.00 $169.50Florida Keys $10.00 $22.50 $41.24 $72.48 $103.71 $134.95 $197.43Glades $15.50 $26.70 $43.50 $71.50 $99.50 $127.50 $183.50Gulf Coast $19.45 $29.22 $43.88 $68.30 $92.73 $117.15 $166.00Lee County $8.00 $17.72 $32.30 $56.60 $80.91 $105.20 $153.80Okefenoke $10.00 $19.30 $33.25 $56.50 $79.75 $103.00 $149.50Peace River $12.25 $22.12 $36.93 $61.60 $86.27 $110.95 $160.30Sumter $11.50 $21.54 $36.59 $61.68 $86.76 $111.85 $162.03Suwannee Valley $9.75 $19.67 $34.55 $59.35 $84.15 $108.95 $158.55Talquin $8.00 $18.00 $33.00 $58.00 $83.00 $108.00 $158.00Tri-County $10.00 $20.60 $36.50 $63.00 $89.50 $116.00 $169.00West Florida $13.90 $24.45 $40.27 $66.64 $93.00 $119.37 $172.11Withlacoochee River $9.75 $18.88 $32.58 $55.40 $78.23 $101.05 $146.70
* Local taxes, franchise fees, and gross receipts taxes not embedded in rates are excluded. December 2007 Fuel and Purchased Power Costs are included.
SOURCE: FPSC Comparative Rate Statistics.
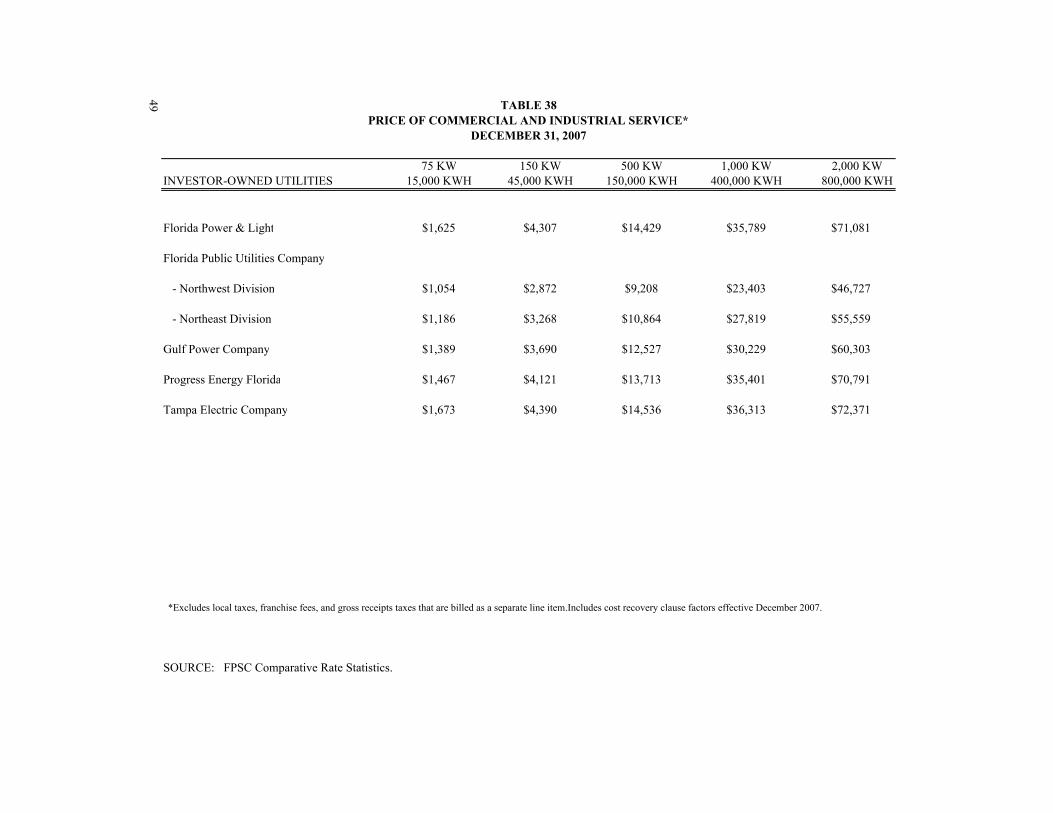
49 TABLE 38PRICE OF COMMERCIAL AND INDUSTRIAL SERVICE*
DECEMBER 31, 2007
75 KW 150 KW 500 KW 1,000 KW 2,000 KWINVESTOR-OWNED UTILITIES 15,000 KWH 45,000 KWH 150,000 KWH 400,000 KWH 800,000 KWH
Florida Power & Light $1,625 $4,307 $14,429 $35,789 $71,081
Florida Public Utilities Company
- Northwest Division $1,054 $2,872 $9,208 $23,403 $46,727
- Northeast Division $1,186 $3,268 $10,864 $27,819 $55,559
Gulf Power Company $1,389 $3,690 $12,527 $30,229 $60,303
Progress Energy Florida $1,467 $4,121 $13,713 $35,401 $70,791
Tampa Electric Company $1,673 $4,390 $14,536 $36,313 $72,371
*Excludes local taxes, franchise fees, and gross receipts taxes that are billed as a separate line item.Includes cost recovery clause factors effective December 2007.
SOURCE: FPSC Comparative Rate Statistics.
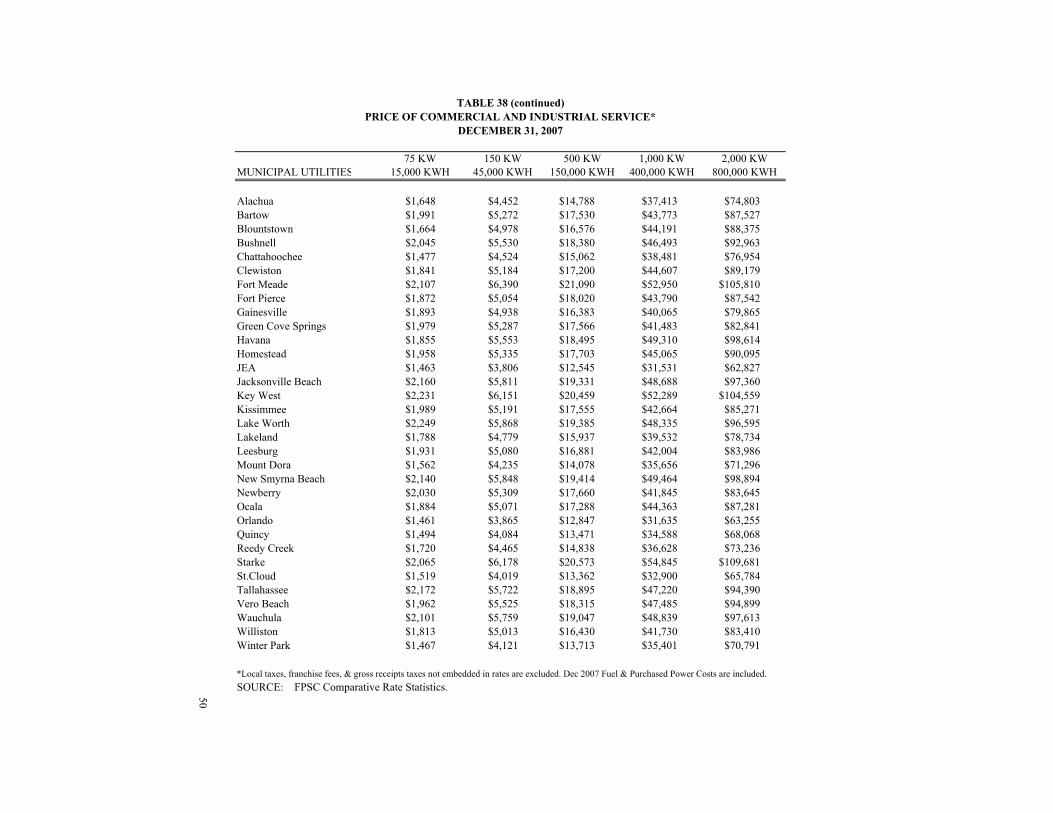
TABLE 38 (continued)PRICE OF COMMERCIAL AND INDUSTRIAL SERVICE*
DECEMBER 31, 2007
75 KW 150 KW 500 KW 1,000 KW 2,000 KWMUNICIPAL UTILITIES 15,000 KWH 45,000 KWH 150,000 KWH 400,000 KWH 800,000 KWH
Alachua $1,648 $4,452 $14,788 $37,413 $74,803Bartow $1,991 $5,272 $17,530 $43,773 $87,527Blountstown $1,664 $4,978 $16,576 $44,191 $88,375Bushnell $2,045 $5,530 $18,380 $46,493 $92,963Chattahoochee $1,477 $4,524 $15,062 $38,481 $76,954Clewiston $1,841 $5,184 $17,200 $44,607 $89,179Fort Meade $2,107 $6,390 $21,090 $52,950 $105,810Fort Pierce $1,872 $5,054 $18,020 $43,790 $87,542Gainesville $1,893 $4,938 $16,383 $40,065 $79,865Green Cove Springs $1,979 $5,287 $17,566 $41,483 $82,841Havana $1,855 $5,553 $18,495 $49,310 $98,614Homestead $1,958 $5,335 $17,703 $45,065 $90,095JEA $1,463 $3,806 $12,545 $31,531 $62,827Jacksonville Beach $2,160 $5,811 $19,331 $48,688 $97,360Key West $2,231 $6,151 $20,459 $52,289 $104,559Kissimmee $1,989 $5,191 $17,555 $42,664 $85,271Lake Worth $2,249 $5,868 $19,385 $48,335 $96,595Lakeland $1,788 $4,779 $15,937 $39,532 $78,734 Leesburg $1,931 $5,080 $16,881 $42,004 $83,986Mount Dora $1,562 $4,235 $14,078 $35,656 $71,296New Smyrna Beach $2,140 $5,848 $19,414 $49,464 $98,894Newberry $2,030 $5,309 $17,660 $41,845 $83,645Ocala $1,884 $5,071 $17,288 $44,363 $87,281 Orlando $1,461 $3,865 $12,847 $31,635 $63,255Quincy $1,494 $4,084 $13,471 $34,588 $68,068Reedy Creek $1,720 $4,465 $14,838 $36,628 $73,236Starke $2,065 $6,178 $20,573 $54,845 $109,681St.Cloud $1,519 $4,019 $13,362 $32,900 $65,784Tallahassee $2,172 $5,722 $18,895 $47,220 $94,390Vero Beach $1,962 $5,525 $18,315 $47,485 $94,899Wauchula $2,101 $5,759 $19,047 $48,839 $97,613Williston $1,813 $5,013 $16,430 $41,730 $83,410Winter Park $1,467 $4,121 $13,713 $35,401 $70,791
*Local taxes, franchise fees, & gross receipts taxes not embedded in rates are excluded. Dec 2007 Fuel & Purchased Power Costs are included.SOURCE: FPSC Comparative Rate Statistics.50
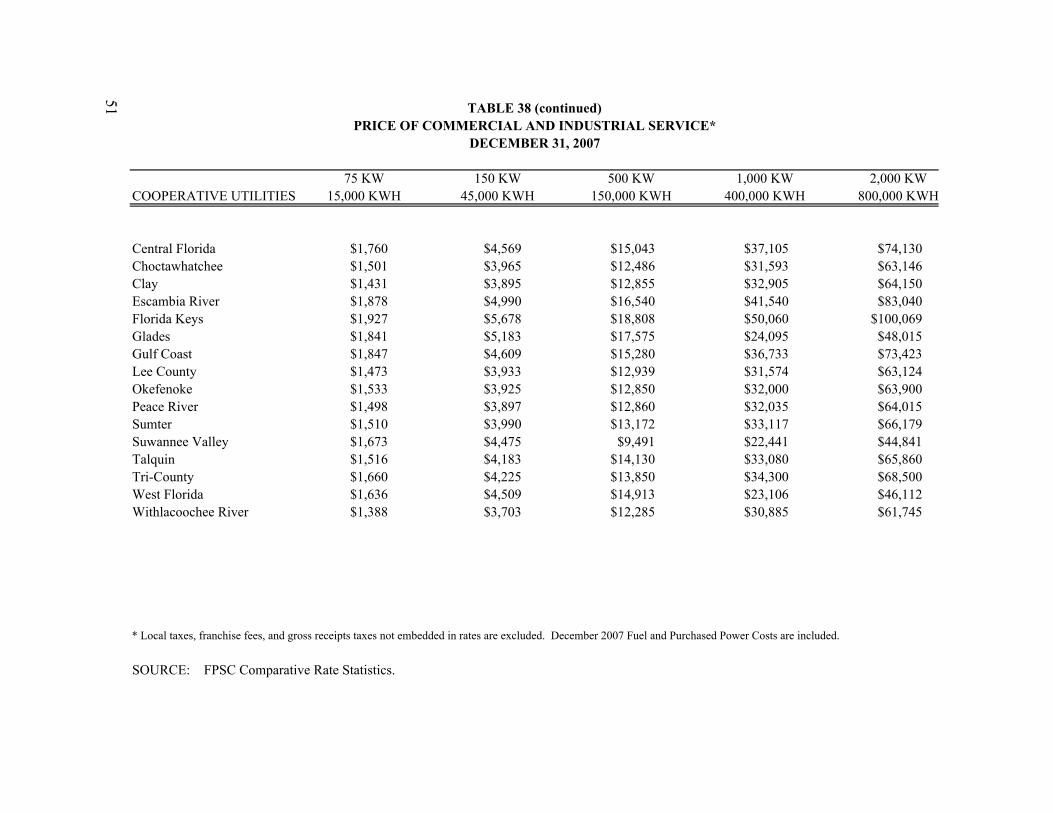
51 TABLE 38 (continued)PRICE OF COMMERCIAL AND INDUSTRIAL SERVICE*
DECEMBER 31, 2007
75 KW 150 KW 500 KW 1,000 KW 2,000 KWCOOPERATIVE UTILITIES 15,000 KWH 45,000 KWH 150,000 KWH 400,000 KWH 800,000 KWH
Central Florida $1,760 $4,569 $15,043 $37,105 $74,130Choctawhatchee $1,501 $3,965 $12,486 $31,593 $63,146Clay $1,431 $3,895 $12,855 $32,905 $64,150Escambia River $1,878 $4,990 $16,540 $41,540 $83,040Florida Keys $1,927 $5,678 $18,808 $50,060 $100,069Glades $1,841 $5,183 $17,575 $24,095 $48,015Gulf Coast $1,847 $4,609 $15,280 $36,733 $73,423Lee County $1,473 $3,933 $12,939 $31,574 $63,124Okefenoke $1,533 $3,925 $12,850 $32,000 $63,900Peace River $1,498 $3,897 $12,860 $32,035 $64,015Sumter $1,510 $3,990 $13,172 $33,117 $66,179Suwannee Valley $1,673 $4,475 $9,491 $22,441 $44,841Talquin $1,516 $4,183 $14,130 $33,080 $65,860Tri-County $1,660 $4,225 $13,850 $34,300 $68,500West Florida $1,636 $4,509 $14,913 $23,106 $46,112Withlacoochee River $1,388 $3,703 $12,285 $30,885 $61,745
* Local taxes, franchise fees, and gross receipts taxes not embedded in rates are excluded. December 2007 Fuel and Purchased Power Costs are included.
SOURCE: FPSC Comparative Rate Statistics.

ECONOMIC AND FINANCIAL INDICATORS

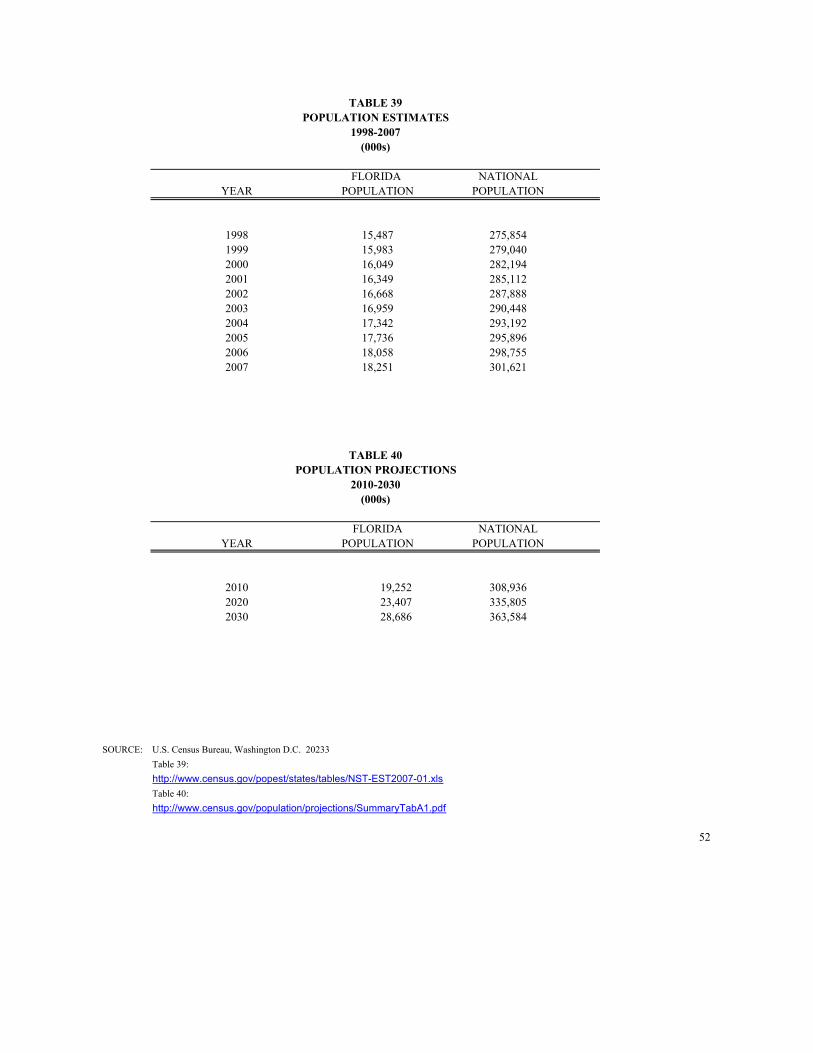
TABLE 39POPULATION ESTIMATES
1998-2007(000s)
FLORIDA NATIONALYEAR POPULATION POPULATION
1998 15,487 275,8541999 15,983 279,0402000 16,049 282,1942001 16,349 285,1122002 16,668 287,8882003 16,959 290,4482004 17,342 293,1922005 17,736 295,8962006 18,058 298,7552007 18,251 301,621
TABLE 40POPULATION PROJECTIONS
2010-2030(000s)
FLORIDA NATIONALYEAR POPULATION POPULATION
2010 19,252 308,9362020 23,407 335,8052030 28,686 363,584
SOURCE: U.S. Census Bureau, Washington D.C. 20233Table 39:http://www.census.gov/popest/states/tables/NST-EST2007-01.xlsTable 40:http://www.census.gov/population/projections/SummaryTabA1.pdf
52
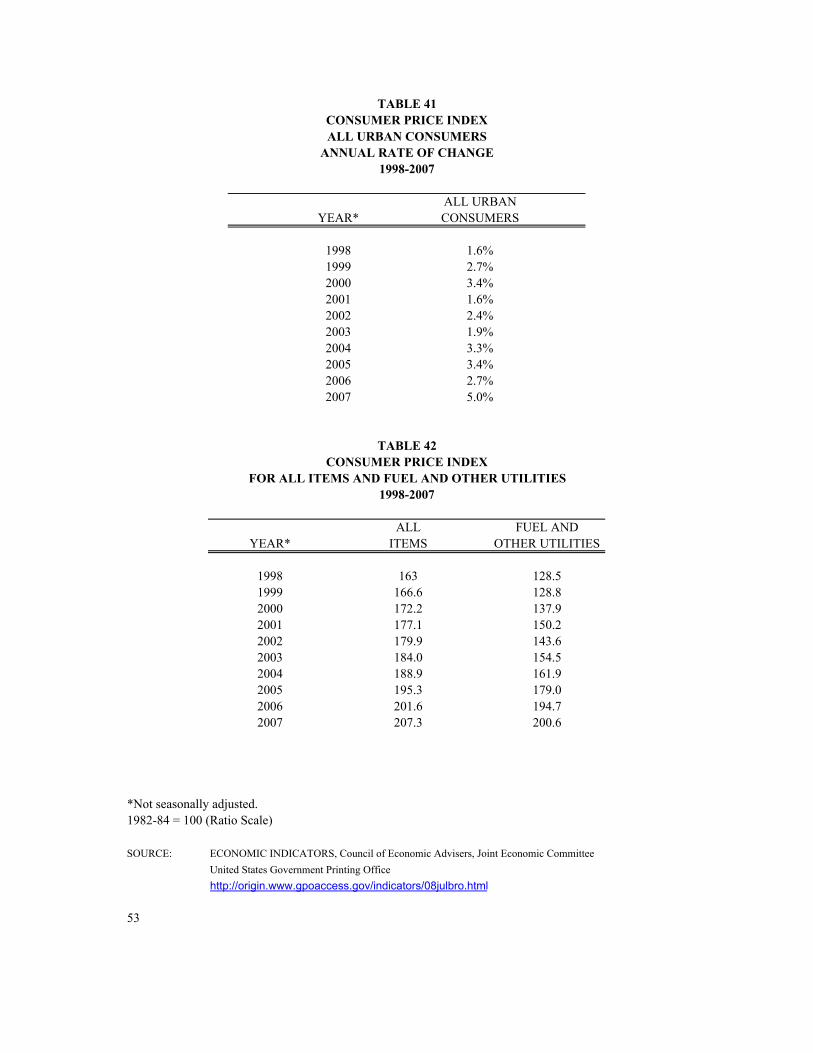
TABLE 41CONSUMER PRICE INDEXALL URBAN CONSUMERS
ANNUAL RATE OF CHANGE1998-2007
ALL URBANYEAR* CONSUMERS
1998 1.6%1999 2.7%2000 3.4%2001 1.6%2002 2.4%2003 1.9%2004 3.3%2005 3.4%2006 2.7%2007 5.0%
TABLE 42CONSUMER PRICE INDEX
FOR ALL ITEMS AND FUEL AND OTHER UTILITIES1998-2007
ALL FUEL ANDYEAR* ITEMS OTHER UTILITIES
1998 163 128.51999 166.6 128.82000 172.2 137.92001 177.1 150.22002 179.9 143.62003 184.0 154.52004 188.9 161.92005 195.3 179.02006 201.6 194.72007 207.3 200.6
*Not seasonally adjusted.1982-84 = 100 (Ratio Scale)
SOURCE: ECONOMIC INDICATORS, Council of Economic Advisers, Joint Economic CommitteeUnited States Government Printing Officehttp://origin.www.gpoaccess.gov/indicators/08julbro.html
53
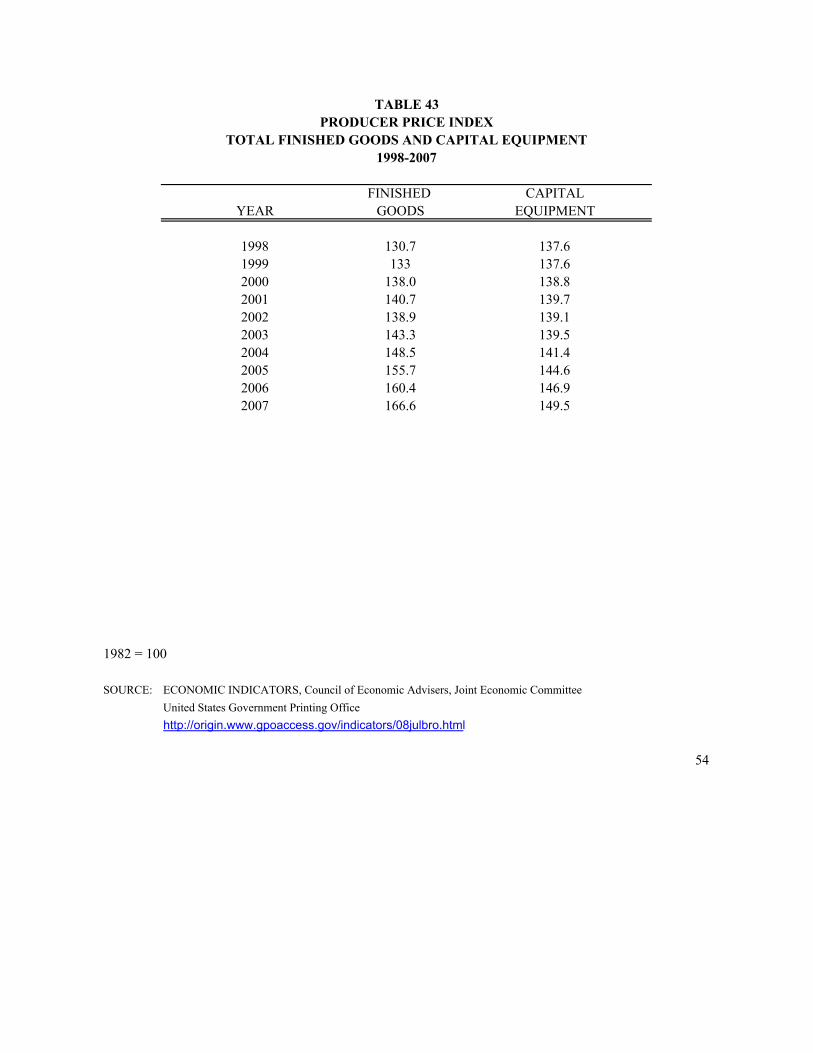
TABLE 43PRODUCER PRICE INDEX
TOTAL FINISHED GOODS AND CAPITAL EQUIPMENT1998-2007
FINISHED CAPITALYEAR GOODS EQUIPMENT
1998 130.7 137.61999 133 137.62000 138.0 138.82001 140.7 139.72002 138.9 139.12003 143.3 139.52004 148.5 141.42005 155.7 144.62006 160.4 146.92007 166.6 149.5
1982 = 100
SOURCE: ECONOMIC INDICATORS, Council of Economic Advisers, Joint Economic CommitteeUnited States Government Printing Officehttp://origin.www.gpoaccess.gov/indicators/08julbro.html
54


APPENDIX


ABBREVIATIONS AND TERMINOLOGY

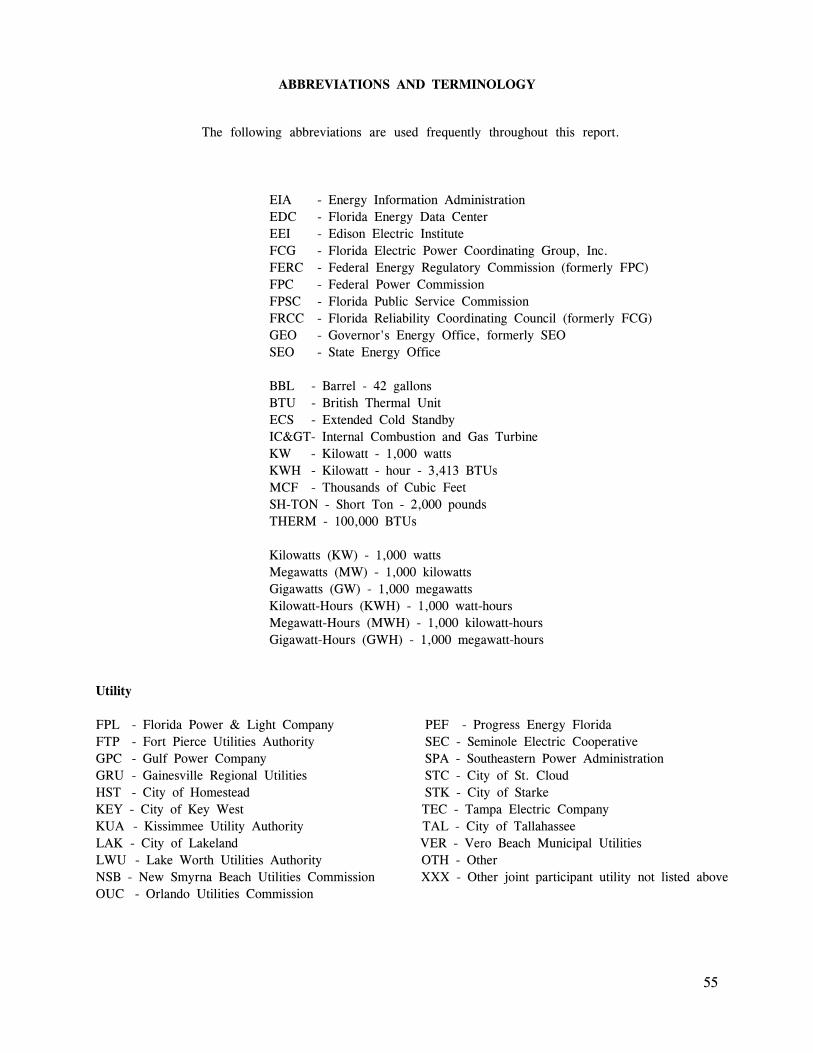
55
ABBREVIATIONS AND TERMINOLOGY
The following abbreviations are used frequently throughout this report.
EIA - Energy Information AdministrationEDC - Florida Energy Data CenterEEI - Edison Electric InstituteFCG - Florida Electric Power Coordinating Group, Inc.FERC - Federal Energy Regulatory Commission (formerly FPC)FPC - Federal Power CommissionFPSC - Florida Public Service CommissionFRCC - Florida Reliability Coordinating Council (formerly FCG)GEO - Governor's Energy Office, formerly SEOSEO - State Energy Office
BBL - Barrel - 42 gallonsBTU - British Thermal UnitECS - Extended Cold StandbyIC>- Internal Combustion and Gas TurbineKW - Kilowatt - 1,000 wattsKWH - Kilowatt - hour - 3,413 BTUsMCF - Thousands of Cubic FeetSH-TON - Short Ton - 2,000 poundsTHERM - 100,000 BTUs
Kilowatts (KW) - 1,000 wattsMegawatts (MW) - 1,000 kilowattsGigawatts (GW) - 1,000 megawattsKilowatt-Hours (KWH) - 1,000 watt-hoursMegawatt-Hours (MWH) - 1,000 kilowatt-hoursGigawatt-Hours (GWH) - 1,000 megawatt-hours
Utility
FPL - Florida Power & Light Company PEF - Progress Energy FloridaFTP - Fort Pierce Utilities Authority SEC - Seminole Electric CooperativeGPC - Gulf Power Company SPA - Southeastern Power AdministrationGRU - Gainesville Regional Utilities STC - City of St. CloudHST - City of Homestead STK - City of StarkeKEY - City of Key West TEC - Tampa Electric CompanyKUA - Kissimmee Utility Authority TAL - City of TallahasseeLAK - City of Lakeland VER - Vero Beach Municipal UtilitiesLWU - Lake Worth Utilities Authority OTH - OtherNSB - New Smyrna Beach Utilities Commission XXX - Other joint participant utility not listed above OUC - Orlando Utilities Commission
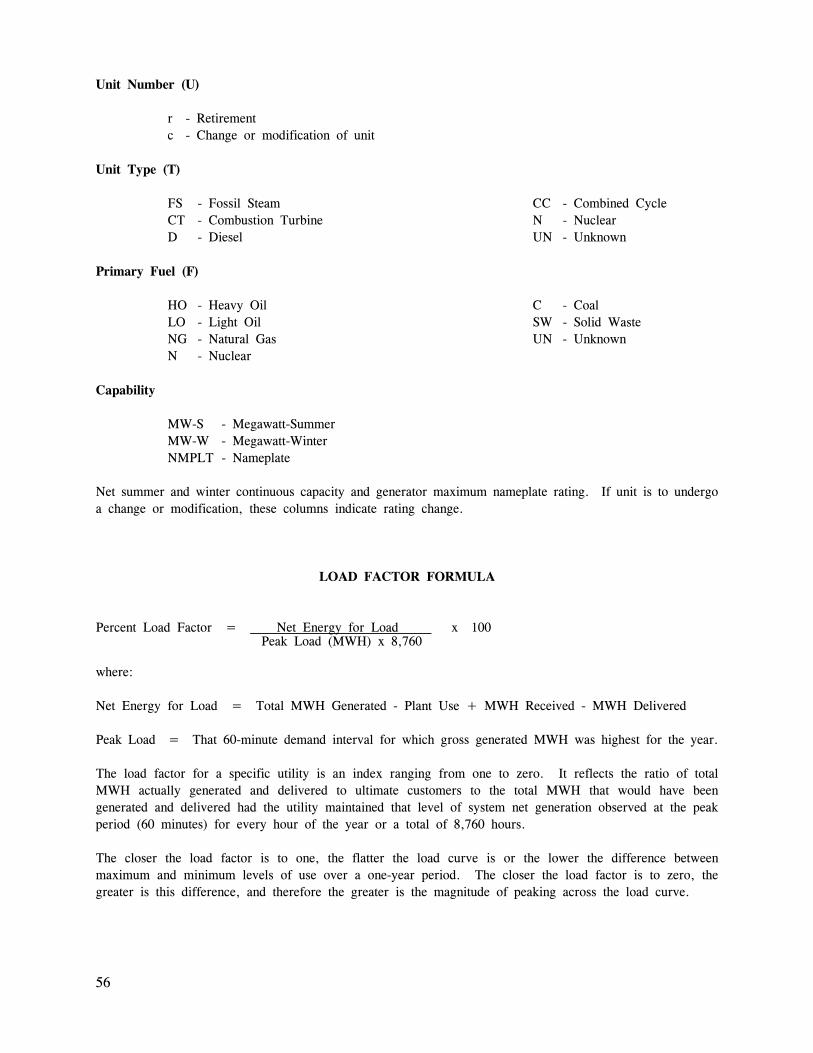
56
Unit Number (U)
r - Retirementc - Change or modification of unit
Unit Type (T)
FS - Fossil Steam CC - Combined CycleCT - Combustion Turbine N - NuclearD - Diesel UN - Unknown
Primary Fuel (F)
HO - Heavy Oil C - CoalLO - Light Oil SW - Solid WasteNG - Natural Gas UN - UnknownN - Nuclear
Capability
MW-S - Megawatt-SummerMW-W - Megawatt-WinterNMPLT - Nameplate
Net summer and winter continuous capacity and generator maximum nameplate rating. If unit is to undergoa change or modification, these columns indicate rating change.
LOAD FACTOR FORMULA
Percent Load Factor = Net Energy for Load x 100 Peak Load (MWH) x 8,760
where:
Net Energy for Load = Total MWH Generated - Plant Use + MWH Received - MWH Delivered
Peak Load = That 60-minute demand interval for which gross generated MWH was highest for the year.
The load factor for a specific utility is an index ranging from one to zero. It reflects the ratio of totalMWH actually generated and delivered to ultimate customers to the total MWH that would have beengenerated and delivered had the utility maintained that level of system net generation observed at the peakperiod (60 minutes) for every hour of the year or a total of 8,760 hours.
The closer the load factor is to one, the flatter the load curve is or the lower the difference betweenmaximum and minimum levels of use over a one-year period. The closer the load factor is to zero, thegreater is this difference, and therefore the greater is the magnitude of peaking across the load curve.
GLOSSARY OF ELECTRIC UTILITY TERMS

57
GLOSSARY OF ELECTRIC UTILITY TERMS
AVERAGE ANNUAL KWH USE PER CUSTOMER - Annual kilowatt-hour sales of a class of service (seeCLASSES OF ELECTRIC SERVICE for list) divided by the average number of customers for the same12-month period (usually refers to all residential customers, including those with electric space heating). Acustomer with two or more meters at the same location because of special services, such as water heating,etc., is counted as one customer.
BTU (BRITISH THERMAL UNIT) - The standard unit for measuring quantity of heat energy, such as theheat content of fuel. It is the amount of heat energy necessary to raise the temperature of one pound ofwater one degree Fahrenheit.
Content of Fuel, Average - The heat value per unit quantity of fuel expressed in BTU as determinedfrom tests of fuel samples. Examples: BTU per pound of coal, per gallon of oil, etc.
BTU PER KILOWATT-HOUR - See HEAT RATE.
CAPABILITY - The maximum load which a generating unit, generating station, or other electrical apparatuscan carry under specified conditions for a given period of time, without exceeding approved limits oftemperature and stress.
Gross System - The net generating station capability of a system at a stated period of time (usuallyat the time of the system's maximum load), plus capability available at such time from other sourcesthrough firm power contracts.
Note: The Florida Electric Power Coordinating Group and much of the utility industry prefer adifferent definition. Their use of the words relates to the capability at the generatorterminals and would therefore be defined as the "total capability of a system's generatingunits measured at their terminals."
Margin of Reserve - See CAPABILITY MARGIN.
Net Generating Station - The capability of a generating station as demonstrated by test or asdetermined by actual operating experience less power generated and used for auxiliaries and otherstation uses. Capability may vary with the character of the load, time of year (due to circulatingwater temperatures in thermal stations or availability of water in hydro stations), and othercharacteristic causes. Capability is sometimes referred to as Effective Rating.
Net System - The net generating station capability of a system at a stated period of time (usuallyat the time of the system's maximum load), plus capability available at such time from other sourcesthrough firm power contracts less firm power obligations at such time to other companies or systems.
Peaking - Generating capability normally designed for use during the maximum load period of adesignated time interval.
CAPABILITY MARGIN / RESERVE MARGIN - The difference between net system capability and system maximum load requirements (peak load). It is the margin of capability available to provide for scheduled maintenance, emergency outages, system operating requirements, and unforeseen loads.
58
CAPACITY - The load for which a generating unit, generating station, or other electrical apparatus is ratedeither by the user or by the manufacturer. See also NAMEPLATE RATING.
Dependable - The load-carrying ability for the time interval and period specified when related to thecharacteristics of the load to be supplied. Dependable capacity of a station is determined by suchfactors as capability, operating power factor, and portion of the load which the station is to supply.
Hydraulic - The rating of a hydroelectric generating unit or the sum of such ratings for all unitsin a station or stations.
Installed Generating - See NAMEPLATE RATING.
Peaking - Generating units or stations which are available to assist in meeting that portion of peakload which is above base load.
Purchase - The amount of power available for purchase from a source outside the system to supplyenergy or capacity.
Reserve: Cold - Thermal generating units available for service but not maintained at operatingtemperature.
Hot - Thermal generating units available, up to temperature and ready for service, althoughnot actually in operation.
Margin of - See CAPABILITY MARGIN.
Spinning - Generating units connected to the bus and ready to take load.
Thermal - The rating of a thermal electric generating unit or the sum of such ratings forall units in a station or stations.
Total Available - See CAPABILITY, GROSS SYSTEM.
CHARGE, ELECTRIC ENERGY - See ENERGY, ELECTRIC.
CLASSES OF ELECTRIC SERVICE - See class name for definition of each.
Sales to Ultimate Customers:*Residential Public Street and Highway LightingCommercial and Industrial Other Public Authorities
Commercial Railroads and RailwaysIndustrial InterdepartmentalSmall Light and PowerLarge Light and Power
Sales for Resale (Other Electric Utilities):Investor-Owned Companies Municipally Owned Electric SystemsCooperatively Owned Electric Systems Federal and State Electric Agencies
*Companies service rural customers under distinct rural rates and classify these sales as "Rural." However, many companies servicecustomers in rural areas under standard Residential, Commercial and Industrial rates and so classify such sales. Consequently, "Rural"is a rate classification rather than a customer classification and since it is frequently confused with "Farm Service" (a type of Residentialand/or Commercial service), the "Rural" classification has been generally discontinued as a customer classification.
59
CLASSES OF ELECTRIC SYSTEMS - Federal Power Commission groupings (as of 1968) of operatingsystems based on volume and kinds of electric output for the purpose of reporting power system operations.
Basis of Classification Class of SystemSystems which generate all or part of system requirementsand whose net energy for system for the year reported was:
More than 100,000,000 kilowatt-hours I 20,000,000 to 100,000,000 kilowatt-hours II Less than 20,000,000 kilowatt-hours III
Systems engaged primarily in sales for resale and/or salesto industrial, all other sales being negligible IV
Systems which obtain entire energy requirements fromother systems V
COMBINED CYCLE - Consists of three components: two combustion turbines, each with its own generator,and one steam boiler with associated steam turbine generator. The normally wasted combustion may also besupplementally fired.
CONVENTIONAL FUELS - The fossil fuels: coal, oil, or gas.
COOPERATIVE, RURAL ELECTRIC - See RURAL.
COOPERATIVES (COOPERATIVELY-OWNED ELECTRIC UTILITIES) - A joint venture organized forthe purpose of supplying electric energy to a specified area. Such ventures are generally exempt from thefederal income tax laws. Most cooperatives have been financed by the Rural Electrification Administration.
CUSTOMER (ELECTRIC) - A customer is an individual, firm, organization, or other electric utility whichpurchases electric service at one location under one rate classification, contract, or schedule. If service issupplied to a customer at more than one location, each location shall be counted as a separate customer unlessconsumption is combined before the bill is calculated.
Note 1: If service is supplied to a customer at one location through more than one meter and underseveral rate classifications or schedules but only for one class of service (for example, separate metersfor residential regular and water heating service), such multiple rate services shall be counted as onlyone customer at the one location.
Note 2: Where service is used for one part of a month (prorated period), initial bills of customersduring such month only shall be counted; final bills should not be counted as customers.
Note 3: See also ULTIMATE CUSTOMERS.
60
DEMAND - The rate at which electric energy is delivered to or by a system, part of a system, or a pieceof equipment expressed in kilowatts, kilovolt-amperes, or other suitable unit at a given instant or averagedover any designated period of time. The primary source of "Demand" is the power-consuming equipmentof the customers. See LOAD.
Annual Maximum - The greatest of all demands of the load under consideration which occurredduring a prescribed demand interval in a calendar year.
Annual System Maximum - The greatest demand on an electric system during a prescribed demandinterval in a calendar year.
Average - The demand on, or the power output of, an electric system or any of its parts over anyinterval of time, as determined by dividing the total number of kilowatt-hours by the number of unitsof time in the interval.
Billing - The demand upon which billing to a customer is based, as specified in a rate schedule orcontract. It may be based on the contract year, a contract minimum, or a previous maximum and,therefore, does not necessarily coincide with the actual measured demand of the billing period.
Coincident - The sum of two or more demands which occur in the same demand interval.
Instantaneous Peak - The maximum demand at the instant of greatest load, usually determined fromthe readings of indicating or graphic meters.
Integrated - The demand usually determined by an integrating demand meter or by the integrationof a load curve. It is the summation of the continuously varying instantaneous demands during aspecified demand interval.
Maximum - The greatest of all demands of the load under consideration which has occurred duringa specified period of time.
Noncoincident - The sum of two or more individual demands which do not occur in the samedemand interval. Meaningful only when considering demands within a limited period of time, suchas a day, week, month, a heating or cooling season, and usually not for more than one year.
ELECTRIC UTILITY INDUSTRY OR ELECTRIC UTILITIES - All enterprises engaged in the productionand/or distribution of electricity for use by the public, including investor-owned electric utility companies;cooperatively-owned electric utilities; government-owned electric utilities (municipal systems, federal agencies,state projects, and public power districts); and, where the data are not separable, those industrial plantscontributing to the public supply.
ENERGY, ELECTRIC - As commonly used in the electric utility industry, electric energy meanskilowatt-hours.
FUEL COSTS (MOST COMMONLY USED BY ELECTRIC UTILITY COMPANIES)
Cents per Million BTU Consumed - Since coal is purchased on the basis of its heat content, itscost is measured by computing the "cents per million BTU" of the fuel consumed. It is the totalcost of fuel consumed divided by its total BTU content, and the answer is divided by one million.
Coal - Average cost per (short) ton (dollars per ton) - includes bituminous and anthracite coal andrelatively small amounts of coke, lignite, and wood.
Gas - Average cost per MCF (cents per thousand cubic feet) - includes natural, manufactured, mixed,and waste gas. Frequently expressed as cost per therm (100,000 BTU).
61
Nuclear - Nuclear fuel costs can be given on a fuel cycle basis. A fuel cycle consists of all thesteps associated with procurement, use, and disposal of nuclear fuel. Accounting for the cost of eachstep in the fuel cycle including interest charges, nuclear fuel costs can be given in cents per millionBTU or mills per kilowatt-hour for the cycle lifetime of the fuel which is normally five to six years.
Oil - Average cost per barrel - 70 U.S. gallons (dollars per barrel) - includes fuel oil, crude anddiesel oil, and small amounts of tar and gasoline.
FUEL EFFICIENCY - See HEAT RATE.
FUEL FOR ELECTRIC GENERATION - This includes all types of fuel (solid, liquid, gaseous, andnuclear) used exclusively for the production of electric energy. Fuel for other purposes, such as buildingheating or steam sales is excluded.
GAS - A fuel burned under boilers by internal combustion engines and gas turbines for electric generation.Includes natural, manufactured, mixed, and waste gas. See GAS - MCF and also THERM.
GAS-FUEL COSTS - See FUEL COSTS.
GAS - MCF - 1,000 cubic feet of gas.
GENERATING CAPABILITY - See CAPABILITY, NET GENERATING STATION.
GENERATING STATION (GENERATING PLANT OR POWER PLANT) - A station at which are locatedprime movers, electric generators, and auxiliary equipment for converting mechanical, chemical, and/or nuclearenergy into electric energy.
Atomic - See NUCLEAR.
Gas Turbine - An electric generating station in which the prime mover is a gas turbine engine.
Geothermal - An electric generating station in which the prime mover is a steam turbine. Thesteam is generated in the earth by heat from the earth's magma.
Hydroelectric - An electric generation station in which the prime mover is a hydraulic turbine.
Internal Combustion - An electric generating station in which the prime mover is an internalcombustion engine.
Nuclear - An electric generation station in which the prime mover is a steam turbine. The steamis generated in a reactor by heat from the fissioning of nuclear fuel.
Steam (Conventional) - An electric generating station in which the prime mover is a steam turbine.The steam is generated in a boiler by heat from burning fossil fuels.
Generating Station Capability - See CAPABILITY, NET GENERATING STATION.
Generating Unit - An electric generator together with its prime mover.
Generation, Electric - This term refers to the act or process of transforming other forms of energyinto electric energy, or to the amount of electric energy so produced, expressed in kilowatt-hours.
Gross - The total amount of electric energy produced by the generating units in a generatingstation or stations.
Net - Gross generation less kilowatt-hours consumed out of gross generation for station use.
62
GIGAWATT-HOUR (GWH) - One million kilowatt-hours, one thousand megawatt-hours, or one billionwatt-hours.
HEAT RATE - A measure of generating station thermal efficiency, generally expressed in BTU per netkilowatt-hour. It is computed by dividing the total BTU content of fuel burned for electric generation by theresulting net kilowatt-hour generation.
INTERDEPARTMENTAL SALES - Kilowatt-hour sales of electric energy to other departments (gas, steam,water, etc.) and dollar value of such sales at tariff or other specified rates for the energy supplied.
INTERNAL COMBUSTION ENGINE - A prime mover in which energy released from rapid burning ofa fuel-air mixture is converted into mechanical energy. Diesel, gasoline, and gas engines are the principaltypes in this category.
INVESTOR-OWNED ELECTRIC UTILITIES - Those electric utilities organized as tax-paying businessesusually financed by the sale of securities in the free market, and whose properties are managed byrepresentatives regularly elected by their shareholders. Investor-owned electric utilities, which may be ownedby an individual proprietor or a small group of people, are usually corporations owned by the general public.
INDUSTRIAL - See COMMERCIAL AND INDUSTRIAL.
KILOWATT (KW) - 1,000 watts. See WATT.
KILOWATT-HOUR (KWH) - The basic unit of electric energy equal to one kilowatt of power supplied toor taken from an electric circuit steadily for one hour.
KILOWATT-HOURS PER CAPITA - Net generation in the United States divided by national population,or the corresponding ratio for any other area.
LARGE LIGHT AND POWER - See COMMERCIAL AND INDUSTRIAL.
LOAD - The amount of electric power delivered or required at any specified point or points on a system.Load originates primarily at the power-consuming equipment of the customers. See DEMAND.
Average - See DEMAND, AVERAGE.
Base - The minimum load over a given period of time.
Connected - Connected load is the sum of the capacities or rating of the electric power-consumingapparatus connected to a supplying system, or any part of the system under consideration.
Peak - See DEMAND, MAXIMUM and also DEMAND, INSTANTANEOUS PEAK.
LOAD FACTOR - The ratio of the average load in kilowatts supplied during a designated period to the peakor maximum load in kilowatts occurring in that period. Load factor, in percent, also may be derived bymultiplying the kilowatt-hours in the period by 100 and dividing by the product of the maximum demand inkilowatts and the number of hours in the period.
63
LOSS (LOSSES) - The general term applied to energy (kilowatt-hours) and power (kilowatts) lost in theoperation of an electric system. Losses occur principally as energy transformations from kilowatt-hours towaste heat in electric conductors and apparatus.
Average - The total difference in energy input and output or power input and output (due to losses)averaged over a time interval and expressed either in physical quantities or as a percentage of totalinput.
Energy - The kilowatt-hours lost in the operation of an electric system.
Line - Kilowatt-hours and kilowatts lost in transmission and distribution lines under specifiedconditions.
Peak Percent - The difference between the power input and output, as a result of losses due to thetransfer of power between two or more points on a system at the time of maximum load, dividedby the power input.
System - The difference between the system net energy or power input and output, resulting fromcharacteristic losses and unaccounted for between the sources of supply and the metering points ofdelivery on a system.
MARGIN OF RESERVE CAPACITY - See CAPABILITY MARGIN.
MAXIMUM DEMAND - See DEMAND, MAXIMUM.
MAXIMUM LOAD - See DEMAND, MAXIMUM.
MEGAWATT (MW) - 1,000 kilowatts. See WATT.
MEGAWATT-HOUR (MWH) - 1,000 kilowatt-hours. See KILOWATT-HOURS.
MUNICIPALLY-OWNED ELECTRIC SYSTEM - An electric utility system owned and/or operated by amunicipality engaged in serving residential, commercial, and/or industrial customers, usually, but not always,within the boundaries of the municipality.
NAMEPLATE RATING - The full-load continuous rating of a generator, prime mover, or other electricalequipment under specified conditions as designated by the manufacturer. It is usually indicated on a nameplateattached to the individual machine or device. The nameplate rating of a steam electric turbine-generator wetis the guaranteed continuous output in kilowatts or KVA (kilovolt-amperes - 1,000 volt-amperes) and powerfactor at generator terminals when the turbine is clean and operating under specified throttle steam pressureand temperature, specified reheat temperature, specified exhaust pressure, and with full extraction from allextraction openings.
NET CAPABILITY - See CAPABILITY, NET GENERATING STATION.
NET ENERGY FOR LOAD - A term used in Federal Energy Regulatory Commission reports andcomprising:
1. The net generation by the system's own plants, plus2. Energy received from others (exclusive of receipts for borderline customers), less3. Energy delivered for resale to those Class I and II systems which obtain a part of their power
supply from sources other than the company's system.
64
NET ENERGY FOR SYSTEM - A term used in Federal Energy Regulatory Commission reports andcomprising:
1. The net generation by the system's own plants, plus2. Energy received from others (exclusive of receipts for borderline customers), less3. Energy delivered for resale to those Class I and II systems which obtain a part of their power
supply from sources other than this company's system, plus4. Energy received for borderline customers, less5. Energy delivered for resale to all systems other than those specified in Item 3 preceding.
NET GENERATING STATION CAPABILITY - See CAPABILITY, NET GENERATING STATION.
NET GENERATION - See GENERATION, ELECTRIC - NET.
NET PLANT CAPABILITY - See CAPABILITY, NET GENERATING STATION.
NUCLEAR ENERGY - Energy produced in the form of heat during the fission process in a nuclear reactor.When released in sufficient and controlled quantity, this heat energy may be used to produce steam to drivea turbine-generator and thus be converted to electrical energy.
NUCLEAR (ATOMIC) FUEL - Material containing fissionable materials of such composition and enrichmentthat when placed in a nuclear reactor will support a self-sustaining fission chain reaction and produce heatin a controlled manner for process use.
PRIME MOVER - The engine, turbine, water wheel, or similar machine which drives an electric generator.
PUBLIC STREET AND HIGHWAY LIGHTING - A customer, sales, and revenue classification coveringelectric energy supplied and services rendered for the purposes of lighting streets, highways, parks, and otherpublic places, or for traffic or other signal service, for municipalities or other divisions or agencies of federalor state governments.
PUBLICLY OWNED ELECTRIC UTILITIES (GOVERNMENT-OWNED ELECTRIC UTILITIES ANDAGENCIES) - When used in statistical tables to indicate class of ownership, it includes municipally-ownedelectric systems and federal and state public power projects. Cooperatives are not included in this grouping.
RESERVE CAPACITY - See CAPACITY.
RESIDENTIAL - A customer, sales, or revenue classification covering electric energy supplied for residential(household) purposes. The classification of an individual customer's account where the use is both residentialand commercial is based on principal use.
RURAL - A rate classification covering electric energy supplied to rural and farm customers under distinctrural rates. See CLASSES OF ELECTRIC SERVICE.
SALES FOR RESALE - A customer, sales, and revenue classification covering electric energy supplied(except under interchange agreements) to other electric utilities or to public authorities for resale ordistribution. Includes sales for resale to cooperatives, municipalities, and federal and state electric agencies.
SERVICE AREA - Territory in which a utility system is required or has the right to supply electric serviceto ultimate customers.
65
STATION USE (GENERATING) - The kilowatt-hours used at an electric generating station for such purposesas excitation and operation of auxiliary and other facilities essential to the operation of the station. Stationuse includes electric energy supplied from house generators, main generators, the transmission system, andany other sources. The quantity of energy used is the difference between the gross generation plus anysupply from outside the station and the net output of the station.
SUMMER PEAK - The greatest load on an electric system during any prescribed demand interval in thesummer or cooling season, usually between June 1 and September 30.
SYSTEM, ELECTRIC - The physically connected generation, transmission, distribution, and other facilitiesoperated as an integral unit under one control, management, or operating supervision.
SYSTEM LOAD - See DEMAND.
SYSTEM LOSS - See LOSS (LOSSES).
THERM - 100,000 BTUs. See BTU (BRITISH THERMAL UNIT).
THERMAL - A term used to identify a type of electric generating station, capacity or capability, or outputin which the source of energy for the prime mover is heat.
TURBINE (STEAM OR GAS) - An enclosed rotary type of prime mover in which heat energy in steamor gas is converted into mechanical energy by the force of a high velocity flow of steam or gases directedagainst successive rows of radial blades fastened to a central shaft.
ULTIMATE CUSTOMERS - Those customers purchasing electricity for their own use and not for resale.See CLASSES OF ELECTRIC SERVICE.
USES AND LOSSES - "Uses" refers to the electricity used by the electric companies for their own purposesand "losses" refers to transmission losses.
UTILITY RATE STRUCTURE - A utility's approved schedule of charges for billing utility service renderedto various classes of its customers.
VOLT-AMPERE - The basic unit of Apparent Power. The volt-amperes of an electric circuit are themathematical product of the volts and amperes of the circuit.
WATT - The electrical unit of power or rate of doing work. The rate of energy transfer equivalent to oneampere flowing under a pressure of one volt at unity power factor. It is analogous to horsepower orfoot-pounds per minute of mechanical power. One horsepower is equivalent to approximately 746 watts.
WINTER PEAK - The greatest load on an electric system during any prescribed demand interval in thewinter or heating season, usually between December 1 of a calendar year and March 31 of the next calendaryear.
SOURCES: Edison Electric InstituteFlorida Electric Power Coordinating Group, Inc.Florida Governor's Energy Office