Embed Size (px)
Citation preview

C.P. No. I 138
MINISTRY OF AVIATION SUPPLY
AERONAUKAL RESEARCH COUNClL
CURRENT PAPERS
Flight Tests to Investigate the Problems of Steep Approaches by
STOL Aircraft bY
C. 0. O’Leary and N. V. Slatter
Aerodynamics Dept., R.A.E., Bedford
!?
LONDON: HER MAJESTY’S STATIONERY OFFICE
1970
PRICE 12s Od [6Op] NET

U.D.C. 629.13.087 : 629.136-118
CP No.1138* December 1969
FLIGHT TESTS TO INVESTIGATE THE PROBLEMS OF STEEP APPROACHES
BY STOL AIRCRAFT
by
c. 0. O'Leary
N. V. Slatter
Aerodynamics Dept., R.A.E., Bedford
SUMMARY
Steep approach tests with a Varsity and an Andover aircraft are described. Using the Varsity amcraft, 243 visual approaches were flown III a statistical experiment which included variations of approach angle, speed, height of entry to the approach, glide path guidance and pilots. A statistical analysis of the effects of the variables on various approach performance parameters was carrxd out and the significant results are illustrated and discussed. Tests with the Andover aircraft were on a smaller scale and were prunarily concerned with the final phase of the approach and landing.
The most important results of the tests are that steep approaches can be accurately and consistently made using a simple form of glide path guidance and landing distances can be decreased without any apparent uxrease in varlabillty of performance.
* Replaces R.A.E. Technical Report 69277 - A.R.C. 31849.
CONTENTS
INTRODUCTION
EXPERIMENTAL EQUIPMENT 2.1 Test aircraft 2.2 Instrumentation 2.3 Glide path guidance FLIGHT TRIALS 3.1 Preliminary tests and Varsity trials 3.2 Andover trials ANALYSIS OF RESULTS DISCUSSION OF RESULTS 5.1 Varsity trials
5.1.1 Glide path and speed holding 5.1.2 Final approach phase
5.2 Andover trials CONCLUSIONS
Table 1 Summary of results References Illustrations Detachable abstract cards
w 3 4 4
5 6 7 7 8 9
10 10 10 12 14 16 18
19 Figures 1-21

3
1 INTRODUCTION
The advent of military transport aircraft capable of short field
performance requires the investigation of steep approach paths needed for
terrain clearance when landing on tactical airstrips. There 1s also a
growuxg Interest in steep approach paths for civil transports to alleviate
noise over areas surrounding airports. In this case elaborate approach
ads would be available, e.g. radar guidance. It is probable that these
steep approaches would be terminated at an appreciable height where there
would be a transltxon to a normal 3' approach angle prior to landing.
These aspects are not considered in the present report but some of the
test results may be relevant to ciwl operations.
The practicability of a steep approach and landing is determined by
several factors concerning the piloting and performance of the aircraft.
The prlot should be able to make a precuse entry onto the glide path with
a minimum of flight path and speed oscillation. The height of entry to the
approach should therefore be low enough for the pilot to be clearly aware
of when to initute the descent and yet high enough for him to settle down
on the correct glide angle before the confines of the landing area are
reached. Glide path and speed must be accurately held until the flare is
initiated or until the aircraft 1s flown onto the ground at a constant
glide angle, depending on the undercarriage limitations. Glide path and
speed holding are important since precise positioning of the aircraft
near the threshold of the airstrlp 1s necessary if terrain clearance and
short landing requirements are to be satisfied. If It is necessary to
reduce rate of descent before touching down the height of flare initution
and the magnitude and rate of elevator application must be accurately
judged to achieve an acceptable rate of descent without increasing the
landing distance through a long 'float' down the field. The judgement of
the flare tends to become more difficult as the angle of approach is
increased so it might be expected that there is an approach angle beyond
which piloting inaccuracies reach an unacceptable level.
Steepness of approach 1s also limited by the aircraft's aerodynamic and
engine characteristics. In the maximum drag conflguration at a given speed,
the maximum achievable rate of descent is determined by the engznes' idling
thrust. Since some power reduction must be available to allow for correc-
tions from positions high on the glide path, the steepest practicable
approach angle is smaller than the maximum attainable by one or two degrees,
depending on the maxzmum errors occurrIng and the response of the engines
at low throttle settings. The minimum acceptable throttle setting may also
be dependent on the engine response characteristics when full power is applied
for overshoot. The decision on whether a landing is possible from a particular
approach may not be made until the aircraft is in the flare and it must there-
fore be possible to overshoot with only a small height loss.
The consequences of high rates of descent mentioned earlier give a
powerful incentive to reduce approach speed which also, of course, directly
reduces landing roll distances. But low approach speeds create problems in
the handling of the aircraft, such as inadequate lateral and dIrectIona 1,2 stability and the consequences of engine failure, which must be taken
into account.
In the flight study of techniques applxcable to steep approach operations
reported here,the factors investigated were angle of approach, approach speed,
height of entry, glide path guidance and pilot variability. Two aircraft
were used for the trials. A twin piston-engined Varsity aircraft was
available for a statistical study of the approach characteristics up to the
start of the flare, but since it did not have a sufficiently strong under-
carrlage for safe touchdowns in these conditions, subsidiary landing tests
were made with an Andover aircraft.
2 EXPERIMENTAL EQUIPMENT
2.1 Test aircraft
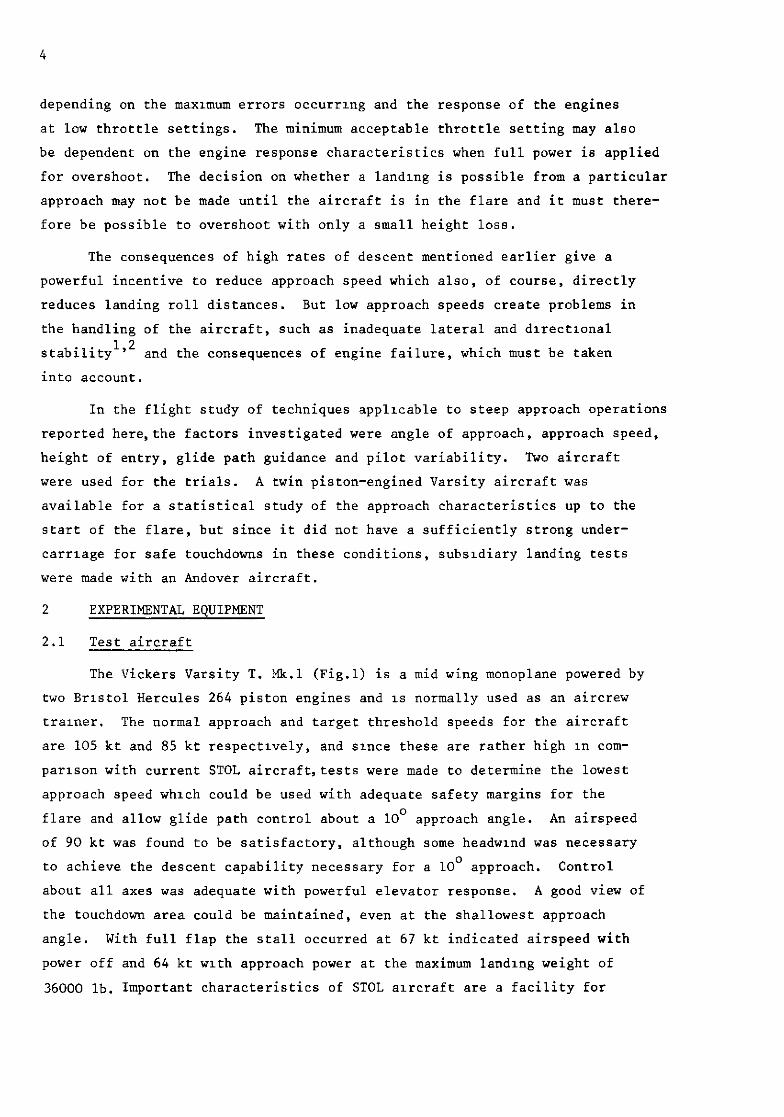
The Vickers Varsity T. Mk.1 (Fig.1) is a mid wing monoplane powered by
two Bristol Hercules 264 piston engines and 1s normally used as an aircrew
trainer. The normal approach and target threshold speeds for the aircraft
are 105 kt and 85 kt respectively, and since these are rather high III com-
parlson with current STOL aircraft,tests were made to determine the lowest
approach speed which could be used with adequate safety margins for the
flare and allow glide path control about a 10’ approach angle. An airspeed
of 90 kt was found to be satisfactory, although some headwlnd was necessary
to achieve the descent capability necessary for a 10’ approach. Control
about all axes was adequate with powerful elevator response. A good view of
the touchdown area could be maintained, even at the shallowest approach
angle. With full flap the stall occurred at 67 kt indicated airspeed with
power off and 64 kt with approach power at the maximum landing weight of
36000 lb. Important characteristics of STOL alrcraft are a facility for
lift 'dumping' before touch-down and a strong undercarriage enabling accurate,
high rate of descent landings to be made. Unfortunately, the Varsity 1s
limlted to the rather low touch-down rate of descent of 6 ftfsec and tends
to 'float' near the ground after the initial flare has been made.
The Hawker Slddeley Andover C. Mk.1 (Fig.2) is a 'semi-STOL' tactlcal
military transport arcraft powered by two Rolls Royce Dart 201 turbo-prop
engnles. All flying controls are conventional but the Fowler flaps fltted
have been modified to include a tab along the trailing edge to give Increased
lift and drag in the landing configuration. There are no spoilers. To
achieve a short landing run the propellers can be used to assist braklng.
Just before touch-down, reverse thrust can be selected or, alternatlvely,
If a conventional touch-down 1s preferred, the propellers can be put lnrc
fine pitch to provide wlndmllllng drag once the alrcraft 'e on the ground.
The use of reverse thrust requires a 'reverse idle' selection during the
approach and the mlnlmum fuel flow rate with throttles closed 1s ~nc-eased.
There zs then more thrust than when 'normal idle' 1s selected and :he
steepest possible approach is not achieved. ?lalnly because of this llmlta-
tlon reverse thrust was not used ln the present tests. The manufacturers
recommended minunum target threshold speed at the maximum landing weight
of 42000 lb 1s 85 kt and this speed is used for the entlre approach. The
power off stalling speed is 70 kt =n the landxng conflguratlon and 1s
reduced by 4 kt wxth approach power. The maximum permissible rate of
descent at touch-down 1s 14 ft/sec and the cross wind IimItatIon for steep
approaches 1s 15 kt.
2.2 Instrumentation
The Varsity was already ustrumented for automatic approach and landing
and this equpment was used without modification. Quantltles selected from
the conventIona trace recordings were airspeed, elevator angle, and height
measured by radio altimeter. Glide path and horizontal and vertical ground
speeds were measured with klnetheodolites which also sent a synchronlslng
radio pulse to the airborne recorders.
The Andover was comprehensively instrumented for R.A.F. acceptance
trials and trace recordings of the required quantltles were wallable. In
this case height was measured by a sensitive pressure altimeter and could
be checked by klnetheodolite records. Kinetheodolite pulses could not be recorded and synchronlsatlon with the alrborne recorders was achieved either
by using an Aldis lamp from the cockpit of the aircraft when It was being
fllmed or by reference to the touch-down point.
6
Surface wind speed and direction was measured near the runway for each
approach.
2.3 Glide path guidance
A simple form of visual ground guidance for an approach over an
obstacle would consist of an aiming mark on the ground positioned so as to
give the desired approach angle when aligned with the top of the obstacle,
allowing for an appropriate margin of clearance over the obstacle. If the
aiming mark was in the form of a horizontal bar, and a large ring mounted
on a pole was positioned in front of it, this simple ‘ring and bar’ sight
could be used as shown in Fig.3.
In the present tests a 50 ft obstacle was simulated by projecting jets
of water to form a barrier with a normal height of 50 ft. For the Varsity
trials a single nozzle was mounted on a 35 ft gantry, because of insufficient
water power, and the jet directed across the runway as shown in Fig.4. The
jet tended to break up soon after leaving the nozzle and was sensitive to
wind speed and direction. In unfavourable conditions when there was a
cross wind blowing the jet back towards the nozzle the aircraft did not
have to fly over the barrier and this reduced the compulsion to clear the
barrier by a safe margin. Also, owing to an inadequate water reserve the
supply was turned on just before the aircraft began its approach so that
at times the jet was late in developing and rather low.
For the Andover trials a pair of nozzles was mounted on the runway
threshold 40 ft apart and pointing nearly vertically upwards but slightly
inclined towards each other. Two stage pumping was used to provide adequate
pressure and water volume. The pump operator was provided with a simple
reference sight and was able to control the height of the twin jets to
50 f 5 ft. This improved barrier is shown in Fig.5.
The plywood ring of the sight, 5 ft in diameter and 1 ft wide, was
faced with red ‘dayglow’ material and mounted on a metal pole which could
be placed in prepared sockets on the runway edge to give a constant height.
The bar was 1 ft wide and 24 ft long (three 8 ft sections) and was painted
‘dayglow’ yellow. It was propped up behind the ring so as to define the
required glide angle when viewed through the centre of the ring. For the
Varsity tests, the sight was set to give a wheel clearance of approximately
8 ft over the barrier, but for the Andover tests this was increased to 15 ft.
The sight, shown in Fig.6, could be used down to flare height. To enable it
to be used in the very late stages of the Andover approaches the length of

the bar was extended to the right of the rmg when viewed from the aircraft.
The bar could then still be seen through the ring after the alrcraft had
passed over the barrier.
The ‘dayglow’ showed up well when the main light from the sky was
reflected towards the approaching aircraft and the sight could be picked
up from 3 to 4 miles range. However, when the mau-~ light was from behind
the painted surface it was very difficult to see the boards at distances
over 1 mile, although the ring could be seen earlier. This situation could
be Improved to some extent by tilting the boards of the bar backwards to
reflect the sky lqht.
3 FLIGHT TRIALS
3.1 Preliminary tests and Varsity trials
Since the pilots had little or no experience of flying steep approaches,
some preluninary tests were made for learning purposes and to determine the
scope of the experimental programme proper. A Devon and a Meteor aircraft
were used for these tests. A variety of approach angles, entry heights and
speeds were tried and the height of initiation of the flare was deliberately
varied. For glide path guidance a coloured light ground sight (HILO) was
used and a 50 ft barrier was simulated by the gantry water jet described
in section 2.3. The HILO sight was later replaced by the ‘ring and bar’
sight also described ln section 2.3 because the latter gave better ‘rate
informatlon’ during tracking (see section 5.1.1).
Based on the experience of the preliminary tests a factorial experi-
ment was designed for the Varsity in which each of five factors were varied
at three levels:
Factors Levels 1 2 3
1 Glide path angle 40 8’ 100
2 Glide path guidance Barrier Ground sight Barrier and ground sight
3 Approach entry height 500 ft 1000 ft 1500 ft
4 Approach speed 90 kt 100 kt 110 kt
5 Pilot A B C
In this experiment there was a total of 35 = 243 approaches covering every
combination of factors and levels. If there is complete control over the
factors in a factorial experunent the unportant results can be obtained by
performing only a fraction of the total number of runs, but in the present

flight trials it was impracticable and time wasting to arrange flights where
all factors could be varied at will from one approach to the next.
No aiming mark was set up when the barrier was used on its own, to see whether pilot-selected ground features would prove to be adequate as 'aming marks'.
The approaches were not flown in any particular order, being dependent on availability of pilots, equipment and weather. In general, it was necessary for the glide path angle, guidance and pilot to remain constant for a number of runs during any particular flight. Some attempt was made to eliminate the effects of learning by arranging that no one pilot flew a consecutive group of flights at the same glide path angle.
The experiment was completed in 33 flights. Each flight consisted of an average of 8 approaches, usually shared by 2 pilots. The same runway was used for all flights and limiting weather conditions were wind strength less than 20 kt (less than 5 kt tail wind component) and visibility better than 4 miles. The aircraft was operated at a mean weight of 35000 lb. Flap settings were 47' (full flap) for the 8' and loo approaches and 30' for the 4O approaches. The approach speeds of 90,100 and 110 kt gave lift coefficients of 1.30, 1.06 and 0.87 respectively.
The pilots were briefed for the trials, substantially as follows:
(1) Fly level on the runway heading at the approach entry height until the glide path is intercepted.
(2) The point of interception is to be identified by reference to the ring and bar sight and/or the barrier.
(3) Fly the approach holding speed and glide path as accurately as possible with reference to ground aids and/or the rate of descent indicator,
(4) The flare is to be as late as possible consistent with being able to reduce the rate of descent to less than 6 ft/sec before a possible landing. An overshoot may be initiated before the actual touch-down.
3.2 Andover trials
These trials were confined to 5 programme flights comprising a total of 54 approaches and landings plus a limited number of practice flights. The experimental format was as follows:
Factors Levels 1 2 3
1 Glide path angle 4O 6' a0
2 Glide path guidance NOIW Barrier and Barrier and aiming bar ground sight
3 Pilots D E F
A complete factorial experiment consisted of 27 runs and each run was
repeated once. All three pilots were experienced test pilots but only one
was experienced on the aircraft type. As for the Varsity trials, two pilots
shared each flight and from practical considerations it was necessary to fly
the approaches in groups of three at the same glide path angle. Weather
limitations were approximately the same as in the case of the Varsity but
for STOL, the cross wind imitation was 15 kt.
The weight of the aircraft during the test varied between 42000 lb
and 38000 lb. Approach speeds recomended in Pilots' Notes were used for
all approaches, and with full flap (30') selected,the resulting approach
lift coefficient was 2.06. Approach entry height was 800 ft. Pilots were
given a similar briefing to that for the Varsity trials except that landings
were required off all approaches and touch-down distances were to be as
short as possible consistent with the undercarriage limitations.
4 ANALYSIS OF RESULTS
The quantities measured to assess approach and landrng performance
are listed below,together with the aircraft for which results were
analysed.
(1) (2)
(3)
(4)
(5)
(6)
(7)
(8)
(9)
Glide path holding
Speed holding
Height at the barrier
Glide slope error at the barrier
Height of initiation of the flare
cL at peak normal acceleration in the flare
Airspeed at touchdown
Touch-down rate of descent
Distance of touch-down pomt from barrier
- Varsity
- Varsity
- Varsity, Andover
- Varsity, Andover
- Varsity, Andover
Andover
Andover
Andover
Andover
Glide path and airspeed error were read at l/5 set intervals from
the kmetheodolite and flight records respectively. Mean glide path
errors and mean and standard deviations of speed errors were computed for
each approach. Height and glide path error at the barrier and the distance
of touch-down from the barrier were calculated from the kinetheodolite
records. Height of initiation of the flare, maximum normal acceleration

10
and airspeed at touch-down were read from the respective flight recorder traces. In the case of the Varsity tests no distinction was made between runs with and without an actual touch-down. Touch-down rate of descent was determined from undercarriage strain gauge instrumentation on the Andover.
The results were analysed using the analysis of variance'. This technique allows the important effects of each factor and interactions between factors to be identified. Only first order interactions are considered in the present report. A first order interaction occurs when the effect
of one factor is dependent upon the value of another factor, e.g. height at the barrier may be affected by the type of glide path guidance used for 4' approaches but not for 8' approaches. Results presented for the Varsity show the effects of only those factors or interactmns found to be signifi- cant at a 95% confidence level. For some Andover results none of the factors had a significant effect but all results are presented since the general level and variability of the measurements is of interest. Table 1 indicates significant factors for each measured quantity for both the Varsity and Andover tests.
5 DISCUSSION OF RESULTS
5.1 Varsity trials
5.1.1 Glide path and speed holding
On all approaches the pilots' initial task was to decide when to
commence the glide using the visual guidance available. Because of the significance in relation to terrain clearance, glide path errors were computed in terms of height differences from the theoretical glide slope. The data were analysed from the approach entry pant onwards and the results might thus be expected to show larger errors for the higher entry height approaches,where a small angular error in flight path would produce a relatively large height error compared with the corresponding error on a low entry height approach. But unless visibility was very good, pilots found it difficult to locate the sight from high entry heights,so from this aspect they were genuinely undesirable. However, accurate glide path holding during the initial stages of approaches 1s only important if there is little tune available before reaching a critical point on the approach
path, such as the barrier, and this was not the case for the approaches from 1500 ft.

11
Fig.? shows that at 4', using the sight only, most of the mean approach
errors were negative, indicating that pilots were perhaps tending to fly
the usual 3' approach until the sight could be used. But a high proportion
of negative errors for 500 ft entries is surprising since the sight should
have been usable throughout the approach. A survey of the data for indi-
vidual approaches revealed that the aircraft was consistently low on the
glide path during the initial stages and this suggests that even with the
sight, pilots preferred to anticipate the entry to avoid all possibility of
overshooting it and getting too high. When the barrier was used with the
sight, much more accurate interceptions were made since the barrier could be
much more readily seen. Besides being a glide path aid in itself, it also
helped in locating the sight, enabling earlier use of the sight in conjunc-
tion with the top of the barrier.
For 500 ft interceptions on 8' and 10' approaches, little time was
available on the glide path and it was necessary to make precise power
reductions at entry. Pilots' found that the manoeuvre was easier at 90 kt
because of the simplicity of reducing power to the virtually flight idle
setting required,compared with finding an intermediate setting at the higher
speeds.
Fig.7 also shows that the best glide path holding was achieved with
the sight and barrier. Pilots were unanimous that the sight was of great
assistance in holding an accurate glide path until a height of approximately
50 ft, giving good closing rate information as well as positmn infoma-
t1on. For approaches with the sight only, the large mean errors could be
due to the early part of the approaches being flown with the sight unusable,
as explained earlier in this section,but there may also be an effect from
decreasing sight sensitivity with increasing glide angle. Sight sensitivity
is decreased when the bar is moved nearer the ring to steepen the glide
angle. When they first used the sight pilots complained that they made
corrections in the wrong sense because they tended to treat the sight as a
flight director with the ring as the fixed aeroplane symbol. Thus a low
situation should have been indicated by the bar above the ring, whereas
with the ground sight this indicates a high situation. When approaches
were made with the barrier alone, the technique was to use the top of the
barrier and an intended touch-down point as a guide to fly a fixed approach
angle and modify this angle in the last 200 ft only if it was obvious that
a large miss would occur or there would be a 'dangerously' small clearance.

12
Mean airspeed errors shown in Fig.8 indicate that there is a marked difference in the errors in mean speeds for the three different nominal approach speeds, and the results suggest that 100 kt was the most 'comfort- able' speed. The large positive mean errors for the 90 kt approaches are explained by the fact that at this speed, with full flaps and idling power set, the maximum glide angle available was approximately 10' in a 5 kt headwind increasing to 12' ' in 20 kt, so that for all 10' approaches in low wind conditions there was a tendency to fly faster than 90 kt, especially when regaining the correct glide slope from a high situation. High situations frequently arose because of wind shear effects, and also during the early stages of approaches starting at 1500 ft when the sight could not be used. Negative mean speed errors for 110 kt approaches are not easily explained. Pilots did comment that although there was no great difficulty in flying at 110 kt, large power changes were often required to hold speed in turbulence and when correcting from low situations. A steeper increase in profile drag would tend to keep speed errors negative.
Flg.9 shows that the standard deviation of alrspeed is less for the steeper approaches, lower speeds and when the sight and barrier ads were used, The better guidance from the sight and barrier seems to have enabled the pilots to devote more attention to speed holding but reasons for the effects of glide slope angle and speed are not so apparent. It 1s suggested that easier acquisition of the near idling power setting required for the steeper and lower speed approaches aided speed holding,but on the other hand, the probability of speed increases when correcting from situations high on the glide path would tend to offset this advantage.
5.1.2 Final approach phase
The object of making an accurate approach is to achieve optimum positioning of the aircraft for the subsequent flare and landing. In the pitch plane, height and glide angle at the 50 ft barrier position are significant quantities. The flare initiation height also has an important influence on the resultant landing distance. The effects of significant variables on glide path and height at the barrier and flare Initiation height are illustrated in Figs.10, 11 and 12. Points showing height at the
barrier to be less than 50 ft do not indicate that the barrier was fouled since barrier height varied appreciably owing to gusts and water pressure variations. On all figures the solid columns show mean values.
The following observations can be made by examination of Figs.10, 11 and 12.
13
(a) There are higher mean values and more scatter in height and
glide path angle error at the barrier for the steeper approach angles,
except in the case of pilot A who was more consistent in all these results
than the other two pilots (Figs.10 and 11).
(b) The sight was effective zn reducing the mean and the scatter of
height at the barrier, especially in the case of 10' approaches (Fig.10).
Cc) When the barrier was used without the sight, heights at the
barrier were mcreased and more scattered in the cases of pllots B and C,
but again pilot A's performance was not affected (Fig.10).
Cd) Glide path angle was steepened to reduce barrier clearance on
8' and 10' approaches without the sight (Fig.11). When the sight was
used glide path angles were generally reduced, especially for 10'
approaches.
(e) Height of flare Initiation was generally lower at 4' than at
8' and 10' but pilot A showed less tendency to flare earlier on the steeper
approaches (Fig.12).
(f) When using the sight alone pilot C flared consistently late (at
a mean height of 30 ft) at all approach angles. Without the sight pilot B
tended to initiate the flare early (Fig.12).
w When the sight and barrier was used, glide angle at the barrier
was shallower for 1000 and 1500 ft entry heights, than for a 500 ft entry
height (Flg.11).
The type of barrier used in the trials did not properly simulate
typlcal obstacles met with in practice and this must have affected the
results to some extent. Since It was not possible to project water far
enough onto the runway the aircraft usually passed to one side of the barrier
with only part of one wing actually over it. Pilots commented that this
made it more difficult to Judge their clearance than If the flight path had
been directly over the barrier. However, there is not much doubt that use
of the sight increases the pilot's ability consistently to achieve near
optimum positionmg of the aircraft for the flare and landmg. If a pilot
was unfamiliar with a particular approach path, m terms of angle of approach
and terrain, the sight would be particularly useful in giving hm confidence
that the aircraft was on the glide path at the critical point of the approach
and that a safe landing could be made. Without the sight pilots concentrated
on achievmg a 'close miss' of the barrier and If the glide was inaccurately
14
held during the latter stages of the approach, rate of descent prior to the flare was often far from the target value, with the risk of a high rate of descent at touch-down or a long landing distance.
Smce the Varsity had ample elevator power and stall margin even at the lowest speed used, it could be flared comfortably from a height of 30 ft and it is estimated that, even on a 10' approach, flares could be initiated lower. But one pilot stated that 30 ft was the "psychological barrier" and "the lowest point he would dare to go". Up to this point a rate of descent of even 1700 ft/min could be tolerated! Although flares from 8' and 10' approaches were in general initiated earlier than from 4', the heights were less than might be expected and the variability is much the same for all approach angles. When the sight alone was used flare initiation heights for pilot C are seen to be consistently lower than for the other two pilots. During the final stages of an approach the sight becomes unusuable
between 50 ft and 30 ft when the bar moves outside the ring as viewed from the aircraft and it is possible that pilot C used this feature as a cue to look away from the sight and initiate the flare. With the barrier present there was probably less inclination to refer to the sight when clearing the barrier and judging the subsequent flare.
The different approach speeds invoked little pilot couroent except that they had a slight preference for the lower speeds because at 110 kt the arcraft was very sensitive to elevator inputs and overcontrolling often resulted. However the later stages of the flare were usually deliberately prolonged to avoid high rates of descent near the ground and representative results of the effects of approach speed on the landing characteristics were not obtalned.
5.2 Andover trials
The discussion in this section is concerned with the final stages of
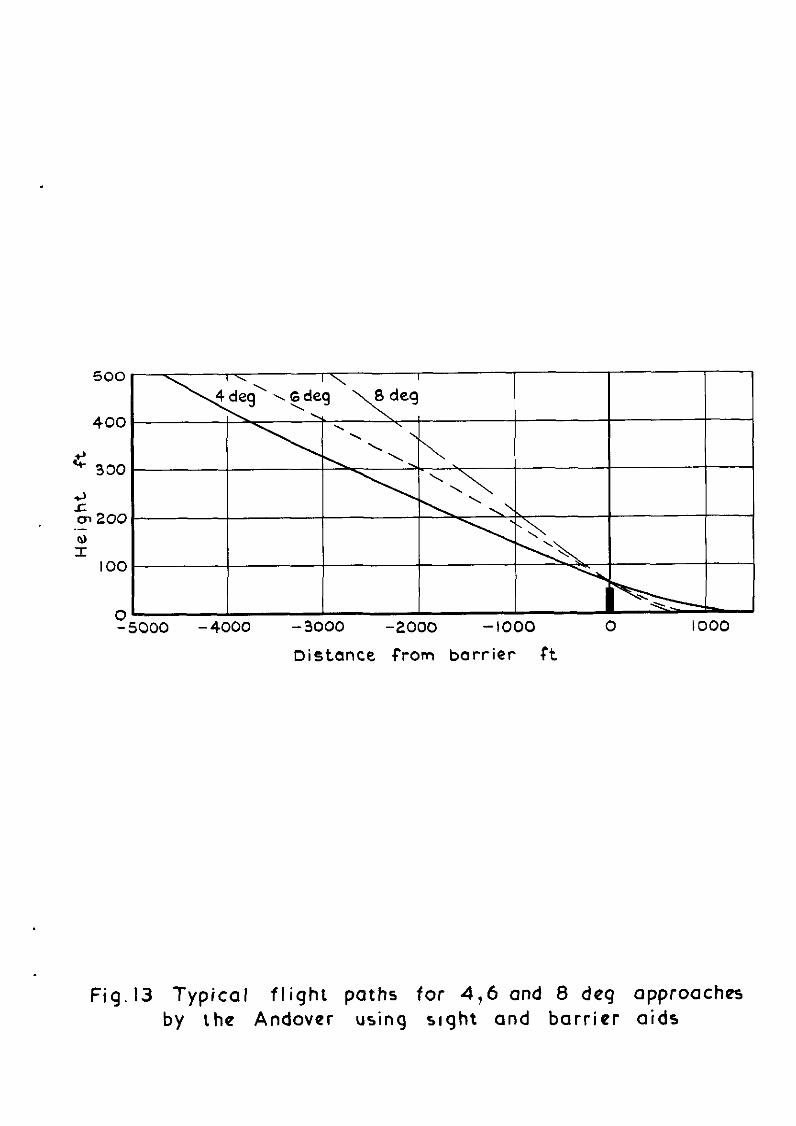
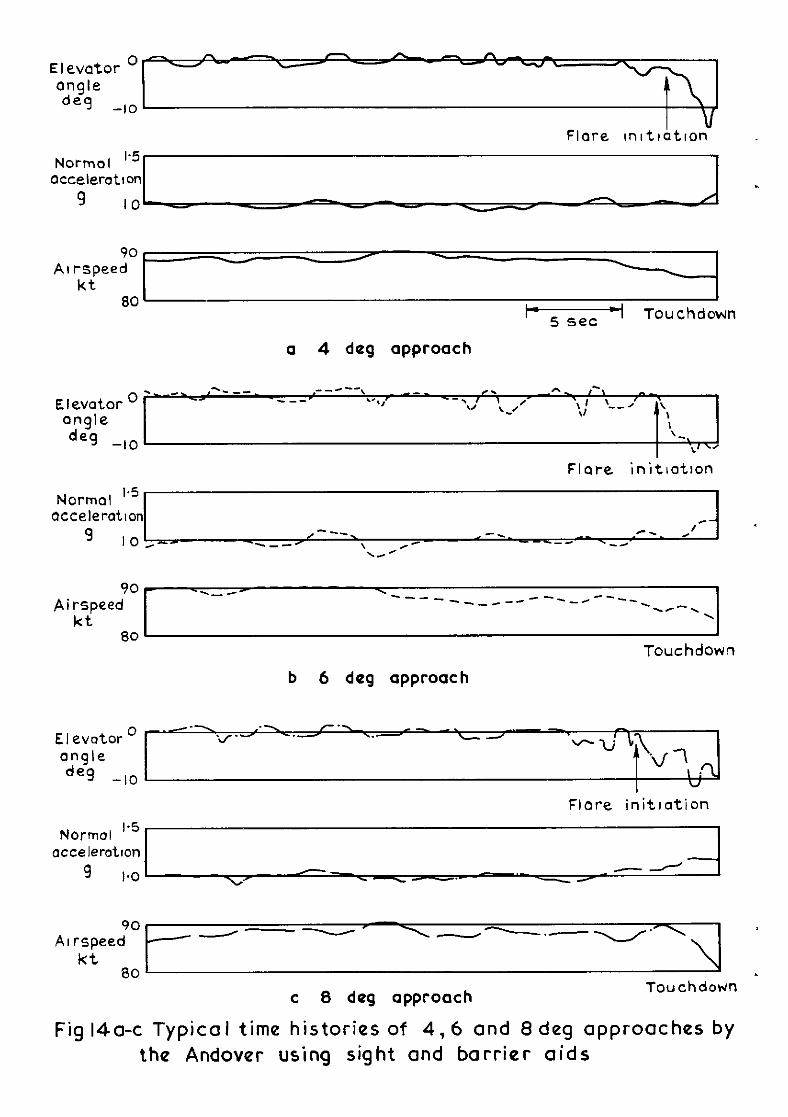
the approach and landing. The results for all pilots are considered together since a preliminary analysts showed no significant differences due to pilots. Flg.13 illustrates the differences in flight path and touch-down distance of typical 4', 6' and 8' approaches using the sight and barrier. The time hlstories of these approaches shown in Fig.14 indicate that there was no apprecuble increase in elevator activity on the three approaches but flare initiation began earlier and speed decrement was more rapid III the case of the 8' approach.

15
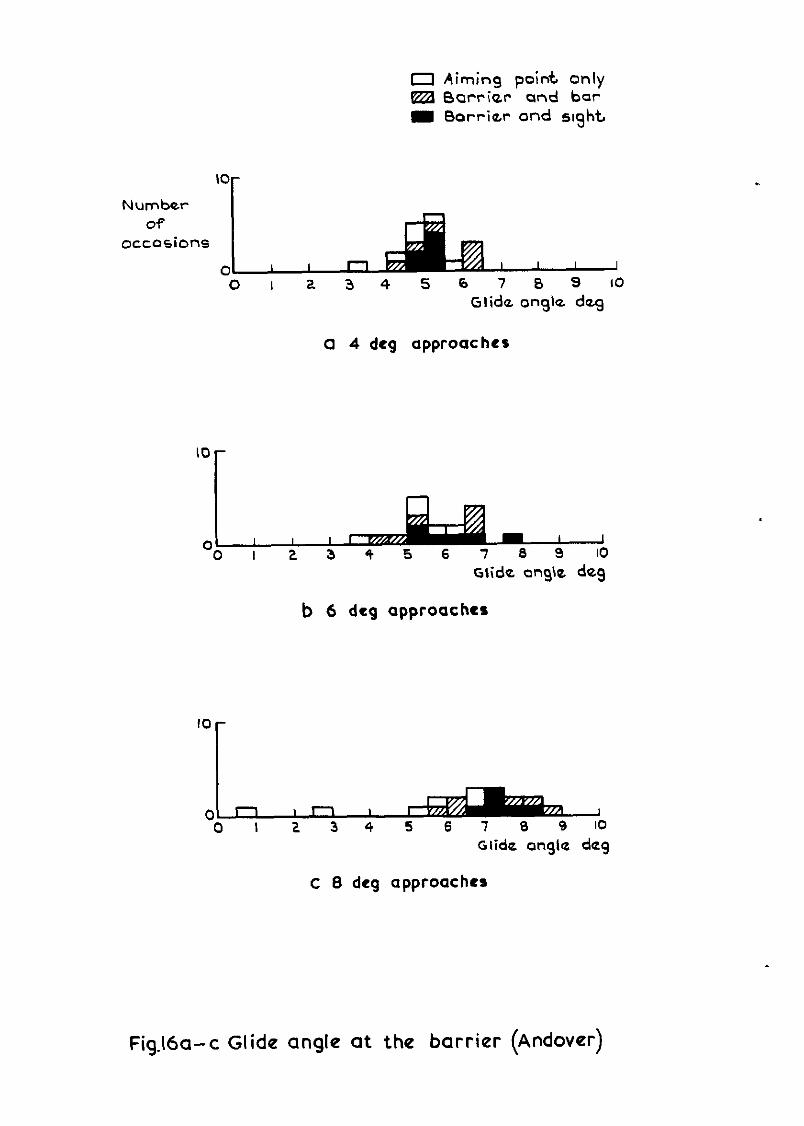
Histograms of height and glide path at the barrier are shown in
Figs.15 and 16. Those results for approaches where the barrier was not
present indicate the height and glide path of the aircraft at a range where
it should, theoretically, have been clearing a 50 ft barrier. When the
barrier is present the mean heights at the barrier are greater than the
target value and also show an increase in comparison with the Varsity results.
It is probable that this increase was caused by the barrier being directly
under the approach path, rather than to one side as xn the Varsity tests.
Pilots commented that the vertical water jets were very effective in
encouraging a ‘definite miss!‘. The Iarge scatter of heights at the barrier,
even when the sight was used, is surprising since it was generally expected
that Judgement of clearance would be improved through flying directly
over the barrier. However, the Varsity results Indicated that clearances
over the barrier varied significantly between pilots and the differences
between the Varsity and Andover results may well reflect this tendency. It
is also possible that greater familiarity with the Varsity and its straight-
forward handling characteristics caused these results to be more consistent.
On approaches when only the alming bar was used with the barrier there
1s some increase in scatter in glide path angle and height at the barrier
compared with sight-aided approaches (Fig.16). As for the Varsity tests,
pilots said that the sight gave “confidence and confirmation” during the
final critical stages of the approach. Using the bar only with the barrier
gave good guidance but the top of the barrier could not always be clearly
dlstinguished, especially in strong winds which tended to disperse the water
at the top of the jets. With only the runway aiming point, results are
seen to be very erratic for the 6’ and 8’ approaches and pllots confirmed
that these were very difficult. One pilot felt that he would be able to
approach down to about 500 ft with just an aiming mark but during the
later stages the sight was invaluable.
Fig.16 shows that for 4’ approaches the glide path at the barrier was
steeper than the nominal value, whereas at So it was shallower. At a given
range from the barrier, say 1000 ft, the aircraft would be only 70 ft above
the barrier at 4’ compared with 140 ft at 8’ and It is possible that pilots
flew on the high side on 4’ approaches to avoid any possibility of getting
low and having to use large power increments at a late stage. The conse-
quence of this would be a steepening of the glide angle at a later stage to
achieve a ‘close miss’ of the barrier. Fig.17 shows that on 8’ approaches

16
the flare was begun above 50 ft on most occasions and this would account for
the mean glide path at the barrier being lower than the nominal 8'.
Heights of flare initiation are lower and less variable for 4' approaches
(Fig.17) but Figs.18 and 19 show that there 18 no detectable increase in the
variability of CL at peak g or distance of touch-down from the barrier for
the steeper approaches. Calculated lift coefficients appear to be qute near
cL (power off), especially at 8' and surprisingly, at 4'. However, at max
these heights, calculation of CL would be unreliable due to ground effect
on indicated airspeed, and CL itself may be affected. At no time did max
the pilots feel that the aircraft was dangerously close to the stall.
Perhaps the most significant result of the tests is that steeper
approaches, with rates of descent up to 1300 ftlmin, lead to shorter airborne
landing distances without increase in variability. Flg.19 shows a mean
decrease of approximately 150 ft between 4' and 6O and the same reduction
between 6' and 8', and in the case of approaches with the barrier and sight
or bar there is no apparent increase in scatter. Rates of descent at
touch-down (Fig.20) are slightly increased at 6' and 8' but again there is
no increase in scatter. Airspeeds at touch-down (Fig.21) are similar for
all angles of approach. Since reverse thrust was not used to touch-down,
the arcraft bounched on most occasions, irrespective of steepness of approach.
The distances shown III Fig.19 refer to.lnitial touch-downs. Bounces may well
have been eliminated by the use of reverse thrust but 8' approaches would
not then have been possible because of the requlrement for a higher idling
fuel flow during the approach.
Pilots did not experience any particular handling problems associated
with the steepness of the approach. The flare was controlled with elevator,
usually without power adjustments until just before touch-down. Some diffi-
culty was experienced in lateral control during the approach. There was a
tendency to wander in heading which was thought to originate from asymmetric
thrust due to inaccurate synchronisation of the engines following power
adjustments. Although pitch control was adequate at the approach speeds
used, the arcraft would not have survived an engine failure at these
speeds owing to insufficient lateral control.
6 CONCLUSIONS
Steep approach flight tests have been made with a Varsity and an
Andover arcraft, III which pilots used simple glide path guidance to fly
17
at different approach angles and speeds. The following conclusions can be
drawn from the results:
(i) Steep approaches up to 10’ could be safely and consistently
made using simple visual glide path guidance. The Andover aircraft could
be landed from 6O and 8’ approaches II-I shorter distances than from a con-
ventional approach without any evidence to suggest that there was a conse-
quent increase in variability or decrease in safety margins.
(ii) Use of a ring-and-bar sight improved glide path holding and
gave pilots confidence in achievmg a successful landing from a steep
approach. It enabled the aircraft to be consistently flown to a
favourable position for the flare and landing, especially when used in
conjunction mth a 50 ft barrier. The usefulness of the sight was to some
extent llmited by adverse visibility conditions but could almost always be
of some help to the pilot during the later stages of the approach.
(iii) A 500 ft height of entry to the approach was found to be
adequate for 4’ approaches but a 1000 ft entry was preferred for steeper
angles. 1500 ft was considere? too high because the sight could not be
seen well enough for use during the initial part of the approach.
(iv) For the aircraft used in the trials, approach speed did not
have a significant effect on the ability of the pilots to fly steep
approaches except in so far as the decrease of drag with decreasing air-
speed limited the glide angle attainable.
(“) There were significant differences in the consistency and
accuracy of approaches by different pilots.
(vi ) A reasonably effective simulation of a barrier was achieved
by the use of water jets.

Table 1 - SUMMARY OF RESULTS
Variable factors
Quantity Ancraft Entry Approach Approach Glide path height angle speed aid P1lot
Glide path holding Varsity sV sV sV
Speed holdmg Varsity =V sV sV sV
Height at the barrier Varsity sV =V sV sV Andover - =A SA
Glide slope error at the I Varsity barrier
sV sV sV =V i Andover - sA "A
Hef;ig; of initiation of
I
Varsity sV sV sV Andover -
CL at peak normal accelera- Andover - tion in the flare
Alrspeed at touch-down Andover -
Rate of descent at touch-down Andover
Distance of touch-down from Andover - barrier
sA
&: =V
= significant effect (Varsity)
sA = significant effect (Andover)
- x effect not measured blank = no significant effect
. *
19
REFERENCES
NO. Author Title, etc. - 1 Hervey C. Quigley Handling qualities and operational problems of a
large four-propeller STOL transport airplane. NASA T.N. D-1647, January 1963
2 Seth B. Anderson Stability and control considerations for STOL
Hervey C. Quigley aircraft.
Robert C. Innis Paper presented to Flight Mechanics Panel of AGARD Paris, France, June 1965
3 Design and analysis of industrial experiments.
Edited by Owen L. Davies. Published by Oliver and Boyd, 1963.

I- 33ft Sin 4
Fig.1 Vickers Varsity T Mk I

4 27ft Pin
loft iin
Flq.2 Hawker Siddeley Andover C Mk I : Mk I

Pilot’s tine of sight
Path of main wheels
Flg.3 Approach over an obstacle usmg a ring and bar sight

~rr~er use ars~ty trials

Fi ver in

S Sight S& 0 Sight and barrier
B Barrier
100
Mean glldc _ path error
ft
ec - -
- - - - - -
- - - - = - - - - = = - - --- = -EG.-
o z-z
=_- =
= q - - - - s - - = II - - - z - - = = - -
-100 = - - - - - -
-
SSB SSB s s 0 Height of o g g 0 0
Ald & & & entry In _ _ 0 0 u1 go0 ,o_u,
0 B B ft
Approach 4O 8’ 100 Approach +, 8” IO0
angle angle
Fig .7 Significant effects on mean glide path error (Varsity)

Mean speed error
kt
IO =
F =
zz
=
-10 L 90 100 110
Speed kt
Fig 8 Slqnifrcant effects on mean airspeed error on the approach (Vorsl ty)

5-
Standard deviotlon 4 -
Of airspeed
on the 3- approach
kt 2-
I -
O-
s S&B
B
Approsch angle
Sight
Sight & barrter
Barrier
speed
Fig 9 Slgnlftcant effects on stondord deviation of 01 rspeed on the opprooch (Vorslty)

I I, ll"'yy
I I \ I I I I I I I I
l-3 n 0 1 0 0 0 6
a l,q& 1 4 l-3
-1 II I IllI lll’y
I Illlay

. .
S Sqht S % 0 Sight and barrw 0 Barrlar
- lndtvidual result
I hlaon
5- s- 5- Actual 9llda angla
4 4- 4- -
-nominal 3 - - - 3- - 3-
qlida any\o i! = - --- - = - -Z
- = = E 2- = -- - - -- = e- 1 -Zj -
- - z -= --_ =; -
Approach anq\a
-2-
-3-
-4 -
-S-
-6- Aid s 5,B
0 4”
-
-
--- - 2 - - - - _ --J - - - =-:(I == - -
-5 - S%B
0 a”
- -
== ==
= = -- 4 -- 4
-- --
-3 ‘i -3 ‘i
-5 -5
-6 -6 sse sse ABC ABC
& 0 IO0 4”
ABC Pilot
aQ
-bL ABC s ZB
B IO0 500
Approach anqla
Fig. II Slgnlflcant affects on the difference between
-
S 2B Aid
0 1500 Hwqht of antry
actual and nominal glide slope angle at the barrier (Varsity)

IS0
I
150
Height of flare inltlation
-
ft 100 c
- = 100 - -
I
- - - - r - - - L e - I = - - - - - -
= - E is c&-3;- - c = - 50 -
I I I = I C
0. 0
Ptlot A B c ABC A B C
Approach angle 4” 8” IO0
S Slqht s CA0 Sight 8 bowler
0 Borrler - Indlvldual result
I Mean
-
- -
- - - - -- - ==-
-Z = E
- iii- -
e -
ABC A 0 C A B c PI lot
s S 0 Ald
8 0
Fig.12 Significant effects on height of flare initiation (Varsity)
100
0 -5000 - 4000 -3000 -2000 -1000 0 1000
Distance from barrier ft
Fig. 13 Typical flight paths for 4,6 and 8 deq approaches by the Andover usinq slqht and barrier aids
Elevator ’ angle
deq -l°C
v S set q Touchdown
a 4 deg approach
Elevator O ._ _. ,----_ --e-y c. A ,-\
-_-I .‘u,’ I , -‘\, \ ,’ angle
‘\,j ‘-- A’ \,
de9 -,. I \-
I L’ ” Flare initlatlon
Normal I.5 accelerotlon
9 IO,--
b 6 dag approach
Touchdown
El evotor O . \\ , angle
-u
de9 -10 b q
I ”
Normal I*5 occelerotfon
9 I.0
Flare initiation
90 AI rspeed --- \-1.-w’-\
kt 60
c 8 dog approach Touchdown
Fig 14~c Typical time histories of 4,6 and 8 deg approaches by the Andover using sight and barrier aids
0 Aiming point only m hrr~er and bar I Barriorr and sight
IO r Number
of occasions
'Target height at bowler ft
Q 4 deg approaches
b 6 deg approaches
C 0 deg dpproaches
Fig.15 a-c Height at the barrier (Andover)
0 Aiming point only m BQrrier and bar I Barriar ond slyht
IO-
Number of
occasions
0 0 I 2 3 4 5 6 7 8 9 10
Glide. ongla dq
a 4 drg approaches
Glide. ongk deg
b 6 deg approaches
Glide angle dog
c 8 dcg approaches
Fig.l6a-c Glide angle at the barrier (Andover)

0 Aimmg point only m Borrler and bar m Barrw- and sight IO -
Number of
occosbons 0 I
0 50 100
He1qht of flare lnitiat Ion ft
a 4deg approaches
IO -
0, I 0 50 100
b 6 deg approaches
50
C 8 dog approaches
Flg.l7a-c Height of flare mrtiatron @ndover)

0 Aiming point only Cilia Barrier and bar m Bower and sqht
Number of 5
occasions
0 0 I,0 2-o 30
C, at peak ‘q’
a 4 deg approachas
IO -
5-
0 0
/ I i ,
I I , nl, I
i-0 2.0 30
b 6 deg approaches
IOr
I.0 2.0 C 8 dog approaches
3-o
Fig .I8 a-c CL at peak ‘g’(Andover)
IO
Number of occasions
I
AlmIng point only Barrier and bar
Barrier and sight
Touchdown dlstonce tram barrier ft
a 4 deg approaches
‘.I: 0 500 1000 1500
b 6 dog approaches
c 8 dog approaches
Flg.l90-c Touchdown distance from the barrier (Andover)
o Aimlnq point only
m Borriar and bar
m Barrier and slqht
IO
Number r
.
0 I 2 3 4 5 6 7 B 9 IO Rata of dascmt at touchdown ft/sac
a 4 dog approachas
0 I I 1 0 I 2 3 4 5 6 7 8 3 IO
b 4 dog approaches
0 I 2 3 4 5 6 7 8 9 IO
c 8 dog approaches
‘
Fig 20a-c Rate of descent at touchdown (Andover)

. IO
Number of
occasions
0 70 80 90
Alrspeed kt
a 4 deg approaches
0 Aiminq point only m Barrier ond bor li Barrrer and mqht
70 80 90
b 6 dog approaches
70 80 90
c B deg approaches
Fig.21 a-c Airspeed at touchdown (Andover) Prmtcd WI &&mt for Her Malesty k .Votro,rery Offrcc by thr Royal Awcraft hstabltshmo~r. Famborrmgh Dd Sfll 371 K 4

DETACHABLE ABSTRACT $ARD
‘ r----------------
AR.C. CP. :io.n% 629.13.087 : Lk-cenher 1?6Y 629.136-118
O’tea-Y, c-0. s1etter, :‘.Y.
Steep a&roach teSts with a Varsity and an Andover aircraft BP? described. Using the Varsity aIm%rt. 243 visual approaches were rlovn in a statistl- csl experiment which Included wiatlons or approach angle. speed, height 01 entry to the approach, glide peLh guidance and pilots. A statistical analysis oI the errects or the variables on various approach pwlommce parameters vas carried o”t and the signlrlcent ~‘PSUXS am lllustraled and dlzussed. Tests with Lhe AndOwr aircraft were on a smaller scale and wepe primrlly cmcemed with the rfnal phase or the appwxb and landin&
$-------- ---------
: A-R.“. CP. ,io.lUR 629.13.087 : ’ ceccrb”r 1m 629.136-118
OxPxy, c-0. : slatter. .i.v.

--------------- A&---------------d


C.P. No. I 138
Published by HER MAJESTY’S STATIONERY OFFICE
To be purchased from 49 High Holborn, London w C 1
,3a Castle Street, Edinburgh EH2 3AR 109 St Mary Street, Cardit @I 1IW
Brazennose Street. Manchester 2 50 Fa,rfax Street, Bristol BSl 3DE 258 Broad Street, Brm~ngham 1
7 JJrmllall street, Belfast FIT2 SAY or through any bookseller
C.P. No. I 138 SBN 11 470386 8