Embed Size (px)
Citation preview

Flammability, Ignition Energy and Flame Speedsin NH3-H2-CH4-N2O-O2-N2 Mixtures
Ulrich Pfahl and Joseph E. Shepherd
Graduate Aeronautical LaboratoriesCalifornia Institute of Technology
Pasadena, CA 91125
Explosion Dynamics Laboratory Report FM97-4R1
July 15, 1997
Prepared for Los Alamos National Laboratory underContract 929Q0015-3A, DOE W-7405-ENG-36

Abstract
This report describes studies on flammability and flame propagation in mixtures of interest to theFlammable Gas Safety Issue for the waste tank farms at the Hanford site. Flammability limits, pressurehistories, ignition energy, and flame speeds have been measured for selected mixtures of hydrogen–nitrousoxide–air, methane–nitrous oxide–air, ammonia–nitrous oxide and hydrogen–nitrous oxide–ammonia–nitrogen–methane–air mixtures at initial pressures of 100 kPa. These investigations were accompanied byreactant and product gas-analysis using gas chromatography and Fourier transform infrared spectrometry.
ii

Contents
Executive Summary v
1 Introduction 1
1.1 The Present Study . . . . . . . . . . . . . . . . . . . . . . . . . . . . . . . . . . . . . . . . . . 3
2 Facility 5
3 Reactant and Product Gas Analysis 8
3.1 Gas Chromatography . . . . . . . . . . . . . . . . . . . . . . . . . . . . . . . . . . . . . . . . . 8
3.2 Fourier Transform Infrared Spectrometry . . . . . . . . . . . . . . . . . . . . . . . . . . . . . 12
4 Nitrous Oxide Consumption 15
4.1 Hydrogen–Nitrous Oxide–Air Mixtures . . . . . . . . . . . . . . . . . . . . . . . . . . . . . . . 15
4.1.1 Final Pressure Evaluation . . . . . . . . . . . . . . . . . . . . . . . . . . . . . . . . . . 16
4.2 Methane–Nitrous Oxide–Air Mixtures . . . . . . . . . . . . . . . . . . . . . . . . . . . . . . . 19
4.3 Ammonia–Nitrous Oxide Mixtures . . . . . . . . . . . . . . . . . . . . . . . . . . . . . . . . . 20
4.4 Mixtures A/B/C/D with Air . . . . . . . . . . . . . . . . . . . . . . . . . . . . . . . . . . . . 23
5 Hydrogen–Nitrous Oxide–Nitrogen Mixtures 25
6 Methane–Nitrous Oxide–Nitrogen Mixtures 26
6.1 Flammability Limit . . . . . . . . . . . . . . . . . . . . . . . . . . . . . . . . . . . . . . . . . . 26
6.2 Influence of Small Amounts of Oxygen (3 - 5%) on the Flammability Limit . . . . . . . . . . 28
6.3 Influence of Ignition Energy on the Flammability Limit . . . . . . . . . . . . . . . . . . . . . 28
7 Ammonia–Nitrous Oxide–Nitrogen Mixtures 33
7.1 Flammability Limit . . . . . . . . . . . . . . . . . . . . . . . . . . . . . . . . . . . . . . . . . . 33
7.2 Influence of Ignition Energy on the Flammability Limit . . . . . . . . . . . . . . . . . . . . . 37
8 Mixture 27 44
8.1 Lean Flammability Limit and Ignition Energy Bounds . . . . . . . . . . . . . . . . . . . . . . 44
8.2 Product Composition . . . . . . . . . . . . . . . . . . . . . . . . . . . . . . . . . . . . . . . . . 47
9 Mixture 28 48
9.1 Lean Flammability Limit and Ignition Energy Bounds . . . . . . . . . . . . . . . . . . . . . . 48
9.2 Product Composition . . . . . . . . . . . . . . . . . . . . . . . . . . . . . . . . . . . . . . . . . 51
10 Mixture 29 52
10.1 Lean Flammability Limit and Ignition Energy Bounds . . . . . . . . . . . . . . . . . . . . . . 52
iii

10.2 Product Composition . . . . . . . . . . . . . . . . . . . . . . . . . . . . . . . . . . . . . . . . . 52
11 Burning Velocities of Mixtures 27 - 29 55
12 Conclusions 57
iv

Executive Summary
This report summarizes flammability and flame propagation studies in FY97 on flammable gases retainedin the waste within the tank farm at the Hanford site. This work is a continuation of previous studies atCaltech on the flammable gas issue.
Experiments have been carried out in an 11.25-liter combustion vessel for a wide range of mixtures. Mea-surements include peak pressure, flammability limits, ignition energy, flame speed, nitrous oxide consumptionand product composition. The mixtures studied were hydrogen–nitrous oxide–air, methane–nitrous oxide–air(10% N2O), ammonia–nitrous oxide and hydrogen–nitrous oxide–ammonia–nitrogen–methane–air mixturesrepresentative of retained gases.
Lower and upper flammability limits and ignition energy bounds of methane–nitrous oxide–nitrogen andammonia–nitrous oxide–nitrogen mixtures with air have been determined. We investigated the influence ofsmall amounts of oxygen (3 to 5%) on flammability of methane–nitrous oxide–nitrogen mixtures.
The behavior of nitrous oxide consumption in hydrogen–nitrous oxide–air is very different than inmethane–nitrous oxide–air or ammonia–nitrous oxide mixtures. Whereas the nitrous oxide completely dis-sociates during combustion of all flammable methane–nitrous oxide–air and lean ammonia–nitrous oxidemixtures (even with 54% nitrogen dilution) it only partially dissociates for lean hydrogen–nitrous oxide–airmixtures (less than 14% H2). For barely flammable hydrogen–nitrous oxide–air mixtures (6% H2), almostno nitrous oxide is consumed. There is a distinct increase in the nitrous oxide consumption as the initialhydrogen concentration is increased from 8% to 9%.
The lower flammability limit of methane–nitrous oxide mixtures occurs at 2.7% methane for ignitionenergies less than 10 J. This value increases to 4.7% for ignition energies less than 0.04 J. The upperflammability limit is between 40 and 50% methane for ignition energies less than 10 J. Addition of 70%nitrogen will inert the mixture. Small amounts of oxygen (3 to 5%) do not significantly influence the limitsor inerting concentration.
The flammability limits of ammonia–nitrous oxide mixtures occur at 5.2% (LFL) and 67.5% (UFL)ammonia for ignition energies less than 10 J. Ignition energy bounds for ammonia–nitrous oxide mixtureswere measured for ignition energies between 0.04 J and 8 J at 0 and 54% nitrogen dilution. Addition of 60%nitrogen or 84% air will inert the mixture. A stochiometric ammonia–air (28% ammonia, 72% air) mixtureat 100 kPa initial pressure is flammable for ignition energies above 0.7 J.
For ignition energies less than 10 J, the flammability limits of mixture 27 (40% H2, 40% N2O, 20% CH4),mixture 28 (35% H2, 35% N2O, 10% CH4, 20% NH3) and mixture 29 (29% H2, 24% N2O, 11% NH3, 35%N2, 1% CH4) occur at 7%, 9% and 14%. Whereas mixtures 27 and 28 are flammable up to 100% (no air),the upper flammability limit for mixture 29 with air occurs between 90 and 100%. All three mixtures showno pronounced dependence of the lean flammability limit on the ignition energy between 0.04 and 8 J. Flamespeeds of mixtures 27 and 28 with air are almost equal between 80 and 90% air (quiescent conditions),whereas the flame speed of mixture 29 with air is much slower.
v
1 Introduction
The goals of this study are to characterize the combustion behavior of gas mixtures that are relevant toretained gas within the waste in the tank farm located at the Hanford site. The range of compositionspresent in the retained gas within the waste is illustrated in Table 1, which gives data from recent retainedgas sampling activities. The typical average tank temperatures are 40 to 50◦C except for A-101, which is66◦C. The thermodynamic characteristics of these fuel-oxidizer combinations is summarized in Tables 2 and 3.
Table 1: Representative retained gas compositions from the waste tanks at the Hanford Site.
Tank VGRE H2 N2O N2 NH3 CH4 H2O(m3) (%) (%) (%) (%) (%) (%)
Double Shell TanksSY-101 131 29 24 33 11 1 2AW-101 14 31 4.3 60 .02 1.6AN-105 26 63 11 25 .02 0.7AN-104 23 47 19 32 .02 0.9AN-103 14 61 3.8 34 .05 0.01
Single Shell TankA-101 - 75 5.6 16 2.4 .7
Table 2: Standard heats of formation for the species of interest in retained gases.
species ΔfH◦
(kJ/mol)NH3 -45.9CH4 -74.8N2O +82.1CO2 -393.7H2O -241.9H2 0.0N2 0.0O2 0.0
Table 3: Standard heats of reaction for fuel-oxidizer combinations found in retained gases.
Reaction ΔRH◦ ΔN
(kJ/mol)N2O −→ N2 + 1/2O2 -82.1 1/2NH3 + 3/4O2 −→ N2 + 3/2H2O -195 3/4CH4 + 2O2 −→ CO2 + 2H2O -857. 0H2+ 1/2O2 −→ H2O -241 -1/2
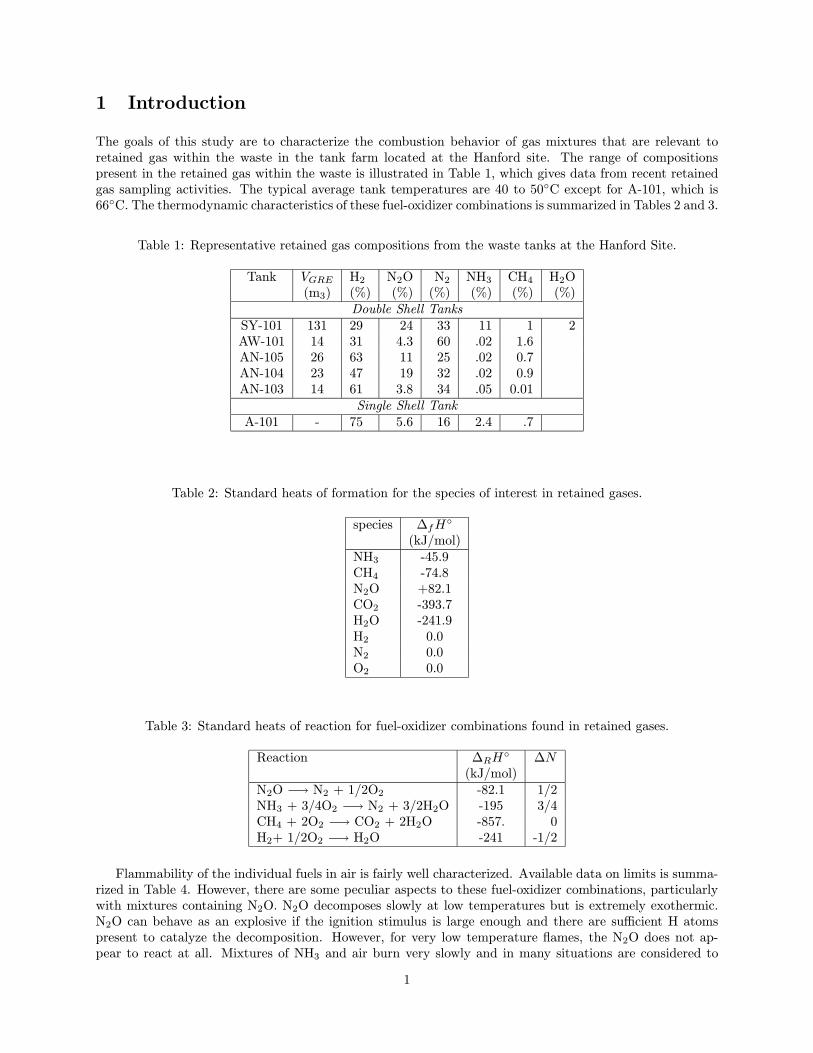
Flammability of the individual fuels in air is fairly well characterized. Available data on limits is summa-rized in Table 4. However, there are some peculiar aspects to these fuel-oxidizer combinations, particularlywith mixtures containing N2O. N2O decomposes slowly at low temperatures but is extremely exothermic.N2O can behave as an explosive if the ignition stimulus is large enough and there are sufficient H atomspresent to catalyze the decomposition. However, for very low temperature flames, the N2O does not ap-pear to react at all. Mixtures of NH3 and air burn very slowly and in many situations are considered to
1
be nonflammable. However, mixtures of NH3 and N2O appear to react much more rapidly. The reactionmechanism of N2O and NH3 is particularly uncertain. H2 has a very large flammablility range and unusuallyhigh flame speed.
Table 4: Flammability limits for fuel-air mixtures at NTP. Amounts are given in volume %. LFL = LowerFlammability Limit, UFL = Upper Flammability Limit, DPL = Downward Propagation Limit, UPL =Upward Propagation Limit
Fuel LFL ST UFL Inert (N2)UPL DPL
H2 4 8 29.6 75 70CH4 5 9.5 15 37NH3 15 18 22 28 15
Flammability of fuels in N2O is not as well characterized as in air. At the time we started this study, noinformation was available on CH4 limits and the data available for NH3 was quite limited. Our present dataon the limits is given in Table 5.
Table 5: Flammability limits for fuel-N2O mixtures at NTP. Amounts are given in volume %.
Fuel LFL UFL Inert (N2)UPL DPL
H2 3 6 84 ∼60CH4 5 50 70NH3 2.6 6.8 71 60
Understanding of flammability in binary and ternary fuel mixtures (H2-NH3-CH4) is rudimentary. Themost common assumption is that the limiting mole fractions Xi of each fuel species i obey Le Chatelier’sRule: ∑
fuels
Xi
Xi,LFL= 1 at mixture LFL (1)
where Xi,LFL is the limit concentration for a single fuel species i in the oxidizer-diluent mixture of interest.The effect of multiple oxidizers (O2, N2O) on flammability limits is not well understood.
Our present understanding of the pressure loads in these mixtures is based on simple but reliable ideas.A standard approach is to use constant volume explosion estimates (AICC- adiabatic, isochoric, completecombustion) based on chemical equilibrium ideas. For this purpose, we use the computer program STAN-JAN which is based on the JANNAF thermochemistry data and minimization of Gibbs energy. Althoughreasonably reliable, there are some cautions about using these values in safety assessments:
1. Incomplete combustion occurs near the LFL for H2 and NH3
2. There are cellular instabilities and a strong Lewis number effect for H2
3. N2O undergoes partial or no reaction in lean mixtures
4. Ignition energies are very high for large amounts of N2O and small amounts of fuel
In general, it is found that H2 dominates behavior of mixtures. Estimates of peak pressure and temperaturein fuel-air explosions are given in Fig. 1, and for fuel-N2O mixtures in Fig. 2.
2

2
3
4
5
6
7
8
9
10
0 10 20 30 40 50 60 70 80
Pre
ssur
e (a
tm)
Percent Fuel
Constant Volume Explosion Pressure
H2-AirCH4-AirNH3-Air
500
1000
1500
2000
2500
3000
0 10 20 30 40 50 60 70 80
Tem
pera
ture
(K
)
Percent Fuel
Constant Volume Explosion Temperature
H2-AirCH4-AirNH3-Air
Figure 1: Constant volume explosion pressures and temperatures in fuel-air mixtures, initial conditions of 1atm and 295 K.
1.1 The Present Study
One focus of the present study is to develop information on fuel-N2O systems over a wide range of dilution.The previous work (Ross and Shepherd 1996) considered primarily the lean flammability behavior of thefollowing mixtures:
1. H2-N2O-Air
2. NH3-N2O-Air
3. H2-NH3-Air
4. Four-Part Mixtures (A - D given in Table 6)
In the present study we have concentrated on measuring flammability maps, ignition energy bounds,and product compositions. We consider these same fuels but focus on N2O as the oxidizer with N2 and airdilution. We have also re-examined the selected blends (A - D) of Table 6, and considered four new blendslabeled mixtures 27 -29. The numbers in parentheses refer to the original notation of Ross (1996).
The plan of this document is to first present the details of the facility, concentrating on the differencesfrom the previous setup. Then the gas sampling system and calibrations will be described. Following thisbackground, we discuss results for each of the gas compositions we have studied.
3

6
8
10
12
14
16
18
20
0 10 20 30 40 50 60 70 80 90
Pre
ssur
e (a
tm)
Percent Fuel
Constant Volume Explosion Pressure
H2-N2OCH4-N2ONH3-N2O
1600
1800
2000
2200
2400
2600
2800
3000
3200
3400
3600
0 10 20 30 40 50 60 70 80 90
Tem
pera
ture
(K
)
Percent Fuel
Constant Volume Explosion Temperature
H2-N2OCH4-N2ONH3-N2O
Figure 2: Constant volume explosion pressures and temperatures in fuel-N2O mixtures, initial conditions of1 atm and 295 K.
Table 6: Fuel blends A-D (also considered in original study) and blends 27-29 considered in the presentstudy.
Mixture H2 N2O NH3 CH4 N2
(vol %) (vol %) (vol %) (vol %) (vol %)A (26) 42 36 21 1 0B (11) 35 35 30 0 0C (12) 25 25 50 0 0D (20) 16.7 33.3 50 0 027 40 40 0 20 028 35 35 20 10 029 29 24 11 1 35
4
2 Facility
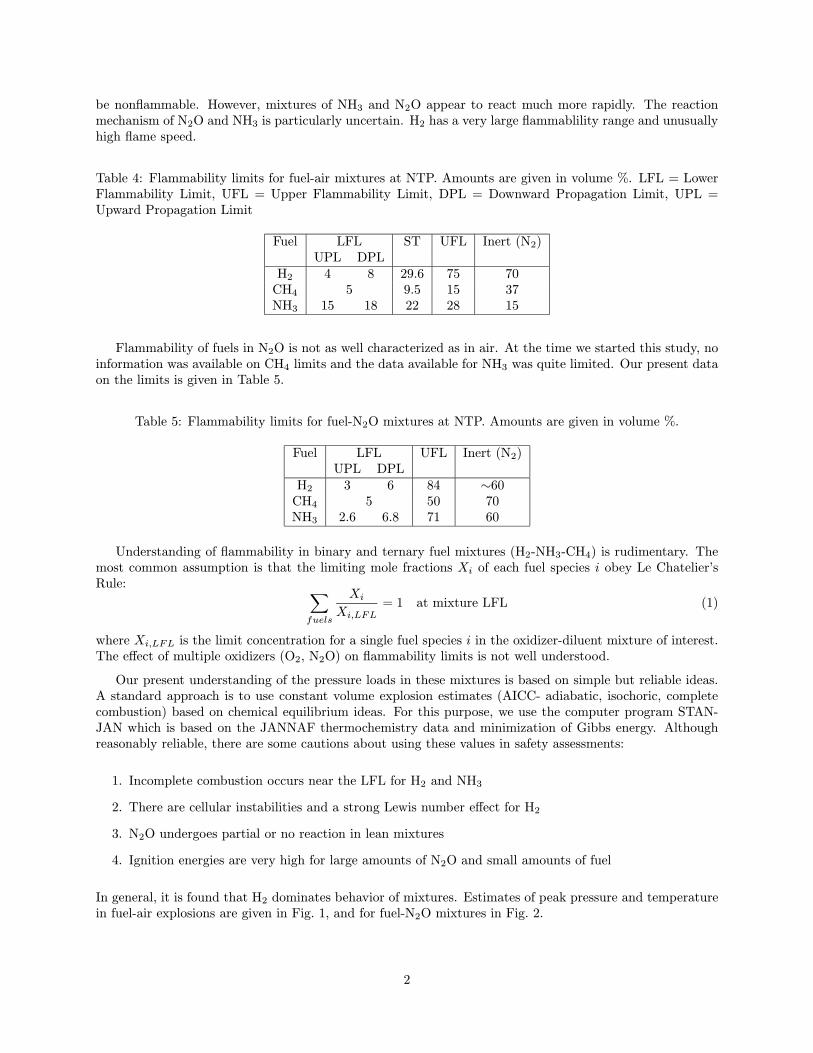
The present experiments were done in a combustion vessel Mini-CONVOL (MCV in Fig. 3) which has avolume of 11.25 liters. The vessel is constructed of steel slabs and forms a rectangular chamber with internaldimensions of 190 mm × 203 mm × 305 mm.
The gas-supply and vacuum system, instrumentation, and data acquisition are identical to those used inthe previous study (Ross and Shepherd 1996). The vessel can be evacuated, filled with a mixture of gasesusing partial pressures to determine composition and the products are exhausted through a treatment systemfollowing combustion. Special precautions, described in Ross and Shepherd (1996), are taken when usingammonia. To make gas analysis possible we connected the vessel, gas chromatograph, and fourier transforminfrared spectrometer by a sampling loop (see GC and FTIR in Fig. 3). This loop can be evacuated and thetest gas is pumped through the system to get a homogeneous mixture.
All investigations were carried out under turbulent gas conditions except tests to measure flame speedsunder quiescent conditions for mixtures 27 - 29. The turbulence was produced by a single mixing fan withtwo blades, about 150 mm in diameter. The mixing fan is driven by a pulley drive (6.7:1 reduction) from auniversal motor controlled by a speed control (light-dimmer switch). The shaft for the fan was connected toa magnetic torque transmitter which is located at the top of the vessel. Flow measurements were made1 near
MCV
window fanthermocouple
ignitorpressure gauge
CH4H2
bottle farm
O2N2ON2He
GC
FTIR
separator
air
NH3
Figure 3: Schematic diagram of the constant volume vessel, gas supply, vacuum system and the gas samplingfacilities.
the ignition location with a single-component laser doppler anemometer (LDA). The signals were processedwith a Dantec model 55L96 counter to obtain mean u and fluctuating velocities urms in the vertical direction.The result of these measurements is given in Table 7. Mean flow and fluctuations increase with fan rotationalspeed, however the turbulence intensity u′ = urms/u is found to be relatively independent of the rotationalspeed. Measurements at various locations also indicate that the turbulence intensity is relatively independentof position. The combustion vessel is instrumented with a pressure gauge and a thermocouple (see Fig. 3).After passing through signal conditioning units, the output of these gauges is recorded on a digital data
1The authors thank Kumar Raman for carrying out these measurements.
5
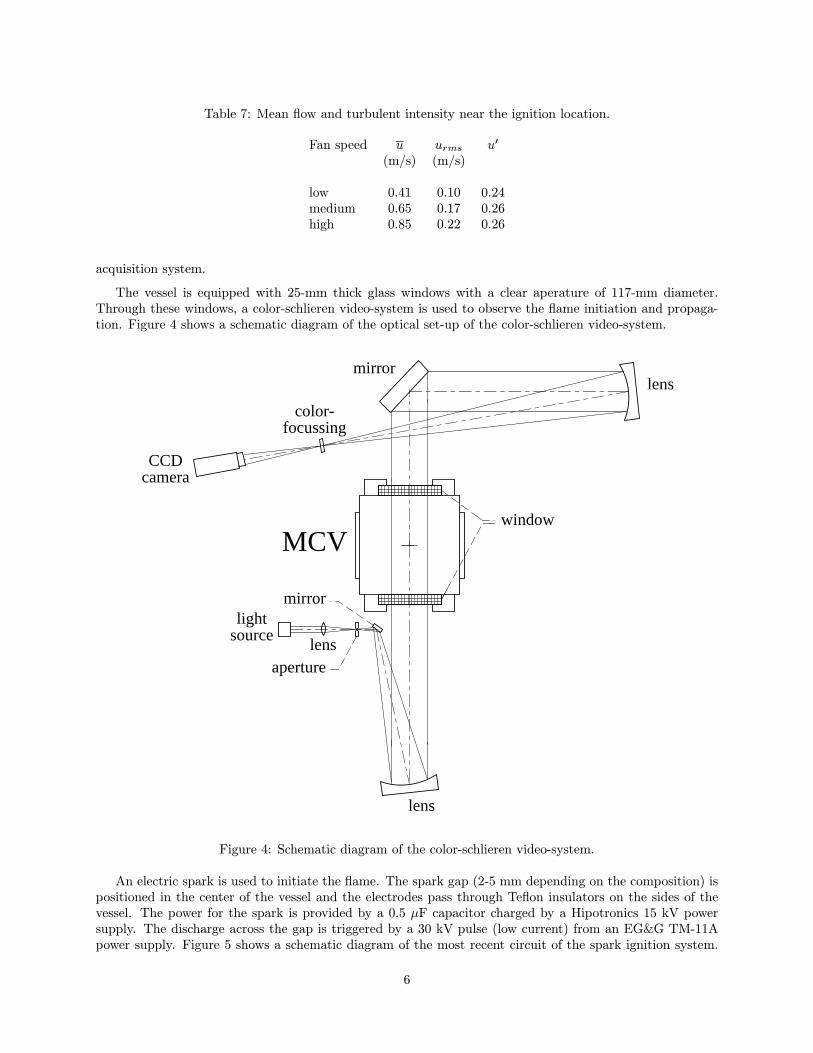
Table 7: Mean flow and turbulent intensity near the ignition location.
Fan speed u urms u′
(m/s) (m/s)
low 0.41 0.10 0.24medium 0.65 0.17 0.26high 0.85 0.22 0.26
acquisition system.
The vessel is equipped with 25-mm thick glass windows with a clear aperature of 117-mm diameter.Through these windows, a color-schlieren video-system is used to observe the flame initiation and propaga-tion. Figure 4 shows a schematic diagram of the optical set-up of the color-schlieren video-system.
lens
lens
lightsource
CCDcamera
lensaperture
mirror
mirror
color-focussing
MCVwindow
Figure 4: Schematic diagram of the color-schlieren video-system.
An electric spark is used to initiate the flame. The spark gap (2-5 mm depending on the composition) ispositioned in the center of the vessel and the electrodes pass through Teflon insulators on the sides of thevessel. The power for the spark is provided by a 0.5 μF capacitor charged by a Hipotronics 15 kV powersupply. The discharge across the gap is triggered by a 30 kV pulse (low current) from an EG&G TM-11Apower supply. Figure 5 shows a schematic diagram of the most recent circuit of the spark ignition system.
6

The circuit is motivated by the design described in Ronney (1985).
Capacitor0.5 μF
HipotronicsPower Supply
+_6 kV 30 kV
EG & G TM-11APower Supply
SparkGap
R 250 ΩR 2 MΩ DiodeDiode
R 0.01 Ω
+_
~ I
R 330 kΩ R 1090 MΩ
~ V+_
+_
+_
+_
Figure 5: Schematic diagram of the spark ignition system.
7

3 Reactant and Product Gas Analysis
The experimental studies reported subsequently were mostly carried out using pre- and post-burn gas anal-ysis. For these analyses, the Gas Chromatograph (GC) and the Fourier Transform Infrared Spectrometer(FTIR) were used. The measured substances are the fuels H2 and CH4, the oxidizers N2O and O2, and alsothe inert component N2.
3.1 Gas Chromatography
In the present investigations, the MTI Analytical Instruments M200 Micro Gas Chromatograph with twocolumns (column A: molecular sieve MS-5A 10m, column B: poraplot Q OV-1 4m, 2μm) was used. Theinstrument was supplied from Westinghouse Hanford Company and set up by H.A. Frey and C.J. Hewitt ofCST-6, Los Alamos.
Figures 6 and 7 show examples of one pre- and one post-burn chromatogram of run 246. The pre-burnpartial pressures were: 8.6 kPa H2, 10.0 kPa N2O (GC: 9.8 kPa, FTIR: 10.2 kPa), 17.3 kPa O2 and 62.8kPa N2. The post-burn partial pressures were: 0.3 kPa H2, 6.0 kPa N2O (GC: 5.7 kPa, FTIR: 6.3 kPa),14.1 kPa O2 and 78.7 kPa N2.
Time (sec.)
Amplitude V
45.00 50.00 55.00 60.00 65.00 70.00 75.00 80.00 85.00 90.00 95.00
0.000
0.250
0.500
0.750
1.000
1.250
1.500
1.750
2.000
2.250
2.500
2.750
3.000
3.250
3.500
Channel: ACurrent Time: Apr 02, 1997 17:15:22Method: c:\uli\gc\method\01_24_97.metFile : c:\uli\gc\data\g246i.2Data file creation time: Feb 10, 1997 10:57:30Instrument ID: •Column Type: îxOct 21, 1996 15:30:48Carrier Gas: Column Head Pressure: 30.1 psiColumn Temperature: 45 CInstrument Gain: LOWSample Time: 5 secondsInject Time: 30 millisecondsRun Time: 100 seconds
Time (sec.)
Amplitude V
19.00 21.00 23.00 25.00 27.00 29.00 31.00 33.00 35.00 37.00
0.250
0.500
0.750
1.000
Channel: BCurrent Time: Apr 02, 1997 17:15:44Method: c:\uli\gc\method\01_24_97.metFile : c:\uli\gc\data\g246i.2Data file creation time: Feb 10, 1997 10:57:30Instrument ID: •Column Type: 15:30:48Carrier Gas: Column Head Pressure: 27.6 psiColumn Temperature: 50 CInstrument Gain: LOWSample Time: 5 secondsInject Time: 40 millisecondsRun Time: 100 seconds
Figure 6: GC results for run 246, pre-burn; channel A: 1st peak (RT = 54.1 s) 17.3 kPa O2, 2nd peak (RT= 90.9 s) 62.8 kPa N2; channel B: 1st peak (RT = 22.5 s) 8.6 kPa H2, 3rd peak (RT = 34.0 s) 9.8kPa N2O.
Both calibrations between measured area counts and the gas partial pressure, and also all gas analysiswere done at a total pressure of 100 kPa. In case the post-burn total pressure differs more than ± 2 kPa from100 kPa (which is usually the case), the pressure was corrected by filling with nitrogen or by evacuation. Thecomposition results were then corrected to compensate for this change in pressure in the vessel. This wasfound to be an important step in carrying out accurate measurements with the GC. Another important stepin the procedure was to bake the molecular sieve column out at 180◦C overnight under a vacuum before eachset of measurements. Even though the inlet to the GC used a H2O membrane separator (A+ corporation,
8
Time (sec.)
Amplitude V
45.00 50.00 55.00 60.00 65.00 70.00 75.00 80.00 85.00 90.00 95.00
0.000
0.250
0.500
0.750
1.000
1.250
1.500
1.750
2.000
2.250
2.500
2.750
3.000
3.250
3.500
Channel: ACurrent Time: Apr 02, 1997 17:16:57Method: c:\uli\gc\method\01_24_97.metFile : c:\uli\gc\data\g246f.2Data file creation time: Feb 10, 1997 11:30:05Instrument ID: •Column Type: îxOct 21, 1996 15:30:48Carrier Gas: Column Head Pressure: 30.1 psiColumn Temperature: 45 CInstrument Gain: LOWSample Time: 5 secondsInject Time: 30 millisecondsRun Time: 100 seconds
Time (sec.)
Amplitude V
19.00 21.00 23.00 25.00 27.00 29.00 31.00 33.00 35.00 37.00
0.250
0.500
0.750
1.000
Channel: BCurrent Time: Apr 02, 1997 17:17:33Method: c:\uli\gc\method\01_24_97.metFile : c:\uli\gc\data\g246f.2Data file creation time: Feb 10, 1997 11:30:05Instrument ID: •Column Type: 15:30:48Carrier Gas: Column Head Pressure: 27.6 psiColumn Temperature: 50 CInstrument Gain: LOWSample Time: 5 secondsInject Time: 40 millisecondsRun Time: 100 seconds
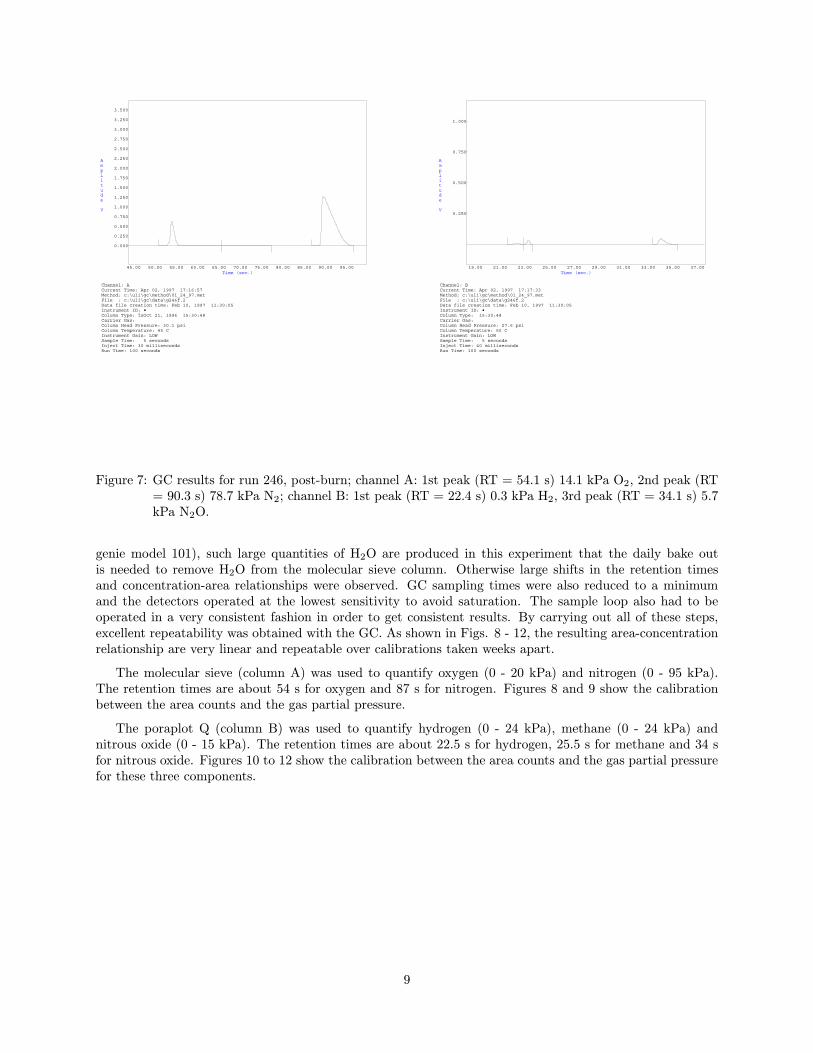
Figure 7: GC results for run 246, post-burn; channel A: 1st peak (RT = 54.1 s) 14.1 kPa O2, 2nd peak (RT= 90.3 s) 78.7 kPa N2; channel B: 1st peak (RT = 22.4 s) 0.3 kPa H2, 3rd peak (RT = 34.1 s) 5.7kPa N2O.
genie model 101), such large quantities of H2O are produced in this experiment that the daily bake outis needed to remove H2O from the molecular sieve column. Otherwise large shifts in the retention timesand concentration-area relationships were observed. GC sampling times were also reduced to a minimumand the detectors operated at the lowest sensitivity to avoid saturation. The sample loop also had to beoperated in a very consistent fashion in order to get consistent results. By carrying out all of these steps,excellent repeatability was obtained with the GC. As shown in Figs. 8 - 12, the resulting area-concentrationrelationship are very linear and repeatable over calibrations taken weeks apart.
The molecular sieve (column A) was used to quantify oxygen (0 - 20 kPa) and nitrogen (0 - 95 kPa).The retention times are about 54 s for oxygen and 87 s for nitrogen. Figures 8 and 9 show the calibrationbetween the area counts and the gas partial pressure.
The poraplot Q (column B) was used to quantify hydrogen (0 - 24 kPa), methane (0 - 24 kPa) andnitrous oxide (0 - 15 kPa). The retention times are about 22.5 s for hydrogen, 25.5 s for methane and 34 sfor nitrous oxide. Figures 10 to 12 show the calibration between the area counts and the gas partial pressurefor these three components.
9

0 1 2 3 4 5 6 7 8 9 10 11 12area counts [107]
0
5
10
15
20
25O
2 pa
rtia
l pre
ssur
e [k
Pa]
calibration 2 / 5 / 97calibration 2 / 13 / 97
total pressure: 100 kPa
Figure 8: Gas chromatograph calibration for oxygen.
0 1 2 3 4 5area counts [108]
0
10
20
30
40
50
60
70
80
90
100
N2
part
ial p
ress
ure
[kPa
]
calibration 2 / 5 / 97calibration 2 / 13 / 97calibration 2 / 19 / 97
total pressure: 100 kPa
Figure 9: Gas chromatograph calibration for nitrogen.
10

0 1 2 3 4 5 6 7 8 9 10area counts [107]
0
5
10
15
20
25H
2 pa
rtia
l pre
ssur
e [k
Pa]
total pressure: 100 kPa
Figure 10: Gas chromatograph calibration for hydrogen.
0 0.2 0.4 0.6 0.8 1 1.2 1.4 1.6 1.8 2area counts [107]
0
5
10
15
20
25
CH
4 pa
rtia
l pre
ssur
e [k
Pa]
calibration 2 / 5 / 97calibration 2 / 13 / 97
total pressure: 100 kPa
Figure 11: Gas chromatograph calibration for methane.
11

0 1 2 3 4 5 6 7 8 9 10area counts [106]
0
5
10
15
20N
2O p
artia
l pre
ssur
e [k
Pa]
calibration 2 / 5 / 97calibration 2 / 13 / 97
total pressure: 100 kPa
Figure 12: Gas chromatograph calibration for nitrous oxide.
3.2 Fourier Transform Infrared Spectrometry
The MIDAC Corporation M2000 FTIR Spectrometer System was used to quantify the gas partial pressureof nitrous oxide and methane. The basic theory of operation of this spectrometer system is given by Beer’slaw. This law states that for parallel, monochromatic radiation that passes through an absorber of constantconcentration, the transmittance of a stable solution is an exponential function of the concentration of theabsorbing solute:
log
(1
T
)= A = α · b · C (2)
where
T = transmittanceA = absorbanceα = absorptivity or extinction coefficientb = optical path lengthC = molar concentration of the absorbing species
The FTIR measures the transmittance T as a function of wavelength λ or wavenumber 1/λ. A constantextinction coefficient α(λ) gives a linear relationship between concentration and absorbance for each absorb-ing species at a selected wavelength. However, the extinction coefficient is actually a function of the gasconcentration so that a nonlinear relationship exists between concentration and absorbance. This relation-ship was determined by calibration tests in which the FTIR cell was filled by the method of partial pressureswith known amounts of the test gases. The absorbance spectrum A(λ) was then analyzed to determine theappropriate range of wavelengths for carrying out the calibration between absorbance and gas concentration(partial pressure). It is important to choose a spectral range that is not obscured by water vapor (alwayspresent in the spectrum) or other IR-active gases in the system. A spectral range with a low extinctioncoefficient is also desirable in order to obtain a large dynamic range. Many of the N2O bands are so intensethat the absorbance saturates at high concentration.
12

Figure 13 shows the pre-burn raw transmission spectrum of run 246 (left) and the raw transmissionspectrum of air at 100 kPa (right) which was used as the background spectrum. The spectral features in thebackground are due to the wavelength dependence of the source radiosity and the absorbance of water vaporubiquitously present as a contaminant in the light path. Figure 14 shows the pre- and post-burn reducedabsorbance spectra of run 246. These absorbances are obtained from the logarithm of the ratio of the rawtransmission signals for the sample to that of the background. The pre- and post-burn partial pressures ofnitrous oxide were 10.0 (GC: 9.8 kPa, FTIR: 10.2 kPa) and 6.0 kPa (GC: 5.7 kPa, FTIR: 6.3 kPa). Sincethe GC and FTIR gave slightly different results for composition, we report compositions in the subsequentdiscussion and tables based on the average of the FTIR and GC values for CH4 and N2O.
500 1000 1500 2000 2500 3000 3500 4000wavenumber [cm-1]
0
10-5
2.10-5
3.10-5
4.10-5
5.10-5
6.10-5
7.10-5
tran
smis
sion
total pressure: 100 kPa- 10.2 kPa nitrous oxide- 8.6 kPa hydrogen- balance air
500 1000 1500 2000 2500 3000 3500 4000wavenumber [cm-1]
0
10-5
2.10-5
3.10-5
4.10-5
5.10-5
6.10-5
7.10-5
tran
smis
sion
total pressure:100 kPa air
Figure 13: Left: pre-burn raw transmission spectrum run 246; right: background raw transmission spectrum,100 kPa air.
3400 3425 3450 3475 3500 3525wavenumber [cm-1]
0
0.1
0.2
0.3
0.4
0.5
0.6
0.7
0.8
0.9
1
abso
rban
ce
total pressure: 100 kPa- 10.2 kPa nitrous oxide- 8.6 kPa hydrogen- balance air
N2O line
3462.9 cm-1
pre-burn
3400 3425 3450 3475 3500 3525wavenumber [cm-1]
0
0.1
0.2
0.3
0.4
0.5
0.6
0.7
0.8
0.9
1
abso
rban
ce
total pressure: 100 kPa- 6.3 kPa nitrous oxide- 0.3 kPa hydrogen
N2O line
3462.9 cm-1
post-burn- balance products/13.7 kPa N2
Figure 14: Absorbance corrected for background; left: pre-burn run 246, 10.2 kPa N2O; right: post-burn run246, 6.3 kPa N2O.
For nitrous oxide, a very reliable calibration between gas partial pressure and absorbance could be foundfrom 0 to 15 kPa at the wavenumber 3462.9 cm−1 (see Fig. 15), whereas for methane at the wavenumber3017.7 cm−1 no satisfactory calibration could be obtained (see Fig. 16). The reason for this is the choiceof the wavenumber (pointed out by H. Frey of CST), the absorbance does not vary much with the methaneconcentration and the signal-to-noise ratio is too low because the absorbance is too large (> 0.3). A shiftof the wavenumber to other values and even an integration of the wavenumber from 3133.5 to 3167.2 cm−1
did lead to better but still not very accurate results. Similar problems occurred for ammonia calibrationsbased on integration from 1663.5 to 1685.9 cm−1. Generally, all FTIR calibrations were very inaccurate forammonia (irrespective of the wavenumber range) whereas the GC calibrations for oxgen, nitrogen, hydrogen,methane and nitrous oxide were not affected.
13

0 0.1 0.2 0.3 0.4 0.5 0.6 0.7 0.8 0.9 1absorbance
0
5
10
15
20N
2O p
artia
l pre
ssur
e [k
Pa]
calibration 2 / 5 / 97calibration 2 / 13 / 97
total pressure: 100 kPawavenumber 3462.9 cm-1
Figure 15: FTIR calibration for nitrous oxide.
0 0.2 0.4 0.6 0.8 1 1.2 1.4 1.6 1.8absorbance
0
5
10
15
20
25
CH
4 pa
rtia
l pre
ssur
e [k
Pa]
calibration: upper limitcalibration: lower limit
total pressure: 100 kPawavenumber 3017.7 cm-1
Figure 16: FTIR calibration for methane.
14

4 Nitrous Oxide Consumption
By analyzing the pre- and post-burn gas composition, (see Section 3) the nitrous oxide consumption duringcombustion of fuel–nitrous oxide(–air) mixtures was measured. The mixtures investigated were hydrogen–nitrous oxide–air, methane–nitrous oxide–air, ammonia–nitrous oxide and mixtures A–D with air. For alltests, the pre-burn total pressure was 100 kPa and for the hydrogen–nitrous oxide–air and methane–nitrousoxide–air tests the gas partial pressure of nitrous oxide was nominally 10 kPa.
4.1 Hydrogen–Nitrous Oxide–Air Mixtures
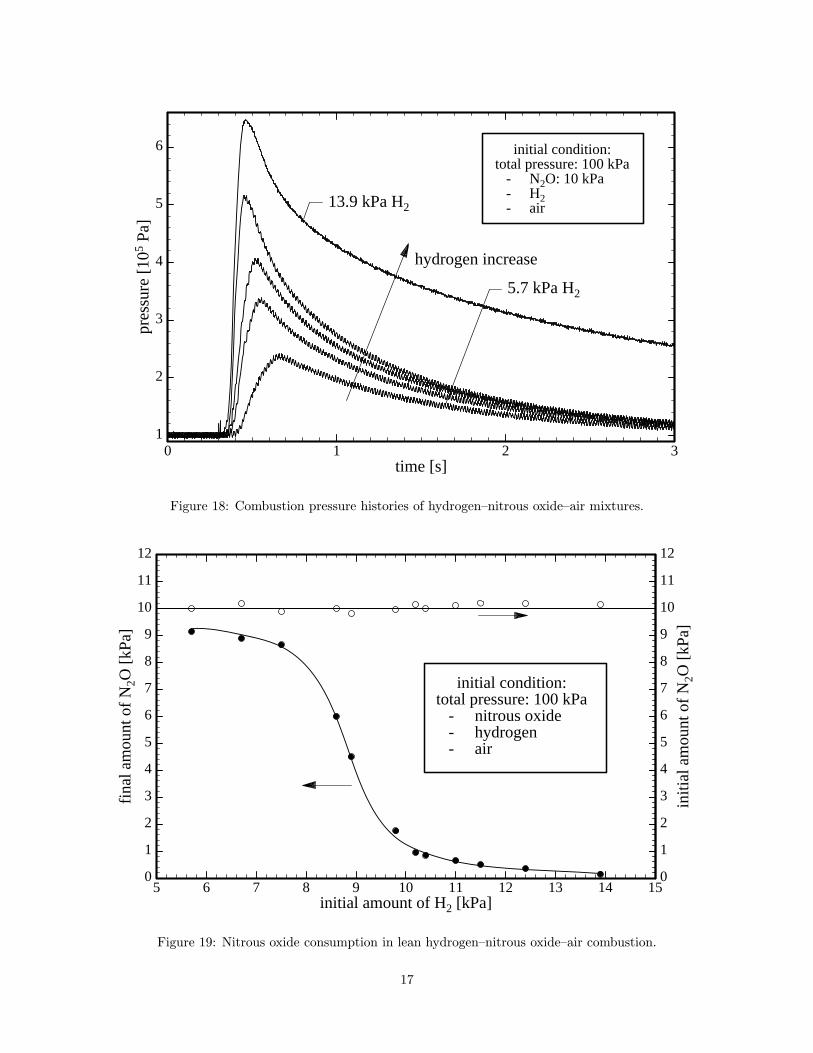
For these investigations, the initial gas partial pressure of hydrogen was varied from 5.7 to 13.9 kPa, whereasthe initial partial pressure of nitrous oxide was nominally 10 kPa. Figure 18 shows five typical pressurehistories for these tests. The peak pressure increases with increasing H2 concentration: 2.4 bar (5.7 kPa H2),3.3 bar (7.5 kPa H2), 4.0 bar (8.6 kPa H2), 5.1 bar (10.2 kPa H2), 6.5 bar (13.9 kPa H2).
These results are very similar to what was obtained in the earlier study (Fig. 17) in the larger vessel,CONVOL (400 l capacity) (Ross and Shepherd 1996) and the Bureau of Mines 120-l vessel (Cashdollar et al.1992). There are some differences since the N2O concentration is held fixed in the present experimentsand was variable (proportional to the H2 concentration) in the Bureau of Mines experiments. However, thevalues for turbulent conditions appear to define a clear upper bound to the peak pressure that is a continuousfunction of H2 concentration down to 4%. The quiescent values show the characteristic sharp cutoff at 8%hydrogen corresponding to the downward propagation limit.
2 3 4 5 6 7 8 9 10 11 12 13 14 15 16 17 18 19 20 21initial amount of H2 [kPa]
1
2
3
4
5
6
7
8
9
10
pres
sure
rat
io: p
max
/p0
% N2O = 10 kPa, turbulent conditions, ignition energy: 8 J
% N2O = % H2, quiescent, spark% N2O = % H2, turbulent, spark% N2O = % H2, quiescent, 5000 J ignitor% N2O = % H2, quiescent, spark, T0 = 54 oC% N2O = % H2, turbulent, spark, T0 = 54 oC% N2O = 0.66 x % H2, quiescent, spark
Ross and Shepherd (1996)
Bureau of MinesCashdollar et al. (1992):
initial pressure: 100 ± 5 kPa% air = 100 - (% H2 + % N2O)
8 - 32 % N2O, fan off8 - 32 % N2O, fan on
6 - 18 % N2O, fan off
Figure 17: Peak combustion pressure in lean hydrogen–nitrous oxide–air mixture combustion.
The values of initial and final gas partial pressures of H2 and N2O, of target and actual final pressuresand of peak pressures of the H2–N2O–air runs are shown in Table 8. The H2 final pressure varies between0.2 and 0.6 kPa for initial H2 above 6.7 kPa, for run 250 with an initial value of 5.7 kPa H2 the final amountincreases to 1.4 kPa. This indicates complete combustion for all concentrations except at the leanest, 5.7%
15
target + actualRun initial initial final final final 2.5 kPa final peakNo. H2 N2O N2O H2 pressure H2O (g) pressure pressure
[kPa] [kPa] [kPa] [kPa] [kPa] [kPa] [kPa] bar
250 5.7 10.0 9.15 1.4 92.0 94.5 94.4 2.42248 6.7 10.2 8.9 0.3 90.5 93.0 91.9 3.04243 7.5 9.9 8.65 0.6 89.2 91.7 91.0 3.39246 8.6 10.0 6.0 0.3 89.0 91.5 90.3 -251 8.9 9.8 4.5 0.3 89.2 91.7 90.2 4.07244 9.8 9.95 1.75 0.6 89.4 91.9 90.0 4.82253 10.2 10.15 0.95 0.2 89.2 91.7 89.5 5.10247 10.4 10.0 0.85 0.3 88.8 91.3 89.4 5.18252 11.0 10.1 0.65 0.2 88.2 90.7 88.6 5.12254 11.5 10.2 0.5 0.3 87.5 90.0 87.5 5.22249 12.4 10.3 0.35 0.3 86.0 88.5 86.6 5.60242 13.9 10.15 0.15 0.2 83.9 86.4 84.7 6.48
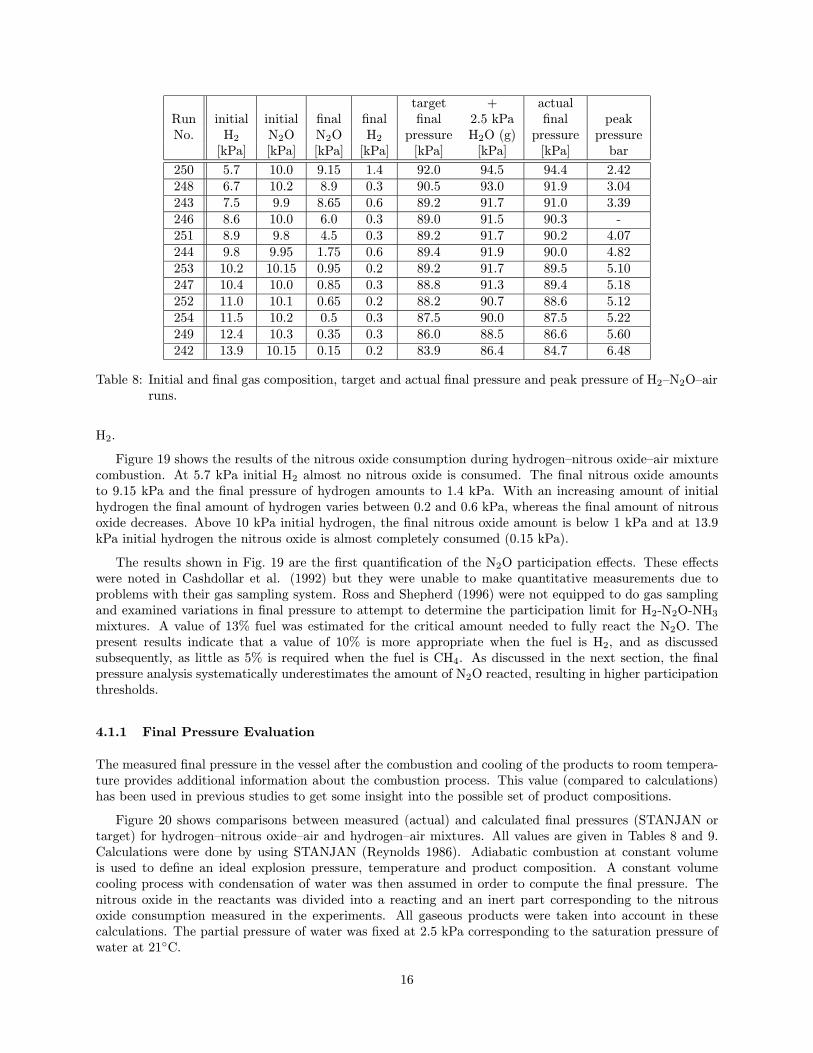
Table 8: Initial and final gas composition, target and actual final pressure and peak pressure of H2–N2O–airruns.
H2.
Figure 19 shows the results of the nitrous oxide consumption during hydrogen–nitrous oxide–air mixturecombustion. At 5.7 kPa initial H2 almost no nitrous oxide is consumed. The final nitrous oxide amountsto 9.15 kPa and the final pressure of hydrogen amounts to 1.4 kPa. With an increasing amount of initialhydrogen the final amount of hydrogen varies between 0.2 and 0.6 kPa, whereas the final amount of nitrousoxide decreases. Above 10 kPa initial hydrogen, the final nitrous oxide amount is below 1 kPa and at 13.9kPa initial hydrogen the nitrous oxide is almost completely consumed (0.15 kPa).
The results shown in Fig. 19 are the first quantification of the N2O participation effects. These effectswere noted in Cashdollar et al. (1992) but they were unable to make quantitative measurements due toproblems with their gas sampling system. Ross and Shepherd (1996) were not equipped to do gas samplingand examined variations in final pressure to attempt to determine the participation limit for H2-N2O-NH3
mixtures. A value of 13% fuel was estimated for the critical amount needed to fully react the N2O. Thepresent results indicate that a value of 10% is more appropriate when the fuel is H2, and as discussedsubsequently, as little as 5% is required when the fuel is CH4. As discussed in the next section, the finalpressure analysis systematically underestimates the amount of N2O reacted, resulting in higher participationthresholds.
4.1.1 Final Pressure Evaluation
The measured final pressure in the vessel after the combustion and cooling of the products to room tempera-ture provides additional information about the combustion process. This value (compared to calculations)has been used in previous studies to get some insight into the possible set of product compositions.
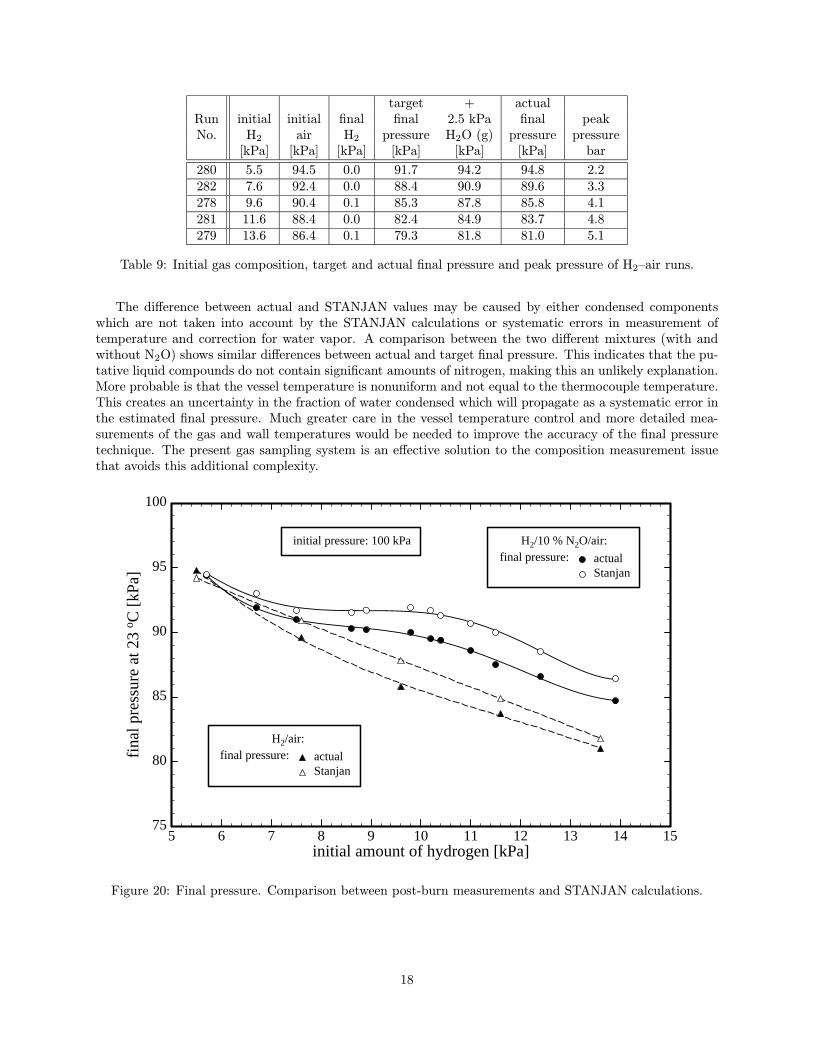
Figure 20 shows comparisons between measured (actual) and calculated final pressures (STANJAN ortarget) for hydrogen–nitrous oxide–air and hydrogen–air mixtures. All values are given in Tables 8 and 9.Calculations were done by using STANJAN (Reynolds 1986). Adiabatic combustion at constant volumeis used to define an ideal explosion pressure, temperature and product composition. A constant volumecooling process with condensation of water was then assumed in order to compute the final pressure. Thenitrous oxide in the reactants was divided into a reacting and an inert part corresponding to the nitrousoxide consumption measured in the experiments. All gaseous products were taken into account in thesecalculations. The partial pressure of water was fixed at 2.5 kPa corresponding to the saturation pressure ofwater at 21◦C.
16
0 1 2 3time [s]
1
2
3
4
5
6pr
essu
re [
105
Pa]
initial condition:total pressure: 100 kPa - N2O: 10 kPa - H2 - air13.9 kPa H2
5.7 kPa H2
hydrogen increase
Figure 18: Combustion pressure histories of hydrogen–nitrous oxide–air mixtures.
5 6 7 8 9 10 11 12 13 14 15initial amount of H2 [kPa]
0
1
2
3
4
5
6
7
8
9
10
11
12
fina
l am
ount
of
N2O
[kP
a]
0
1
2
3
4
5
6
7
8
9
10
11
12
initi
al a
mou
nt o
f N
2O [
kPa]
initial condition:total pressure: 100 kPa - nitrous oxide - hydrogen - air
Figure 19: Nitrous oxide consumption in lean hydrogen–nitrous oxide–air combustion.
17
target + actualRun initial initial final final 2.5 kPa final peakNo. H2 air H2 pressure H2O (g) pressure pressure
[kPa] [kPa] [kPa] [kPa] [kPa] [kPa] bar
280 5.5 94.5 0.0 91.7 94.2 94.8 2.2282 7.6 92.4 0.0 88.4 90.9 89.6 3.3278 9.6 90.4 0.1 85.3 87.8 85.8 4.1281 11.6 88.4 0.0 82.4 84.9 83.7 4.8279 13.6 86.4 0.1 79.3 81.8 81.0 5.1
Table 9: Initial gas composition, target and actual final pressure and peak pressure of H2–air runs.
The difference between actual and STANJAN values may be caused by either condensed componentswhich are not taken into account by the STANJAN calculations or systematic errors in measurement oftemperature and correction for water vapor. A comparison between the two different mixtures (with andwithout N2O) shows similar differences between actual and target final pressure. This indicates that the pu-tative liquid compounds do not contain significant amounts of nitrogen, making this an unlikely explanation.More probable is that the vessel temperature is nonuniform and not equal to the thermocouple temperature.This creates an uncertainty in the fraction of water condensed which will propagate as a systematic error inthe estimated final pressure. Much greater care in the vessel temperature control and more detailed mea-surements of the gas and wall temperatures would be needed to improve the accuracy of the final pressuretechnique. The present gas sampling system is an effective solution to the composition measurement issuethat avoids this additional complexity.
5 6 7 8 9 10 11 12 13 14 15initial amount of hydrogen [kPa]
75
80
85
90
95
100
fina
l pre
ssur
e at
23
o C [
kPa]
actualStanjan
actualStanjan
H2/10 % N2O/air:final pressure:
H2/air:final pressure:
initial pressure: 100 kPa
Figure 20: Final pressure. Comparison between post-burn measurements and STANJAN calculations.
18
Run initial initial final final final peakNo. CH4 N2O N2O CH4 pressure pressure
[kPa] [kPa] [kPa] [kPa] [kPa] bar
259 4.5 10.1 10.0 4.5 - -260 4.8 10.1 0.35 0.0 95.4 5.97258 4.9 10.0 0.35 0.0 95.3 6.16257 5.9 10.05 0.25 0.0 93.2 4.90256 7.9 10.05 0.25 0.0 90.6 8.09255 10.0 10.05 0.3 0.4 87.7 9.20
Table 10: Initial and final gas composition, actual final and peak pressure of CH4–N2O–air runs.
0 1 2 3time [s]
1
2
3
4
5
6
7
8
9
10
pres
sure
[10
5 Pa
]
4.8 kPa CH4
4.9 kPa CH4
5.9 kPa CH4
7.9 kPa CH4
10.0 kPa CH4 initial condition:total pressure: 100 kPa - N2O: 10 kPa - CH4 - air
4.5 kPa CH4: not flammable
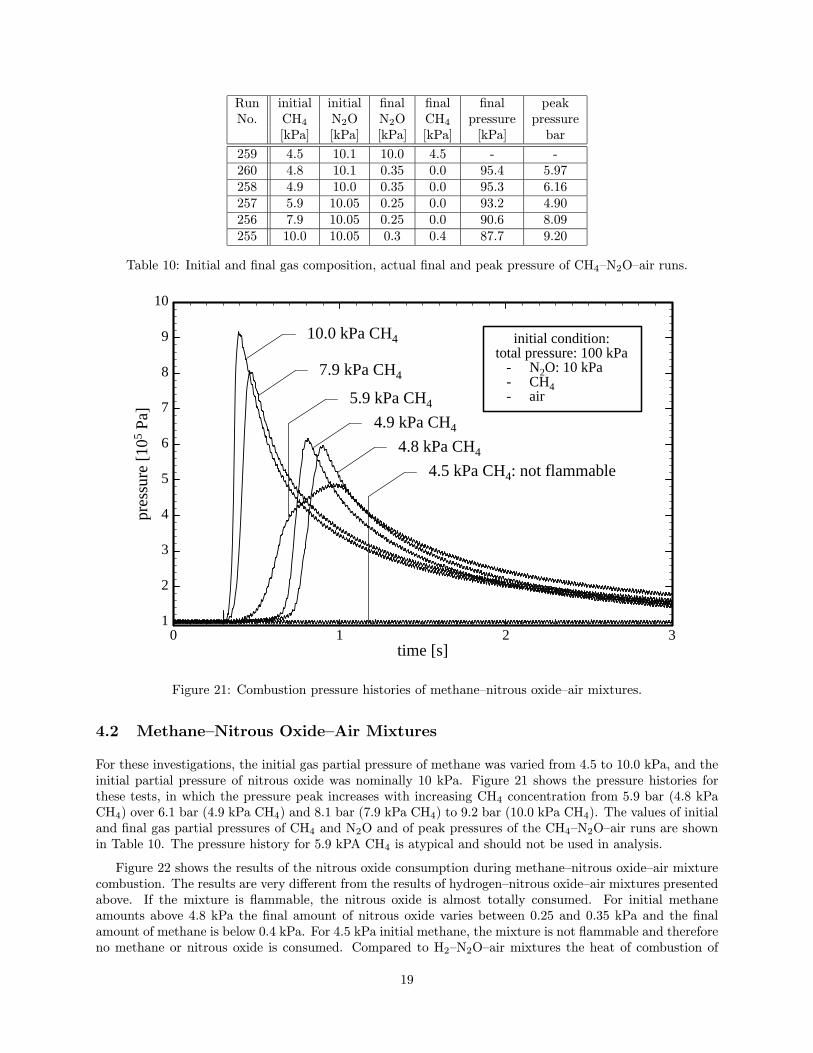
Figure 21: Combustion pressure histories of methane–nitrous oxide–air mixtures.
4.2 Methane–Nitrous Oxide–Air Mixtures
For these investigations, the initial gas partial pressure of methane was varied from 4.5 to 10.0 kPa, and theinitial partial pressure of nitrous oxide was nominally 10 kPa. Figure 21 shows the pressure histories forthese tests, in which the pressure peak increases with increasing CH4 concentration from 5.9 bar (4.8 kPaCH4) over 6.1 bar (4.9 kPa CH4) and 8.1 bar (7.9 kPa CH4) to 9.2 bar (10.0 kPa CH4). The values of initialand final gas partial pressures of CH4 and N2O and of peak pressures of the CH4–N2O–air runs are shownin Table 10. The pressure history for 5.9 kPA CH4 is atypical and should not be used in analysis.
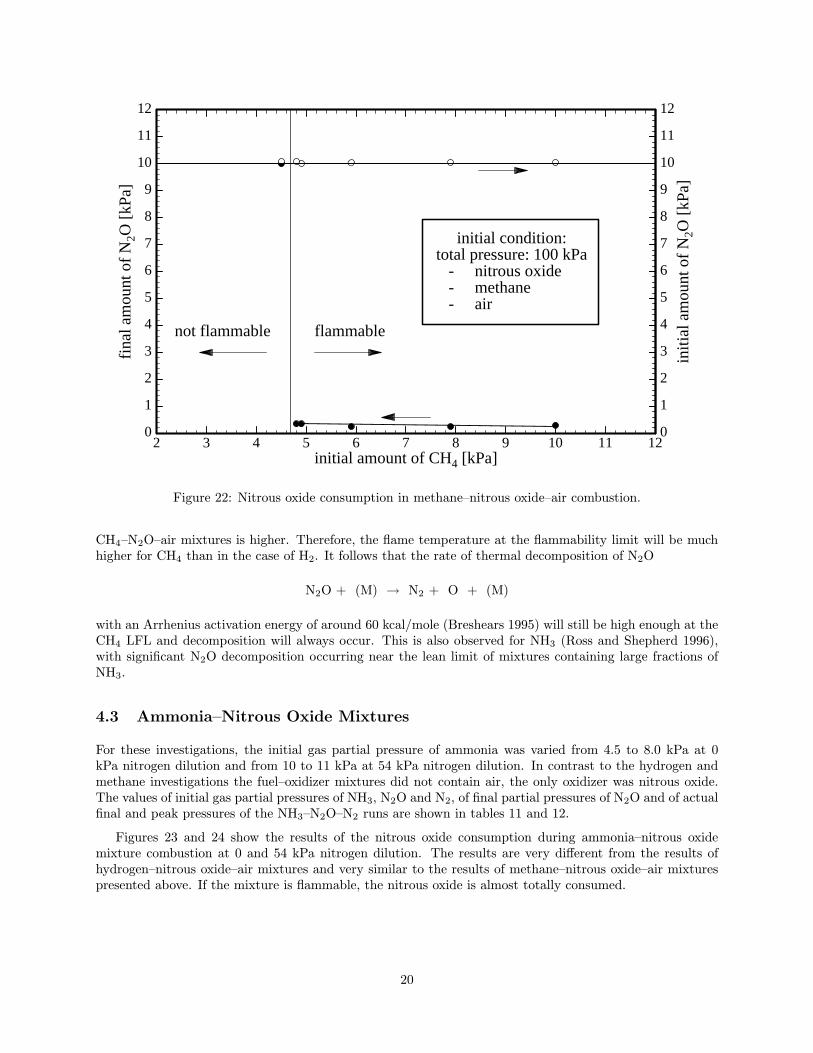
Figure 22 shows the results of the nitrous oxide consumption during methane–nitrous oxide–air mixturecombustion. The results are very different from the results of hydrogen–nitrous oxide–air mixtures presentedabove. If the mixture is flammable, the nitrous oxide is almost totally consumed. For initial methaneamounts above 4.8 kPa the final amount of nitrous oxide varies between 0.25 and 0.35 kPa and the finalamount of methane is below 0.4 kPa. For 4.5 kPa initial methane, the mixture is not flammable and thereforeno methane or nitrous oxide is consumed. Compared to H2–N2O–air mixtures the heat of combustion of
19
2 3 4 5 6 7 8 9 10 11 12initial amount of CH4 [kPa]
0
1
2
3
4
5
6
7
8
9
10
11
12fi
nal a
mou
nt o
f N
2O [
kPa]
0
1
2
3
4
5
6
7
8
9
10
11
12
initi
al a
mou
nt o
f N
2O [
kPa]
initial condition:total pressure: 100 kPa - nitrous oxide - methane - air
not flammable flammable
Figure 22: Nitrous oxide consumption in methane–nitrous oxide–air combustion.
CH4–N2O–air mixtures is higher. Therefore, the flame temperature at the flammability limit will be muchhigher for CH4 than in the case of H2. It follows that the rate of thermal decomposition of N2O
N2O + (M) → N2 + O + (M)
with an Arrhenius activation energy of around 60 kcal/mole (Breshears 1995) will still be high enough at theCH4 LFL and decomposition will always occur. This is also observed for NH3 (Ross and Shepherd 1996),with significant N2O decomposition occurring near the lean limit of mixtures containing large fractions ofNH3.
4.3 Ammonia–Nitrous Oxide Mixtures
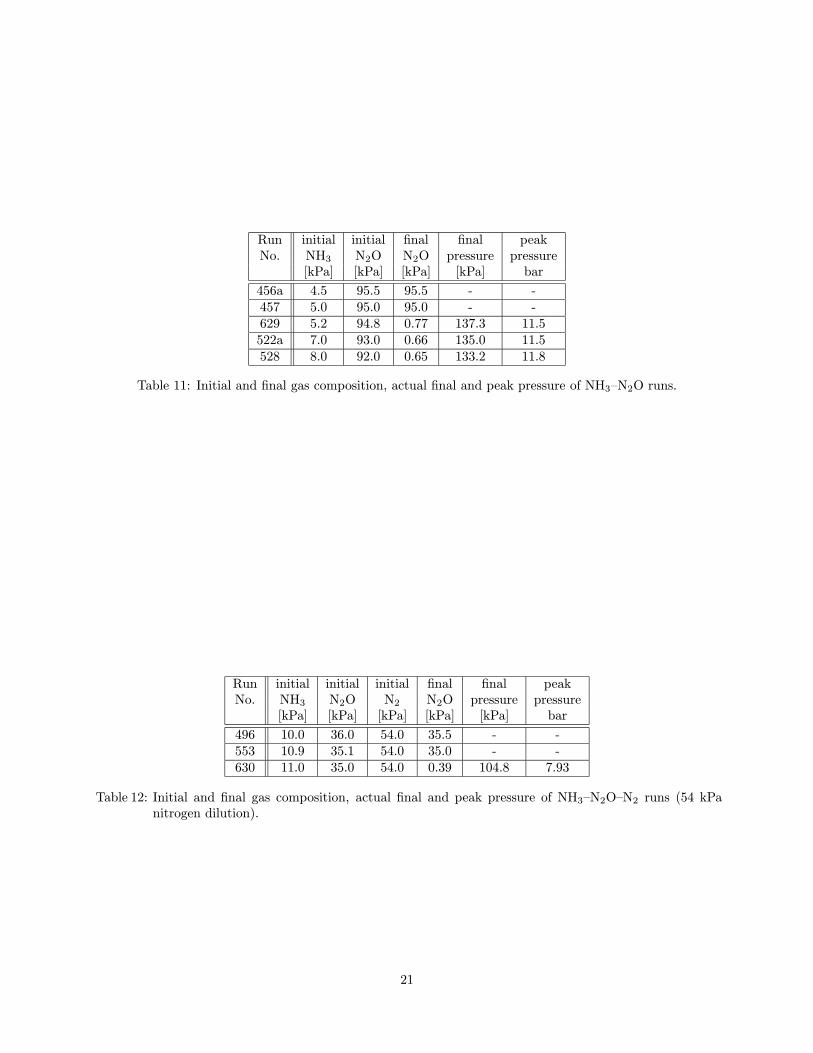
For these investigations, the initial gas partial pressure of ammonia was varied from 4.5 to 8.0 kPa at 0kPa nitrogen dilution and from 10 to 11 kPa at 54 kPa nitrogen dilution. In contrast to the hydrogen andmethane investigations the fuel–oxidizer mixtures did not contain air, the only oxidizer was nitrous oxide.The values of initial gas partial pressures of NH3, N2O and N2, of final partial pressures of N2O and of actualfinal and peak pressures of the NH3–N2O–N2 runs are shown in tables 11 and 12.
Figures 23 and 24 show the results of the nitrous oxide consumption during ammonia–nitrous oxidemixture combustion at 0 and 54 kPa nitrogen dilution. The results are very different from the results ofhydrogen–nitrous oxide–air mixtures and very similar to the results of methane–nitrous oxide–air mixturespresented above. If the mixture is flammable, the nitrous oxide is almost totally consumed.
20
Run initial initial final final peakNo. NH3 N2O N2O pressure pressure
[kPa] [kPa] [kPa] [kPa] bar
456a 4.5 95.5 95.5 - -457 5.0 95.0 95.0 - -629 5.2 94.8 0.77 137.3 11.5522a 7.0 93.0 0.66 135.0 11.5528 8.0 92.0 0.65 133.2 11.8
Table 11: Initial and final gas composition, actual final and peak pressure of NH3–N2O runs.
Run initial initial initial final final peakNo. NH3 N2O N2 N2O pressure pressure
[kPa] [kPa] [kPa] [kPa] [kPa] bar
496 10.0 36.0 54.0 35.5 - -553 10.9 35.1 54.0 35.0 - -630 11.0 35.0 54.0 0.39 104.8 7.93
Table 12: Initial and final gas composition, actual final and peak pressure of NH3–N2O–N2 runs (54 kPanitrogen dilution).
21

3 4 5 6 7 8 9 10initial amount of NH3 [kPa]
0
0.1
0.2
0.3
0.4
0.5
0.6
0.7
0.8
0.9
1ni
trou
s ox
ide:
fr
actio
n re
acte
d
total pressure: 100 kPa
turbulent conditionsN2O = 100 - NH3 [kPa]
ignition energy: 8.0 J
not flammable flammable
Figure 23: Nitrous oxide consumption in ammonia–nitrous oxide combustion.
9 10 11 12 13 14 15initial amount of NH3 [kPa]
0
0.1
0.2
0.3
0.4
0.5
0.6
0.7
0.8
0.9
1
nitr
ous
oxid
e:
frac
tion
reac
ted
total pressure: 100 kPa
turbulent conditionsN2O = 46 - NH3 [kPa]
ignition energy: 8.0 J
not flammable flammable
54 kPa N2 dilution
Figure 24: Nitrous oxide consumption in ammonia–nitrous oxide–nitrogen combustion.
22

4.4 Mixtures A/B/C/D with Air
The nitrous oxide consumption during combustion of mixture A (42% H2, 36% N2O, 21% NH3, 1% CH4),mixture B (35% H2, 35% N2O, 30% NH3), mixture C (25% H2, 25% N2O, 50% NH3) and mixture D (16.7%H2, 33.3% N2O, 50% NH3) with air was measured around the lean flammability limits of these mixtures toverify the N2O participation limits given in Ross and Shepherd (1996). The results are shown in Fig. 25.The Ross and Shepherd (1996) N2O participation limits (mixture A: 13%, mixture B: 15%, mixture c: 13%,mixture d: 15%) were confirmed by the present investigations for the mixtures A, C, and D, but not formixture B. For this mixture, the N2O participation limit is around 13 instead of 15%.
The values of initial gas partial pressures of mixtures A–D and air, of initial and final N2O and of actualfinal and peak pressures of the mixtures A–D with air runs are shown in Tables 13, 14, 15 and 16.
7 8 9 10 11 12 13 14 15 16 17 18initial amount of mixture A - D [kPa]
0
0.1
0.2
0.3
0.4
0.5
0.6
0.7
0.8
0.9
1
nitr
ous
oxid
e:
frac
tion
reac
ted
mixture Amixture Bmixture Cmixture D
total pressure: 100 kPa
turbulent conditionsair = 100 - mixture A - D [kPa]
ignition energy: 0.04 J
ignition energy: 8.0 J
Figure 25: Nitrous oxide consumption in combustion of mixtures A-D with air.
23

Run initial initial initial final final peakNo. mixture a air N2O N2O pressure pressure
[kPa] [kPa] [kPa] [kPa] [kPa] bar
632 8.0 92.0 2.88 2.88 - -631 9.5 90.5 3.42 2.73 96.9 1.90621 12.0 88.0 4.32 2.75 91.7 3.14622 14.0 86.0 5.04 1.13 89.5 4.22
Table 13: Initial and final gas composition, actual final and peak pressure of mixture A–air runs.
Run initial initial initial final final peakNo. mixture b air N2O N2O pressure pressure
[kPa] [kPa] [kPa] [kPa] [kPa] bar
624 13.0 87.0 4.55 2.82 86.9 3.48623 14.0 86.0 4.90 1.80 93.6 3.96
Table 14: Initial and final gas composition, actual final and peak pressure of mixture B–air runs.
Run initial initial initial final final peakNo. mixture c air N2O N2O pressure pressure
[kPa] [kPa] [kPa] [kPa] [kPa] bar
625 13.0 87.0 3.25 2.10 91.1 3.51626 14.0 86.0 3.50 0.35 87.5 4.53
Table 15: Initial and final gas composition, actual final and peak pressure of mixture C–air runs.
Run initial initial initial final final peakNo. mixture d air N2O N2O pressure pressure
[kPa] [kPa] [kPa] [kPa] [kPa] bar
627 15.0 85.0 5.00 3.61 94.0 3.06628 17.0 83.0 5.67 0.29 93.6 -
Table 16: Initial and final gas composition, actual final and peak pressure of mixture D–air runs.
24
5 Hydrogen–Nitrous Oxide–Nitrogen Mixtures
Numerous flammability studies have been conducted with hydrogen. Some of these studies, Smith andLinnett (1953), Posthumus (1930), van der Wal (1934), and Scott et al. (1957) have been carried out withN2O as the oxidizer. The available data are shown in Fig. 26 together with the flammability limits ofhydrogen–oxygen (Coward and Jones 1952) and hydrogen–air–nitrogen mixtures (Zabetakis 1965; Shebekoet al. 1995). These data are all nominally obtained at at 25◦C and 1 atm pressure. Not shown on thisdiagram are the H2-N2O-air mixture data of Cashdollar et al. (1992) and Ross and Shepherd (1996).Note that the rich limit data of Posthumus are substantially below those of Smith and Linnett. This isapparently due to the low temperature/energy ignition source of Posthumous in comparison to the 20 Jspark discharge used by Smith and Linnett. In general, ignition energy has a strong effect on flammablilitylimits in mixtures containing large amounts of N2O. The particular problem of ignition of very lean H2-N2Omixtures is discussed subsequently in Section 6.3.
0 10 20 30 40 50 60 70 80 90 100nitrogen N2 [kPa]
0
10
20
30
40
50
60
70
80
90
100
hydr
ogen
H2
[kPa
]
air Jones and PerrottO2 Shebeko et al.N2O PosthumusN2O Smith and Linnett
N2O Scott et al.N2O van der WalO2 Coward and Jones
flammability limits
Figure 26: Flammability limits of hydrogen–air–nitrogen, hydrogen–nitrous oxide and hydrogen–oxygen–nitrogen mixtures.
25
6 Methane–Nitrous Oxide–Nitrogen Mixtures
Measurements with methane–nitrous oxide–nitrogen mixtures were carried out to determine the flammabilitylimits and ignition energy bounds. Additional tests with methane–nitrous oxide–oxygen–nitrogen mixtureswere done to investigate the influence of small amounts of oxygen on the flammability limit.
6.1 Flammability Limit
Flammability limits were determined for CH4–N2O–N2 mixtures at a total initial pressure of 100 kPa.The ignition source was the capacitor discharge unit described in Ross and Shepherd (1996), which has amaximum electrical energy of 8 J.
0 10 20 30 40 50 60 70 80 90 100nitrogen N2 [kPa]
0
10
20
30
40
50
60
70
met
hane
CH
4 [k
Pa]
%N2O = 100% - %CH4 - %N2 %O2 = 100% - %CH4 - %N2%N2O = 97% - %CH4 - %N2 / 3%O2%N2O = 95% - %CH4 - %N2 / 5%O2
filled symbols: flammableopen symbols: NOT flammable
flammability limit%N2O = 100% - %CH4 - %N2
ignition energy ≈ 8 Jtotal pressure: 100 kPa
flammability limit%O2 = 100% - %CH4 - %N2
(M.G. Zabetakis 1965)
Figure 27: Flammability limits of methane–nitrous oxide–nitrogen, methane–oxygen–nitrogen and methane–nitrous oxide–oxygen–nitrogen mixtures.
The present results are shown in Fig. 27 and compared to previous results from the literature (Zabetakis1965) for CH4–O2–N2 mixtures. Previous results for CH4–N2O or CH4–N2O–N2 mixtures were not availablefrom the literature. The lower flammability limit shows a very smooth dependence (increase) on the amountof nitrogen dilution and a good correspondence to Zabetakis’ results for CH4–O2–N2, whereas the upper limitshifts to a smaller flammability region compared to CH4–O2–N2 and shows a strong decrease with increasingnitrogen dilution. Without dilution, methane–nitrous oxide mixtures are flammable for methane partialpressures between 2.7 and 43-50 kPa. Mixtures with nitrogen dilution above 70.5 kPa are not flammable(inert). The corresponding methane partial pressure is 6.3 kPa. The values of initial gas composition, finaland peak pressure of the present CH4–N2O–N2, CH4–O2–N2 and CH4–N2O–N2–O2 runs are shown in Tables17 and 18.
26

Run initial initial initial initial final peakNo. CH4 N2O N2 O2 pressure pressure
[kPa] [kPa] [kPa] [kPa] [kPa] bar
261 12.0 88.0 0.0 - 102.0 16.0262 3.0 17.0 80.0 - - -263 4.0 16.0 80.0 - - -264 6.0 24.0 70.0 - - -265 8.0 32.0 60.0 - 101.8 10.1266 7.0 28.0 65.0 - 101.6 9.1276 6.6 26.4 67.0 - 102.1 8.7277 6.2 24.8 69.0 - - -288 5.0 95.0 - - 136.8 13.5289 4.0 96.0 - - 136.8 12.8290 3.4 96.6 - - 140.1 12.6291 2.0 98.0 - - - -292 3.0 97.0 - - 142.0 12.2293 2.5 97.5 - - - -294 3.0 72.0 25.0 - - -295 3.5 71.5 25.0 - 126.5 10.4296 3.0 47.0 50.0 - - -297 3.5 46.5 50.0 - - -298 4.0 46.0 50.0 - - -299 4.5 45.5 50.0 - 112.2 8.9300 26.0 24.0 50.0 - - -302 24.0 26.0 50.0 - - -303 22.0 28.0 50.0 - - -304 20.0 30.0 50.0 - - -309 50.0 50.0 - - 173.2 13.4310 60.0 40.0 - - - -311 55.0 45.0 - - - -312 35.0 40.0 25.0 - - -313 45.0 55.0 - - - -314 10.0 65.0 25.0 - 113.5 13.4315 40.0 60.0 - - 165.9 14.6316 30.0 45.0 25.0 - - -317 45.0 55.0 - - - -318 25.0 50.0 25.0 - 130.8 13.4319 30.0 70.0 - - 112.2 17.1320 50.0 50.0 - - 167.6 14.1321 15.0 35.0 50.0 - 115.6 10.1322 20.0 30.0 50.0 - - -325 17.5 32.5 50.0 - - -327 17.5 57.5 25.0 - 108.2 14.4328 27.5 47.5 25.0 - 139.7 12.1335 47.5 52.5 - - - -336 46.0 54.0 - - - -337 43.0 57.0 - - 170.4 12.1
Table 17: Initial gas composition, actual final and peak pressure of CH4–N2O–N2 runs.
27

Run initial initial initial initial final peakNo. CH4 N2O N2 O2 pressure pressure
[kPa] [kPa] [kPa] [kPa] [kPa] bar
267 10.0 - 70.0 20.0 82.2 8.4268 8.0 - 76.0 16.0 85.9 7.5269 6.0 - 82.0 12.0 94.4 5.7270 4.0 - 88.0 8.0 - -
271 5.0 14.0 78.0 3.0 - -272 6.2 18.8 72.0 3.0 - -273 7.6 24.4 65.0 3.0 99.4 9.1274 7.0 22.0 68.0 3.0 99.4 8.4275 6.5 20.2 70.3 3.0 - -323 19.4 29.1 48.5 3.0 - -
324 19.0 28.5 47.5 5.0 - -326 16.6 30.9 47.5 5.0 111.3 10.7329 52.0 43.0 - 5.0 - -330 2.6 82.4 10.0 5.0 - -331 3.5 51.5 40.0 5.0 - -332 22.9 32.1 40.0 5.0 127.3 10.2333 24.5 30.5 40.0 5.0 - -334 43.5 41.5 10.0 5.0 - -
Table 18: Initial gas composition, actual final and peak pressure of CH4–O2–N2 and CH4–N2O–N2–O2 runs.
6.2 Influence of Small Amounts of Oxygen (3 - 5%) on the Flammability Limit
Figures 27 and 28 show no pronounced dependence of the flammability limits of methane–nitrous oxide–nitrogen mixtures on small amounts of oxygen. At 3 kPa oxygen addition, the maximum flammable nitrogendilution does not shift (see Fig. 28). Substituting oxygen for nitrous oxide shifts the maximum flammablenitrogen dilution (inerting concentration) from 70.5 to about 85 kPa (5 kPa CH4 and 10 kPa O2). Zabetakisobtained 80 kPa nitrogen dilution as the inerting concentration for CH4–O2–N2 mixtures at atmosphericpressure and 26◦C (Zabetakis 1965). The present results exceed this value due to turbulent conditions (themixing fan was on during the burn). Addition of 5 kPa oxygen at 0, 10, 40 and 47.5 kPa nitrogen dilutiondoes not appreciably alter the flammability limit (see Fig. 27).
6.3 Influence of Ignition Energy on the Flammability Limit
It is known that (Kuchta 1985) the minimum ignition energy is a strong function of composition near theflammability limit. The minimum value of ignition energy for hydrocarbon fuels in air occurs for for richmixtures and is typically on the order of 0.25 mJ. Near the limits, a steep rise in minimum ignition energy isobserved, with mixtures outside the flammability limit exhibiting inert behavior even for very large amountsof energy.
We determined bounds on the ignition energy by carrying out a series of tests with ignition energies of0.04, 0.2, 1.0, 2.0, 5.0 and 8.0 J. For each ignition energy, the minimum amount of methane for flammabilityof a methane–nitrous oxide mixture at 100 kPa (no nitrogen dilution) was determined.
The results of these runs are shown in Table 19 and plotted in Figs. 29 and 30. Figure 29 shows thepeak pressures compared to peak pressures resulting from STANJAN calculations. At the leanest flammableconcentration (2.8% CH4), the peak pressure is about 12 bar, close to the value obtained from N2O decom-position alone (11.8 bar). This behavior is similar to that observed for H2-N2O mixtures by Cashdollar et al.(1992), who found that with sufficient ignitor energy (5000 J), mixtures with as little as 1% H2 could beignited. Their limiting fuel concentration with a 58 J spark was about 6% H2 for downward propagation.
28

Run initial initial ignition final peakNo. CH4 N2O energy pressure pressure
[kPa] [kPa] [J] [kPa] bar
338 4.0 96.0 0.04 - -338a 4.0 96.0 0.2 140.0 12.7339 5.0 95.0 0.04 130.3 13.2340 4.5 95.5 0.04 - -340a 4.5 95.5 0.2 143.4 13.0341 4.75 95.25 0.04 136.4 13.0342 4.25 95.75 0.04 - -342a 4.25 95.75 0.2 136.6 12.8343 3.75 96.25 0.04 - -343a 3.75 96.25 0.2 142.3 12.6344 3.5 96.5 0.2 140.5 12.3345 3.25 96.75 0.2 142.0 12.1346 3.0 97.0 0.2 140.3 11.9347 2.9 97.1 0.2 140.0 11.9348 2.8 97.2 0.2 - -348a 2.8 97.2 1.0 142.5 11.8349 2.7 97.3 1.0 141.8 11.8350 2.6 97.4 1.0 - -350a 2.6 97.4 2.0 - -350b 2.6 97.4 5.0 - -350c 2.6 97.4 8.0 132.1 6.05293 2.5 97.5 8.0 - -
Table 19: Initial gas composition, ignition energy, actual final and peak pressure of CH4–N2O runs.
29
40 50 60 70 80 90 100nitrogen N2 [kPa]
0
2
4
6
8
10
12
14
16
18
20
met
hane
CH
4 [k
Pa]
%N2O = 100% - %CH4 - %N2 %O2 = 100% - %CH4 - %N2%N2O = 97% - %CH4 - %N2 / 3%O2%N2O = 95% - %CH4 - %N2 / 5%O2
N2O/3% O2: Φ = 1.0
N2O: Φ = 1.0
O2: Φ = 1.0
flammability limit by M.G. Zabetakis: %O2 = 100% - %CH4 - %N2
filled symbols: flammableopen symbols: NOT flammable
ignition energy ≈ 8 Jtotal pressure: 100 kPa
Figure 28: Influence of small amounts of oxygen on the flammability limit of methane–nitrous oxide–nitrogenmixtures.
Hertzberg and Zlochower (1993) propose that H-atoms catalyze N2O decomposition and compounds such asH2, CH4 and NH3 will, in small amounts (1-2%), accelerate the decomposition reaction sufficiently to stabi-lize the propagation of a decomposition flame. Substantial N2O decomposition and associated high pressureshave been observed for H2, CH4 and NH3, the last being discussed by Jones and Kerr (1949). Note thatpressures are really not “high” but simply close to the 12 bar value that results from N2O decomposition.These values seemed high to previous investigators who were used to modest pressures for near-limit combus-tion of hydrocarbon-air mixtures. It was common practice (and still is) to investigate flammability limits inhydrocarbon-air mixtures with a glass apparatus. The destruction of these experiments when investigatingN2O alarmed these invetigators but in hindsight it is a natural consequence of working with large amountsof N2O.
Figure 30 shows the minimum ignition energy as a function of methane concentration near the flamma-bility limit. These results show that for ignition energies above about 1.0 J, the flammability limit isindependent of the ignition energy. Increasing the ignition energy from 40 mJ to 8 J reduces the ignitionlimit from 2.8 to 4.8% CH4. Similar reductions in the LFL of H2 have been obtained in H2-N2O-air mixturesby Cashdollar et al. (1992). However, experiments (Cashdollar et al. 1992) using pyrotechnic ignitors andH2-N2O mixtures have shown that if the ignitor energy content is increased by several orders of magnitude(up to 5,000-10,000 J), then decomposition flames can be produced even (Hertzberg and Zlochower 1993) inthe absence of any fuel!
We propose that the behavior of lean fuel-N2O mixtures can be divided into two regimes: 1) low-to-moderate ignition energy (up to 100 J); 2) high ignition energy (above 5000 J). For the low-to-moderateenergy regime, there is a well-defined minimum concentration of fuel (LFL) independent of ignition energyup to some value, at least 100 J. For the high-energy regime, decomposition reactions can be initiatedirrespective of the amount of fuel as long as the energy is released rapidly enough. The precise details ofthe chemical and physical mechanism are not well understood at present but for the purposes of most safetyassessments, it is probably sufficient to characterize the behavior in the low-to-moderate energy regime. It
30

2 3 4 5 6methane [kPa]
0
5
10
15
20
25
peak
pre
ssur
e [1
05 Pa
]ignition energy: 8.0 Jignition energy: 5.0 Jignition energy: 2.0 Jignition energy: 1.0 Jignition energy: 0.2 Jignition energy: 0.01 J
0.01 J
8 J
0.2 J
1-5 J
adiabatic Stanjan calculations
total pressure: 100 kPa% N2O = 100 % - % CH4
Figure 29: Peak pressure vs. methane concentration for various ignition energies.
0 1 2 3 4 5 6 7 8 9 10minimum amount of CH4 for flammability [kPa]
0.01
0.1
1
10
igni
tion
ener
gy [
J] total pressure: 100 kPaN2O = 100 - CH4 [kPa]
upper bound
Figure 30: Minimum ignition energy as a function of methane concentration.
31

remains an intriguing problem in combustion science to determine the details of the flame initiation andpropagation in very lean fuel-N2O mixtures.
32

7 Ammonia–Nitrous Oxide–Nitrogen Mixtures
Previous investigations of lean combustion characteristics of hydrogen–nitrous oxide–ammonia mixtures inair are described in Ross and Shepherd (1996). That work focused on the lean flammability limit behaviorof NH3 and four selected H2-N2O-NH3 blends (mixtures A - D) in air. Peak and final pressures were usedto infer N2O participation. Pressure measurements and visual observations were used to determine LFLvalues for upward and downward flame propagation (see Chapter 4.4). Increasing amounts of N2O resultedin decreasing the LFL but only modest amounts of N2O were examined.
Flammability studied have been conducted with ammonia by Fenton et al. (1995), Armitage and Gray(1965), Andrews and Gray (1964), Buckley and Husa (1962), van der Wal (1934), Jorissen and Ongkiehong(1926) andWhite (1922). We have made measurements with ammonia–nitrous oxide–nitrogen and ammonia–nitrous oxide–air mixtures to determine lower and upper flammability limits and inerting concentrations.Furthermore, ignition energy bounds without dilution and near the inerting concentration of nitrogen wereinvestigated.
7.1 Flammability Limit
Flammability limits were determined for NH3–N2O–N2 and NH3–N2O–air mixtures at a total initial pressureof 100 kPa. The present results are shown in Fig. 31 with nitrogen dilution and in Fig. 32 with air dilution.The flammability limits of ammonia–nitrous oxide mixtures occur at 5.2% (LFL) and 67.5% (UFL) ammoniafor ignition energies less than 10 J. Addition of 60% nitrogen (see Fig. 31) or 84% air (see Fig. 32) will inertthe mixtures.
0 10 20 30 40 50 60 70 80 90 100nitrogen N2 [kPa]
0
10
20
30
40
50
60
70
80
90
amm
onia
NH
3 [k
Pa]
N2O = 100 - NH3 - N2 [kPa]
filled symbols: flammableopen symbols: NOT flammable
ignition energy ≈ 8 J
total pressure: 100 kPa
Φ = 1.0
flammability limit
turbulent conditions
Figure 31: Flammability limits of ammonia–nitrous oxide–nitrogen mixtures.
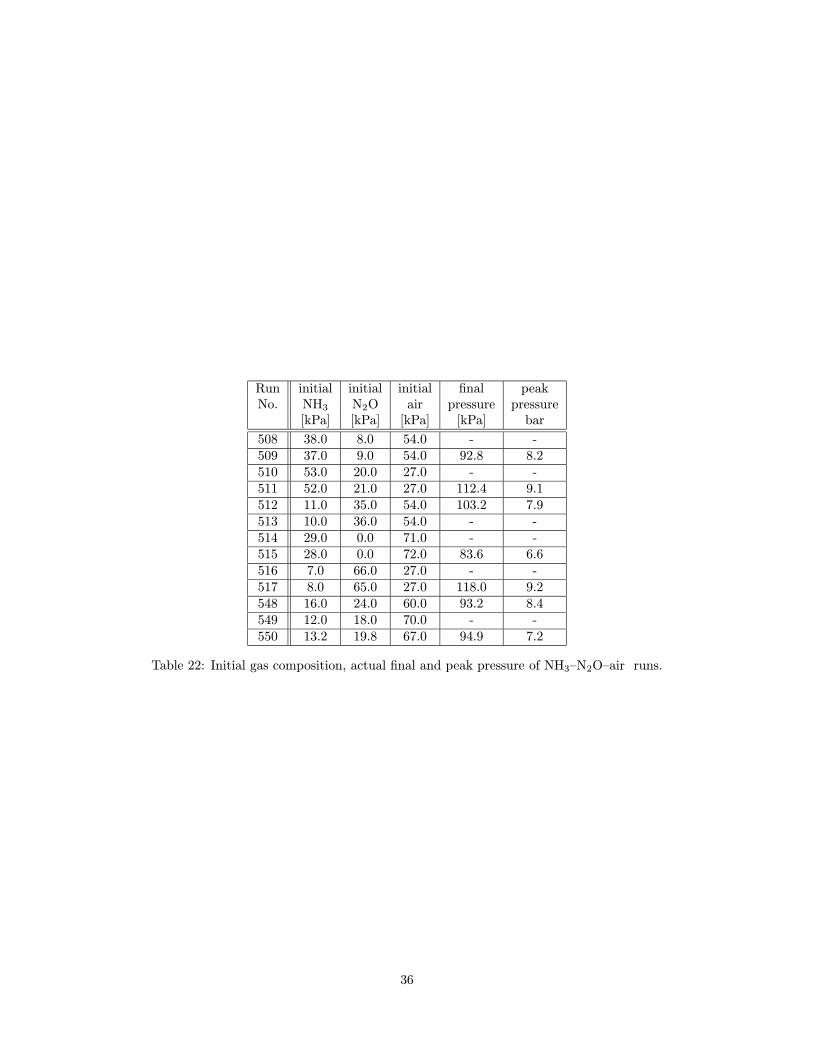
All relevant values of initial gas composition, final and peak pressure of the present NH3–N2O, NH3–N2O–N2 and NH3–N2O–air mixtures are given in the Tables 20, 21 and 22.
33

0 10 20 30 40 50 60 70 80 90 100air [kPa]
0
10
20
30
40
50
60
70
80am
mon
ia N
H3
[kPa
]
Ross and Shepherd (1996)
Jones and Kerr (1949)
N2O = 100 - NH3 - air [kPa]
filled symbols: flammableopen symbols: NOT flammable
ignition energy ≈ 8 J
total pressure: 100 kPaturbulent conditions
flame propagation limit:
flammability limit
Φ = 1.0
N2O = 1.5 x NH3
Figure 32: Flammability limits of ammonia–nitrous oxide–air mixtures.
Run initial initial final peakNo. NH3 N2O pressure pressure
[kPa] [kPa] [kPa] bar
455 7.0 93.0 137.5 11.8456 3.0 97.0 - -457 5.0 95.0 - -458 6.0 94.0 137.6 11.75459 71.0 29.0 - -460 68.0 32.0 - -461 65.0 35.0 130.7 11.0462 67.0 33.0 131.8 10.1463 67.5 32.5 129.8 9.6464 5.5 94.5 137.1 11.45
Table 20: Initial gas composition, actual final and peak pressure of NH3–N2O runs.
34
Run initial initial initial final peakNo. NH3 N2O N2 pressure pressure
[kPa] [kPa] [kPa] [kPa] bar
465 10.0 25.0 65.0 - -466 10.5 29.5 60.0 - -467 8.9 36.1 55.0 - -468 8.5 38.7 52.8 - -469 7.7 44.8 47.5 - -470 20.0 50.0 30.0 102.1 11.7471 20.0 40.0 40.0 97.8 10.7472 18.0 27.0 55.0 93.9 9.2473 16.0 24.0 60.0 94.9 8.1474 15.6 23.4 61.0 - -475 16.4 24.6 59.0 95.0 8.2476 14.8 22.2 63.0 - -477 20.2 20.8 59.0 - -478 14.0 27.0 59.0 98.1 8.4479 8.0 74.0 18.0 124.2 10.5481 7.0 75.0 18.0 124.3 10.2482 6.0 76.0 18.0 - -483 6.5 75.5 18.0 - -484 52.0 30.0 18.0 119.5 9.6485 56.0 26.0 18.0 - -486 54.0 28.0 18.0 - -487 53.0 29.0 18.0 - -488 52.5 29.5 18.0 - -489 37.0 27.0 36.0 - -490 35.0 29.0 36.0 108.9 9.8491 36.0 28.0 36.0 109.5 9.4492 9.0 55.0 36.0 113.9 9.0493 8.0 56.0 36.0 - -494 8.5 55.5 36.0 - -495 11.0 35.0 54.0 104.6 8.1496 10.0 36.0 54.0 - -497 10.5 35.5 54.0 - -498 22.0 24.0 54.0 - -499 21.0 25.0 54.0 97.6 8.8500 17.2 22.3 60.5 - -501 17.0 23.0 60.0 - -502 14.0 26.0 60.0 - -503 15.0 25.5 59.5 96.7 8.3504 14.8 24.7 60.5 - -505 12.5 29.5 58.0 101.7 7.6506 12.0 29.5 58.5 101.0 7.4507 11.5 29.5 59.0 101.2 7.4555 21.5 24.5 54.0 - -557 20.75 25.25 54.0 96.4 8.8558 20.0 26.0 54.0 95.5 9.1561 12.0 34.0 54.0 102.6 8.4563 18.4 27.6 54.0 93.7 9.4
Table 21: Initial gas composition, actual final and peak pressure of NH3–N2O–N2 runs.
35
Run initial initial initial final peakNo. NH3 N2O air pressure pressure
[kPa] [kPa] [kPa] [kPa] bar
508 38.0 8.0 54.0 - -509 37.0 9.0 54.0 92.8 8.2510 53.0 20.0 27.0 - -511 52.0 21.0 27.0 112.4 9.1512 11.0 35.0 54.0 103.2 7.9513 10.0 36.0 54.0 - -514 29.0 0.0 71.0 - -515 28.0 0.0 72.0 83.6 6.6516 7.0 66.0 27.0 - -517 8.0 65.0 27.0 118.0 9.2548 16.0 24.0 60.0 93.2 8.4549 12.0 18.0 70.0 - -550 13.2 19.8 67.0 94.9 7.2
Table 22: Initial gas composition, actual final and peak pressure of NH3–N2O–air runs.
36
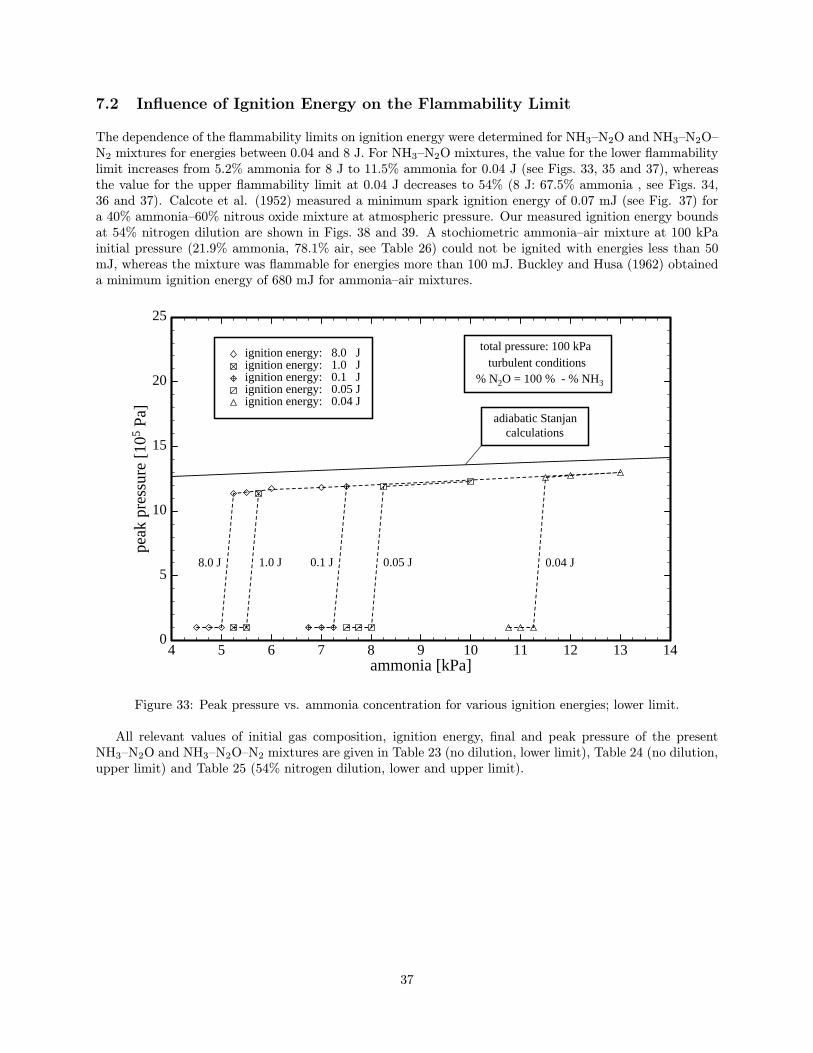
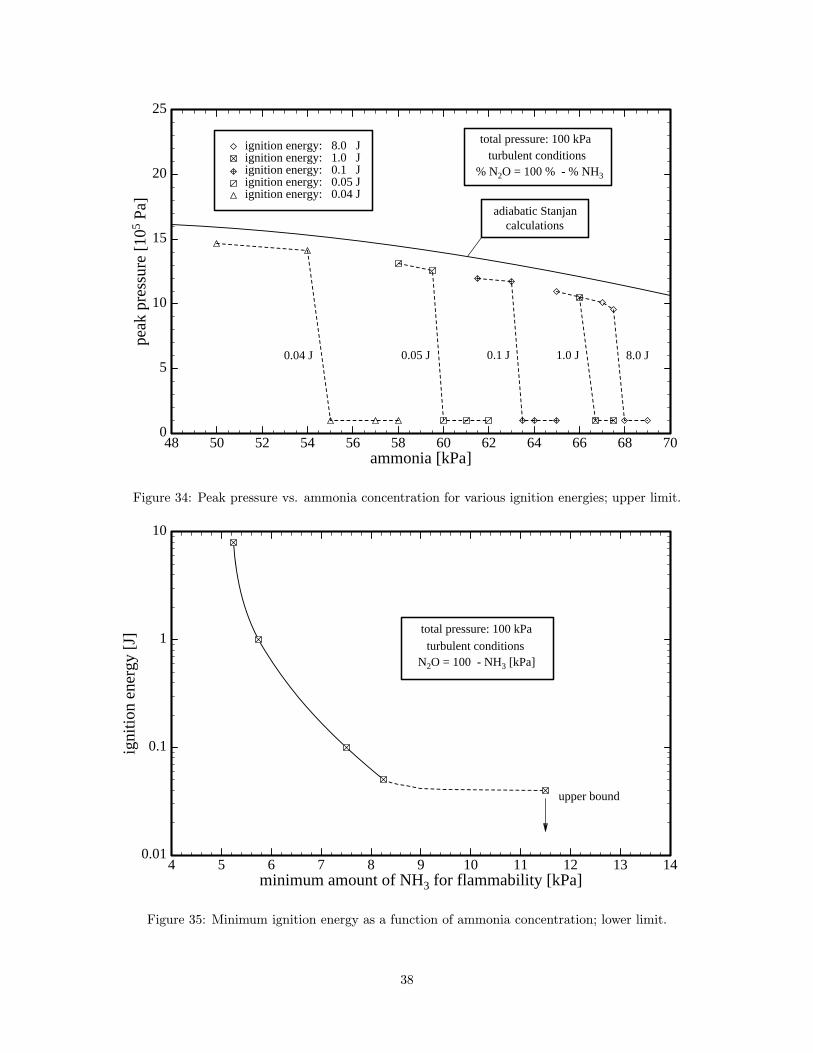
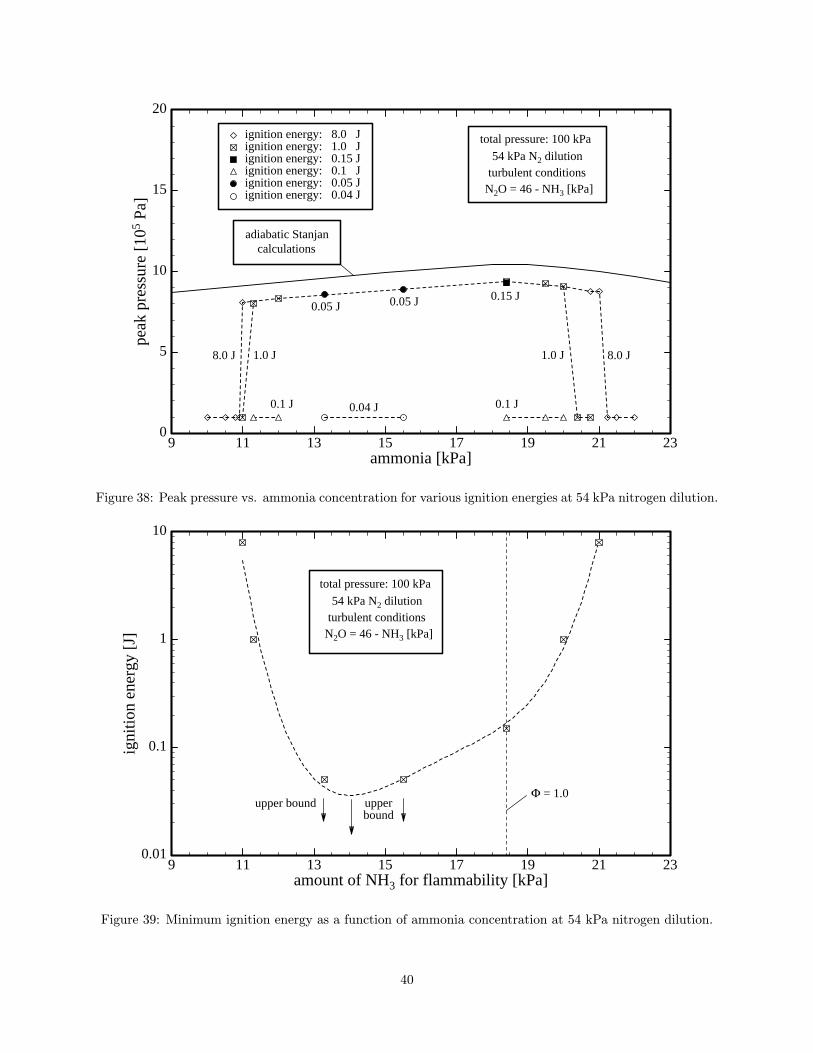
7.2 Influence of Ignition Energy on the Flammability Limit
The dependence of the flammability limits on ignition energy were determined for NH3–N2O and NH3–N2O–N2 mixtures for energies between 0.04 and 8 J. For NH3–N2O mixtures, the value for the lower flammabilitylimit increases from 5.2% ammonia for 8 J to 11.5% ammonia for 0.04 J (see Figs. 33, 35 and 37), whereasthe value for the upper flammability limit at 0.04 J decreases to 54% (8 J: 67.5% ammonia , see Figs. 34,36 and 37). Calcote et al. (1952) measured a minimum spark ignition energy of 0.07 mJ (see Fig. 37) fora 40% ammonia–60% nitrous oxide mixture at atmospheric pressure. Our measured ignition energy boundsat 54% nitrogen dilution are shown in Figs. 38 and 39. A stochiometric ammonia–air mixture at 100 kPainitial pressure (21.9% ammonia, 78.1% air, see Table 26) could not be ignited with energies less than 50mJ, whereas the mixture was flammable for energies more than 100 mJ. Buckley and Husa (1962) obtaineda minimum ignition energy of 680 mJ for ammonia–air mixtures.
4 5 6 7 8 9 10 11 12 13 14ammonia [kPa]
0
5
10
15
20
25
peak
pre
ssur
e [1
05 Pa
]
ignition energy: 8.0 Jignition energy: 1.0 Jignition energy: 0.1 Jignition energy: 0.05 Jignition energy: 0.04 J
turbulent conditions
adiabatic Stanjan calculations
total pressure: 100 kPa
% N2O = 100 % - % NH3
0.04 J0.05 J0.1 J1.0 J8.0 J
Figure 33: Peak pressure vs. ammonia concentration for various ignition energies; lower limit.
All relevant values of initial gas composition, ignition energy, final and peak pressure of the presentNH3–N2O and NH3–N2O–N2 mixtures are given in Table 23 (no dilution, lower limit), Table 24 (no dilution,upper limit) and Table 25 (54% nitrogen dilution, lower and upper limit).
37
48 50 52 54 56 58 60 62 64 66 68 70ammonia [kPa]
0
5
10
15
20
25
peak
pre
ssur
e [1
05 Pa
]ignition energy: 8.0 Jignition energy: 1.0 Jignition energy: 0.1 Jignition energy: 0.05 Jignition energy: 0.04 J
turbulent conditions
adiabatic Stanjan calculations
total pressure: 100 kPa
% N2O = 100 % - % NH3
0.04 J 0.05 J 0.1 J 1.0 J 8.0 J
Figure 34: Peak pressure vs. ammonia concentration for various ignition energies; upper limit.
4 5 6 7 8 9 10 11 12 13 14minimum amount of NH3 for flammability [kPa]
0.01
0.1
1
10
igni
tion
ener
gy [
J]
total pressure: 100 kPa
N2O = 100 - NH3 [kPa]turbulent conditions
upper bound
Figure 35: Minimum ignition energy as a function of ammonia concentration; lower limit.
38

52 54 56 58 60 62 64 66 68 70maximum amount of NH3 for flammability [kPa]
0.01
0.1
1
10
igni
tion
ener
gy [
J]
total pressure: 100 kPa
N2O = 100 - NH3 [kPa]turbulent conditions
upperbound
Figure 36: Minimum ignition energy as a function of ammonia concentration; upper limit.
0 10 20 30 40 50 60 70amount of NH3 for flammability [kPa]
0.0001
0.001
0.01
0.1
1
10
igni
tion
ener
gy [
J]
total pressure: 100 kPa
N2O = 100 - NH3 [kPa]
turbulent conditions
Calcote et al., 1985:minimum ignition energy
NH3-N2O, Φ = 1.0
Kuchta, 1985:typical minimum value
hydrocarbon-air mixtures, Φ ≈ 1.0
upper bound upper bound
Figure 37: Minimum ignition energy as a function of ammonia concentration.
39
9 11 13 15 17 19 21 23ammonia [kPa]
0
5
10
15
20
peak
pre
ssur
e [1
05 Pa
]ignition energy: 8.0 Jignition energy: 1.0 Jignition energy: 0.15 Jignition energy: 0.1 Jignition energy: 0.05 Jignition energy: 0.04 J
turbulent conditions
adiabatic Stanjan calculations
total pressure: 100 kPa
N2O = 46 - NH3 [kPa]
0.1 J
1.0 J8.0 J
54 kPa N2 dilution
8.0 J1.0 J
0.15 J0.05 J
0.04 J
0.05 J
0.1 J
Figure 38: Peak pressure vs. ammonia concentration for various ignition energies at 54 kPa nitrogen dilution.
9 11 13 15 17 19 21 23amount of NH3 for flammability [kPa]
0.01
0.1
1
10
igni
tion
ener
gy [
J]
turbulent conditions
total pressure: 100 kPa
N2O = 46 - NH3 [kPa]
54 kPa N2 dilution
Φ = 1.0upper bound upper
bound
Figure 39: Minimum ignition energy as a function of ammonia concentration at 54 kPa nitrogen dilution.
40
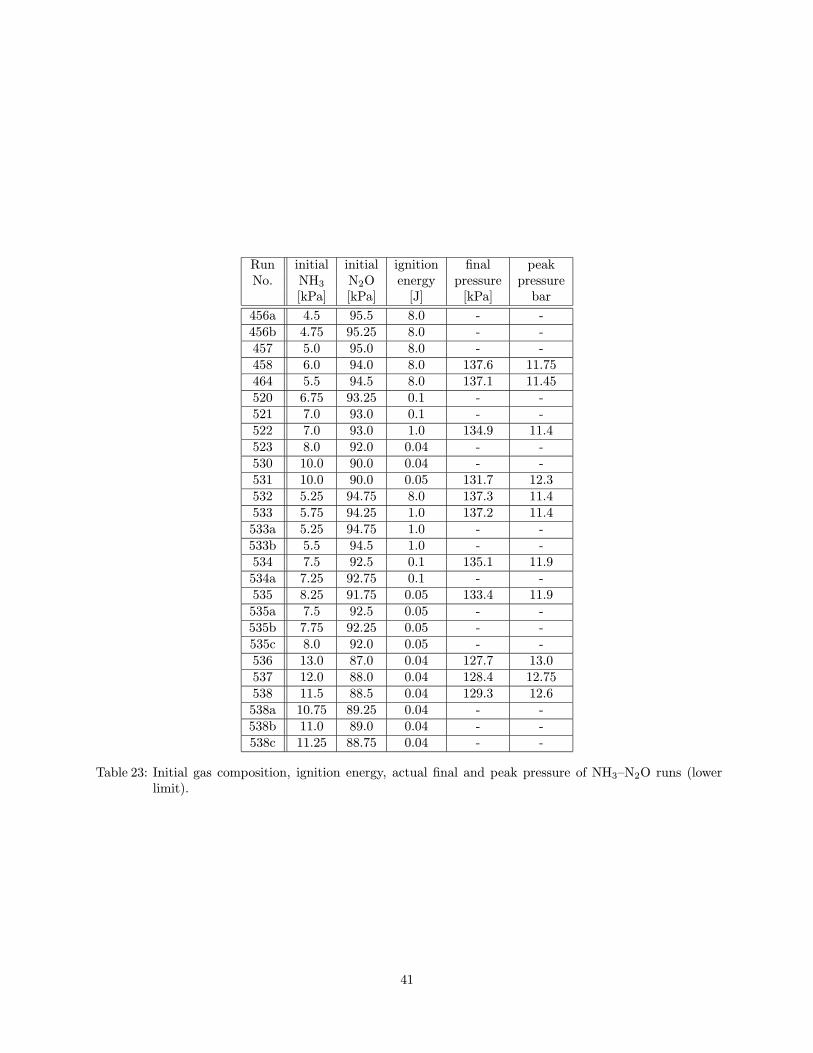
Run initial initial ignition final peakNo. NH3 N2O energy pressure pressure
[kPa] [kPa] [J] [kPa] bar
456a 4.5 95.5 8.0 - -456b 4.75 95.25 8.0 - -457 5.0 95.0 8.0 - -458 6.0 94.0 8.0 137.6 11.75464 5.5 94.5 8.0 137.1 11.45520 6.75 93.25 0.1 - -521 7.0 93.0 0.1 - -522 7.0 93.0 1.0 134.9 11.4523 8.0 92.0 0.04 - -530 10.0 90.0 0.04 - -531 10.0 90.0 0.05 131.7 12.3532 5.25 94.75 8.0 137.3 11.4533 5.75 94.25 1.0 137.2 11.4533a 5.25 94.75 1.0 - -533b 5.5 94.5 1.0 - -534 7.5 92.5 0.1 135.1 11.9534a 7.25 92.75 0.1 - -535 8.25 91.75 0.05 133.4 11.9535a 7.5 92.5 0.05 - -535b 7.75 92.25 0.05 - -535c 8.0 92.0 0.05 - -536 13.0 87.0 0.04 127.7 13.0537 12.0 88.0 0.04 128.4 12.75538 11.5 88.5 0.04 129.3 12.6538a 10.75 89.25 0.04 - -538b 11.0 89.0 0.04 - -538c 11.25 88.75 0.04 - -
Table 23: Initial gas composition, ignition energy, actual final and peak pressure of NH3–N2O runs (lowerlimit).
41

Run initial initial ignition final peakNo. NH3 N2O energy pressure pressure
[kPa] [kPa] [J] [kPa] bar
459a 69.0 31.0 8.0 - -460 68.0 32.0 8.0 - -461 65.0 35.0 8.0 130.7 11.0462 67.0 33.0 8.0 131.8 10.1463 67.5 32.5 8.0 129.8 9.6539 40.0 60.0 0.04 85.3 15.3540 59.5 40.5 0.05 121.3 12.6540a 62.0 38.0 0.05 - -540b 61.0 39.0 0.05 - -540c 60.0 40.0 0.05 - -541 50.0 50.0 0.04 105.1 14.7541a 58.0 42.0 0.04 - -541b 57.0 43.0 0.04 - -541c 55.0 45.0 0.04 - -542 54.0 46.0 0.04 111.9 14.1543 58.0 42.0 0.05 118.6 13.1544 63.0 37.0 0.1 127.0 11.7544a 65.0 35.0 0.1 - -544b 64.0 36.0 0.1 - -544c 63.5 36.5 0.1 - -545 61.5 38.5 0.1 126.7 12.0546 66.0 34.0 1.0 129.7 10.5546a 67.5 32.5 1.0 - -546b 66.7 33.3 1.0 - -
Table 24: Initial gas composition, ignition energy, actual final and peak pressure of NH3–N2O runs (upperlimit).
42

Run initial initial initial ignition final peakNo. NH3 N2O N2 energy pressure pressure
[kPa] [kPa] [kPa] [J] [kPa] bar
496 10.0 36.0 54.0 8.0 - -551 10.5 35.5 54.0 8.0 - -552 10.8 35.2 54.0 8.0 - -553 10.9 35.1 54.0 8.0 - -495 11.0 35.0 54.0 8.0 104.6 8.1553a 11.0 35.0 54.0 1.0 - -554 18.4 27.6 54.0 1.0 94.1 9.37554a 18.4 27.6 54.0 0.1 - -498 22.0 24.0 54.0 8.0 - -555 21.5 24.5 54.0 8.0 - -556 21.25 24.75 54.0 8.0 - -499 21.0 25.0 54.0 8.0 97.6 8.8557 20.75 25.25 54.0 8.0 96.4 8.8557a 20.75 25.25 54.0 1.0 - -558a 20.0 26.0 54.0 1.0 95.3 9.06558b 20.0 26.0 54.0 0.1 - -559 20.4 25.6 54.0 1.0 - -560 19.5 26.5 54.0 1.0 94.6 9.26560a 19.5 26.5 54.0 0.1 - -561a 12.0 34.0 54.0 1.0 102.4 8.35561b 12.0 34.0 54.0 0.1 - -562 11.3 34.7 54.0 1.0 104.2 8.0562a 11.3 34.7 54.0 0.1 - -563a 18.4 27.6 54.0 0.15 94.4 9.3564 15.5 30.5 54.0 0.05 98.3 8.9564a 15.5 30.5 54.0 0.04 - -565 13.3 32.7 54.0 0.05 101.2 8.6565a 13.3 32.7 54.0 0.04 - -
Table 25: Initial gas composition, ignition energy, actual final and peak pressure of NH3–N2O–N2 runs (54%nitrogen dilution, lower and upper limit).
Run initial initial initial ignition final peakNo. NH3 N2O air energy pressure pressure
[kPa] [kPa] [kPa] [mJ] [kPa] bar
547 21.9 0.0 78.1 100 75.7 7.3547a 21.9 0.0 78.1 40 - -547b 21.9 0.0 78.1 50 - -
Table 26: Initial gas composition, ignition energy, actual final and peak pressure of NH3–air runs, Φ = 1.0.
43

8 Mixture 27
Flammability limits, ignition energy bounds and product compositions were determined for mixture 27 (40%H2, 40% N2O, 20% CH4) with air.
8.1 Lean Flammability Limit and Ignition Energy Bounds
At 8 J ignition energy, the lower flammability limit of mixture 27 with air occurs at 7% mixture 27 and thereis no upper limit, 100% mixture 27 without air is still flammable. The peak pressures during combustionare shown in Figs. 40 and 41 and compared to STANJAN calculations. Within the range of ignition energyfrom 0.04 to 8 J, there is almost no measurable shift of the lower flammability limit (see Fig. 42). The initialgas composition, actual final and peak pressure of mixture 27–air runs are given in Table 27 for 8 J ignitionenergy and in Table 28 for 0.04 J ignition energy.
0 10 20 30 40 50 60 70 80 90 100initial amount of mixture 27 [kPa]
0
5
10
15
20
peak
pre
ssur
e [1
05 Pa
] ignition energy: 8.0 J
mixture 27: 0.4 H2 0.4 N2O 0.2 CH4
turbulent conditionsadiabatic Stanjan calculations
total pressure: 100 kPaair = 100 - mixture 27 [kPa]
Figure 40: Peak pressure vs. mixture 27 concentration.
44

Run initial initial final peakNo. mixture 27 air pressure pressure
[kPa] [kPa] [kPa] bar
577 11.0 89.0 92.8 4.54578 100.0 0.0 122.9 11.3579 50.0 50.0 84.4 10.3580 75.0 25.0 106.1 10.9581 25.0 75.0 87.1 8.17582 3.0 97.0 - -582a 5.0 95.0 - -583 10.0 90.0 90.2 3.93584 8.0 92.0 95.4 1.73585 9.0 91.0 93.2 3.31586 7.0 93.0 99.1 1.10590 11.0 89.0 92.5 4.48591 12.0 88.0 91.8 4.98592 15.0 85.0 93.5 6.23593 15.0 85.0 93.6 6.20
Table 27: Initial gas composition, actual final and peak pressure of mixture 27–air runs.
Run initial initial ignition final peakNo. mixture 27 air energy pressure pressure
[kPa] [kPa] [J] [kPa] bar
587 10.0 90.0 0.04 93.0 3.51588 9.0 91.0 0.04 93.4 3.24589 8.0 92.0 0.04 105.5 1.59589a 6.0 94.0 0.04 - -589b 7.0 93.0 0.04 - -
Table 28: Initial gas composition, ignition energy, actual final and peak pressure of mixture 27–air runs.
45

0 5 10 15initial amount of mixture 27 [kPa]
0
1
2
3
4
5
6
7
8
9
10
peak
pre
ssur
e [1
05 Pa
]
ignition energy: 8.0 Jignition energy: 0.04 J
mixture 27: 0.4 H2 0.4 N2O 0.2 CH4
turbulent conditionsadiabatic Stanjan calculations
total pressure: 100 kPaair = 100 - mixture 27 [kPa]
Figure 41: Peak pressure vs. mixture 27 concentration for various ignition energies.
6 7 8 9 10 11 12 13 14minimum amount of mixture 27 for flammability [kPa]
0.01
0.1
1
10
igni
tion
ener
gy [
J]
mixture 27: 0.4 H2 0.4 N2O 0.2 CH4
total pressure: 100 kPa
turbulent conditionsair = 100 - mixture 27 [kPa]
upper bound
Figure 42: Minimum ignition energy as a function of mixture 27 concentration.
46
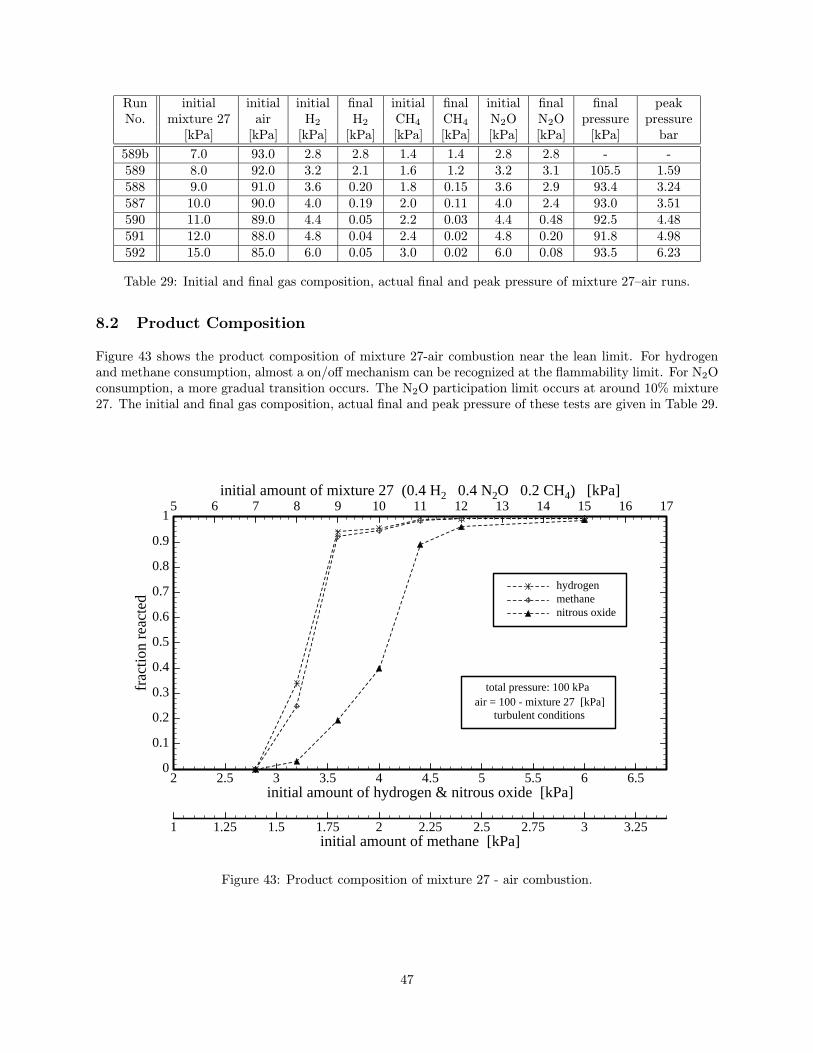
Run initial initial initial final initial final initial final final peakNo. mixture 27 air H2 H2 CH4 CH4 N2O N2O pressure pressure
[kPa] [kPa] [kPa] [kPa] [kPa] [kPa] [kPa] [kPa] [kPa] bar
589b 7.0 93.0 2.8 2.8 1.4 1.4 2.8 2.8 - -589 8.0 92.0 3.2 2.1 1.6 1.2 3.2 3.1 105.5 1.59588 9.0 91.0 3.6 0.20 1.8 0.15 3.6 2.9 93.4 3.24587 10.0 90.0 4.0 0.19 2.0 0.11 4.0 2.4 93.0 3.51590 11.0 89.0 4.4 0.05 2.2 0.03 4.4 0.48 92.5 4.48591 12.0 88.0 4.8 0.04 2.4 0.02 4.8 0.20 91.8 4.98592 15.0 85.0 6.0 0.05 3.0 0.02 6.0 0.08 93.5 6.23
Table 29: Initial and final gas composition, actual final and peak pressure of mixture 27–air runs.
8.2 Product Composition
Figure 43 shows the product composition of mixture 27-air combustion near the lean limit. For hydrogenand methane consumption, almost a on/off mechanism can be recognized at the flammability limit. For N2Oconsumption, a more gradual transition occurs. The N2O participation limit occurs at around 10% mixture27. The initial and final gas composition, actual final and peak pressure of these tests are given in Table 29.
2 2.5 3 3.5 4 4.5 5 5.5 6 6.5initial amount of hydrogen & nitrous oxide [kPa]
5 6 7 8 9 10 11 12 13 14 15 16 17initial amount of mixture 27 (0.4 H2 0.4 N2O 0.2 CH4) [kPa]
0
0.1
0.2
0.3
0.4
0.5
0.6
0.7
0.8
0.9
1
frac
tion
reac
ted
hydrogenmethanenitrous oxide
1 1.25 1.5 1.75 2 2.25 2.5 2.75 3 3.25initial amount of methane [kPa]
total pressure: 100 kPa
turbulent conditionsair = 100 - mixture 27 [kPa]
Figure 43: Product composition of mixture 27 - air combustion.
47

9 Mixture 28
Flammability limits, ignition energy bounds and product compositions were determined for mixture 28 (35%H2, 35% N2O, 10% CH4, 20% NH3) with air.
9.1 Lean Flammability Limit and Ignition Energy Bounds
At 8 J ignition energy the lower flammability limit of mixture 28 with air occurs at 9% and there is no upperlimit, 100% mixture 28 without air are still flammable. The peak pressures during combustion are shownin Figs. 44 and 45 and compared to adiabatic STANJAN calculations. Within the range of ignition energyfrom 0.04 to 8 J, there is only a very weak shift of the lower flammability limit (see Fig. 46). The initialgas composition, actual final and peak pressure of mixture 28–air runs are given in Table 30 for 8 J ignitionenergy and in Table 31 for various ignition energies between 0.04 and 1.0 J.
0 10 20 30 40 50 60 70 80 90 100initial amount of mixture 28 [kPa]
0
5
10
15
20
peak
pre
ssur
e [1
05 Pa
] ignition energy: 8.0 J
mixture 28: 0.35 H2 0.35 N2O 0.1 CH4 0.2 NH3
turbulent conditionsadiabatic Stanjan calculations
total pressure: 100 kPaair = 100 - mixture 28 [kPa]
Figure 44: Peak pressure vs. mixture 28 concentration.
48

Run initial initial final peakNo. mixture 28 air pressure pressure
[kPa] [kPa] [kPa] bar
598 11.0 89.0 103.2 3.38599 15.0 85.0 96.1 5.53600 13.0 87.0 99.5 4.66601 12.0 88.0 97.8 4.08602 18.0 82.0 89.9 6.09603 11.6 88.4 99.3 3.83604 9.0 91.0 - 1.59605 4.0 96.0 - -605a 6.0 94.0 - -605b 8.0 92.0 - -606 100.0 0.0 114.9 10.89607 75.0 25.0 97.0 10.55608 50.0 50.0 78.8 10.16609 25.0 75.0 81.8 7.54612 8.5 91.5 - -
Table 30: Initial gas composition, actual final and peak pressure of mixture 28–air runs.
Run initial initial ignition final peakNo. mixture 28 air energy pressure pressure
[kPa] [kPa] [J] [kPa] bar
610 12.0 88.0 0.04 94.5 3.98611 9.9 90.1 0.05 95.6 2.15612a 8.75 91.25 1.0 - -613 9.0 91.0 1.0 - -614 9.2 90.8 1.0 99.0 1.40615 9.5 90.5 0.05 98.3 1.79616 10.5 89.5 0.04 94.7 2.71617 9.3 90.7 0.05 95.4 1.52618 10.0 90.0 0.04 96.6 2.21
Table 31: Initial gas composition, ignition energy, actual final and peak pressure of mixture 28–air runs.
49
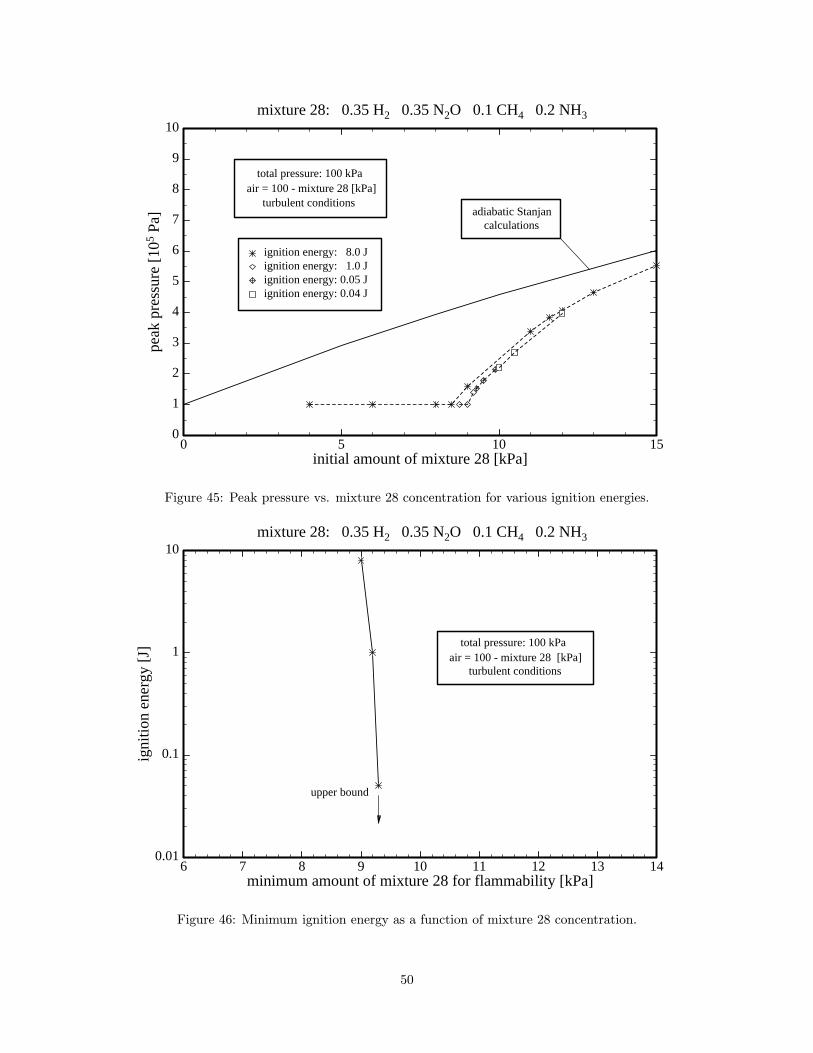
0 5 10 15initial amount of mixture 28 [kPa]
0
1
2
3
4
5
6
7
8
9
10
peak
pre
ssur
e [1
05 Pa
]
ignition energy: 8.0 Jignition energy: 1.0 Jignition energy: 0.05 Jignition energy: 0.04 J
mixture 28: 0.35 H2 0.35 N2O 0.1 CH4 0.2 NH3
turbulent conditionsadiabatic Stanjan calculations
total pressure: 100 kPaair = 100 - mixture 28 [kPa]
Figure 45: Peak pressure vs. mixture 28 concentration for various ignition energies.
6 7 8 9 10 11 12 13 14minimum amount of mixture 28 for flammability [kPa]
0.01
0.1
1
10
igni
tion
ener
gy [
J]
mixture 28: 0.35 H2 0.35 N2O 0.1 CH4 0.2 NH3
total pressure: 100 kPa
turbulent conditionsair = 100 - mixture 28 [kPa]
upper bound
Figure 46: Minimum ignition energy as a function of mixture 28 concentration.
50

Run initial initial initial final initial final initial final initial final peakNo. mixture 28 air H2 H2 CH4 CH4 N2O N2O NH3 pressure pressure
[kPa] [kPa] [kPa] [kPa] [kPa] [kPa] [kPa] [kPa] [kPa] [kPa] bar
605b 8.0 92.0 2.8 2.8 0.8 0.80 2.8 2.8 1.6 - -604 9.0 91.0 3.15 2.3 0.9 0.75 3.15 3.05 1.8 - 1.59598 11.0 89.0 3.85 0.20 1.1 0.09 3.85 3.7 2.2 103.2 3.38603 11.6 88.4 4.06 0.10 1.16 0.05 4.06 1.6 2.32 99.3 3.83601 12.0 88.0 4.2 0.06 1.2 0.03 4.2 1.5 2.4 97.8 4.08600 13.0 87.0 4.55 0.05 1.3 0.02 4.55 0.54 2.6 99.5 4.66599 15.0 85.0 5.25 0.05 1.5 0.00 5.25 0.20 3.0 96.1 5.53602 18.0 82.0 6.3 0.02 1.8 0.00 6.3 0.04 3.6 89.9 6.09
Table 32: Initial and final gas composition, actual final and peak pressure of mixture 28–air runs.
9.2 Product Composition
Figure 47 shows the product composition for combustion of mixture 28-air near the lean limit. The behaviorof hydrogen and methane consumption is very similar to the results obtained for mixture 27. The nitrousoxide consumption shows a stronger on/off mechanism with a participation limit of 12% mixture 28. Theinitial and final gas composition, actual final and peak pressure of the present runs are given in Table 32.
2.5 3 3.5 4 4.5 5 5.5 6 6.5 7initial amount of hydrogen & nitrous oxide [kPa]
6 7 8 9 10 11 12 13 14 15 16 17 18 19 20initial amount of mixture 28 (0.35 H2 0.35 N2O 0.1 CH4 0.2 NH3) [kPa]
0
0.1
0.2
0.3
0.4
0.5
0.6
0.7
0.8
0.9
1
frac
tion
reac
ted
hydrogenmethanenitrous oxide
0.6 0.7 0.8 0.9 1 1.1 1.2 1.3 1.4 1.5 1.6 1.7 1.8 1.9 2initial amount of methane [kPa]
total pressure: 100 kPa
turbulent conditionsair = 100 - mixture 28 [kPa]
Figure 47: Product composition of mixture 28 - air combustion.
51

10 Mixture 29
Flammability limits, ignition energy bounds and product compositions were determined for mixture 29 (29%H2, 24% N2O, 11% NH3, 35% N2, 1% CH4) with air.
10.1 Lean Flammability Limit and Ignition Energy Bounds
At 8 J ignition energy, the lower flammability limit of mixture 29 with air occurs at 14%, the upper flamma-bility limit occurs between 90 and 100% mixture 29. The peak pressures during combustion are shown inFig. 48 and compared to adiabatic STANJAN calculations. Within the range of ignition energy from 0.05 to8 J, we observed no shift of the lower flammability limit (see Fig. 49). The initial gas composition, ignitionenergy, actual final and peak pressure of mixture 29–air runs are given in Table 33.
0 10 20 30 40 50 60 70 80 90 100initial amount of mixture 29 [kPa]
0
5
10
15
20
peak
pre
ssur
e [1
05 Pa
] ignition energy: 8.0 Jignition energy: 0.05 J
mixture 29: 0.29 H2 0.24 N2O 0.11 NH3 0.35 N2 0.01 CH4
turbulent conditions
adiabatic Stanjan calculations
total pressure: 100 kPaair = 100 - mixture 29 [kPa]
Figure 48: Peak pressure vs. mixture 29 concentration for various ignition energies.
10.2 Product Composition
Figure 50 shows the product composition of mixture 29-air combustion near the lean limit. The behaviorof hydrogen consumption is very different from the results obtained for mixture 27 and mixture 28. Thereis no distinct on/off mechanism around the lower flammability limit. The nitrous oxide consumption showsa smooth increase of N2O consumption with increasing amount of mixture 29. No sharp nitrous oxideparticipation limit can be observed. The initial and final gas composition, actual final and peak pressure ofthe present runs are given in Table 34.
52

Run initial initial ignition final peakNo. mixture 29 air energy pressure pressure
[kPa] [kPa] [J] [kPa] bar
633 100.0 0.0 8.0 - -634 90.0 10.0 8.0 85.7 8.94635 70.0 30.0 8.0 75.4 8.90636 50.0 50.0 8.0 79.0 7.53637 25.0 75.0 8.0 88.9 4.52638 15.0 85.0 8.0 95.6 1.71639 10.0 90.0 8.0 - -639a 12.0 88.0 8.0 - -640 13.0 87.0 0.04 - -640a 13.0 87.0 1.0 - -640b 13.0 87.0 8.0 - -641 14.0 86.0 0.05 101.3 1.29641a 14.0 86.0 0.04 - -642 14.0 86.0 8.0 101.2 1.30643 20.0 80.0 8.0 90.7 3.26642 17.5 82.5 8.0 - 2.54
Table 33: Initial gas composition, ignition energy, actual final and peak pressure of mixture 29–air runs.
Run initial initial initial final initial initial final initial final peakNo. mixture 29 air H2 H2 CH4 N2O N2O NH3 pressure pressure
[kPa] [kPa] [kPa] [kPa] [kPa] [kPa] [kPa] [kPa] [kPa] bar
640b 13.0 87.0 3.77 3.77 0.13 3.12 3.12 1.43 - -641 14.0 86.0 4.06 3.02 0.14 3.36 3.20 1.54 101.3 1.29638 15.0 85.0 4.35 2.33 0.15 3.6 3.34 1.65 95.6 1.71643 20.0 80.0 5.8 0.19 0.20 4.8 3.84 2.2 90.7 3.26637 25.0 75.0 7.25 0.07 0.25 6.0 0.98 2.75 88.9 4.52
Table 34: Initial and final gas composition, actual final and peak pressure of mixture 29–air runs.
53

11 12 13 14 15 16 17 18 19 20minimum amount of mixture 29 for flammability [kPa]
0.01
0.1
1
10ig
nitio
n en
ergy
[J]
mixture 29: 0.29 H2 0.24 N2O 0.11 NH3 0.35 N2 0.01 CH4
total pressure: 100 kPa
turbulent conditionsair = 100 - mixture 29 [kPa]
upper bound
Figure 49: Minimum ignition energy as a function of mixture 29 concentration.
2.5 3 3.5 4 4.5 5 5.5 6 6.5initial amount of nitrous oxide [kPa]
10 12 14 16 18 20 22 24 26 28mixture 29 (0.29 H2 0.24 N2O 0.11 NH3 0.35 N2 0.01 CH4) [kPa]
0
0.1
0.2
0.3
0.4
0.5
0.6
0.7
0.8
0.9
1
frac
tion
reac
ted
hydrogennitrous oxide
3 3.5 4 4.5 5 5.5 6 6.5 7 7.5 8initial amount of hydrogen [kPa]
total pressure: 100 kPa
turbulent conditionsair = 100 - mixture 29 [kPa]
Figure 50: Product composition of mixture 29 - air combustion.
54
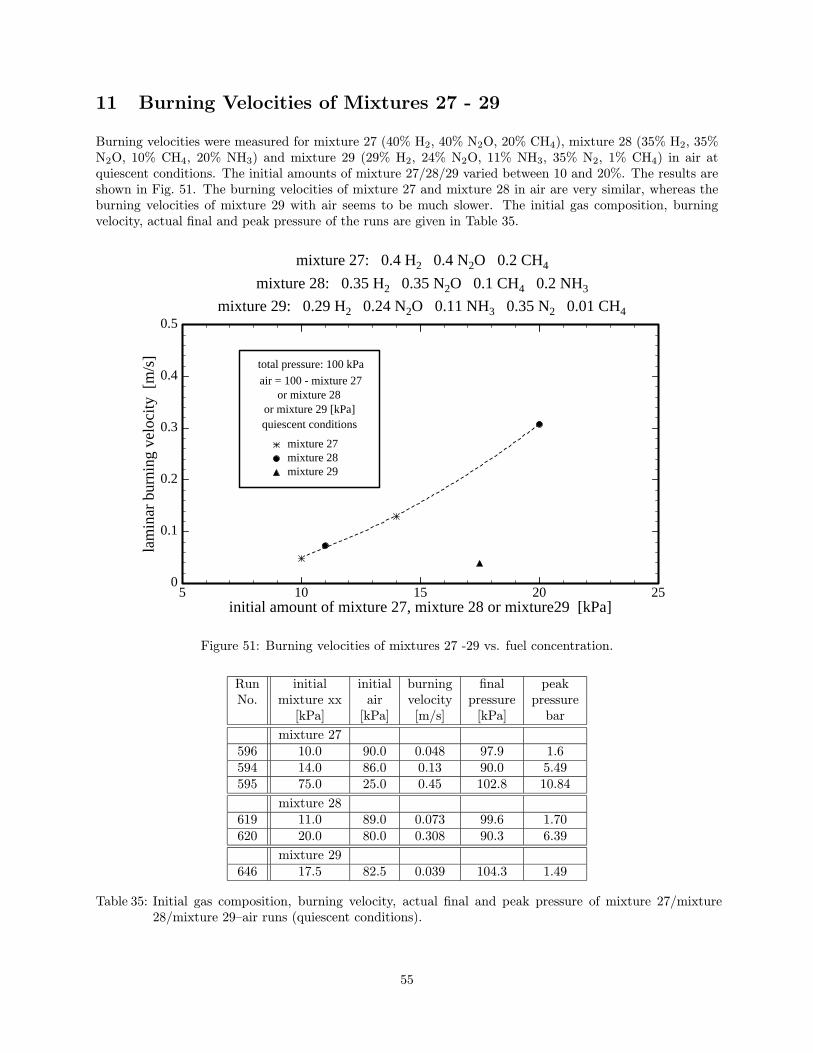
11 Burning Velocities of Mixtures 27 - 29
Burning velocities were measured for mixture 27 (40% H2, 40% N2O, 20% CH4), mixture 28 (35% H2, 35%N2O, 10% CH4, 20% NH3) and mixture 29 (29% H2, 24% N2O, 11% NH3, 35% N2, 1% CH4) in air atquiescent conditions. The initial amounts of mixture 27/28/29 varied between 10 and 20%. The results areshown in Fig. 51. The burning velocities of mixture 27 and mixture 28 in air are very similar, whereas theburning velocities of mixture 29 with air seems to be much slower. The initial gas composition, burningvelocity, actual final and peak pressure of the runs are given in Table 35.
5 10 15 20 25initial amount of mixture 27, mixture 28 or mixture29 [kPa]
0
0.1
0.2
0.3
0.4
0.5
lam
inar
bur
ning
vel
ocity
[m
/s]
mixture 27mixture 28mixture 29
mixture 27: 0.4 H2 0.4 N2O 0.2 CH4
mixture 28: 0.35 H2 0.35 N2O 0.1 CH4 0.2 NH3
mixture 29: 0.29 H2 0.24 N2O 0.11 NH3 0.35 N2 0.01 CH4
total pressure: 100 kPa
air = 100 - mixture 27or mixture 28
quiescent conditionsor mixture 29 [kPa]
Figure 51: Burning velocities of mixtures 27 -29 vs. fuel concentration.
Run initial initial burning final peakNo. mixture xx air velocity pressure pressure
[kPa] [kPa] [m/s] [kPa] bar
mixture 27596 10.0 90.0 0.048 97.9 1.6594 14.0 86.0 0.13 90.0 5.49595 75.0 25.0 0.45 102.8 10.84
mixture 28619 11.0 89.0 0.073 99.6 1.70620 20.0 80.0 0.308 90.3 6.39
mixture 29646 17.5 82.5 0.039 104.3 1.49
Table 35: Initial gas composition, burning velocity, actual final and peak pressure of mixture 27/mixture28/mixture 29–air runs (quiescent conditions).
55

For mixture 27, burning velocities were also measured at turbulent conditions. However, these measure-ments are less meaningful than those at quiescent conditions. The flame surface is quite convoluted and onlyan average flame speed can be observed. The maximum measurable flame speed is limited by the windowsand the time duration between each frame (camera speed). Therefore the results in Fig. 52 for 25 and 50kPa initial amount of mixture 27 are only lower bounds for the burning velocities. The burning velocity issligthly higher at 25 than at 50 kPa of mixture 27.
0 10 20 30 40 50 60 70 80 90 100initial amount of mixture 27 [kPa]
0
0.1
0.2
0.3
0.4
0.5
0.6
0.7
0.8
0.9
1
burn
ing
velo
city
[m
/s]
turbulent conditionsquiescent conditions
mixture 27: 0.4 H2 0.4 N2O 0.2 CH4
total pressure: 100 kPaair = 100 - mixture 27 [kPa]
lower bound
Figure 52: Mixture 27: comparison between laminar (quiescent conditions) and turbulent burning velocity.
56

12 Conclusions
This study complements the previous work and rounds out our knowledge of combustion in mixtures con-taining components found in the flammable gases retained within the waste at the Hanford tank farm. Thisstudy has provided significant new data on the following combustion problems
1. The fraction of N2O reacted in lean hydrogen–nitrous oxide–air, methane–nitrous oxide–air and ammonia–nitrous oxide–nitrogen mixtures and selected waste gas simulants (H2-N2O-N2-NH3-CH4 blends, mix-tures a - d) mixed with air has been quantified.
2. The behavior of methane–nitrous oxide–nitrogen mixtures has been studied in detail.
3. Flammability limits and inerting concentrations of ammonia–nitrous oxide–nitrogen and ammonia–nitrous oxide–air mixtures have been quantified.
4. Ignition energy bounds of ammonia–nitrous oxide mixtures (rich and lean, with and without nitrogendilution) have been measured.
5. Flammability limits, ignition energy bounds, flame speeds and product compositions of selected hydrogen–nitrous oxide–ammonia–methane–nitrogen mixtures (mixtures 27 - 29) have been investigated.
The current study required both expanding our capabilities (gas sampling and measurement) and re-stricting operations in other areas (smaller vessel, operation without windows).
The present investigations were carried out in the 11-liter vessel since high pressures (up to 12 bar) areconsistently produced with mixtures containing substantial amounts of N2O. The 11-liter vessel reduces thetotal amount of gas by a factor of 40 over the CONVOL vessel that was used in previous tests. This isimportant both from the viewpoint of minimizing the total energy of explosives in the lab and in reducingthe heat load on the vessel. Preliminary testing with CONVOL indicated that a cooling system would haveto be installed in order to use mixtures with substantial amounts of N2O if more than one test per day wereperformed.
High-speed flames and the potential for DDT are an issue in the laboratory experiments that forman important constraint on operations with substantial amounts of N2O. For many of the present tests,measurements were made without the schlieren system since the windows were damaged in preliminary testswith high N2O fraction mixtures. Operation with windows also poses a safety hazard in this regime.
This means that flame speed measurements could not be made on many of these experiments. In addition,the current technique for flame speed measurement relies on the video recording system to acquire images forlater processing. In systems containing large amounts of N2O, the flames are sufficiently fast that the videosystem is inappropriate. Future studies should consider alternate flame speed measurement techniques.
57
References
Andrews, D. G. R. and P. Gray (1964). Combustion of ammonia supported by oxygen, nitrous oxide ornitric oxide: laminar flame propagation at low pressures in binary mixtures. Combustion and Flame 8,113–126.
Armitage, J. W. and P. Gray (1965). Flame speeds and flammability limits in the combustion of ammonia:ternary mixtures with hydrogen, nitric oxide, nitrous oxide or oxygen. Combustion and Flame 9, 173–184.
Breshears, W. D. (1995). Falloff behavior in the thermal dissociation rate of N2O. Journal of PhysicalChemistry 99, 12529 – 12535.
Buckley, W. L. and H. W. Husa (1962). Combustion properties of ammonia. Chemical EngineeringProgress 58, 2, 81–84.
Calcote, H. F., J. C. A. Gregory, C. M. Barnett, and R. B. Gilmer (1952). Spark ignition. Industrial andEngineering Chemistry 44, 11, 2656–2662.
Cashdollar, K., M. Hertzberg, I. Zlochower, C. Lucci, G. M. Green, and R. A. Thomas (1992, June).Laboratory flammability studies of mixtures of hydrogen, nitrous oxide, and air. Final Report WHC-SD-WM-ES-219, Bureau of Mines.
Coward, H. F. and G. W. Jones (1952). Limits of flammability of gases and vapors. Bulletin 503, Bureauof Mines.
Fenton, D. L., A. S. Khan, R. D. Kelley, and K. S. Chapman (1995). Combustion characteristics reviewof ammonia–air mixtures. ASHRAE Transactions 3922, 1–10.
Hertzberg, M. and I. Zlochower (1993). Explosibility of nitrous oxide gas: The effect of H-atom-bearingimpurities. Abstract, Joint Meeting of British and German Sections of the Combustion Institute, March29-April 3, Cambridge, England.
Jones, E. and J. Kerr (1949). Inflammability limits of ammonia, nitrous oxide, and air. J.S.C.I. 68, 31–34.
Jorissen, W. P. and B. L. Ongkiehong (1926). The explosion regions of hydrogen–ammonia–air andhydrogen–ammonia–oxygen mixtures. Rec. trav. chim. 45, 224–231.
Kuchta, J. (1985). Investigation of fire and explosion accidents in the chemical, mining, and fuel-relatedindustries—a manual. Bulletin 680, U.S. Bureau of Mines.
Posthumus, K. (1930). On explosion regions of gas mixtures, in which one or two of the gases are en-dothermic. Rec. trav. chim. 49, 309–347.
Reynolds, W. C. (1986, January). The Element Potential Method for Chemical Equilibrium Analysis:Implementation in the Interactive Program STANJAN (3rd ed.). Dept. of Mechanical Engineering,Stanford, CA: Stanford University.
Ronney, P. D. (1985). Effect of gravity on laminar premixed gas combustion ii: ignition and extinctionphenomena. Combustion and Flame 62, 121–133.
Ross, M. C. and J. E. Shepherd (1996, July). Lean combustion characteristics of hydrogen-nitrous oxide-ammonia mixtures in air. part i. Explosion Dynamics Lab Report FM96-4, California Institute ofTechnology, Pasadena, CA.
Scott, F. E., R. W. V. Dolah, and M. G. Zabetakis (1957). The flammability characteristics of the systemH2–no–N2O–air. In Sixth Symp. (Intl) Combustion, Pittsburgh, PA, pp. 540–545. The CombustionInstitute.
Shebeko, Y. N., S. G. Tsarichenko, A. Y. Korolchenko, A. V. Trunev, V. Y. Navzenya, S. N. Papkov,and A. A. Zaitzev (1995). Burning velocities and flammability limits of gaseous mixtures at elevatedtemperatures and pressures. Combustion and Flame 102, 427–437.
Smith, S. and J. W. Linnett (1953). The upper limits of inflammability of hydrogen–air and hydrogen–nitrous oxide mixtures. J. Chem. Soc. (London) Part I, 37–43.
van der Wal, M. J. (1934). Explosive and nonexplosive reactions between nitrogen oxides and flammablegases. Rec. trav. chim. 53, 97–117.
58
White, A. G. (1922). Limits for the propagation of flame at various temperatures in mixtures of ammoniawith air and oxygen. J. Chem. Soc. 121, 1688–1695.
Zabetakis, M. G. (1965). Flammability characteristics of combustible gases and vapors. Bulletin 627,Bureau of Mines.
59