Embed Size (px)
Citation preview

Port of Anchorage Fuel Terminal
Fire Hazard Calculations
100% Submittal Coffman Project #160201 25 April 2016
Fire Hazard Calculations Crowley Anchorage Fuel Terminal 100% Submittal 25 April 2016
2
Fire Hazard Calculations Table of Contents:
1. Summary ........................................................................................................................ 3
2. General Site Conditions .................................................................................................. 5
3. Fire Scenarios ................................................................................................................ 7
4. Heat Flux Hazard Thresholds ......................................................................................... 8
5. Computational Fluid Dynamics (CFD) Calculations ........................................................ 9
6. CFD Modeling Input Criteria ..........................................................................................13
7. Heat Flux based upon Shokri and Beyler (Shaped Based) Detailed Calculations ..........15
8. NIST Acceptable Separation Distance Calculations.......................................................16
Fire Hazard Calculations Crowley Anchorage Fuel Terminal 100% Submittal 25 April 2016
3
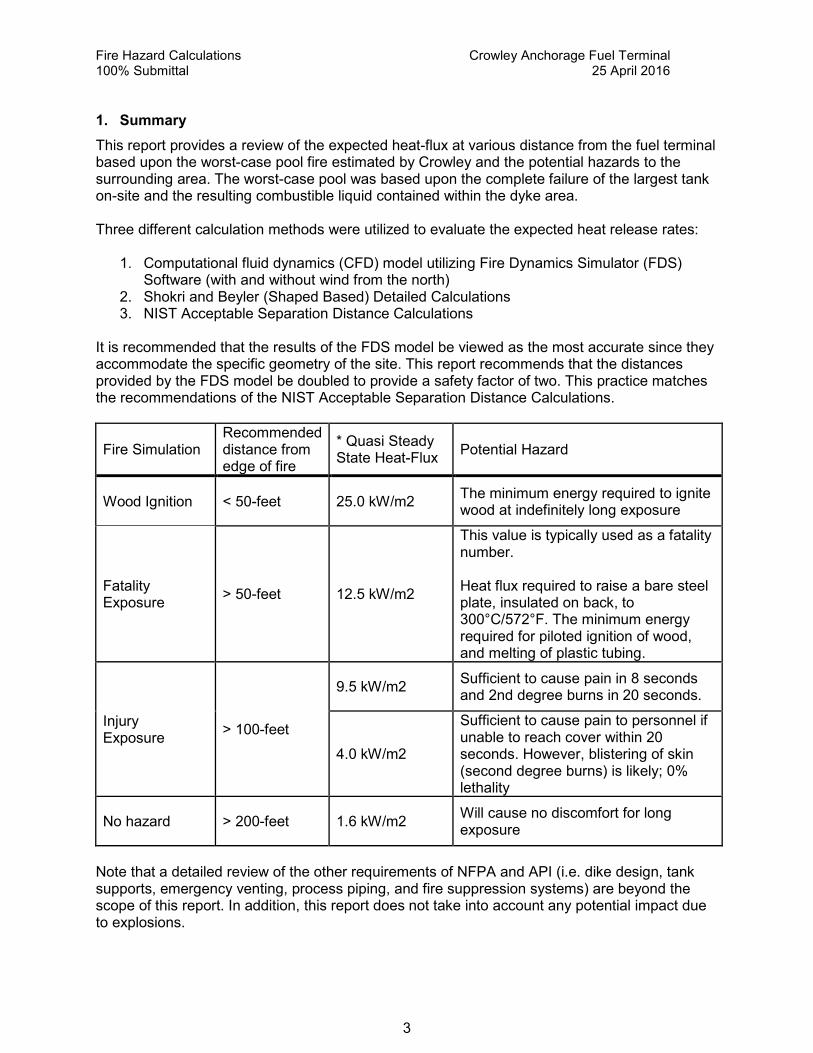
1. Summary
This report provides a review of the expected heat-flux at various distance from the fuel terminal based upon the worst-case pool fire estimated by Crowley and the potential hazards to the surrounding area. The worst-case pool was based upon the complete failure of the largest tank on-site and the resulting combustible liquid contained within the dyke area. Three different calculation methods were utilized to evaluate the expected heat release rates:
1. Computational fluid dynamics (CFD) model utilizing Fire Dynamics Simulator (FDS) Software (with and without wind from the north)
2. Shokri and Beyler (Shaped Based) Detailed Calculations 3. NIST Acceptable Separation Distance Calculations
It is recommended that the results of the FDS model be viewed as the most accurate since they accommodate the specific geometry of the site. This report recommends that the distances provided by the FDS model be doubled to provide a safety factor of two. This practice matches the recommendations of the NIST Acceptable Separation Distance Calculations.
Fire Simulation Recommended distance from edge of fire
* Quasi Steady State Heat-Flux
Potential Hazard
Wood Ignition < 50-feet 25.0 kW/m2 The minimum energy required to ignite wood at indefinitely long exposure
Fatality Exposure
> 50-feet 12.5 kW/m2
This value is typically used as a fatality number. Heat flux required to raise a bare steel plate, insulated on back, to 300°C/572°F. The minimum energy required for piloted ignition of wood, and melting of plastic tubing.
Injury Exposure
> 100-feet
9.5 kW/m2 Sufficient to cause pain in 8 seconds and 2nd degree burns in 20 seconds.
4.0 kW/m2
Sufficient to cause pain to personnel if unable to reach cover within 20 seconds. However, blistering of skin (second degree burns) is likely; 0% lethality
No hazard > 200-feet 1.6 kW/m2 Will cause no discomfort for long exposure
Note that a detailed review of the other requirements of NFPA and API (i.e. dike design, tank supports, emergency venting, process piping, and fire suppression systems) are beyond the scope of this report. In addition, this report does not take into account any potential impact due to explosions.

Fire Hazard Calculations Crowley Anchorage Fuel Terminal 100% Submittal 25 April 2016
4
Figure 1 - Simplified hazard zone map based upon FDS model with 2x safety factor
Fire Hazard Calculations Crowley Anchorage Fuel Terminal 100% Submittal 25 April 2016
5
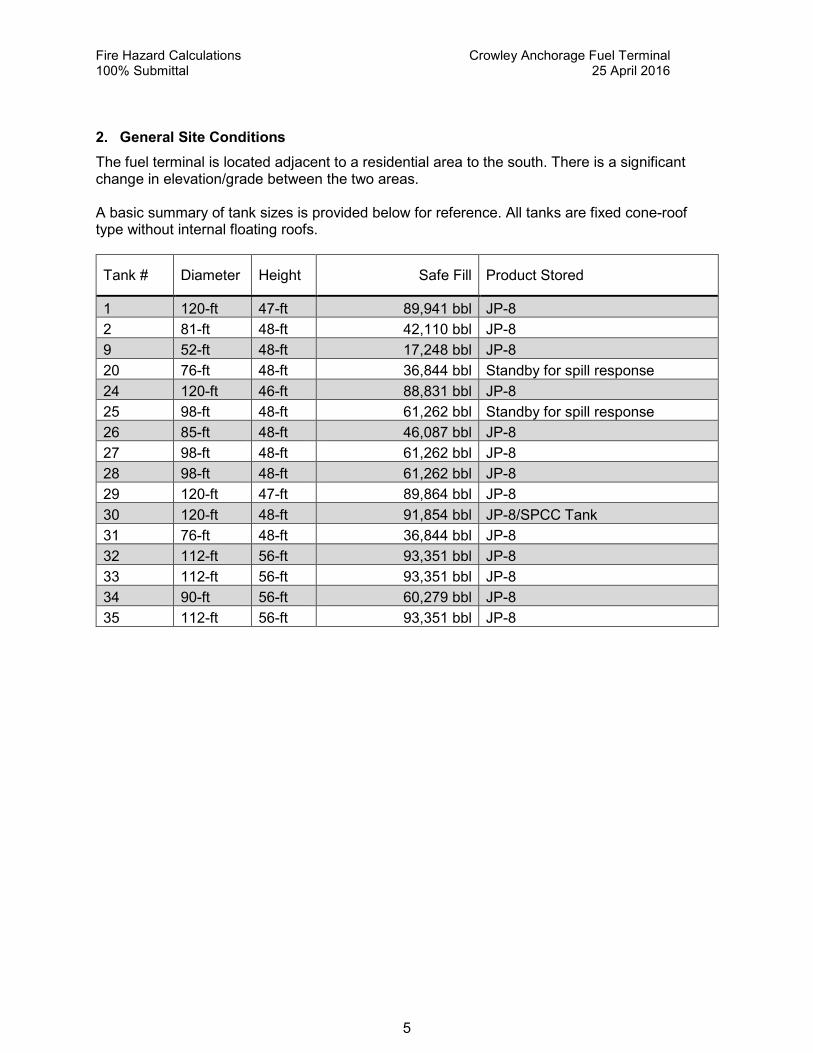
2. General Site Conditions
The fuel terminal is located adjacent to a residential area to the south. There is a significant change in elevation/grade between the two areas. A basic summary of tank sizes is provided below for reference. All tanks are fixed cone-roof type without internal floating roofs.
Tank # Diameter Height Safe Fill Product Stored
1 120-ft 47-ft 89,941 bbl JP-8
2 81-ft 48-ft 42,110 bbl JP-8
9 52-ft 48-ft 17,248 bbl JP-8
20 76-ft 48-ft 36,844 bbl Standby for spill response
24 120-ft 46-ft 88,831 bbl JP-8
25 98-ft 48-ft 61,262 bbl Standby for spill response
26 85-ft 48-ft 46,087 bbl JP-8
27 98-ft 48-ft 61,262 bbl JP-8
28 98-ft 48-ft 61,262 bbl JP-8
29 120-ft 47-ft 89,864 bbl JP-8
30 120-ft 48-ft 91,854 bbl JP-8/SPCC Tank
31 76-ft 48-ft 36,844 bbl JP-8
32 112-ft 56-ft 93,351 bbl JP-8
33 112-ft 56-ft 93,351 bbl JP-8
34 90-ft 56-ft 60,279 bbl JP-8
35 112-ft 56-ft 93,351 bbl JP-8

Fire Hazard Calculations Crowley Anchorage Fuel Terminal 100% Submittal 25 April 2016
6
Figure 2 – Reference site plan. Green line is top of containment wall/berm. Red line is the outline of the expected liquid level from the complete failure of a single tank (image from an
Enterprise Engineering report)

Fire Hazard Calculations Crowley Anchorage Fuel Terminal 100% Submittal 25 April 2016
7
2.1. NFPA 30 - Prescriptive Tank Shell-to-Shell Spacing
The sole product being stored is JP-8. Since it has a flash point above 100°F (37.8°C), the product is defined as a Class II Combustible liquid per NFPA 30-2015. NFPA 30-2015 Table 22.4.2.1 provides prescriptive recommendations for tank spacing as summarized below.
Table 22.4.2.1 Minimum Shell-to-Shell Spacing of Aboveground Storage Tanks
Tank Type Fixed Tank - Class II Liquids
All tanks not over 150-ft in diameter 1/6 x sum of adjacent tank diameters but not less than 3-ft
Based upon a review of the civil drawings, the existing tank layout meets these minimum requirements. 2.2. Active Fire Suppression Systems
All tanks are currently protected by a manually operated 3% AFFF foam-water system applied over the entire interior surface of the tank. The system is “fixed” and does not require any mobile equipment to be manually connected prior to delivering foam to the tanks. The quantity of on-site foam-concentrate storage is approximately 2,200 gallons. 1,100 gallons of this foam is stored in barrels as backup. 1,100 gallons provides sufficient delivery time to comply with NFPA requirements. 3. Fire Scenarios
For these fixed cone-roof tanks without internal floating roof, the worst-case fire scenarios considered was the complete failure of the single largest tank and the resulting combustible liquid within the containment area. Ignition of the spill would subsequently result in the pool fire considered in this report. It should be noted that any accidental discharge in the diked area would be expected to be immediately noticed and the total volume of spill is expected to much less than the total volume of a tank. While not reviewed by this report, the consideration of a potential tank-top fire is a typical second fire scenario. A tank-top fire would be much smaller in size and therefore the containment area pool fire covered by this report is the worst-case condition. In addition the site has fixed foam suppression on all tanks and with prompt response by personnel, a tank-top fire should be contained to a small fire.
Figure 3 - Expected pool size due to a 105,300 Barrel Spill (image from an Enterprise Engineering report)

Fire Hazard Calculations Crowley Anchorage Fuel Terminal 100% Submittal 25 April 2016
8
4. Heat Flux Hazard Thresholds
The key measurement in determining the potential hazard from a fire is the heat flux at the surface of adjacent materials/equipment. Heat flux is the rate of heat energy transfer through a given surface. The following thresholds provide general guidance on the impact of heat flux at various levels.
Heat Flux Potential Hazard
37.5 kW/m2 Sufficient to cause damage to process equipment and tanks (1)
32.0 kW/m2 Loss of strength of structural steel exposed to the fire to an extent that its primary load-bearing capacity is reduced significantly over the duration of LNG fire being analyzed. (3)
25.0 kW/m2 The minimum energy required to ignite wood at indefinitely long exposure (1)
12.5 kW/m2 Heat flux required to raise a bare steel plate, insulated on back, to 300°C/572°F. The minimum energy required for piloted ignition of wood, and melting of plastic tubing. This value is typically used as a fatality number. (1)
12.0 kW/m2 Additional cooling should be provided to prevent ignition (4)
9.5 kW/m2 Sufficient to cause pain in 8 seconds and 2nd degree burns in 20 seconds. (1)
8.0 kW/m2 Potential ignition of crude oil (4)
5.0 kW/m2
At least 10 persons would suffer second-degree skin burns on at least 10% of their bodies within 30 seconds of exposure to the fire. (3) At least on person inside the building would suffer second-degree burns on at least 10% of the body within 30 seconds of exposure to the fire. (3)
4.0 kW/m2 Sufficient to cause pain to personnel if unable to reach cover within 20 seconds. However, blistering of skin (second degree burns) is likely; 0% lethality (1)
1.7 kW/m2 No pain was shown, regardless of the exposure duration for thermal fluxes below 1.7 kW/m2 (2)
1.6 kW/m2 Will cause no discomfort for long exposure (1)
1.0 kW/m2 Approximate solar constant on a clear summer day
These numbers were obtained from the following sources:
(1) Guidelines for Chemical Process Quantitative Risk Analysis”, Second Edition, page 269, American Institute of Chemical Engineers Center for Chemical Process Safety (CCPS), 2000.
(2) SFPE Handbook, third edition, chapter 11 page 3-309 (3) NFPA 59A-2016 Table 15.8.4.1 “Radiant Heat Flux and Thermal Dosage Outside the
Plant Boundary” include the following recommendations: (4) BP, EI, Lastfire studies for crude oil (5) 49 CFR, Part 193 (Liquefied natural gas facilities: Federal Safety Standards) §193.2057
“Thermal radiation protection”.

Fire Hazard Calculations Crowley Anchorage Fuel Terminal 100% Submittal 25 April 2016
9
5. Computational Fluid Dynamics (CFD) Calculations
The CFD calculations in this report have been completed utilizing the Fire Dynamics Simulator (FDS) software, developed by the National Institute of Standards and Technology (NIST). The Fire Dynamics Simulator (FDS) is the most peer-reviewed and experientially verified software available. A CFD model provides the most realistic model as it accounts for wind (flame leaning), convective heat transfer, and detailed information on all sides/surfaces of the tanks. A summary of the worst-case heat-flux values measured along a north-south axis centered between tanks 32 and 33 are shown in the table below. Two models were run: one with no wind and one with a 16 mph wind from the north.
Figure 4 – Location of heat-flux measurement points (two separate views)
Distance from edge of source to target
Radiant Heat Flux with a 16 mph wind from the North*
Radiant Heat Flux with No Wind*
33 feet 7.80 kW/m2 5.73 kW/m2
66 feet 3.63 kW/m2 2.72 kW/m2
98 feet 1.96 kW/m2 1.56 kW/m2
131 feet 1.35 kW/m2 1.13 kW/m2
* All measurements are Quasi Steady State Heat-Flux averaged from 30 to 60 seconds after simulation has stabilized.
Thermocouples spaced along this axis at 10-meters on-center starting at the edge of the containment berm.

Fire Hazard Calculations Crowley Anchorage Fuel Terminal 100% Submittal 25 April 2016
10
Figure 5 – Visual of model entered into FDS
Figure 6 – Visual of smoke from FDS with 16 mph wind from the north

Fire Hazard Calculations Crowley Anchorage Fuel Terminal 100% Submittal 25 April 2016
11
Figure 7 – Overlay of radiant head flux from FDS and aerial photo with no wind
Note that due to the visual rendering this color presented are for horizontal surfaces only. Vertical surfaces experience higher heat fluxes due to the geometery. For display purposes all values over 12.50 kW/m2 are represented with the same color (e.g. heat fluxes greater than
12.5 kW/m2 are present).

Fire Hazard Calculations Crowley Anchorage Fuel Terminal 100% Submittal 25 April 2016
12
Figure 8 – Overlay of radiant head flux from FDS and aerial photo with 16 mph wind
Note that due to the visual rendering this color presented are for horizontal surfaces only. Vertical surfaces experience higher heat fluxes due to the geometery. For display purposes all values over 12.50 kW/m2 are represented with the same color (e.g. heat fluxes greater than
12.5 kW/m2 are present).

Fire Hazard Calculations Crowley Anchorage Fuel Terminal 100% Submittal 25 April 2016
13
6. CFD Modeling Input Criteria
6.1. Atmospheric Wind Speeds and Direction
Historical wind data was reviewed for the project site and incorporated into the model. Wind direction varies significantly depending upon the season. The worst-case condition of a prevailing wind from the North blowing at 16 mph (7.15 m/s) towards the residential area was used in the CFD model based upon conservative historical data for the area.
https://weatherspark.com/averages/33017/Anchorage-Alaska-United-States

Fire Hazard Calculations Crowley Anchorage Fuel Terminal 100% Submittal 25 April 2016
14
6.2. Heat Release Rate per Area (HRRPUA) of JP-8
The heat release rate of a fire is the best measure of its potential to do harm. This section provides backup reference for the source of data used in the model and any experimental data to validate the results. JP-8 is a Kerosene based jet propellant. As such where detailed chemical / thermal proprieties were not available, those from Kerosene were applied. For our specific model, the speed at which the fire will ramp-up or how long it will burn does not matter in this evaluation as we are only interested in the worst-case heat-flux expected adjacent to the fuel terminal. It should also be noted that the analysis of hazardous liquid fires is relatively independent of the type of liquid; burning rates and heat release rates do not vary significantly from fuel to fuel, nor does the nature of the fire. As such if in the future the type of fuel is slightly different than that modeled, there is limited impact on the calculation results. Extensive large-scale open pool fire experiments utilizing JP-8 were conducted by Sandia National Laboratories (SNL) around 2008 (Blanchat, T. and Figueroa, V., 2008. Large-Scale Open Pool Experimental Data and Analysis for Fire Model Validation and Development. Fire Safety Science 9: 105-115. doi:10.3801/IAFSS.FSS.9-105). The results of this testing have been utilized as inputs for the modeling of the pool fire. The SNL testing included am 8-meter diameter pool fire with a 5.76 m/s wind speed that resulted in a Pool Surface Heat Flux of 97 kW/M2. Numerous other NIST tests of large scale pool fires have an average surface heat flux of 100 kW/m2. Our model is utilized the 97 kW/M2 number. From the NIST report “Thermal Radiation from Large Pool Fires” a steady-state HRRPUA (q”f) value of 1,700 kW/m2 was utilized in the CFD model.

Fire Hazard Calculations Crowley Anchorage Fuel Terminal 100% Submittal 25 April 2016
15
6.3. Mesh Size
The entire model has dimensions of X:305-m [1,000-Feet], Y:470-m [1,542-Feet], Z:160-m [525-Feet]. The model will be divided up into 2,099,520 cells with an approximate cubic dimension of 2.2-meters (7.22-feet). A mesh sensitivity study was conducted with smaller mesh sizes, but had no appreciable differences in results were noted beyond this size. The cell size (dx) for a given simulation can be related to the characteristic fire diameter (D*), i.e., the smaller the characteristic fire diameter, the smaller the cell size should be in order to adequately resolve the fluid flow and fire dynamics. A reference within the FDS User Guide (Verification and Validation of Selected Fire Models for Nuclear Power Plant Applications. NUREG 1824, United States Nuclear Regulatory Commission, 2007) used a D*/dx ratio between 4 and 16 to accurately resolve fires in various scenarios. From the FDS User Guide: “These values were used to adequately resolve plume dynamics, along with other geometrical characteristics of the models as well. This range does not indicate what values to use for all models, only what values worked well for that particular set of models.” The 2.2-meter cell size correlates to a D*/dx ratio of 16. 6.4. Simulation Duration
As the FDS model essentially has no ramp up time for the fire, the model only needs to be run until the heat flux has quasi stabilized. Based upon several different simulations, the analysis only needed to be run for at least 30 seconds before becoming quasi steady state. A total simulation time of 60-seconds was used to be conservative. 7. Heat Flux based upon Shokri and Beyler (Shaped Based) Detailed Calculations
As a validation check of the outputs from the CFD model, a traditional “shape based” source heat flux calculation was performed based upon the Shokri and Beyler detailed method. This type of calculation is algebraic in nature and ignores convection. Known issues with this type of model area as follows:
1. Wind is not taken into consideration 2. Limited accuracy for pool fires over 50-meters in diameter because no experiments of
this size have been performed for validation. 3. Under estimates radiation to near-field targets 4. Over estimates radiation to far-field targets
The output of the calculations for this specific site are summarized below:
Distance from edge of source to target
Estimated heat flux at target
33 feet 6.050 kW/m2
244 feet 1.6 kW/m2

Fire Hazard Calculations Crowley Anchorage Fuel Terminal 100% Submittal 25 April 2016
16
8. NIST Acceptable Separation Distance Calculations
Another guideline for determining the radiation from a fire comes from the Department of Housing and Urban Development (HUD) Regulation 24 CFR Part 51, Subpart C which is titled “Siting of HUD-Assisted Projects Near Hazardous Operations Handling Conventional Fuels or Chemicals of an Explosive or Flammable Nature”. Specifically paragraph 51.203 of this section states the following recommendations:
(a) Thermal Radiation Safety Standard – Projects shall be located so that: (1) The allowable thermal radiation flux level at the building shall not exceed 10,000 BTU/sq ft per hour [31.5 kWh/sq m] (2) The allowable thermal radiation flux level for outdoor, protected facilities or areas of congregation shall not exceed 450 BTU/sq ft per hour [1.4 kWh/sq m] These recommendations basically flow the same guidelines as noted in section 4 of this report. The recommended calculation method for the ASD comes from the National Institute of Standards and Technology (NIST) report from Nov 2000 “Thermal Radiation from Large Pool Fires”. A basic summary of the recommendations of this report is noted in the tables below. Note that these numbers are very conservative so as to provide a simplistic base line when doing an initial review of a site. It is estimated that these numbers have at least a two-times safety factor.
Simplified NIST Thermal Radiation from Large Pool Fires Table 1
Liquids Mass Burning Rate Kg/m2 / s
Heat of Combustion kJ/kg
HRR Per Unit Area kW/m2
ASD to Structures*
ASD to People*
Kerosene 0.039 43,200 1,700 15 meters 50 feet
400 meters 1312 feet
* The ASD noted is the distance beyond which the thermal radiation flux criteria is satisfied, regardless of fire size.
Calculated Radiant Heat Flux based upon NIST method
Estimated heat flux of source Distance from edge of source to target
Estimated heat flux at target
100 kW/m2 (no obstructions between source and target) H/D = 0.060
Beyond scope of equation 31.5 kW/m2
107 feet 12.5 kW/m2
498 feet 1.6 kW/m2
50 kW/m2 (substantial thermal barrier between source and target) H/D = 0.060
Beyond scope of equation 31.5 kW/m2
53 feet 12.5 kW/m2
296 feet 1.6 kW/m2

Crowley Anchorage Fuel Terminal Fire Hazard Study GHCC Review Comments/Reponses, September 2016
# Comment Response
1 Fire Dynamic Simulation (FDS)
1.a Radiant Heat Flux at burning pool edge -
Figure 2 shows a red line indicating the
expected liquid level, or pool size, from the
modeled tank failure. Why do the FDS
calculations show zero kW/m2 at the
southeastern edge of the pool fire under no
wind conditions (Figure 7) and many pockets
of zero kW/m2 with a 16 mph wind (Figure
8)?
Figures 7 and 8 are snapshots of the model at a
specific split-second of the model simulation
and the images are not averaged over any
amount of time. As such, they provide an easy
to understand visual of general heat-flux
location, but not necessarily average heat flux
anticipated.
To address the variation of the visual
representation, point measurement devices
have been utilized (referenced as
thermocouples for the purposes of this report).
The thermocouple data has been averaged over
30-seconds and better accommodates for the
volatility of the burning pool fire. Please
reference the table on page 9 of the report for
expected heat-flux values at different points
from the pool fire.
In regards, to the lack of heat flux in Figures 7
(no wind), there is the significant shielding by
tanks 2, 29, and 30 and therefore minimal heat-
flux in this corner (i.e. line-of-sight situation).
Also when the pool fire outline is converted to
“cubes” within the FDS model, there is some
accuracy lost due to mesh size (see section 6.3
of the report for further discussion). Since the
pool depth between tanks 2 and 29 is very
shallow, the model correlates this small area to
be ground and not the pool fire which also
reduces the heat-flux in this corner of the
model. The FDS thermocouple readings
located between tanks 33 and 32 are not
affected by this minimal reduction in pool fire
size.
In regards to the “blank” spots on Figure 8 (16
mph wind), this is a result of the significant
volatility of these pool fires and the specific
split-second time the snapshot was taken.
Crowley Anchorage Fuel Terminal Fire Hazard Study GHCC Review Comments/Reponses, September 2016
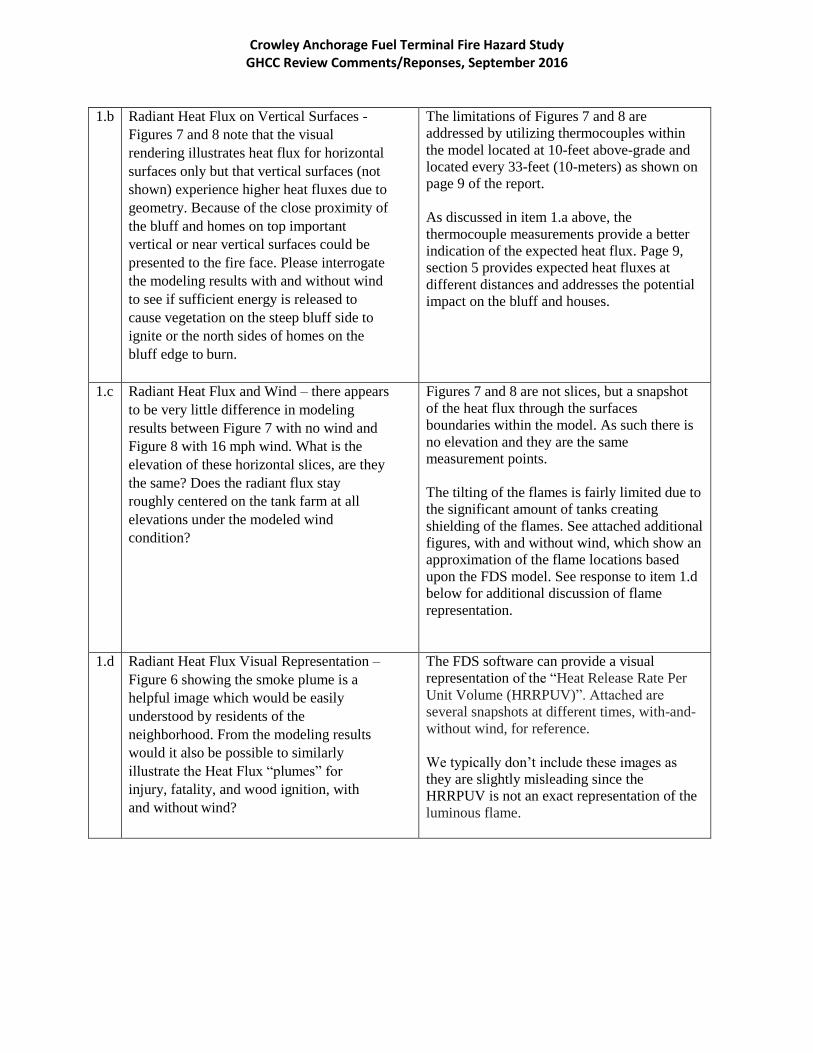
1.b Radiant Heat Flux on Vertical Surfaces -
Figures 7 and 8 note that the visual
rendering illustrates heat flux for horizontal
surfaces only but that vertical surfaces (not
shown) experience higher heat fluxes due to
geometry. Because of the close proximity of
the bluff and homes on top important
vertical or near vertical surfaces could be
presented to the fire face. Please interrogate
the modeling results with and without wind
to see if sufficient energy is released to
cause vegetation on the steep bluff side to
ignite or the north sides of homes on the
bluff edge to burn.
The limitations of Figures 7 and 8 are
addressed by utilizing thermocouples within
the model located at 10-feet above-grade and
located every 33-feet (10-meters) as shown on
page 9 of the report.
As discussed in item 1.a above, the
thermocouple measurements provide a better
indication of the expected heat flux. Page 9,
section 5 provides expected heat fluxes at
different distances and addresses the potential
impact on the bluff and houses.
1.c Radiant Heat Flux and Wind – there appears
to be very little difference in modeling
results between Figure 7 with no wind and
Figure 8 with 16 mph wind. What is the
elevation of these horizontal slices, are they
the same? Does the radiant flux stay
roughly centered on the tank farm at all
elevations under the modeled wind
condition?
Figures 7 and 8 are not slices, but a snapshot
of the heat flux through the surfaces
boundaries within the model. As such there is
no elevation and they are the same
measurement points.
The tilting of the flames is fairly limited due to
the significant amount of tanks creating
shielding of the flames. See attached additional
figures, with and without wind, which show an
approximation of the flame locations based
upon the FDS model. See response to item 1.d
below for additional discussion of flame
representation.
1.d Radiant Heat Flux Visual Representation –
Figure 6 showing the smoke plume is a
helpful image which would be easily
understood by residents of the
neighborhood. From the modeling results
would it also be possible to similarly
illustrate the Heat Flux “plumes” for
injury, fatality, and wood ignition, with
and without wind?
The FDS software can provide a visual
representation of the “Heat Release Rate Per
Unit Volume (HRRPUV)”. Attached are
several snapshots at different times, with-and-
without wind, for reference.
We typically don’t include these images as
they are slightly misleading since the
HRRPUV is not an exact representation of the
luminous flame.
Crowley Anchorage Fuel Terminal Fire Hazard Study GHCC Review Comments/Reponses, September 2016
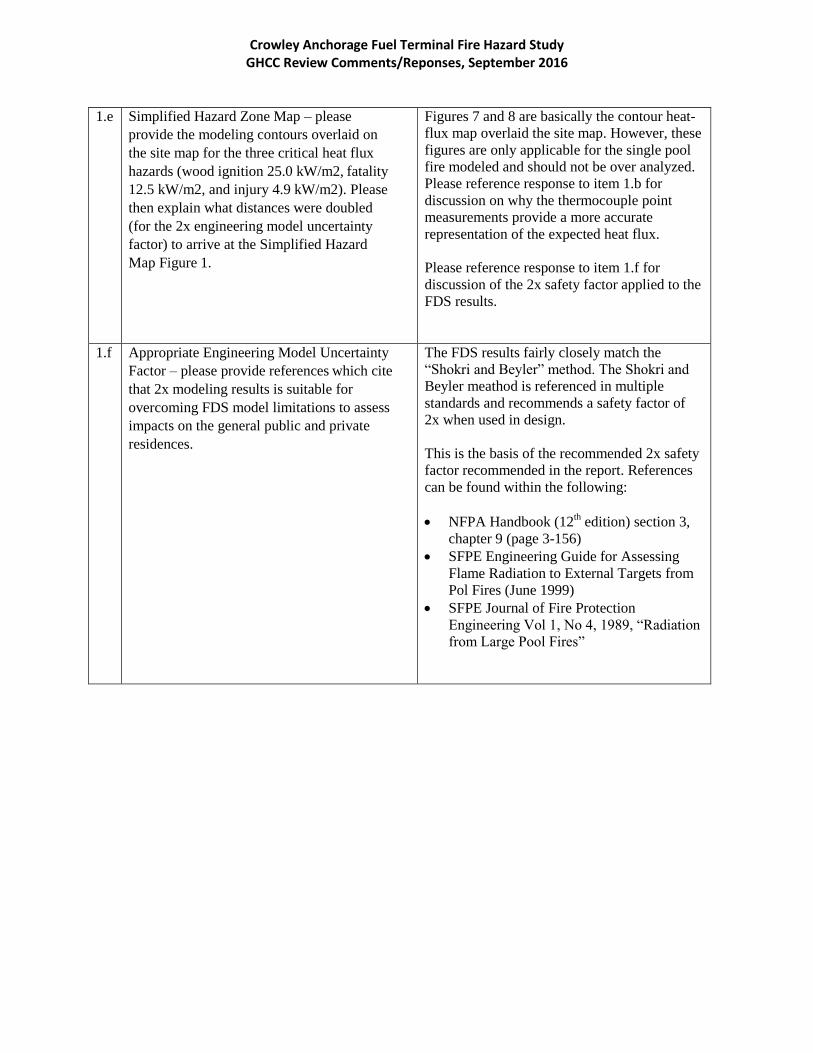
1.e Simplified Hazard Zone Map – please
provide the modeling contours overlaid on
the site map for the three critical heat flux
hazards (wood ignition 25.0 kW/m2, fatality
12.5 kW/m2, and injury 4.9 kW/m2). Please
then explain what distances were doubled
(for the 2x engineering model uncertainty
factor) to arrive at the Simplified Hazard
Map Figure 1.
Figures 7 and 8 are basically the contour heat-
flux map overlaid the site map. However, these
figures are only applicable for the single pool
fire modeled and should not be over analyzed.
Please reference response to item 1.b for
discussion on why the thermocouple point
measurements provide a more accurate
representation of the expected heat flux.
Please reference response to item 1.f for
discussion of the 2x safety factor applied to the
FDS results.
1.f Appropriate Engineering Model Uncertainty
Factor – please provide references which cite
that 2x modeling results is suitable for
overcoming FDS model limitations to assess
impacts on the general public and private
residences.
The FDS results fairly closely match the
“Shokri and Beyler” method. The Shokri and
Beyler meathod is referenced in multiple
standards and recommends a safety factor of
2x when used in design.
This is the basis of the recommended 2x safety
factor recommended in the report. References
can be found within the following:
NFPA Handbook (12th edition) section 3,
chapter 9 (page 3-156)
SFPE Engineering Guide for Assessing
Flame Radiation to External Targets from
Pol Fires (June 1999)
SFPE Journal of Fire Protection
Engineering Vol 1, No 4, 1989, “Radiation
from Large Pool Fires”
Crowley Anchorage Fuel Terminal Fire Hazard Study GHCC Review Comments/Reponses, September 2016
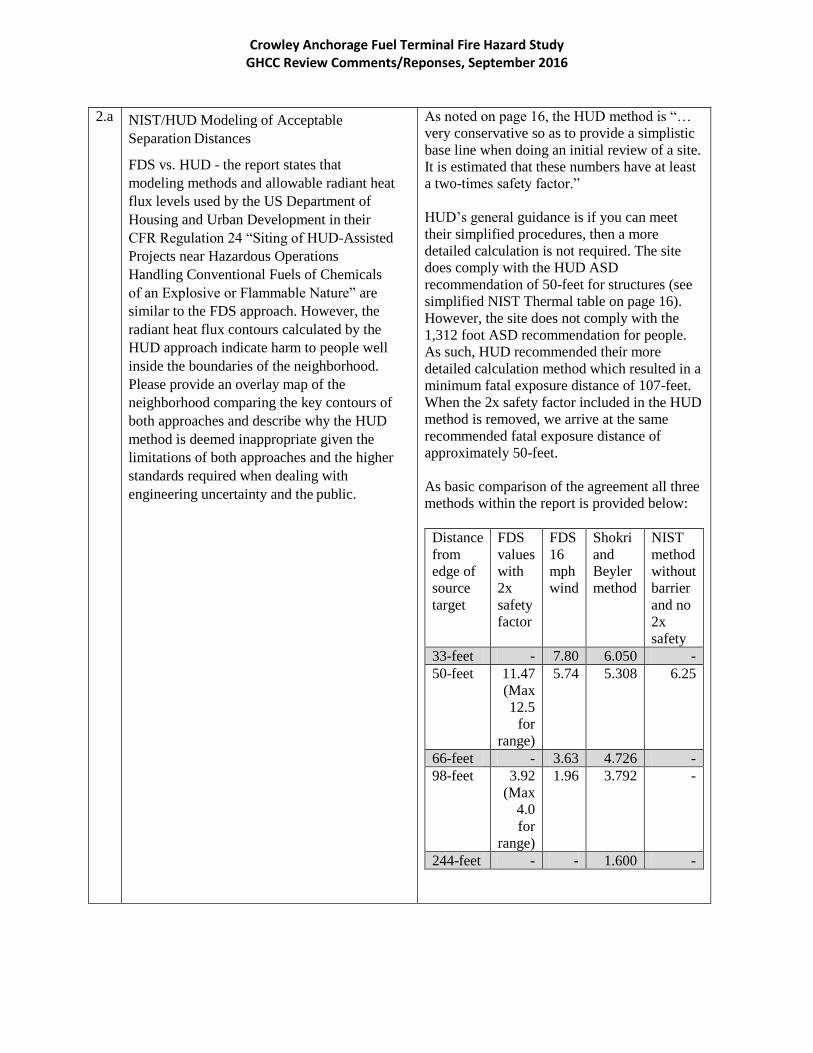
2.a NIST/HUD Modeling of Acceptable
Separation Distances
FDS vs. HUD - the report states that
modeling methods and allowable radiant heat
flux levels used by the US Department of
Housing and Urban Development in their
CFR Regulation 24 “Siting of HUD-Assisted
Projects near Hazardous Operations
Handling Conventional Fuels of Chemicals
of an Explosive or Flammable Nature” are
similar to the FDS approach. However, the
radiant heat flux contours calculated by the
HUD approach indicate harm to people well
inside the boundaries of the neighborhood.
Please provide an overlay map of the
neighborhood comparing the key contours of
both approaches and describe why the HUD
method is deemed inappropriate given the
limitations of both approaches and the higher
standards required when dealing with
engineering uncertainty and the public.
As noted on page 16, the HUD method is “…
very conservative so as to provide a simplistic
base line when doing an initial review of a site.
It is estimated that these numbers have at least
a two-times safety factor.”
HUD’s general guidance is if you can meet
their simplified procedures, then a more
detailed calculation is not required. The site
does comply with the HUD ASD
recommendation of 50-feet for structures (see
simplified NIST Thermal table on page 16).
However, the site does not comply with the
1,312 foot ASD recommendation for people.
As such, HUD recommended their more
detailed calculation method which resulted in a
minimum fatal exposure distance of 107-feet.
When the 2x safety factor included in the HUD
method is removed, we arrive at the same
recommended fatal exposure distance of
approximately 50-feet.
As basic comparison of the agreement all three
methods within the report is provided below:
Distance
from
edge of
source
target
FDS
values
with
2x
safety
factor
FDS
16
mph
wind
Shokri
and
Beyler
method
NIST
method
without
barrier
and no
2x
safety
33-feet - 7.80 6.050 -
50-feet 11.47
(Max
12.5
for
range)
5.74 5.308 6.25
66-feet - 3.63 4.726 -
98-feet 3.92
(Max
4.0
for
range)
1.96 3.792 -
244-feet - - 1.600 -

Crowley Anchorage Fuel Terminal Fire Hazard Study GHCC Review Comments/Reponses, September 2016
3.a Fuel type
JP8 vs. Gasoline, etc. – the report states that,
"the analysis of hazardous liquid fires is
relatively independent of the type of liquid"
and, "if in the future the type of fuel is
slightly different than that modeled, there is
limited impact on calculation results". The
modeling was done for jet fuel JP8
(kerosene). Specifically, would gasoline,
naphtha or any other flammable liquid
product stored in bulk by any other operator at
the Anchorage port tank farms result in a
more adverse impact on the neighborhood
(i.e. anything with characteristics more than
slightly different from JP8)?
This statement matches the findings from the
NIST “Thermal Radiation from Large Pool
Fires” report. As the burning rates and heat-
release rates do not vary significantly, the
models provided can be used for a variety of
products. As quick summary of the burning
rates and heat-release rates for a couple sample
products is provided below:
Material
Burning
Rate
kg/m2/s
Heat-
Release
rate
kW/m2
JP-4 0.051 2,200
JP-5 0.054 2,300
Gasoline 0.055 2,400
4 Fire Suppression
4.a Required Foam Quantity – what is the
surface area of the modeled pool fire? How
much foam concentrate is required to
suppress a pool fire of that size and shape?
If the first foam suppression effort fails,
how much foam concentrate remains for a
second attempt.
The approximate surface area of the worst-case
pool evaluated was approximately 124,560 sq
ft. This was based upon a pool fire due to
complete failure of the largest single tank
within the containment area.
The exact amount of foam-concentrate
required to suppress a fire of this size is
difficult to establish absolutely based upon
historical fire scenarios. The goal should be to
contain vs. suppress if the fire reached the size
to cover almost the entire site.
2,200 gallons of foam is stored on-site for the
purposes of suppressing any tank-top fire
scenario with a safety factor of at least two.
4.b Required Fire Water Rate – what is the rate
of water required to be mixed with the foam
concentrate to suppress the modeled pool
fire? What is the delivery rate of the fire
hydrants adjacent to the site? If there is not
enough water supply from the municipal
system (this was a finding of the
conflagration desktop drill) what is the
backup plan? Is the backup plan codified
with formal Inter-Governmental, Inter-
Agency, or Government-Industry
agreements?
The city hydrants in this area can provide
roughly 3,000 gpm in this area.
As noted above, a complete pool fire due to
complete failure of the largest single tank will
be a containment plan and not a suppression
plan.
The worst-case tank combined foam-water
flow rate of 1016 gpm is required for tank-top
fire at tank 32 based upon as-builts. We would
also assume two individual monitors flowing
750 gpm each (1,500 gpm total) for cooling of
exposed tanks for individual tank fires.
Combined this is a flow rate of 2,516 gpm at
the available water supply is adequate for these
type of fire.

Crowley Anchorage Fuel Terminal Fire Hazard Study GHCC Review Comments/Reponses, September 2016
5 Risk Mitigation Measures
5a. The original Hazard Study indicated the
importance of risk mitigation measures as
the key barrier to adverse consequences on
the neighborhood. Listed in Table 5.2 are
the 118 risk mitigation measures identified.
It was also noted that keeping up to date on
industry standards and best practices will
insure the safest possible operation.
Assurance of Regular Monitoring – what is
Crowley’s plan for periodically updating
compliance with Table 5.2 and reporting
status to the Community Council?
Crowley’s management system includes
regular on-going facility inspections to assure
compliance with regulatory requirements,
industry best practice and safety. As part of the
current expansion project at the Terminal we
are eliminating all underground pipelines.
Crowley keeps the GHCC informed and up to
date with activities at the Terminal through
attendance at regularly held council meetings
and presentations/briefings as requested or
needed. Crowley can provide annual updates
to the GHCC reflecting operational integrity
and regulatory compliance.
5b. Continuous Improvement – what is
Crowley’s plan for maintaining pace with
the evolution of industry standards and the
acquisition and implementation of best
practices with regard to the identified
measures?
Crowley is affiliated with several national and
international industry organizations, including
the National Institute for Storage Tank
Management, the American Petroleum
Institute, and the International Facility
Maintenance Association. Through these
many professional connections Crowley takes
advantage of ongoing educational
opportunities, resources, and training seminars
about the operation, regulation, and
management of tank farm systems, industry
standards, and best practices.


![Public Input No. 8-NFPA 59A-2013 [ Global Input ] NOTE ... · 59A_PI_8_Held_Comment_59A-5_Hirschler_.pdf Held Comment 59A-5 ... Added new standards appropriate for use at LNG facilities,](https://img.dokumen.tips/doc/110x75/5b3271bc7f8b9a744a8ca2c9/public-input-no-8-nfpa-59a-2013-global-input-note-59api8heldcomment59a-5hirschlerpdf.jpg)

![First Revision No. 83-NFPA 59A-2014 [ Global Input ] Revision No. 83-NFPA 59A-2014 [ Global Input ] In every chapter, use full titles of referenced standards for first occurrence only](https://img.dokumen.tips/doc/110x75/5a9f4e9a7f8b9a89178c95e1/pdffirst-revision-no-83-nfpa-59a-2014-global-input-revision-no-83-nfpa-59a-2014.jpg)


![11, 1980...(NFPA] Standard 59A (1971 edition), as well as the other applicable requirements of Part 192. Subsequently, the 1972 edition of NFPA 59A was adopted (41 FR 13590).. In the](https://img.dokumen.tips/doc/110x75/60ac9f8c86d5a5085e6fcb37/11-1980-nfpa-standard-59a-1971-edition-as-well-as-the-other-applicable.jpg)

![First Revision No. 3-NFPA 497-2014 [ Chapter 2 ] · NFPA 59A, Standard for the Production, Storage, and Handling of Liquefied Natural Gas (LNG), 2009 2016 edition. NFPA 70](https://img.dokumen.tips/doc/110x75/5b0a749b7f8b9adc138c1fa7/first-revision-no-3-nfpa-497-2014-chapter-2-59a-standard-for-the-production.jpg)