Embed Size (px)
Citation preview

Health and Safety Executive
© Crown Copyright, HSE 2016 HSL: HSE’s Health and Safety Laboratory
IMPACT OF ALTERNATIVE DISPERSION MODEL VALIDATION METHODS:A Case Study on the LNG Model Validation Database using DRIFT
Simon Gant, Simon Coldrick, Graham Tickle and Harvey Tucker
Harmo-17 Conference, 9-12 May 2016
Budapest, Hungary
HSL: HSE’s Health and Safety Laboratory © Crown Copyright, HSE 2016 © Crown Copyright, HSE 2016
Contents
• Background
– Regulation of LNG facilities
– LNG Model Evaluation Protocol
– Maximum arc-wise concentrations
• Aims
• Methodology
• Results
• Conclusions
2

HSL: HSE’s Health and Safety Laboratory © Crown Copyright, HSE 2016 © Crown Copyright, HSE 2016
Regulation of LNG Facilities• US Federal Regulation 49 CFR 193 on Liquefied Natural Gas (LNG) facilities
• NFPA 59A (2001) “Standard for the Production, Storage, and Handling of LNG”
• Applicants required to calculate size of exclusion zones, based on vapour cloud dispersion distance to ½ Lower Flammability Limit (LFL) for design spills
• Approved dispersion models (until 2011): DEGADIS, FEM3A
• Alternative dispersion models approved by US Pipelines and Hazardous Materials Safety Administration (PHMSA) using the NFPA LNG Model Evaluation Protocol
3
© US DOT PHMSA

HSL: HSE’s Health and Safety Laboratory © Crown Copyright, HSE 2016 © Crown Copyright, HSE 2016
2007 LNG Model Evaluation Protocol (Ivings et al., 2007)
2008
2009
2010
2015
2016
LNG Model Validation Database, Version 11 (Coldrick et al., 2010)
LNG Model Validation Database (Coldrick et al., 2008)
Review of LNG Source Models (Webber et al., 2009)
LNG Model Validation Database, Version 12 (Stewart et al., 2016)
PHAST v6.6/6.7 Evaluation (PHMSA, 2011)
2011PHMSA Advisory Bulletin PHMSA-2010-0226
DEGADIS 2.1 Evaluation (FERC, 2011)2012
2013
2014
FLACS v9.1r2 Evaluation (PHMSA, 2011)
4
LNG Model Evaluation Protocol

HSL: HSE’s Health and Safety Laboratory © Crown Copyright, HSE 2016 © Crown Copyright, HSE 2016
LNG Model Validation Database
5
HSL: HSE’s Health and Safety Laboratory © Crown Copyright, HSE 2016 © Crown Copyright, HSE 2016
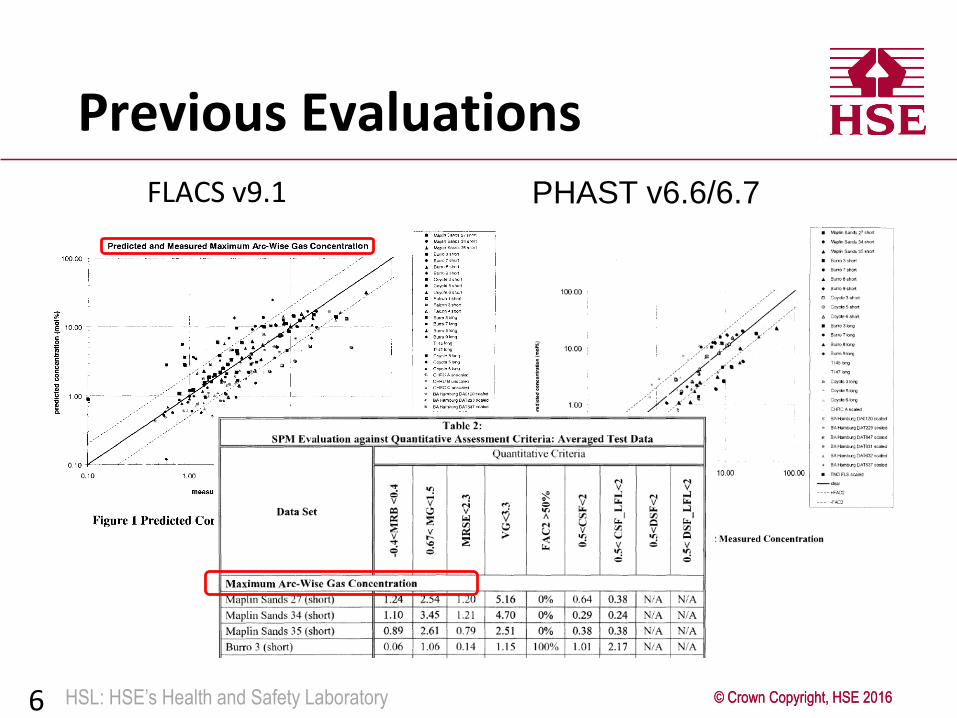
Previous EvaluationsFLACS v9.1
6
PHAST v6.6/6.7

HSL: HSE’s Health and Safety Laboratory © Crown Copyright, HSE 2016
Experiments
Measured maximum arc-wise concentration
7
Example: Burro 8 sensors on arc at distance of 57 m
Maximum Arc-Wise Concentration
Gas source
Sensors
Meandering

HSL: HSE’s Health and Safety Laboratory © Crown Copyright, HSE 2016
Experiments
Measured maximum arc-wise concentration
8
Maximum Arc-Wise ConcentrationPredicted maximum arc-wise concentration
Model: Method 1
Cloud centreline
Maximum concentration at any circumferential position and at any height

HSL: HSE’s Health and Safety Laboratory © Crown Copyright, HSE 2016
Model: Method 2Experiments
Measured maximum arc-wise concentration
9
Maximum Arc-Wise ConcentrationPredicted maximum arc-wise concentration
Cloud centreline
Maximum concentration at any circumferential position and at height of lowest sensors

HSL: HSE’s Health and Safety Laboratory © Crown Copyright, HSE 2016 10
Maximum Arc-Wise Concentration
PHMSA-2010-0226 Advisory Bulletin “The maximum arc wise concentration should be based on the location of the experimental sensor data that produced the maximum arc wise concentration relative to the cloud centerline”
Experiments
Measured maximum arc-wise concentration
Predicted maximum arc-wise concentration
Model: Method 3
Maximum at any of the sensor positions
HSL: HSE’s Health and Safety Laboratory © Crown Copyright, HSE 2016 © Crown Copyright, HSE 2016
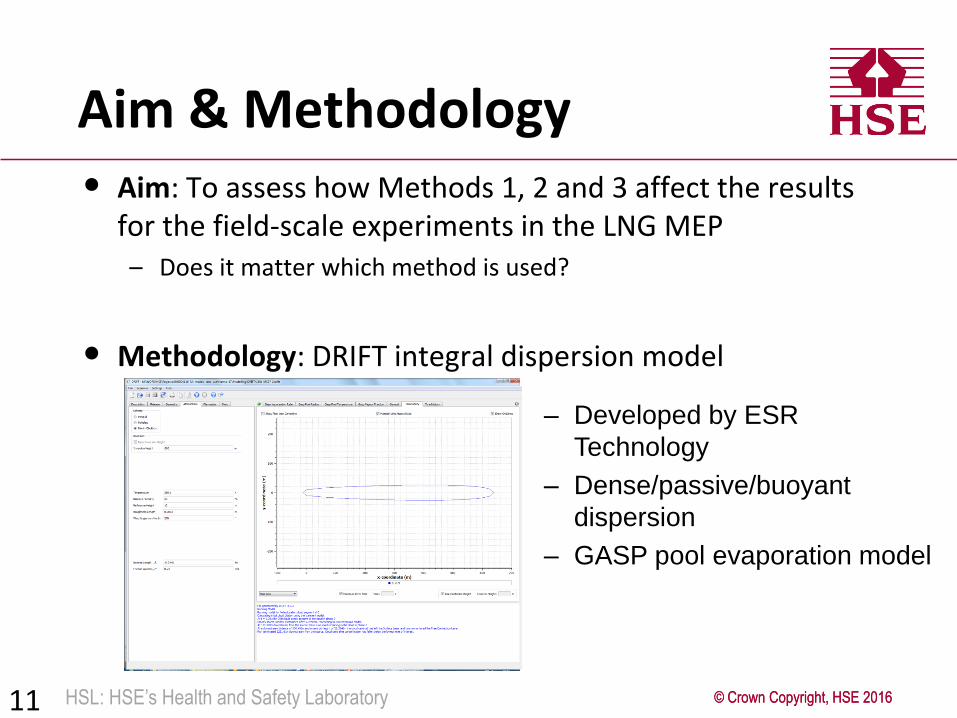
Aim & Methodology• Aim: To assess how Methods 1, 2 and 3 affect the results
for the field-scale experiments in the LNG MEP– Does it matter which method is used?
• Methodology: DRIFT integral dispersion model
11
– Developed by ESR
Technology
– Dense/passive/buoyant
dispersion
– GASP pool evaporation model

HSL: HSE’s Health and Safety Laboratory © Crown Copyright, HSE 2016 © Crown Copyright, HSE 2016
Plume Meander (Method 3a)
12
Experiments
Measured maximum arc-wise concentration
Model: Method 3a
Predicted maximum arc-wise concentration

HSL: HSE’s Health and Safety Laboratory © Crown Copyright, HSE 2016 © Crown Copyright, HSE 2016
Results: Maplin Sands 27
13
Method 3: Max. at sensor positions
Method 3a: Wind meandering
Method 2: Max. at lowest sensor height
Method 1: Max. anywhere
From: Colenbrander, Evans and Puttock (1984), © Shell

HSL: HSE’s Health and Safety Laboratory © Crown Copyright, HSE 2016 © Crown Copyright, HSE 2016
Results: Coyote 6
14
© LLNL
Method 3: Max. at sensor positions
Method 3a: Wind meandering
Method 2: Max. at lowest sensor height
Method 1: Max. anywhere
HSL: HSE’s Health and Safety Laboratory © Crown Copyright, HSE 2016 © Crown Copyright, HSE 2016
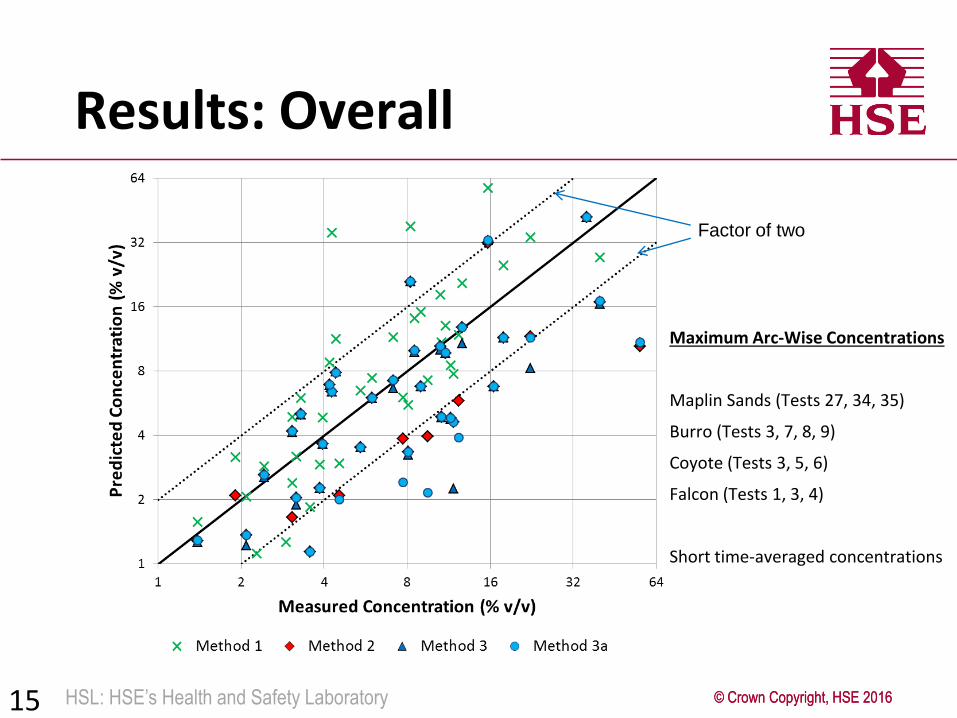
Results: Overall
15
Maximum Arc-Wise Concentrations
Maplin Sands (Tests 27, 34, 35)
Burro (Tests 3, 7, 8, 9)
Coyote (Tests 3, 5, 6)
Falcon (Tests 1, 3, 4)
Short time-averaged concentrations
Factor of two

HSL: HSE’s Health and Safety Laboratory © Crown Copyright, HSE 2016 © Crown Copyright, HSE 2016
Method 1 Method 2 Method 3 Method 3a
Mean Relative Bias, MRB
-0.21 0.31 0.59 0.41
Mean Relative Square Error, MRSE
0.34 0.38 1.1 0.59
Geometric Mean Bias, MG
0.79 1.4 6.6 1.9
GeometricVariance, VG
1.5 1.6 2e13 15
Factor of Two 78% 61% 54% 56%
Results: Overall
16
Method 3a
Method 1
Method 2
Over-prediction Under-prediction
𝑀𝑅𝐵 = 𝐶𝑚 − 𝐶𝑝
12 𝐶𝑝 + 𝐶𝑚
𝑀𝑅𝑆𝐸 = 𝐶𝑝 − 𝐶𝑚
2
14 𝐶𝑝 + 𝐶𝑚
2
𝑀𝐺 = 𝑒𝑥𝑝 ln𝐶𝑚
𝐶𝑝𝑉𝐺 = 𝑒𝑥𝑝 ln
𝐶𝑚
𝐶𝑝
2
𝐶𝑝 = predicted concentration𝐶𝑚 = measured concentration
Method 3
Method 1
Method 3a
“Acceptability” criteria
Method 2
HSL: HSE’s Health and Safety Laboratory © Crown Copyright, HSE 2016 © Crown Copyright, HSE 2016
Conclusions
• Choice of method for maximum arc-wise concentrations is important
• Depending on the choice of method, a model may be found to under/over-predict the measurements on average
• Method 3 (used by PHMSA) is more likely to indicate that a model under-predicts on average than other methods for max. arc-wise concentration
– This is a precautionary approach given uncertainties in ensemble mean concentrations (it will tend to make the ½ LFL exclusion zone larger)
– It accounts for the strong vertical gradient in concentration near the ground
– It accounts for sensors not being aligned to arcs in some experiments
– It encourages development of plume meandering models
• Further work is needed to investigate the plume meandering model in DRIFT and the sensitivity of results to the cloud height in the near-field
17

HSL: HSE’s Health and Safety Laboratory © Crown Copyright, HSE 2016 © Crown Copyright, HSE 2016
Acknowledgements
18
We would like to thank the following for their support in producing this work:
• Julie Halliday (PHMSA)
• Simon Rose (Oak Ridge National Laboratory)
• Andrew Kohout (Federal Energy Regulatory Commission)
• PHMSA
• Shell
• LLNL
This publication and the work it describes were funded by the Health and Safety Executive (HSE). Its contents, including any opinions and/or conclusions expressed, are those of the authors alone and do not necessarily reflect HSE policy.
For permission to use their material

HSL: HSE’s Health and Safety Laboratory © Crown Copyright, HSE 2016 © Crown Copyright, HSE 2016
References• Ivings M.J., Jagger S.F., Lea C.J. and Webber D.M. (2007) Evaluating vapor dispersion models for
safety analysis of LNG facilities, The Fire Protection Research Foundation, 9 May 2007.
– http://www.nfpa.org/research/fire-protection-research-foundation/projects-reports-and-proceedings/hazardous-materials/gases/evaluating-vapor-dispersion-models-for-safety-analysis
• Coldrick S., Lea C.J. and Ivings M.J. (2010) Validation database for evaluating vapour dispersion models for safety analysis of LNG facilities: Guide to the LNG Model Evaluation Database, Version 11.0, 17th May 2010.
– http://www.nfpa.org/~/media/files/research/research-foundation/research-foundation-reports/hazardous-materials/lng_database_guide.pdf?la=en
• Webber D.M., Gant S.E., Ivings M.J. and Jagger S.F. (2009) LNG source term models for hazard analysis, The Fire Protection Research Foundation. Also published as Research Report RR789, Health and Safety Executive (HSE), Bootle, UK
– http://www.hse.gov.uk/research/rrhtm/rr789.htm
• PHMSA Advisory Bulletin, docket PHMSA-2010-0226
– http://phmsa.dot.gov/pv_obj_cache/pv_obj_id_B1E12F1E74C27BEAB343DEB90D621DF5BB340700/filename/ADB-10-07%20LNG%20Facilities.pdf
• FERC evaluation of DEGADIS 2.1
– https://www.ferc.gov/industries/gas/indus-act/lng/degadis-report.pdf
• PHMSA evaluation of PHAST v6.6 and v6.7
– http://www.regulations.gov/#!docketDetail;D=PHMSA-2011-0075
• PHMSA evaluation of FLACS 9.1r2
– https://www.regulations.gov/#!docketDetail;D=PHMSA-2011-0101
19
![SIMULATING VENTED HYDROGEN DEFLAGRATIONS: IMPROVED ... · FLACS-Hydrogen is a subversion of the CFD tool FLACS [3] for hydrogen safety applications that was first developed in connection](https://img.dokumen.tips/doc/110x75/5ec22aa7e2f8335923103693/simulating-vented-hydrogen-deflagrations-improved-flacs-hydrogen-is-a-subversion.jpg)


![IOL Review and FLACS Update [Read-Only]€¦ · IOL Review and FLACS Update James Lee, M.D. Assistant Professor Texas Tech University Health Sciences Center Department of Ophthalmology](https://img.dokumen.tips/doc/110x75/5f0a8d907e708231d42c32be/iol-review-and-flacs-update-read-only-iol-review-and-flacs-update-james-lee-md.jpg)