Embed Size (px)
Citation preview

MARCH 10, 2017
Q4 2016
Financial information Restated

2 Q4 2016 FINANCIAL INFORMATION
—
Financial Information
3 Key Figures
8 Interim Consolidated Financial Information (unaudited)
8 Interim Consolidated Income Statements
9 Interim Condensed Consolidated Statements of
Comprehensive Income
10 Interim Consolidated Balance Sheets
11 Interim Consolidated Statements of Cash Flows
12 Interim Consolidated Statements of Changes in
Stockholders’ Equity
13 Notes to the Interim Consolidated Financial
Information
34 Supplemental Reconciliations and Definitions

3 Q4 2016 FINANCIAL INFORMATION
— FINANCIAL INFORMATION
Key Figures CHANGE
($ in millions, unless otherwise indicated) Q4 2016 Q4 2015 US$ Comparable(1)
restated restated restated
Orders 8,277 8,262 0% 3%
Order backlog (end December) 22,981 24,121 -5% -1%
Revenues 8,993 9,242 -3% 1%
Operational EBITA(1) 1,057 1,101 -4% -2%(2)
as % of operational revenues(1) 11.7% 11.9% -0.2 pts
Net income 425 204 108%
Basic earnings per share ($) 0.20 0.09 115%(3)
Operational earnings per share(1) ($) 0.33 0.35 -5%(3) -3%(3)
Cash flow from operating activities 1,428 1,994 -28%
CHANGE
($ in millions, unless otherwise indicated) FY 2016 FY 2015 US$ Comparable(1)
restated restated restated
Orders 33,379 36,429 -8% -5%
Revenues 33,828 35,481 -5% -1%
Operational EBITA(1) 4,191 4,209 0% 2%(2)
as % of operational revenues(1) 12.4% 11.9% +0.5 pts
Net income 1,899 1,933 -2%
Basic earnings per share ($) 0.88 0.87 2%(3)
Operational earnings per share(1) ($) 1.29 1.26 3%(3) 4%(3)
Cash flow from operating activities 3,843 3,818 1%
(1) For a reconciliation of non-GAAP measures see “Supplemental Reconciliations and Definitions” on page 34.
(2) Constant currency (not adjusted for portfolio changes).
(3) Earnings per share growth rates are computed using unrounded amounts. Comparable Operational earnings per share growth is in constant currency (2014 foreign
exchange rates and not adjusted for changes in the business portfolio).
4 Q4 2016 FINANCIAL INFORMATION
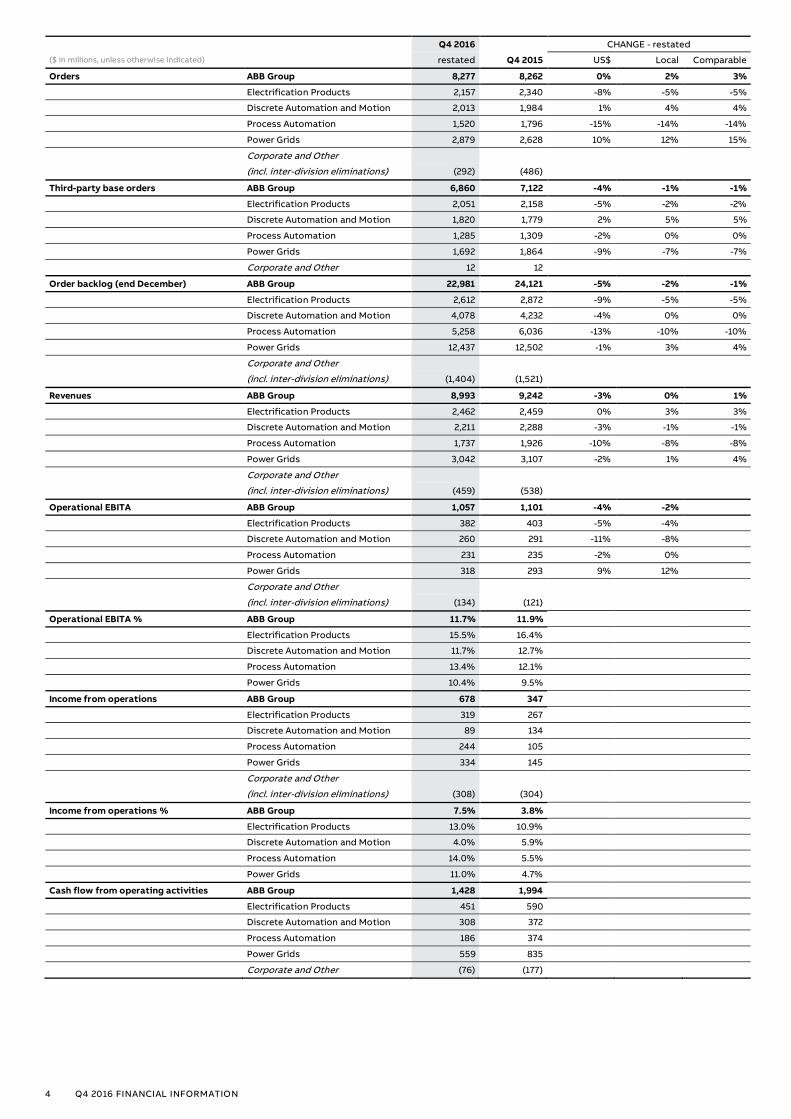
Q4 2016 CHANGE - restated
($ in millions, unless otherwise indicated) restated Q4 2015 US$ Local Comparable
Orders ABB Group 8,277 8,262 0% 2% 3%
Electrification Products 2,157 2,340 -8% -5% -5%
Discrete Automation and Motion 2,013 1,984 1% 4% 4%
Process Automation 1,520 1,796 -15% -14% -14%
Power Grids 2,879 2,628 10% 12% 15%
Corporate and Other
(incl. inter-division eliminations) (292) (486)
Third-party base orders ABB Group 6,860 7,122 -4% -1% -1%
Electrification Products 2,051 2,158 -5% -2% -2%
Discrete Automation and Motion 1,820 1,779 2% 5% 5%
Process Automation 1,285 1,309 -2% 0% 0%
Power Grids 1,692 1,864 -9% -7% -7%
Corporate and Other 12 12
Order backlog (end December) ABB Group 22,981 24,121 -5% -2% -1%
Electrification Products 2,612 2,872 -9% -5% -5%
Discrete Automation and Motion 4,078 4,232 -4% 0% 0%
Process Automation 5,258 6,036 -13% -10% -10%
Power Grids 12,437 12,502 -1% 3% 4%
Corporate and Other
(incl. inter-division eliminations) (1,404) (1,521)
Revenues ABB Group 8,993 9,242 -3% 0% 1%
Electrification Products 2,462 2,459 0% 3% 3%
Discrete Automation and Motion 2,211 2,288 -3% -1% -1%
Process Automation 1,737 1,926 -10% -8% -8%
Power Grids 3,042 3,107 -2% 1% 4%
Corporate and Other
(incl. inter-division eliminations) (459) (538)
Operational EBITA ABB Group 1,057 1,101 -4% -2%
Electrification Products 382 403 -5% -4%
Discrete Automation and Motion 260 291 -11% -8%
Process Automation 231 235 -2% 0%
Power Grids 318 293 9% 12%
Corporate and Other
(incl. inter-division eliminations) (134) (121)
Operational EBITA % ABB Group 11.7% 11.9%
Electrification Products 15.5% 16.4%
Discrete Automation and Motion 11.7% 12.7%
Process Automation 13.4% 12.1%
Power Grids 10.4% 9.5%
Income from operations ABB Group 678 347
Electrification Products 319 267
Discrete Automation and Motion 89 134
Process Automation 244 105
Power Grids 334 145
Corporate and Other
(incl. inter-division eliminations) (308) (304)
Income from operations % ABB Group 7.5% 3.8%
Electrification Products 13.0% 10.9%
Discrete Automation and Motion 4.0% 5.9%
Process Automation 14.0% 5.5%
Power Grids 11.0% 4.7%
Cash flow from operating activities ABB Group 1,428 1,994
Electrification Products 451 590
Discrete Automation and Motion 308 372
Process Automation 186 374
Power Grids 559 835
Corporate and Other (76) (177)

5 Q4 2016 FINANCIAL INFORMATION
FY 2016 CHANGE - restated
($ in millions, unless otherwise indicated) restated FY 2015 US$ Local Comparable
Orders ABB Group 33,379 36,429 -8% -5% -5%
Electrification Products 9,158 9,833 -7% -4% -4%
Discrete Automation and Motion 8,654 9,222 -6% -4% -4%
Process Automation 5,866 7,347 -20% -18% -18%
Power Grids 11,232 12,205 -8% -5% -4%
Corporate and Other
(incl. inter-division eliminations) (1,531) (2,178)
Third-party base orders ABB Group 28,887 30,302 -5% -2% -2%
Electrification Products 8,657 9,106 -5% -2% -2%
Discrete Automation and Motion 7,777 8,046 -3% -1% -1%
Process Automation 5,094 5,555 -8% -6% -6%
Power Grids 7,304 7,527 -3% 0% 0%
Corporate and Other 55 68
Order backlog (end December) ABB Group 22,981 24,121 -5% -2% -1%
Electrification Products 2,612 2,872 -9% -5% -5%
Discrete Automation and Motion 4,078 4,232 -4% 0% 0%
Process Automation 5,258 6,036 -13% -10% -10%
Power Grids 12,437 12,502 -1% 3% 4%
Corporate and Other
(incl. inter-division eliminations) (1,404) (1,521)
Revenues ABB Group 33,828 35,481 -5% -2% -1%
Electrification Products 9,292 9,547 -3% 1% 1%
Discrete Automation and Motion 8,714 9,127 -5% -2% -2%
Process Automation 6,598 7,224 -9% -6% -6%
Power Grids 10,975 11,621 -6% -3% 1%
Corporate and Other
(incl. inter-division eliminations) (1,751) (2,038)
Operational EBITA ABB Group 4,191 4,209 0% 2%
Electrification Products 1,528 1,561 -2% 0%
Discrete Automation and Motion 1,195 1,295 -8% -6%
Process Automation 824 863 -5% -2%
Power Grids 1,021 877 16% 19%
Corporate and Other
(incl. inter-division eliminations) (377) (387)
Operational EBITA % ABB Group 12.4% 11.9%
Electrification Products 16.4% 16.4%
Discrete Automation and Motion 13.7% 14.2%
Process Automation 12.4% 11.9%
Power Grids 9.3% 7.6%
Income from operations ABB Group 2,987 3,049
Electrification Products 1,335 1,356
Discrete Automation and Motion 831 991
Process Automation 696 685
Power Grids 888 613
Corporate and Other
(incl. inter-division eliminations) (763) (596)
Income from operations % ABB Group 8.8% 8.6%
Electrification Products 14.4% 14.2%
Discrete Automation and Motion 9.5% 10.9%
Process Automation 10.5% 9.5%
Power Grids 8.1% 5.3%
Cash flow from operating activities ABB Group 3,843 3,818
Electrification Products 1,221 1,364
Discrete Automation and Motion 1,002 1,206
Process Automation 728 690
Power Grids 1,120 970
Corporate and Other (228) (412)
6 Q4 2016 FINANCIAL INFORMATION
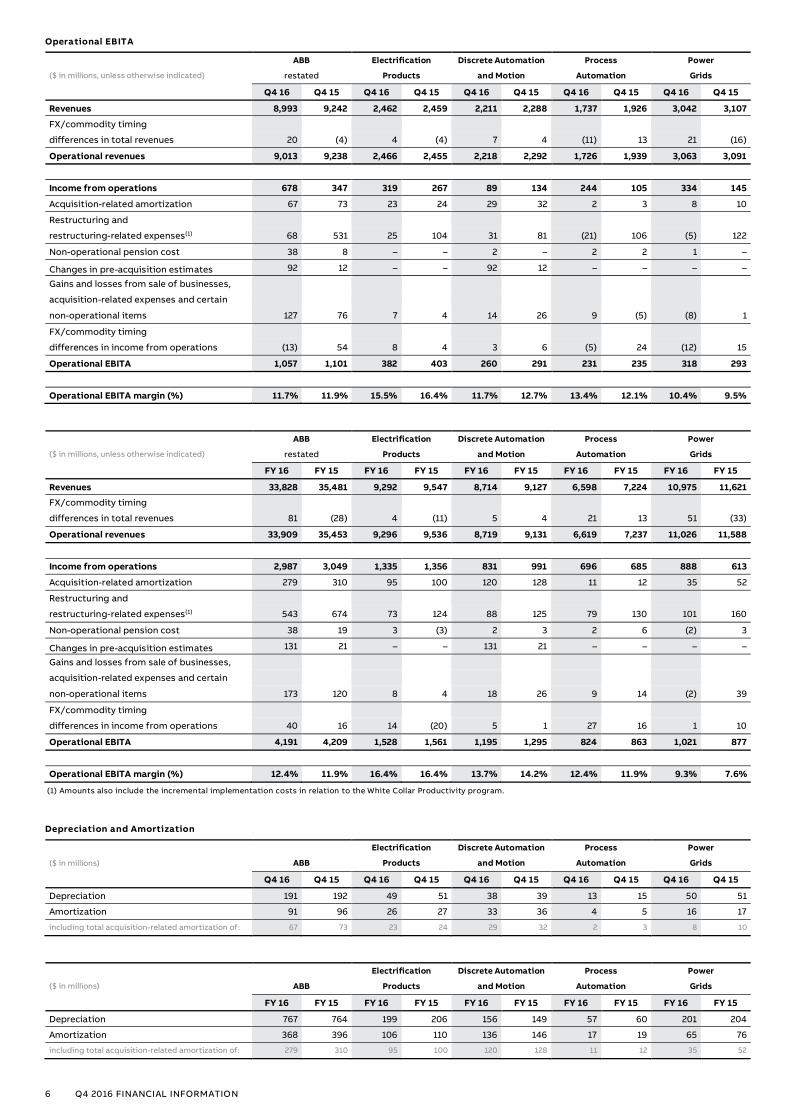
Operational EBITA
ABB Electrification Discrete Automation Process Power
($ in millions, unless otherwise indicated) restated Products and Motion Automation Grids
Q4 16 Q4 15 Q4 16 Q4 15 Q4 16 Q4 15 Q4 16 Q4 15 Q4 16 Q4 15
Revenues 8,993 9,242 2,462 2,459 2,211 2,288 1,737 1,926 3,042 3,107
FX/commodity timing
differences in total revenues 20 (4) 4 (4) 7 4 (11) 13 21 (16)
Operational revenues 9,013 9,238 2,466 2,455 2,218 2,292 1,726 1,939 3,063 3,091
Income from operations 678 347 319 267 89 134 244 105 334 145
Acquisition-related amortization 67 73 23 24 29 32 2 3 8 10
Restructuring and
restructuring-related expenses(1) 68 531 25 104 31 81 (21) 106 (5) 122
Non-operational pension cost 38 8 – – 2 – 2 2 1 –
Changes in pre-acquisition estimates 92 12 – – 92 12 – – – –
Gains and losses from sale of businesses,
acquisition-related expenses and certain
non-operational items 127 76 7 4 14 26 9 (5) (8) 1
FX/commodity timing
differences in income from operations (13) 54 8 4 3 6 (5) 24 (12) 15
Operational EBITA 1,057 1,101 382 403 260 291 231 235 318 293
Operational EBITA margin (%) 11.7% 11.9% 15.5% 16.4% 11.7% 12.7% 13.4% 12.1% 10.4% 9.5%
ABB Electrification Discrete Automation Process Power
($ in millions, unless otherwise indicated) restated Products and Motion Automation Grids
FY 16 FY 15 FY 16 FY 15 FY 16 FY 15 FY 16 FY 15 FY 16 FY 15
Revenues 33,828 35,481 9,292 9,547 8,714 9,127 6,598 7,224 10,975 11,621
FX/commodity timing
differences in total revenues 81 (28) 4 (11) 5 4 21 13 51 (33)
Operational revenues 33,909 35,453 9,296 9,536 8,719 9,131 6,619 7,237 11,026 11,588
Income from operations 2,987 3,049 1,335 1,356 831 991 696 685 888 613
Acquisition-related amortization 279 310 95 100 120 128 11 12 35 52
Restructuring and
restructuring-related expenses(1) 543 674 73 124 88 125 79 130 101 160
Non-operational pension cost 38 19 3 (3) 2 3 2 6 (2) 3
Changes in pre-acquisition estimates 131 21 – – 131 21 – – – –
Gains and losses from sale of businesses,
acquisition-related expenses and certain
non-operational items 173 120 8 4 18 26 9 14 (2) 39
FX/commodity timing
differences in income from operations 40 16 14 (20) 5 1 27 16 1 10
Operational EBITA 4,191 4,209 1,528 1,561 1,195 1,295 824 863 1,021 877
Operational EBITA margin (%) 12.4% 11.9% 16.4% 16.4% 13.7% 14.2% 12.4% 11.9% 9.3% 7.6%
(1) Amounts also include the incremental implementation costs in relation to the White Collar Productivity program.
Depreciation and Amortization
Electrification Discrete Automation Process Power
($ in millions) ABB Products and Motion Automation Grids
Q4 16 Q4 15 Q4 16 Q4 15 Q4 16 Q4 15 Q4 16 Q4 15 Q4 16 Q4 15
Depreciation 191 192 49 51 38 39 13 15 50 51
Amortization 91 96 26 27 33 36 4 5 16 17
including total acquisition-related amortization of: 67 73 23 24 29 32 2 3 8 10
Electrification Discrete Automation Process Power
($ in millions) ABB Products and Motion Automation Grids
FY 16 FY 15 FY 16 FY 15 FY 16 FY 15 FY 16 FY 15 FY 16 FY 15
Depreciation 767 764 199 206 156 149 57 60 201 204
Amortization 368 396 106 110 136 146 17 19 65 76
including total acquisition-related amortization of: 279 310 95 100 120 128 11 12 35 52

7 Q4 2016 FINANCIAL INFORMATION
Orders received and revenues by region
($ in millions, unless otherwise indicated) Orders received CHANGE Revenues CHANGE
Com- Com-
Q4 16 Q4 15 US$ Local parable Q4 16 Q4 15 US$ Local parable
Europe 2,529 2,888 -12% -10% -8% 3,016 3,028 0% 3% 6%
The Americas 2,487 2,491 0% 0% 0% 2,469 2,627 -6% -6% -6%
Asia, Middle East and Africa 3,261 2,883 13% 17% 17% 3,508 3,587 -2% 1% 2%
ABB Group 8,277 8,262 0% 2% 3% 8,993 9,242 -3% 0% 1%
($ in millions, unless otherwise indicated) Orders received CHANGE Revenues CHANGE
Com- Com-
FY 16 FY 15 US$ Local parable FY 16 FY 15 US$ Local parable
Europe 11,213 12,568 -11% -9% -8% 11,315 11,602 -2% 0% 4%
The Americas 9,351 10,505 -11% -9% -9% 9,741 10,554 -8% -5% -5%
Asia, Middle East and Africa 12,815 13,356 -4% 0% 0% 12,772 13,325 -4% -1% -1%
ABB Group 33,379 36,429 -8% -5% -5% 33,828 35,481 -5% -2% -1%

8 Q4 2016 FINANCIAL INFORMATION
— FINANCIAL INFORMATION
Interim Consolidated Financial Information
ABB Ltd Interim Consolidated Income Statements (unaudited) Year ended Three months ended
($ in millions, except per share data in $) Dec. 31, 2016 Dec. 31, 2015 Dec. 31, 2016 Dec. 31, 2015
restated restated
Sales of products 27,816 29,477 7,339 7,599
Sales of services and software 6,012 6,004 1,654 1,643
Total revenues 33,828 35,481 8,993 9,242
Cost of sales of products (20,431) (21,694) (5,451) (5,820)
Cost of services and software (3,650) (3,653) (1,027) (1,027)
Total cost of sales (24,081) (25,347) (6,478) (6,847)
Gross profit 9,747 10,134 2,515 2,395
Selling, general and administrative expenses (5,349) (5,574) (1,394) (1,580)
Non-order related research and development expenses (1,300) (1,406) (349) (408)
Other income (expense), net (111) (105) (94) (60)
Income from operations 2,987 3,049 678 347
Interest and dividend income 73 77 19 21
Interest and other finance expense (261) (286) (31) (63)
Income from continuing operations before taxes 2,799 2,840 666 305
Provision for taxes (781) (788) (194) (66)
Income from continuing operations, net of tax 2,018 2,052 472 239
Income from discontinued operations, net of tax 16 3 2 1
Net income 2,034 2,055 474 240
Net income attributable to noncontrolling interests (135) (122) (49) (36)
Net income attributable to ABB 1,899 1,933 425 204
Amounts attributable to ABB shareholders:
Income from continuing operations, net of tax 1,883 1,930 423 203
Net income 1,899 1,933 425 204
Basic earnings per share attributable to ABB shareholders:
Income from continuing operations, net of tax 0.88 0.87 0.20 0.09
Net income 0.88 0.87 0.20 0.09
Diluted earnings per share attributable to ABB shareholders:
Income from continuing operations, net of tax 0.87 0.87 0.20 0.09
Net income 0.88 0.87 0.20 0.09
Weighted-average number of shares outstanding (in millions) used to compute:
Basic earnings per share attributable to ABB shareholders 2,151 2,226 2,137 2,203
Diluted earnings per share attributable to ABB shareholders 2,154 2,230 2,141 2,206
See Notes to the Interim Consolidated Financial Information

9 Q4 2016 FINANCIAL INFORMATION
—
ABB Ltd Interim Condensed Consolidated Statements of Comprehensive
Income (unaudited) Year ended Three months ended
($ in millions) Dec. 31, 2016 Dec. 31, 2015 Dec. 31, 2016 Dec. 31, 2015
restated restated
Total comprehensive income (loss), net of tax 1,688 1,416 (79) 254
Total comprehensive income attributable to noncontrolling interests, net of tax (118) (100) (31) (27)
Total comprehensive income (loss) attributable to ABB shareholders, net of tax 1,570 1,316 (110) 227
See Notes to the Interim Consolidated Financial Information

10 Q4 2016 FINANCIAL INFORMATION
—
ABB Ltd Interim Consolidated Balance Sheets (unaudited)
($ in millions, except share data) Dec. 31, 2016 Dec. 31, 2015
restated
Cash and equivalents 3,644 4,565
Marketable securities and short-term investments 1,953 1,633
Receivables, net 9,696 10,061
Inventories, net 4,347 4,757
Prepaid expenses 176 225
Deferred taxes 888 881
Other current assets 688 638
Assets held for sale 548 –
Total current assets 21,940 22,760
Property, plant and equipment, net 4,743 5,276
Goodwill 9,501 9,671
Other intangible assets, net 1,996 2,337
Prepaid pension and other employee benefits 90 68
Investments in equity-accounted companies 170 178
Deferred taxes 527 423
Other non-current assets 532 643
Total assets 39,499 41,356
Accounts payable, trade 4,446 4,342
Billings in excess of sales 1,241 1,375
Short-term debt and current maturities of long-term debt 1,003 1,454
Advances from customers 1,398 1,598
Deferred taxes 258 249
Provisions for warranties 1,142 1,089
Other provisions 1,765 1,920
Other current liabilities 3,936 3,817
Liabilities held for sale 218 –
Total current liabilities 15,407 15,844
Long-term debt 5,800 5,985
Pension and other employee benefits 1,834 1,924
Deferred taxes 957 965
Other non-current liabilities 1,604 1,650
Total liabilities 25,602 26,368
Commitments and contingencies
Stockholders’ equity:
Capital stock and additional paid-in capital
(2,214,743,264 and 2,314,743,264 issued shares at December 31, 2016 and 2015, respectively) 216 1,444
Retained earnings 19,925 20,476
Accumulated other comprehensive loss (5,187) (4,858)
Treasury stock, at cost
(76,036,429 and 123,118,123 shares at December 31, 2016 and 2015, respectively) (1,559) (2,581)
Total ABB stockholders’ equity 13,395 14,481
Noncontrolling interests 502 507
Total stockholders’ equity 13,897 14,988
Total liabilities and stockholders’ equity 39,499 41,356
See Notes to the Interim Consolidated Financial Information

11 Q4 2016 FINANCIAL INFORMATION
—
ABB Ltd Interim Consolidated Statements of Cash Flows (unaudited) Year ended Three months ended
($ in millions) Dec. 31, 2016 Dec. 31, 2015 Dec. 31, 2016 Dec. 31, 2015
restated restated
Operating activities:
Net income 2,034 2,055 474 240
Adjustments to reconcile net income to net cash provided by operating activities:
Depreciation and amortization 1,135 1,160 282 288
Deferred taxes (147) (219) (39) (193)
Net loss (gain) from derivatives and foreign exchange 10 15 (48) 53
Net loss (gain) from sale of property, plant and equipment (38) (26) (5) (5)
Net loss (gain) from sale of businesses 10 20 – 1
Share-based payment arrangements 54 61 17 18
Other 112 94 49 7
Changes in operating assets and liabilities:
Trade receivables, net 10 162 78 363
Inventories, net 115 105 376 509
Trade payables 340 (112) 187 16
Accrued liabilities 80 (24) 66 (2)
Billings in excess of sales (25) 35 (29) (55)
Provisions, net 14 330 19 487
Advances from customers (163) 106 (143) 112
Income taxes payable and receivable 125 (32) 2 41
Other assets and liabilities, net 177 88 142 114
Net cash provided by operating activities 3,843 3,818 1,428 1,994
Investing activities:
Purchases of marketable securities (available-for-sale) (1,214) (1,925) (393) (827)
Purchases of short-term investments (3,092) (614) (920) (68)
Purchases of property, plant and equipment and intangible assets (831) (876) (299) (329)
Acquisition of businesses (net of cash acquired)
and increases in cost- and equity-accounted companies (26) (56) (2) (12)
Proceeds from sales of marketable securities (available-for-sale) 1,057 434 284 55
Proceeds from maturity of marketable securities (available-for-sale) 539 1,022 – 395
Proceeds from short-term investments 2,241 653 791 25
Proceeds from sales of property, plant and equipment 61 68 9 24
Proceeds from sales of businesses (net of transaction costs
and cash disposed) and cost- and equity-accounted companies (1) 69 – –
Net cash from settlement of foreign currency derivatives (57) 231 (23) 23
Other investing activities 18 20 5 5
Net cash used in investing activities (1,305) (974) (548) (709)
Financing activities:
Net changes in debt with original maturities of 90 days or less (152) 3 (197) (72)
Increase in debt 912 68 58 13
Repayment of debt (1,249) (101) (529) (23)
Delivery of shares 192 107 49 –
Purchase of treasury stock (1,299) (1,487) – (439)
Dividends paid – (1,357) – –
Reduction in nominal value of common shares paid to shareholders (1,610) (392) – –
Dividends paid to noncontrolling shareholders (122) (137) (1) (6)
Other financing activities (27) (84) (6) (66)
Net cash used in financing activities (3,355) (3,380) (626) (593)
Effects of exchange rate changes on cash and equivalents (104) (342) (148) (97)
Net change in cash and equivalents – continuing operations (921) (878) 106 595
Cash and equivalents, beginning of period 4,565 5,443 3,538 3,970
Cash and equivalents, end of period 3,644 4,565 3,644 4,565
Supplementary disclosure of cash flow information:
Interest paid 213 221 69 70
Taxes paid 814 1,043 223 207
See Notes to the Interim Consolidated Financial Information

12 Q4 2016 FINANCIAL INFORMATION
—
ABB Ltd Interim Consolidated Statements of Changes in Stockholders’ Equity (unaudited)
Accumulated other comprehensive loss
($ in millions) Ca
pit
al s
toc
k a
nd
ad
dit
ion
al p
aid‑
in c
ap
ita
l
Re
tain
ed
ea
rnin
gs
Fo
reig
n c
urr
en
cy
tra
ns
lati
on
ad
jus
tme
nts
Un
rea
lize
d g
ain
s (
los
se
s)
on
av
ail
ab
le‑
for‑
sa
le s
ec
uri
tie
s
Pe
ns
ion
an
d o
the
r p
os
t‑
reti
rem
en
t p
lan
ad
jus
tme
nts
Un
rea
lize
d g
ain
s (
los
se
s)
of
ca
sh
flo
w h
ed
ge
de
riv
ati
ve
s
To
tal
ac
cu
mu
late
d o
the
r
co
mp
reh
en
siv
e l
os
s
Tre
as
ury
sto
ck
To
tal
AB
B
sto
ck
ho
lde
rs’ e
qu
ity
No
nc
on
tro
llin
g i
nte
res
ts
To
tal
sto
ck
ho
lde
rs’ e
qu
ity
Balance at January 1, 2015 1,777 19,939 (2,102) 13 (2,131) (21) (4,241) (1,206) 16,269 546 16,815
Comprehensive income:
Net income 1,933 1,933 122 2,055
Foreign currency translation
adjustments, net of tax of $(47) (1,033) (1,033) (1,033) (25) (1,058)
Effect of change in fair value of
available-for-sale securities,
net of tax of $(1) (6) (6) (6) (6)
Unrecognized income (expense)
related to pensions and other
postretirement plans,
net of tax of $140 412 412 412 3 415
Change in derivatives qualifying as
cash flow hedges, net of tax of $3 10 10 10 10
Total comprehensive income 1,316 100 1,416
Changes in noncontrolling interests (30) (25) (55) (2) (57)
Dividends paid to
noncontrolling shareholders – (137) (137)
Dividends paid (1,317) (1,317) (1,317)
Reduction in nominal value of common
shares paid to shareholders (349) (54) (403) (403)
Share-based payment arrangements 61 61 61
Purchase of treasury stock (1,501) (1,501) (1,501)
Delivery of shares (19) 126 107 107
Call options 4 4 4
Balance at December 31, 2015 1,444 20,476 (3,135) 7 (1,719) (11) (4,858) (2,581) 14,481 507 14,988
Balance at January 1, 2016 1,444 20,476 (3,135) 7 (1,719) (11) (4,858) (2,581) 14,481 507 14,988
Comprehensive income:
Net income 1,899 – 1,899 135 2,034
Foreign currency translation
adjustments, net of tax of $12 (457) (457) (457) (17) (474)
Effect of change in fair value of
available-for-sale securities,
net of tax of $0 – – – –
Unrecognized income (expense)
related to pensions and other
postretirement plans,
net of tax of $24 118 118 118 118
Change in derivatives qualifying as
cash flow hedges, net of tax of $4 10 10 10 10
Total comprehensive income 1,570 118 1,688
Changes in noncontrolling interests – (1) (1)
Dividends paid to
noncontrolling shareholders – (122) (122)
Reduction in nominal value of common
shares paid to shareholders (1,224) (402) (1,626) (1,626)
Cancellation of treasury shares (40) (2,007) 2,047 – –
Share-based payment arrangements 54 54 54
Purchase of treasury stock (1,280) (1,280) (1,280)
Delivery of shares (22) (41) 255 192 192
Call options 4 4 4
Balance at December 31, 2016 - restated 216 19,925 (3,592) 7 (1,601) (1) (5,187) (1,559) 13,395 502 13,897
See Notes to the Interim Consolidated Financial Information

13 Q4 2016 FINANCIAL INFORMATION
— Notes to the Interim Consolidated Financial Information (unaudited)
Note 1
The Company and basis
of presentation
ABB Ltd and its subsidiaries (collectively, the Company) together form a pioneering technology leader in
electrification products, robotics and motion, industrial automation and power grids serving customers in
utilities, industry and transport & infrastructure globally.
The Company’s Interim Consolidated Financial Information is prepared in accordance with United States of
America generally accepted accounting principles (U.S. GAAP) for interim financial reporting. As such, the
Interim Consolidated Financial Information does not include all the information and notes required under
U.S. GAAP for annual consolidated financial statements. Therefore, such financial information should be
read in conjunction with the audited consolidated financial statements in the Company’s Annual Report for
the year ended December 31, 2015.
The preparation of financial information in conformity with U.S. GAAP requires management to make
assumptions and estimates that directly affect the amounts reported in the Interim Consolidated Financial
Information. The most significant, difficult and subjective of such accounting assumptions and estimates
include:
estimates used to record expected costs for employee severance in connection with
restructuring programs,
estimates used to record warranty obligations,
assumptions and projections, principally related to future material, labor and project related
overhead costs, used in determining the percentage of completion on projects,
estimates of loss contingencies associated with litigation or threatened litigation and other
claims and inquiries, environmental damages, product warranties, self-insurance reserves,
regulatory and other proceedings,
assumptions used in the calculation of pension and postretirement benefits and the fair value o f
pension plan assets,
estimates to determine valuation allowances for deferred tax assets and amounts recorded for
uncertain tax positions,
growth rates, discount rates and other assumptions used to determine impairment of long lived
assets and in testing goodwill for impairment,
assumptions used in determining inventory obsolescence and net realizable value,
estimates and assumptions used in determining the fair values of assets and liabilities assumed
in business combinations, and
assessment of the allowance for doubtful accounts.
The actual results and outcomes may differ from the Company’s estimates and assumptions.
A portion of the Company’s activities (primarily long-term construction activities) has an operating cycle
that exceeds one year. For classification of current assets and liabilities related to such activities, the
Company elected to use the duration of the individual contracts as its operating cycle. Accordingly, there
are accounts receivable, inventories and provisions related to these contracts which will not be realized
within one year that have been classified as current.
In September 2016, the Company announced an agreement to divest its high-voltage cable system
business (Cables business). The assets and liabilities of this business are shown as assets and liabilities
held for sale in the Company’s Interim Consolidated Balance Sheet at December 31, 2016. The divestment
was completed on March 1, 2017.
In the opinion of management, the unaudited Interim Consolidated Financial Information contains all
necessary adjustments to present fairly the financial position, results of operations and cash flows for the
reported interim periods. Management considers all such adjustments to be of a normal recurring nature.
The Interim Consolidated Financial Information is presented in United States dollars ($) unless otherwise
stated. Certain amounts reported in the Interim Consolidated Financial Information for prior periods have
been reclassified to conform to the current year’s presentation . These changes primarily relate to the
change in the definition of segment profit and the reorganization of the Company’s operating segments
(see Note 13).
Restatement Subsequent to the issuance of the Company’s interim consolidated financial information for the year and
three months ended December 31, 2016, the Company discovered a scheme to embezzle and
misappropriate funds in its subsidiary in South Korea. The Company determined that approximately
$75 million in cash previously reported at December 31, 2016, had been misappropriated and in addition
there were unrecorded loans of $16 million and unreported factoring of accounts receivable amounting to
$12 million. The Company reported this criminal loss to its third-party insurance company and has
confirmed it has a relevant and effective insurance with a policy limit of $30 million and this coverage has
been accrued.

14 Q4 2016 FINANCIAL INFORMATION
The following tables set forth the effects of the restatement on certain line items in the Company’s
previously reported interim consolidated financial information.
Year ended December 31, 2016 Three months ended December 31, 2016
Previously Previously
($ in millions) reported Restated reported Restated
Consolidated Income Statements
Other Income (expense), net (38) (111) (21) (94)
Income from continuing operating before taxes 2,872 2,799 739 666
Provision for taxes (790) (781) (203) (194)
Net income 2,098 2,034 538 474
Net income attributable to ABB 1,963 1,899 489 425
Basic earnings per share attributable to ABB shareholders 0.91 0.88 0.23 0.20
Diluted earnings per share attributable to ABB shareholders 0.91 0.88 0.23 0.20
December 31, 2016
Previously
($ in millions) reported Restated
Consolidated Balance Sheet
Current Assets
Cash and equivalents 3,719 3,644
Receivables, net 9,708 9,696
Other current assets 658 688
Non current assets
Deferred Taxes 509 527
Current liabilities
Short-term debt and current maturities of long-term debt 987 1,003
Deferred Taxes 259 258
Non current liabilities
Deferred Taxes 958 957
Other non current liabilities 1,593 1,604
Stockholders' equity:
Retained earnings 19,989 19,925
Year ended December 31, 2016 Three months ended December 31, 2016
Previously Previously
($ in millions) reported Restated reported Restated
Consolidated Statements of Cash Flows
Net Income 2,098 2,034 538 474
Adjustments to reconcile net income
to cash provided by operating activities
Deferred Taxes (127) (147) (19) (39)
Trade receivables, net (2) 10 66 78
Income taxes payable and receivable 114 125 (9) 2
Other assets and liabilities, net 207 177 172 142
Net cash provided by operating activities 3,934 3,843 1,519 1,428
Financing Activities
Increase in debt 896 912 42 58
Net cash used in financing activities (3,371) (3,355) (642) (626)
The restatement resulted in changes to amounts previously reported in Notes 3, 5, 7, 10 and 13 and,
accordingly, such notes have been amended and restated in this restated interim consolidated financial
information.
Adjustment related to prior
periods
As a result of the misappropriation of cash described above, the Company recorded a cumulative
adjustment to correct its financial statements in the year and three months ended December 31, 2016. The
correction resulted in a net loss being recorded in “Other income (expense), net” of $73 million. This loss
primarily relates to periods prior to the three months ended December 31, 2016, and a portion of the loss
relates to previous years. The Company evaluated the impact of the correction on both a quantitative and
qualitative basis under the guidance of ASC 250, Accounting Changes and Error Corrections, and
determined that there were no material impacts on the trend of net income, cash flows or liquidity for
previously issued annual financial statements. Additionally, the Company concluded that its consolidated
financial statements for the current annual period were not materially impacted by the correction.
15 Q4 2016 FINANCIAL INFORMATION
Note 2
Recent accounting
pronouncements
Applicable for current periods
Disclosures for investments in certain entities that calculate net asset value per share (or its equivalent)
As of January 1, 2016, the Company adopted an accounting standard update regarding fair value disclosures
for certain investments. Under the update, the Company is no longer required to categorize within the fair
value hierarchy any investments for which fair value is measured using the net asset value per share practical
expedient. The amendments also removed the requirement to make certain disclosures for investments that
are eligible to be measured at fair value using the net asset value per share practical expedient. Rather, those
disclosures are limited to investments for which the Company has elected to measure the fair value using
that practical expedient. This update was applied retrospectively and did not have a significant impact on
the consolidated financial statements.
Simplifying the measurement of inventory
As of January 1, 2016, the Company early-adopted an accounting standard update simplifying the subsequent
measurement of inventories by replacing the current lower of cost or market test with a lower of cost and
net realizable value test. The guidance applies only to inventories for which cost is determined by methods
other than last-in first-out and the retail inventory methods. Net realizable value is the estimated selling
price in the ordinary course of business, less reasonably predictable costs of completion, disposal and
transportation. The update was applied prospectively and did not have a significant impact on the
consolidated financial statements.
Applicable for future periods
Revenue from contracts with customers
In May 2014, an accounting standard update was issued to clarify the principles for recognizing revenues
from contracts with customers. The update, which supersedes substantially all existing revenue recognition
guidance, provides a single comprehensive model for recognizing revenues on the transfer of promised
goods or services to customers in an amount that reflects the consideration that is expected to be received
for those goods or services. Under the standard it is possible that more judgments and estimates would be
required than under existing standards, including identifying the separate performance obligations in a
contract, estimating any variable consideration elements, and allocating the transaction price to each
separate performance obligation. The update also requires additional disclosures about the nature, amount,
timing and uncertainty of revenue and cash flows arising from contracts with customers. Further updates
were issued in 2016 to clarify the guidance on identifying performance obligations, licensing and contract
costs, to enhance the implementation guidance on principal versus agent considerations and to add other
practical expedients.
In August 2015, the effective date for the update was deferred and the update is now effective for the
Company for annual and interim periods beginning January 1, 2018, and is to be applied either (i)
retrospectively to each prior reporting period presented, with the option to elect certain defined practical
expedients, or (ii) retrospectively with the cumulative effect of initially applying the update recognized at the
date of adoption in retained earnings (with additional disclosure as to the impact on individual financial
statement lines affected). Early adoption of the standard is permitted for annual reporti ng periods
beginning after December 15, 2016, including interim reporting periods within that reporting period.
The Company currently plans to adopt these updates as of January 1, 2018, pursuant to the aforementioned
adoption method (ii) and currently does not anticipate these updates will have a significant impact on its
consolidated financial statements. The Company’s analysis of contracts performed in 2016 resulted in
immaterial differences in the identification of performance obligations compared to the current unit of
accounting determination. Except for a limited number of contracts where the required criteria are not met,
the analysis supports the recognition of revenue over time following the cost-to-cost method under the new
revenue recognition standard for those contracts which are following the cost-to-cost method under the
current revenue recognition model. The Company continues to evaluate the expected impacts of the
adoption of these updates and the expected impacts are subject to change.
Balance sheet classification of deferred taxes
In November 2015, an accounting standard update was issued which removes the requirement to separate
deferred tax liabilities and assets into current and noncurrent amounts and instead requires all such
amounts, as well as any related valuation allowance, to be classified as noncurrent in the balance sheet. This
update is effective for the Company for annual and interim periods beginning January 1, 2017, with early
adoption permitted, and is applicable either prospectively to all deferred tax liabilities and assets or
retrospectively to all periods presented. The Company will adopt this update as of January 1, 2017, on a
retrospective basis and expects the balance of deferred tax assets and liabilities to decrease by
approximately $300 million due to additional netting impacts.
Recognition and measurement of financial assets and financial liabilities
In January 2016, an accounting standard update was issued to enhance the reporting model for financial
instruments, which includes amendments to address aspects of recognition, measurement, presentation and
disclosure. For example, the Company would be required to measure equity investments (except those
accounted for under the equity method) at fair value with changes in fair value recognized in net income and
to present separately financial assets and financial liabilities by measurement category and form of financial
asset. This update is effective for the Company for annual and interim periods beginning January 1, 20 18,
with early adoption permitted for certain provisions. The Company is currently evaluating the impact of this
update on its consolidated financial statements.
Leases
In February 2016, an accounting standard update was issued that requires lessees to recognize lease assets
and corresponding lease liabilities on the balance sheet for all leases with terms of more than 12 months. The
update, which supersedes existing lease guidance, will continue to classify leases as either finance or
operating, with the classification determining the pattern of expense recognition in the income statement.
This update is effective for the Company for annual and interim periods beginning January 1, 2019, with early

16 Q4 2016 FINANCIAL INFORMATION
adoption permitted, and is applicable on a modified retrospective basis with various optional practical
expedients. The Company is currently evaluating the impact of this update on its consolidated financial
statements.
Simplifying the transition to the equity method of accounting
In March 2016, an accounting standard update was issued which eliminates the retroactive adjustments to an
investment upon it qualifying for the equity method of accounting as a result of an increase in the level of
ownership interest or degree of influence by the investor. It requires that the equity method investor add the
cost of acquiring the additional interest in the investee to the current basis of the investor’s previously held
interest and adopt the equity method of accounting as of the date the investment qualifies for equity
method accounting. This update is effective for the Company for annual and interim periods beginning
January 1, 2017, with early adoption permitted, and is applicable prospectively. The Company does not
believe that this update will have a significant impact on its consolidated financial statements.
Improvements to employee share-based payment accounting
In March 2016, an accounting standard update was issued which changes the accounting for certain aspects
of share-based payment awards to employees, including the accounting for income taxes, forfeitures, and
statutory tax withholding requirements, as well as the classification in the statement of cash flows. This
update is effective for the Company for annual and interim periods beginning January 1, 2017, with early
adoption permitted. The Company does not believe that this update will have a significant impact on its
consolidated financial statements.
Measurement of credit losses on financial instruments
In June 2016, an accounting standard update was issued which replaces the existing incurred loss
impairment methodology for most financial assets with a new “current expected credit loss” model. The new
model will result in the immediate recognition of the estimated credit losses expected to occur over the
remaining life of financial assets such as trade and other receivables, held-to-maturity debt securities, loans
and other instruments. Credit losses relating to available-for-sale debt securities will be measured in a
manner similar to current GAAP, except that the losses will be recorded through an allowance for credit
losses rather than as a direct write-down of the security.
This update is effective for the Company for annual and interim periods beginning January 1, 2020, with early
adoption permitted for annual and interim periods beginning January 1, 2019. The Company is currently
evaluating the impact of this update on its consolidated financial statements.
Classification of certain cash receipts and cash payments in the statement of cash flows
In August 2016, an accounting standard update was issued which clarifies how certain cash receipts and cash
payments, including debt prepayment or extinguishment costs, the settlement of zero coupon debt
instruments, contingent consideration paid after a business combination, proceeds from insurance
settlements, distributions from certain equity method investees and beneficial interests obtained in a
financial asset securitization, should be presented and classified in the statement of cash flows. This update
is effective for the Company for annual and interim periods beginning January 1, 2018 on a retrospective
basis, with early adoption permitted. The Company does not believe that this update will have a significant
impact on its consolidated financial statements.
Income taxes – Intra-entity transfers of assets other than inventory
In October 2016, an accounting standard update was issued that requires the Company to recognize the
income tax consequences of an intra-entity transfer of an asset other than inventory when the transfer
occurs instead of when the asset has been sold to an outside party. This update is effective for the Company
for annual and interim periods beginning January 1, 2018, with early adoption permitted, and is applicable on
a modified retrospective basis through a cumulative-effect adjustment directly to retained earnings as of the
beginning of the period of adoption. The Company is currently evaluating the impact of this update on its
consolidated financial statements.
Statement of cash flows - Restricted cash
In November 2016, an accounting standard update was issued which clarifies the classification and
presentation of changes in restricted cash on the statement of cash flows. It requires the inclusion of cash
and cash equivalents that have restrictions on withdrawal or use in total cash and cash equivalents on the
statement of cash flows. This update is effective for the Company for annual and interim periods beginning
January 1, 2018 on a retrospective basis, with early adoption permitted. The Company does not believe that
this update will have a significant impact on its consolidated financial statements .
Clarifying the definition of a business
In January 2017, an accounting standard update was issued which narrows the definition of a business. It
also provides a framework for determining whether a set of transferred assets and activities involves a
business. This update is effective for the Company for annual and interim periods beginning January 1, 2018
on a prospective basis, with early adoption permitted. The Company does not believe that this update will
have a significant impact on its consolidated financial statements.
Simplifying the test for goodwill impairment
In January 2017, an accounting standard update was issued which eliminates the requirement to calculate
the implied fair value of goodwill when measuring a goodwill impairment loss. Instead, the Company is
required to record an impairment loss based on the excess of a reporting unit’s carrying amount over its
fair value provided that the loss recognized does not exceed the total amount of goodwill allocated to that
reporting unit. This update is effective for the Company for annual and interim periods beginning January
1, 2020 on a prospective basis, with early adoption permitted. The Company plans to early adopt this
update in the first quarter of 2017 and apply it prospectively. The Company does not believe that this
update will have a significant impact on its consolidated financial statements.

17 Q4 2016 FINANCIAL INFORMATION
Clarifying the scope of asset derecognition guidance and accounting for partial sales of nonfinancial
assets
In February 2017, an accounting standard update was issued which clarifies the scope of asset
derecognition guidance, adds guidance for partial sales of nonfinancial assets and clarifies recognizing
gains and losses from the transfer of nonfinancial assets in contracts with noncustomers. The Company
plans to adopt this update retrospectively as of January 1, 2018, with the cumulative effect of initially
applying the update recognized at the date of adoption in retained earnings. The Company does not
believe that this update will have a significant impact on its consolidated financial statements.
Note 3
Cash and equivalents, marketable
securities and short-term
investments
Current assets Cash and equivalents, marketable securities and short-term investments consisted of the following:
December 31, 2016 - restated
Gross Gross Marketable securities
unrealized unrealized Cash and and short-term
($ in millions) Cost basis gains losses Fair value equivalents investments
Cash 1,704 1,704 1,704 –
Time deposits 2,764 2,764 1,940 824
Other short-term investments 271 271 – 271
Debt securities available-for-sale:
U.S. government obligations 221 1 (2) 220 – 220
Other government obligations 2 – – 2 – 2
Corporate 95 1 (1) 95 – 95
Equity securities available-for-sale 530 11 – 541 – 541
Total 5,587 13 (3) 5,597 3,644 1,953
December 31, 2015
Gross Gross Marketable securities
unrealized unrealized Cash and and short-term
($ in millions) Cost basis gains losses Fair value equivalents investments
Cash 1,837 1,837 1,837 –
Time deposits 2,821 2,821 2,717 104
Other short-term investments 231 231 – 231
Debt securities available-for-sale:
U.S. government obligations 120 2 (1) 121 – 121
Other government obligations 2 – – 2 – 2
Corporate 519 1 (1) 519 11 508
Equity securities available-for-sale 658 9 – 667 – 667
Total 6,188 12 (2) 6,198 4,565 1,633
Included in Other short-term investments at December 31, 2016 and 2015, are receivables of $268 million
and $224 million, respectively, representing reverse repurchase agreements. These collateralized lendings,
made to a financial institution, have maturity dates of less than one year.
Non-current assets Included in “Other non-current assets” are certain held-to-maturity marketable securities. At December 31,
2016, the amortized cost, gross unrecognized gain and fair value (based on quoted market prices) of these
securities were $80 million, $6 million and $86 million, respectively. At December 31, 2015, the amortized
cost, gross unrecognized gain and fair value (based on quoted market prices) of these securities were
$99 million, $11 million and $110 million, respectively. These securities are pledged as security for certain
outstanding deposit liabilities and the funds received at the respective maturity dates of the securities will
only be available to the Company for repayment of these obligations.
Note 4
Derivative financial instruments
The Company is exposed to certain currency, commodity, interest rate and equity risks arising from its
global operating, financing and investing activities. The Company uses derivative instruments to reduce
and manage the economic impact of these exposures.
Currency risk Due to the global nature of the Company’s operations, many of its subsidiaries are exposed to currency
risk in their operating activities from entering into transactions in currencies other than their functional
currency. To manage such currency risks, the Company’s policies require the subsidiaries to hedge their
foreign currency exposures from binding sales and purchase contracts denominated in foreign currencies.
For forecasted foreign currency denominated sales of standard products and the related forei gn currency
denominated purchases, the Company’s policy is to hedge up to a maximum of 100 percent of the
forecasted foreign currency denominated exposures, depending on the length of the forecasted
exposures. Forecasted exposures greater than 12 months are not hedged. Forward foreign exchange
contracts are the main instrument used to protect the Company against the volatility of future cash flows
(caused by changes in exchange rates) of contracted and forecasted sales and purchases denominated in
foreign currencies. In addition, within its treasury operations, the Company primarily uses foreign
18 Q4 2016 FINANCIAL INFORMATION
exchange swaps and forward foreign exchange contracts to manage the currency and timing mismatches
arising in its liquidity management activities.
Commodity risk Various commodity products are used in the Company’s manufacturing activities. Consequently it is
exposed to volatility in future cash flows arising from changes in commodity prices. To manage the price
risk of commodities, the Company’s policies require that the subsidiaries hedge the commodity price risk
exposures from binding contracts, as well as at least 50 percent (up to a maximum of 100 percent) of the
forecasted commodity exposure over the next 12 months or longer (up to a maximum of 18 months).
Primarily swap contracts are used to manage the associated price risks of commodities.
Interest rate risk The Company has issued bonds at fixed rates. Interest rate swaps are used to manage the interest rate
risk associated with certain debt and generally such swaps are designated as fair value hedges. In addition,
from time to time, the Company uses instruments such as interest rate swaps, interest rate futures, bond
futures or forward rate agreements to manage interest rate risk arising from the Company’s balance sheet
structure but does not designate such instruments as hedges.
Equity risk The Company is exposed to fluctuations in the fair value of its warrant appreciation rights (WARs) issued
under its management incentive plan. A WAR gives its holder the right to receive cash equal to the market
price of an equivalent listed warrant on the date of exercise. To eliminate such risk, the Company has
purchased cash-settled call options, indexed to the shares of the Company, which entitle the Company to
receive amounts equivalent to its obligations under the outstanding WARs.
Volume of derivative activity In general, while the Company’s primary objective in its use of derivatives is to minimize exposures arising
from its business, certain derivatives are designated and qualify for hedge accounting treatment while
others either are not designated or do not qualify for hedge accounting.
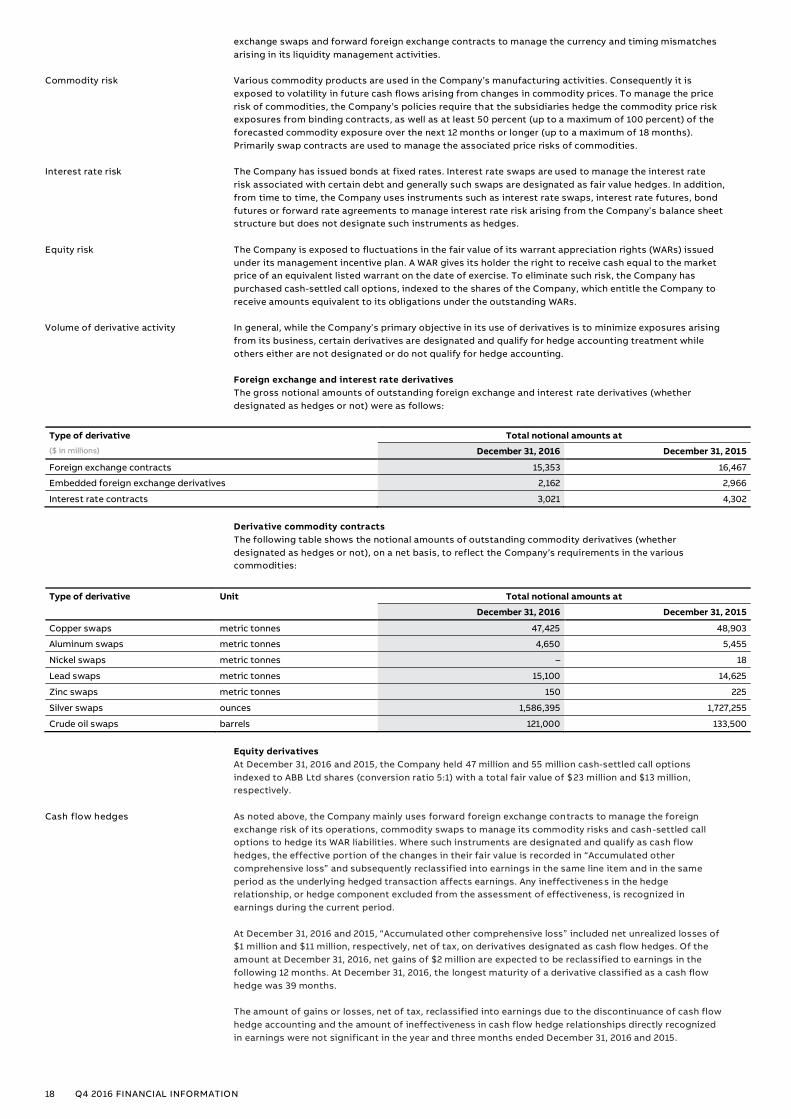
Foreign exchange and interest rate derivatives
The gross notional amounts of outstanding foreign exchange and interest rate derivatives (whether
designated as hedges or not) were as follows:
Type of derivative Total notional amounts at
($ in millions) December 31, 2016 December 31, 2015
Foreign exchange contracts 15,353 16,467
Embedded foreign exchange derivatives 2,162 2,966
Interest rate contracts 3,021 4,302
Derivative commodity contracts
The following table shows the notional amounts of outstanding commodity derivatives (whether
designated as hedges or not), on a net basis, to reflect the Company’s requirements in the various
commodities:
Type of derivative Unit Total notional amounts at
December 31, 2016 December 31, 2015
Copper swaps metric tonnes 47,425 48,903
Aluminum swaps metric tonnes 4,650 5,455
Nickel swaps metric tonnes – 18
Lead swaps metric tonnes 15,100 14,625
Zinc swaps metric tonnes 150 225
Silver swaps ounces 1,586,395 1,727,255
Crude oil swaps barrels 121,000 133,500
Equity derivatives
At December 31, 2016 and 2015, the Company held 47 million and 55 million cash-settled call options
indexed to ABB Ltd shares (conversion ratio 5:1) with a total fair value of $23 million and $13 million,
respectively.
Cash flow hedges As noted above, the Company mainly uses forward foreign exchange contracts to manage the foreign
exchange risk of its operations, commodity swaps to manage its commodity risks and cash-settled call
options to hedge its WAR liabilities. Where such instruments are designated and qualify as cash flow
hedges, the effective portion of the changes in their fair value is recorded in “Accumulated other
comprehensive loss” and subsequently reclassified into earnings in the same line item and in the same
period as the underlying hedged transaction affects earnings. Any ineffectiveness in the hedge
relationship, or hedge component excluded from the assessment of effectiveness, is recognized in
earnings during the current period.
At December 31, 2016 and 2015, “Accumulated other comprehensive loss” included net unrealized losses of
$1 million and $11 million, respectively, net of tax, on derivatives designated as cash flow hedges. Of the
amount at December 31, 2016, net gains of $2 million are expected to be reclassified to earnings in the
following 12 months. At December 31, 2016, the longest maturity of a derivative classified as a cash flow
hedge was 39 months.
The amount of gains or losses, net of tax, reclassified into earnings due to the discontinuance of cash flow
hedge accounting and the amount of ineffectiveness in cash flow hedge relationships directly recognized
in earnings were not significant in the year and three months ended December 31, 2016 and 2015.
19 Q4 2016 FINANCIAL INFORMATION
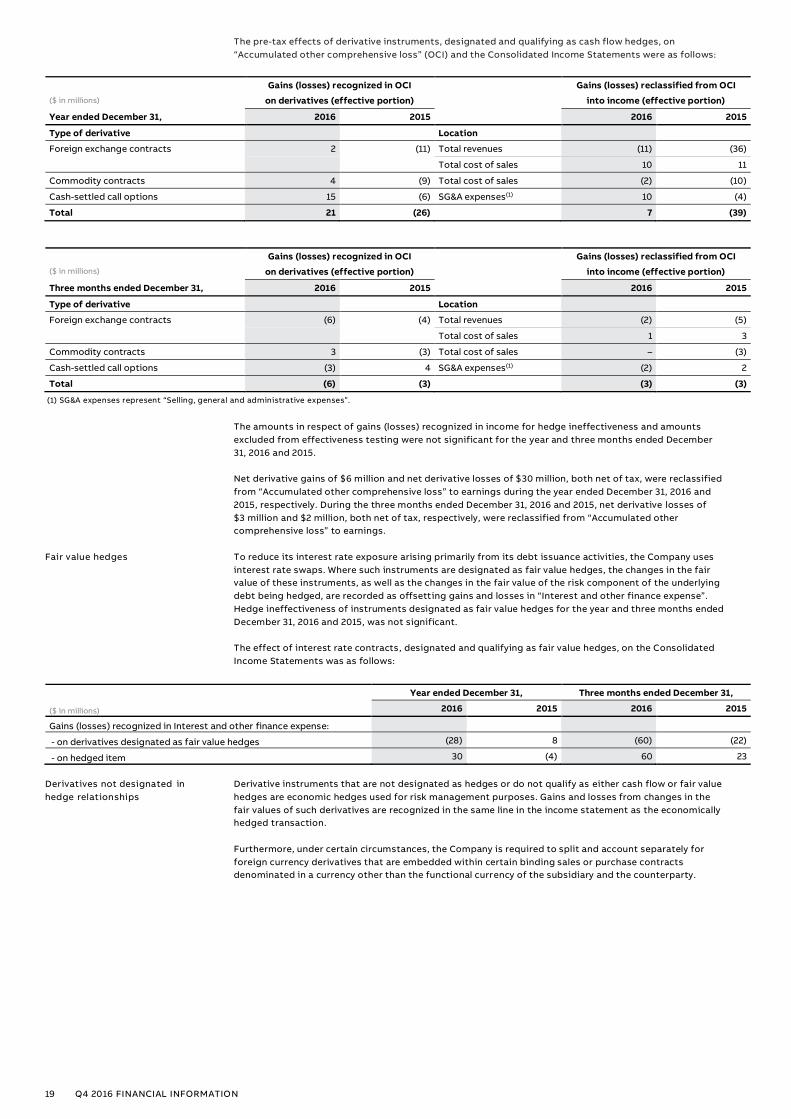
The pre-tax effects of derivative instruments, designated and qualifying as cash flow hedges, on
“Accumulated other comprehensive loss” (OCI) and the Consolidated Income Statements were as follows:
Gains (losses) recognized in OCI Gains (losses) reclassified from OCI
($ in millions) on derivatives (effective portion) into income (effective portion)
Year ended December 31, 2016 2015 2016 2015
Type of derivative Location
Foreign exchange contracts 2 (11) Total revenues (11) (36)
Total cost of sales 10 11
Commodity contracts 4 (9) Total cost of sales (2) (10)
Cash-settled call options 15 (6) SG&A expenses(1) 10 (4)
Total 21 (26) 7 (39)
Gains (losses) recognized in OCI Gains (losses) reclassified from OCI
($ in millions) on derivatives (effective portion) into income (effective portion)
Three months ended December 31, 2016 2015 2016 2015
Type of derivative Location
Foreign exchange contracts (6) (4) Total revenues (2) (5)
Total cost of sales 1 3
Commodity contracts 3 (3) Total cost of sales – (3)
Cash-settled call options (3) 4 SG&A expenses(1) (2) 2
Total (6) (3) (3) (3)
(1) SG&A expenses represent “Selling, general and administrative expenses”.
The amounts in respect of gains (losses) recognized in income for hedge ineffectiveness and amounts
excluded from effectiveness testing were not significant for the year and three months ended December
31, 2016 and 2015.
Net derivative gains of $6 million and net derivative losses of $30 million, both net of tax, were reclassified
from “Accumulated other comprehensive loss” to earnings during the year ended December 31, 2016 and
2015, respectively. During the three months ended December 31, 2016 and 2015, net derivative losses of
$3 million and $2 million, both net of tax, respectively, were reclassified from “Accumulated other
comprehensive loss” to earnings.
Fair value hedges To reduce its interest rate exposure arising primarily from its debt issuance activities, the Company uses
interest rate swaps. Where such instruments are designated as fair value hedges, the changes in the fair
value of these instruments, as well as the changes in the fair value of the risk component of the underlying
debt being hedged, are recorded as offsetting gains and losses in “Interest and other finance expense”.
Hedge ineffectiveness of instruments designated as fair value hedges for the year and three months ended
December 31, 2016 and 2015, was not significant.
The effect of interest rate contracts, designated and qualifying as fair value hedges, on the Consolidated
Income Statements was as follows:
Year ended December 31, Three months ended December 31,
($ in millions) 2016 2015 2016 2015
Gains (losses) recognized in Interest and other finance expense:
- on derivatives designated as fair value hedges (28) 8 (60) (22)
- on hedged item 30 (4) 60 23
Derivatives not designated in
hedge relationships
Derivative instruments that are not designated as hedges or do not qualify as either cash flow or fair value
hedges are economic hedges used for risk management purposes. Gains and losses from changes in the
fair values of such derivatives are recognized in the same line in the income statement as the economically
hedged transaction.
Furthermore, under certain circumstances, the Company is required to split and account separately for
foreign currency derivatives that are embedded within certain binding sales or purchase contracts
denominated in a currency other than the functional currency of the subsidiary and the counterparty.

20 Q4 2016 FINANCIAL INFORMATION
The gains (losses) recognized in the Consolidated Income Statements on derivatives not designated in
hedging relationships were as follows:
Type of derivative not Gains (losses) recognized in income
designated as a hedge Year ended December 31, Three months ended December 31,
($ in millions) Location 2016 2015 2016 2015
Foreign exchange contracts Total revenues (206) (216) (187) 10
Total cost of sales (56) 16 13 (40)
SG&A expenses(1) 8 13 13 4
Non-order related research
and development (2) (1) (1) –
Other income (expense), net 22 – 22 –
Interest and other finance expense (34) 287 11 39
Embedded foreign exchange Total revenues (5) 127 36 (11)
contracts Total cost of sales (5) (25) (12) (1)
SG&A expenses(1) (2) (5) (3) (3)
Commodity contracts Total cost of sales 42 (61) 27 (14)
Other Interest and other finance expense 4 (1) 2 1
Total (234) 134 (79) (15)
(1) SG&A expenses represent “Selling, general and administrative expenses”.
The fair values of derivatives included in the Consolidated Balance Sheets were as follows:
December 31, 2016
Derivative assets Derivative liabilities
Current in Non-current in Current in Non-current in
“Other current “Other non-current “Other current “Other non-current
($ in millions) assets” assets” liabilities” liabilities”
Derivatives designated as hedging instruments:
Foreign exchange contracts 5 – 6 5
Commodity contracts 2 – – –
Interest rate contracts 2 62 – –
Cash-settled call options 13 9 – –
Total 22 71 6 5
Derivatives not designated as hedging instruments:
Foreign exchange contracts 169 29 257 77
Commodity contracts 29 2 6 1
Cross-currency interest rate swaps – 2 – –
Cash-settled call options – 1 – –
Embedded foreign exchange derivatives 58 21 35 18
Total 256 55 298 96
Total fair value 278 126 304 101
December 31, 2015
Derivative assets Derivative liabilities
Current in Non-current in Current in Non-current in
“Other current “Other non-current “Other current “Other non-current
($ in millions) assets” assets” liabilities” liabilities”
Derivatives designated as hedging instruments:
Foreign exchange contracts 15 10 8 16
Commodity contracts – – 3 –
Interest rate contracts 6 86 – –
Cash-settled call options 8 5 – –
Total 29 101 11 16
Derivatives not designated as hedging instruments:
Foreign exchange contracts 172 32 237 81
Commodity contracts 2 – 29 9
Cross-currency interest rate swaps – – – 1
Embedded foreign exchange derivatives 94 53 41 27
Total 268 85 307 118
Total fair value 297 186 318 134
Close-out netting agreements provide for the termination, valuation and net settlement of some or all
outstanding transactions between two counterparties on the occurrence of one or more pre-defined
trigger events.
21 Q4 2016 FINANCIAL INFORMATION
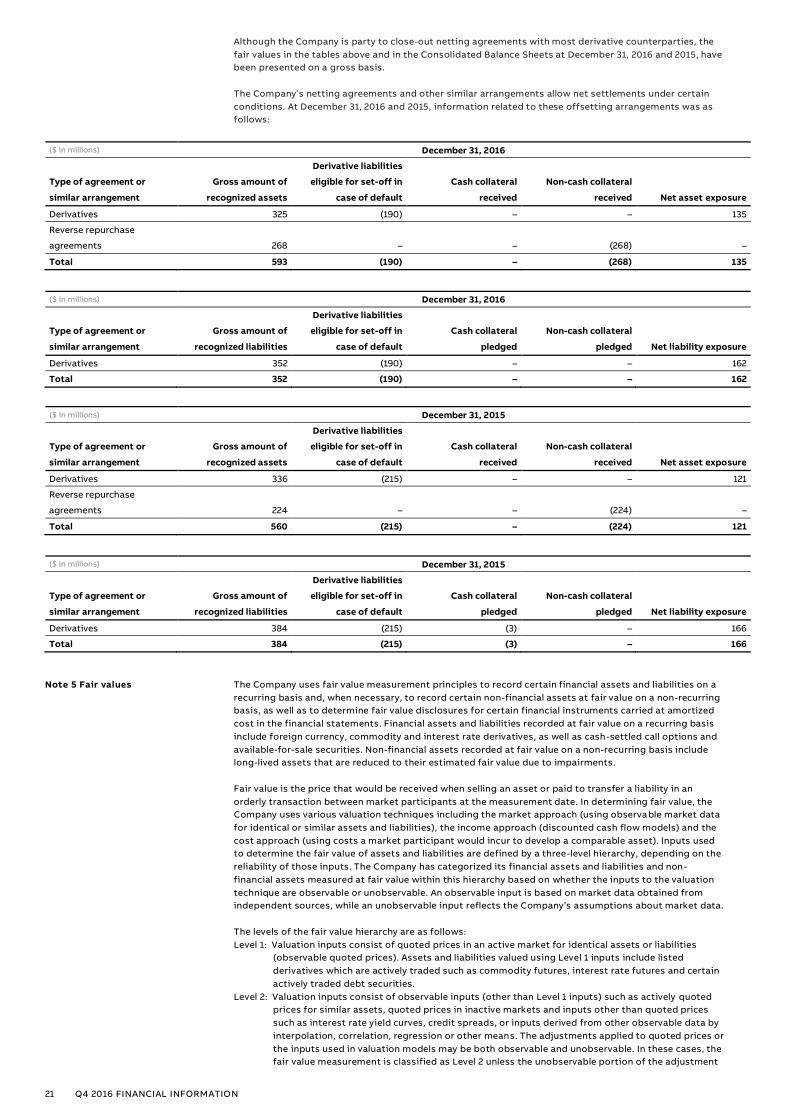
Although the Company is party to close-out netting agreements with most derivative counterparties, the
fair values in the tables above and in the Consolidated Balance Sheets at December 31, 2016 and 2015, have
been presented on a gross basis.
The Company’s netting agreements and other similar arrangements allow net settlements under certain
conditions. At December 31, 2016 and 2015, information related to these offsetting arrangements was as
follows:
($ in millions) December 31, 2016
Derivative liabilities
Type of agreement or Gross amount of eligible for set-off in Cash collateral Non-cash collateral
similar arrangement recognized assets case of default received received Net asset exposure
Derivatives 325 (190) – – 135
Reverse repurchase
agreements 268 – – (268) –
Total 593 (190) – (268) 135
($ in millions) December 31, 2016
Derivative liabilities
Type of agreement or Gross amount of eligible for set-off in Cash collateral Non-cash collateral
similar arrangement recognized liabilities case of default pledged pledged Net liability exposure
Derivatives 352 (190) – – 162
Total 352 (190) – – 162
($ in millions) December 31, 2015
Derivative liabilities
Type of agreement or Gross amount of eligible for set-off in Cash collateral Non-cash collateral
similar arrangement recognized assets case of default received received Net asset exposure
Derivatives 336 (215) – – 121
Reverse repurchase
agreements 224 – – (224) –
Total 560 (215) – (224) 121
($ in millions) December 31, 2015
Derivative liabilities
Type of agreement or Gross amount of eligible for set-off in Cash collateral Non-cash collateral
similar arrangement recognized liabilities case of default pledged pledged Net liability exposure
Derivatives 384 (215) (3) – 166
Total 384 (215) (3) – 166
Note 5 Fair values The Company uses fair value measurement principles to record certain financial assets and liabilities on a
recurring basis and, when necessary, to record certain non-financial assets at fair value on a non-recurring
basis, as well as to determine fair value disclosures for certain financial instruments carried at amortized
cost in the financial statements. Financial assets and liabilities recorded at fair value on a recurring basis
include foreign currency, commodity and interest rate derivatives, as well as cash-settled call options and
available-for-sale securities. Non-financial assets recorded at fair value on a non-recurring basis include
long-lived assets that are reduced to their estimated fair value due to impairments.
Fair value is the price that would be received when selling an asset or paid to transfer a liability in an
orderly transaction between market participants at the measurement date. In determining fair value, the
Company uses various valuation techniques including the market approach (using observable market data
for identical or similar assets and liabilities), the income approach (discounted cash flow models) and the
cost approach (using costs a market participant would incur to develop a comparable asset). Inputs used
to determine the fair value of assets and liabilities are defined by a three-level hierarchy, depending on the
reliability of those inputs. The Company has categorized its financial assets and liabilities and non -
financial assets measured at fair value within this hierarchy based on whether the inputs to the valuation
technique are observable or unobservable. An observable input is based on market data obtained from
independent sources, while an unobservable input reflects the Company’s assumptions about market data.
The levels of the fair value hierarchy are as follows:
Level 1: Valuation inputs consist of quoted prices in an active market for identical assets or liabilities
(observable quoted prices). Assets and liabilities valued using Level 1 inputs include listed
derivatives which are actively traded such as commodity futures, interest rate futures and certain
actively traded debt securities.
Level 2: Valuation inputs consist of observable inputs (other than Level 1 inputs) such as actively quoted
prices for similar assets, quoted prices in inactive markets and inputs other than quoted prices
such as interest rate yield curves, credit spreads, or inputs derived from other observable data by
interpolation, correlation, regression or other means. The adjustments applied to quoted prices or
the inputs used in valuation models may be both observable and unobservable. In these cases, the
fair value measurement is classified as Level 2 unless the unobservable portion of the adjustment

22 Q4 2016 FINANCIAL INFORMATION
or the unobservable input to the valuation model is significant, in which case the fair value
measurement would be classified as Level 3. Assets and liabilities valued or disclosed using Level 2
inputs include investments in certain funds, reverse repurchase agreements, certain debt
securities that are not actively traded, interest rate swaps, commodity swaps, cash-settled call
options, forward foreign exchange contracts, foreign exchange swaps and forward rate
agreements, time deposits, as well as financing receivables and debt.
Level 3: Valuation inputs are based on the Company’s assumptions of relevant market data (unobservable
input).
Whenever quoted prices involve bid-ask spreads, the Company ordinarily determines fair values based on
mid-market quotes. However, for the purpose of determining the fair value of cash-settled call options
serving as hedges of the Company’s management incentive plan, bid prices are used.
When determining fair values based on quoted prices in an active market, the Company considers if the
level of transaction activity for the financial instrument has significantly decreased, or would not be
considered orderly. In such cases, the resulting changes in valuation techniques would be disclosed. If the
market is considered disorderly or if quoted prices are not available, the Company is required to use
another valuation technique, such as an income approach.
Recurring fair value measures The fair values of financial assets and liabilities measured at fair value on a recurring basis were as follows:
December 31, 2016
($ in millions) Level 1 Level 2 Level 3 Total fair value
Assets
Available-for-sale securities in “Marketable securities and short-term investments”:
Equity securities – 541 – 541
Debt securities—U.S. government obligations 220 – – 220
Debt securities—Other government obligations – 2 – 2
Debt securities—Corporate – 95 – 95
Derivative assets—current in “Other current assets” – 278 – 278
Derivative assets—non-current in “Other non-current assets” – 126 – 126
Total 220 1,042 – 1,262
Liabilities
Derivative liabilities—current in “Other current liabilities” – 304 – 304
Derivative liabilities—non-current in “Other non-current liabilities” – 101 – 101
Total – 405 – 405
December 31, 2015
($ in millions) Level 1 Level 2 Level 3 Total fair value
Assets
Available-for-sale securities in “Cash and equivalents”:
Debt securities—Corporate – 11 – 11
Available-for-sale securities in “Marketable securities and short-term investments”:
Equity securities – 667 – 667
Debt securities—U.S. government obligations 121 – – 121
Debt securities—Other government obligations – 2 – 2
Debt securities—Corporate – 508 – 508
Derivative assets—current in “Other current assets” 1 296 – 297
Derivative assets—non-current in “Other non-current assets” – 186 – 186
Total 122 1,670 – 1,792
Liabilities
Derivative liabilities—current in “Other current liabilities” 3 315 – 318
Derivative liabilities—non-current in “Other non-current liabilities” – 134 – 134
Total 3 449 – 452
The Company uses the following methods and assumptions in estimating fair values of financial assets
and liabilities measured at fair value on a recurring basis:
● Available-for-sale securities in “Cash and equivalents” and “Marketable securities and short-term
investments”: If quoted market prices in active markets for identical assets are available, these are
considered Level 1 inputs; however, when markets are not active, these inputs are considered Level 2. If
such quoted market prices are not available, fair value is determined using market prices for similar
assets or present value techniques, applying an appropriate risk-free interest rate adjusted for
nonperformance risk. The inputs used in present value techniques are observable and fall into the Level
2 category.
● Derivatives: The fair values of derivative instruments are determined using quoted prices of identical
instruments from an active market, if available (Level 1). If quoted prices are not available, price quotes
for similar instruments, appropriately adjusted, or present value techniques, based on available market
data, or option pricing models are used. Cash-settled call options hedging the Company’s WAR liability
are valued based on bid prices of the equivalent listed warrant. The fair values obtained using price

23 Q4 2016 FINANCIAL INFORMATION
quotes for similar instruments or valuation techniques represent a Level 2 input unless significant
unobservable inputs are used.
Non-recurring fair value measures
There were no significant non-recurring fair value measurements during the year and three months ended
December 31, 2016 and 2015.
Disclosure about financial
instruments carried on a cost
basis
The fair values of financial instruments carried on a cost basis were as follows:
December 31, 2016 - restated
($ in millions) Carrying value Level 1 Level 2 Level 3 Total fair value
Assets
Cash and equivalents (excluding available-for-sale securities
with original maturities up to 3 months):
Cash 1,704 1,704 – – 1,704
Time deposits 1,940 – 1,940 – 1,940
Marketable securities and short-term investments
(excluding available-for-sale securities):
Time deposits 824 – 824 – 824
Receivables under reverse repurchase agreements 268 – 268 – 268
Other short-term investments 3 3 – – 3
Other non-current assets:
Loans granted 30 – 31 – 31
Held-to-maturity securities 80 – 86 – 86
Restricted cash deposits 91 59 42 – 101
Liabilities
Short-term debt and current maturities of long-term debt
(excluding capital lease obligations) 980 856 124 – 980
Long-term debt (excluding capital lease obligations) 5,709 5,208 784 – 5,992
Non-current deposit liabilities in “Other non-current liabilities” 106 – 124 – 124
December 31, 2015
($ in millions) Carrying value Level 1 Level 2 Level 3 Total fair value
Assets
Cash and equivalents (excluding available-for-sale securities
with original maturities up to 3 months):
Cash 1,837 1,837 – – 1,837
Time deposits 2,717 – 2,717 – 2,717
Marketable securities and short-term investments
(excluding available-for-sale securities):
Time deposits 104 – 104 – 104
Receivables under reverse repurchase agreements 224 – 224 – 224
Other short-term investments 7 7 – – 7
Other non-current assets:
Loans granted 29 – 30 – 30
Held-to-maturity securities 99 – 110 – 110
Restricted cash deposits 176 55 138 – 193
Liabilities
Short-term debt and current maturities of long-term debt
(excluding capital lease obligations) 1,427 614 817 – 1,431
Long-term debt (excluding capital lease obligations) 5,889 5,307 751 – 6,058
Non-current deposit liabilities in “Other non-current liabilities” 215 – 244 – 244
The Company uses the following methods and assumptions in estimating fair values of financial
instruments carried on a cost basis:
● Cash and equivalents (excluding available-for-sale securities with original maturities up to 3 months),
and Marketable securities and short-term investments (excluding available-for-sale securities): The
carrying amounts approximate the fair values as the items are short-term in nature.
● Other non-current assets: Includes (i) loans granted whose fair values are based on the carrying
amount adjusted using a present value technique to reflect a premium or discount based on current
market interest rates (Level 2 inputs), (ii) held-to-maturity securities (see Note 3) whose fair values are
based on quoted market prices in inactive markets (Level 2 inputs), (iii) restricted cash whose fair
values approximate the carrying amounts (Level 1 inputs) and restricted cash deposits pledged in
respect of certain non-current deposit liabilities whose fair values are determined using a discounted
cash flow methodology based on current market interest rates (Level 2 inputs).
● Short-term debt and current maturities of long-term debt (excluding capital lease obligations): Short-
term debt includes commercial paper, bank borrowings and overdrafts. The carrying amounts of short -

24 Q4 2016 FINANCIAL INFORMATION
term debt and current maturities of long-term debt, excluding capital lease obligations, approximate
their fair values.
● Long-term debt (excluding capital lease obligations): Fair values of bonds are determined using
quoted market prices (Level 1 inputs), if available. For bonds without available quoted market prices
and other long-term debt, the fair values are determined using a discounted cash flow methodology
based upon borrowing rates of similar debt instruments and reflecting appropriate adjustments for
non-performance risk (Level 2 inputs).
● Non-current deposit liabilities in “Other non-current liabilities”: The fair values of non-current deposit
liabilities are determined using a discounted cash flow methodology based on risk -adjusted interest
rates (Level 2 inputs).
Note 6
Commitments and contingencies
Contingencies—Regulatory,
Compliance and Legal
Antitrust
In April 2014, the European Commission announced its decision regarding its investigation of
anticompetitive practices in the cables industry and granted the Company full immunity from fines under
the European Commission’s leniency program. In December 2013, the Company agreed with the Brazilian
Antitrust Authority (CADE) to settle its ongoing investigation into the Company’s involvement in
anticompetitive practices in the cables industry and the Company agreed to pay a fine of approximately
1.5 million Brazilian reals (equivalent to approximately $1 million on date of payment).
In Brazil, the Company’s Gas Insulated Switchgear business is under investigation by the CADE for alleged
anticompetitive practices. In addition, the CADE has opened an investigation into certain other power
businesses of the Company, including flexible alternating current transmission systems (FACTS) and
power transformers. With respect to these matters, management is cooperating fully with the authorities.
An informed judgment about the outcome of these investigations or the amount of potential loss or range
of loss for the Company, if any, relating to these investigations cannot be made at this stage.
Suspect payments
As a result of an internal investigation, the Company self-reported to the Securities and Exchange
Commission (SEC) and the Department of Justice (DoJ) in the United States as well as to the Serious Fraud
Office (SFO) in the United Kingdom concerning certain of its past dealings with Unaoil and its subsidiaries,
including alleged improper payments made by these entities to third parties. The SFO has commenced an
investigation into this matter. The Company is cooperating fully with the authorities. At this time, it is not
possible for the Company to make an informed judgment about the outcome of these matters.
General
In addition, the Company is aware of proceedings, or the threat of proceedings, against it and others in
respect of private claims by customers and other third parties with regard to certain actual or alleged
anticompetitive practices. Also, the Company is subject to other various legal proceedings, investigations,
and claims that have not yet been resolved. With respect to the above mentioned regulatory matters and
commercial litigation contingencies, the Company will bear the costs of the continuing investigations and
any related legal proceedings.
Liabilities recognized
At December 31, 2016 and 2015, the Company had aggregate liabilities of $150 million and $160 million,
included in “Other provisions” and “Other non-current liabilities”, for the above regulatory, compliance and
legal contingencies, and none of the individual liabilities recognized was significant. As it is not possible to
make an informed judgment on the outcome of certain matters and as it is not possible, based on
information currently available to management, to estimate the maximum potential liability on other
matters, there could be material adverse outcomes beyond the amounts accrued.
Guarantees General
The following table provides quantitative data regarding the Company’s third-party guarantees. The
maximum potential payments represent a “worst-case scenario”, and do not reflect management’s
expected outcomes.
Maximum potential payments ($ in millions) December 31, 2016 December 31, 2015
Performance guarantees 193 209
Financial guarantees 69 77
Indemnification guarantees 71 50
Total 333 336
The carrying amount of liabilities recorded in the Consolidated Balance Sheets reflects the Company’s best
estimate of future payments, which it may incur as part of fulfilling its guarantee obligations. In respect of
the above guarantees, the carrying amounts of liabilities at December 31, 2016 and 2015, were not
significant.
The Company is party to various guarantees providing financial or performance assurances to certain third
parties. These guarantees, which have various maturities up to 2020, mainly consist of performance
guarantees whereby (i) the Company guarantees the performance of a third party’s product or service
according to the terms of a contract and (ii) as member of a consortium that includes third parties, the
Company guarantees not only its own performance but also the work of third parties. Such guarantees
may include guarantees that a project will be completed within a specified time. If the third party does not
fulfill the obligation, the Company will compensate the guaranteed party in cash or in kind. The original
maturity dates for the majority of these performance guarantees range from one to six years.

25 Q4 2016 FINANCIAL INFORMATION
Commercial commitments
In addition, in the normal course of bidding for and executing certain projects, the Company has entered
into standby letters of credit, bid/performance bonds and surety bonds (collectively “performance bonds”)
with various financial institutions. Customers can draw on such performance bonds in the event that the
Company does not fulfill its contractual obligations. The Company would then have an obligation to
reimburse the financial institution for amounts paid under the performance bonds. At December 31, 2016
and 2015, the total outstanding performance bonds aggregated to $7.9 billion and $9.5 billion,
respectively. There have been no significant amounts reimbursed to financial institutions under these
types of arrangements in the year and three months ended December 31, 2016 and 2015.
Product and order-related contingencies
The Company calculates its provision for product warranties based on historical claims experience and
specific review of certain contracts.
The reconciliation of the “Provisions for warranties”, including guarantees of product performance, was as
follows:
($ in millions) 2016 2015
Balance at January 1, 1,089 1,148
Claims paid in cash or in kind (329) (357)
Net increase in provision for changes in estimates, warranties issued and warranties expired 424 377
Exchange rate differences (42) (79)
Balance at December 31, 1,142 1,089
During 2016, the Company determined that the provision for product warranties in its solar business, acquired
in 2013 as part of the purchase of Power-One, was no longer sufficient to cover expected warranty costs in the
remaining warranty period. Due to higher than originally expected product failure rates for certain solar
inverters designed and manufactured by Power-One, a substantial portion of which relates to products which
were delivered to customers prior to the acquisition date, the previously estimated product warranty provision
was increased by a total of $151 million during the year, of which $110 million was recorded in the three months
ended December 31, 2016. The corresponding increases were included in Cost of sales of products and resulted
in a decrease in basic and diluted earnings per share of $0.06 and $0.05, respectively, for the year ended
December 31, 2016, and a decrease of $0.04 (basic and diluted) for the three months ended December 31, 2016.
As $131 million and $92 million of these warranty costs for the year and three months ended December 31, 2016,
respectively, relate to products which were sold prior to the acquisition date, these costs have been excluded
from the Company’s primary measure of segment performance, Operational EBITA (See Note 13). This warranty
provision has been recorded based on the information presently available and is subject to change in the future.
The information for 2015 contained in the table above has been adjusted to correct a classification difference
between Claims paid in cash and kind and Net effect of changes in estimates, warranties issued and warranties
expired.
Note 7
Debt
The Company’s total debt at December 31, 2016 and 2015, amounted to $6,803 million and $7,439 million,
respectively.
Short-term debt and current
maturities of long-term debt
The Company’s “Short-term debt and current maturities of long-term debt” consisted of the following:
($ in millions) December 31, 2016 December 31, 2015
restated
Short-term debt 135 278
Current maturities of long-term debt 868 1,176
Total 1,003 1,454
Short-term debt primarily represented issued commercial paper and short-term loans from various banks.
At December 31, 2016 and 2015, $57 million and $132 million, respectively, was outstanding under the
$2 billion commercial paper program in the United States.
In May 2016, the Company exercised its option to extend the maturity of its $2 billion multicurrency
revolving credit facility to 2021. No amount was drawn at December 31, 2016 and 2015. The facility contains
cross default clauses whereby an event of default would occur if the Company were to default on
indebtedness as defined in the facility, at or above a specified threshold.
In June and October 2016, the Company repaid at maturity the USD 600 million 2.5% Notes and the
CHF 500 million 1.25% Bonds (equivalent to approximately $506 million at date of payment), respectively.
Long-term debt
The Company’s long-term debt at December 31, 2016 and 2015, amounted to $5,800 million and
$5,985 million, respectively.
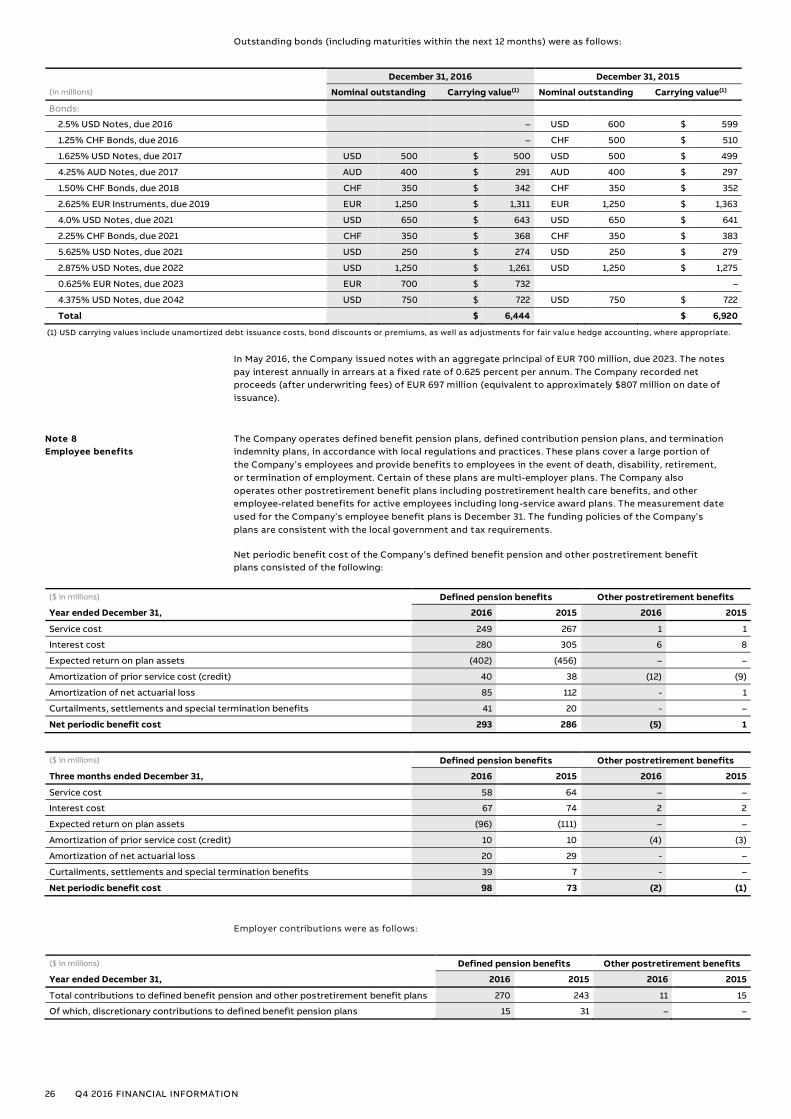
26 Q4 2016 FINANCIAL INFORMATION
Outstanding bonds (including maturities within the next 12 months) were as follows:
December 31, 2016 December 31, 2015
(in millions) Nominal outstanding Carrying value(1) Nominal outstanding Carrying value(1)
Bonds:
2.5% USD Notes, due 2016 – USD 600 $ 599
1.25% CHF Bonds, due 2016 – CHF 500 $ 510
1.625% USD Notes, due 2017 USD 500 $ 500 USD 500 $ 499
4.25% AUD Notes, due 2017 AUD 400 $ 291 AUD 400 $ 297
1.50% CHF Bonds, due 2018 CHF 350 $ 342 CHF 350 $ 352
2.625% EUR Instruments, due 2019 EUR 1,250 $ 1,311 EUR 1,250 $ 1,363
4.0% USD Notes, due 2021 USD 650 $ 643 USD 650 $ 641
2.25% CHF Bonds, due 2021 CHF 350 $ 368 CHF 350 $ 383
5.625% USD Notes, due 2021 USD 250 $ 274 USD 250 $ 279
2.875% USD Notes, due 2022 USD 1,250 $ 1,261 USD 1,250 $ 1,275
0.625% EUR Notes, due 2023 EUR 700 $ 732 –
4.375% USD Notes, due 2042 USD 750 $ 722 USD 750 $ 722
Total $ 6,444 $ 6,920
(1) USD carrying values include unamortized debt issuance costs, bond discounts or premiums, as well as adjustments for fair valu e hedge accounting, where appropriate.
In May 2016, the Company issued notes with an aggregate principal of EUR 700 million, due 2023. The notes
pay interest annually in arrears at a fixed rate of 0.625 percent per annum. The Company recorded net
proceeds (after underwriting fees) of EUR 697 million (equivalent to approximately $807 million on date of
issuance).
Note 8
Employee benefits
The Company operates defined benefit pension plans, defined contribution pension plans, and termination
indemnity plans, in accordance with local regulations and practices. These plans cover a large portion of
the Company’s employees and provide benefits to employees in the event of death, disability, retirement,
or termination of employment. Certain of these plans are multi-employer plans. The Company also
operates other postretirement benefit plans including postretirement health care benefits, and other
employee-related benefits for active employees including long-service award plans. The measurement date
used for the Company’s employee benefit plans is December 31. The funding policies of the Company’s
plans are consistent with the local government and tax requirements.
Net periodic benefit cost of the Company’s defined benefit pension and other postretirement benefit
plans consisted of the following:
($ in millions) Defined pension benefits Other postretirement benefits
Year ended December 31, 2016 2015 2016 2015
Service cost 249 267 1 1
Interest cost 280 305 6 8
Expected return on plan assets (402) (456) – –
Amortization of prior service cost (credit) 40 38 (12) (9)
Amortization of net actuarial loss 85 112 - 1
Curtailments, settlements and special termination benefits 41 20 - –
Net periodic benefit cost 293 286 (5) 1
($ in millions) Defined pension benefits Other postretirement benefits
Three months ended December 31, 2016 2015 2016 2015
Service cost 58 64 – –
Interest cost 67 74 2 2
Expected return on plan assets (96) (111) – –
Amortization of prior service cost (credit) 10 10 (4) (3)
Amortization of net actuarial loss 20 29 - –
Curtailments, settlements and special termination benefits 39 7 - –
Net periodic benefit cost 98 73 (2) (1)
Employer contributions were as follows:
($ in millions) Defined pension benefits Other postretirement benefits
Year ended December 31, 2016 2015 2016 2015
Total contributions to defined benefit pension and other postretirement benefit plans 270 243 11 15
Of which, discretionary contributions to defined benefit pension plans 15 31 – –
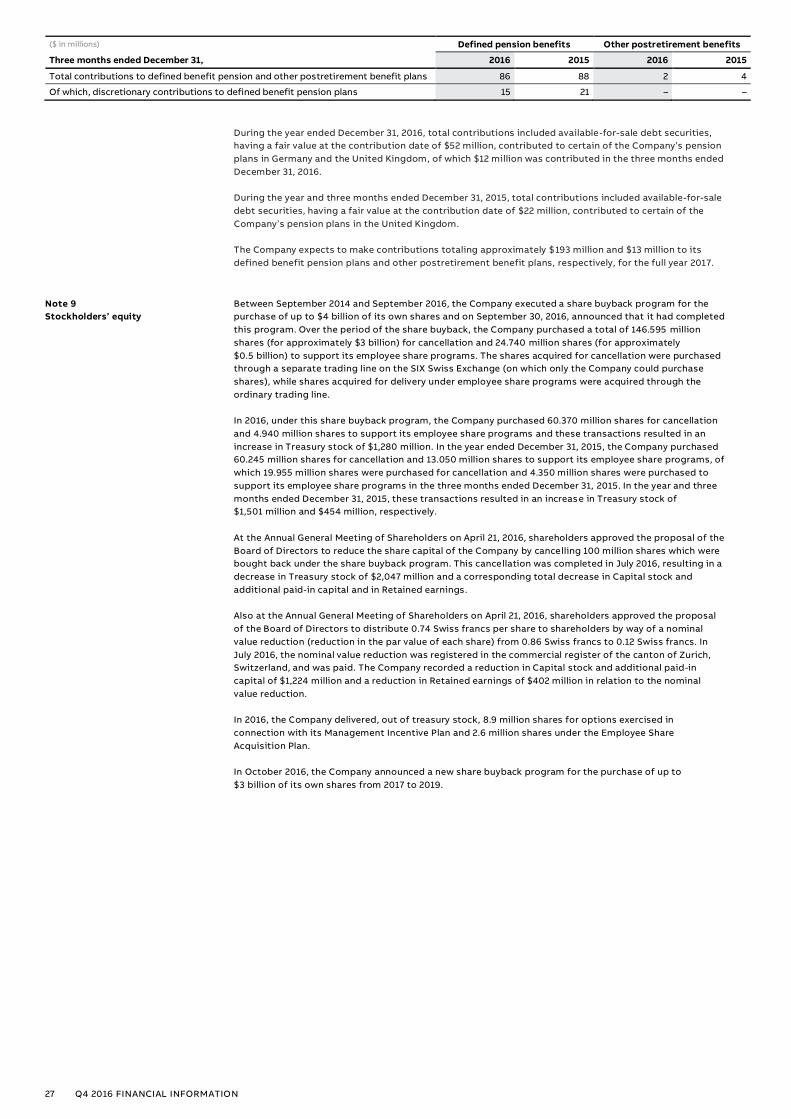
27 Q4 2016 FINANCIAL INFORMATION
($ in millions) Defined pension benefits Other postretirement benefits
Three months ended December 31, 2016 2015 2016 2015
Total contributions to defined benefit pension and other postretirement benefit plans 86 88 2 4
Of which, discretionary contributions to defined benefit pension plans 15 21 – –
During the year ended December 31, 2016, total contributions included available-for-sale debt securities,
having a fair value at the contribution date of $52 million, contributed to certain of the Company’s pension
plans in Germany and the United Kingdom, of which $12 million was contributed in the three months ended
December 31, 2016.
During the year and three months ended December 31, 2015, total contributions included available-for-sale
debt securities, having a fair value at the contribution date of $22 million, contributed to certain of the
Company’s pension plans in the United Kingdom.
The Company expects to make contributions totaling approximately $193 million and $13 million to its
defined benefit pension plans and other postretirement benefit plans, respectively, for the full year 2017.
Note 9
Stockholders’ equity
Between September 2014 and September 2016, the Company executed a share buyback program for the
purchase of up to $4 billion of its own shares and on September 30, 2016, announced that it had completed
this program. Over the period of the share buyback, the Company purchased a total of 146.595 million
shares (for approximately $3 billion) for cancellation and 24.740 million shares (for approximately
$0.5 billion) to support its employee share programs. The shares acquired for cancellation were purchased
through a separate trading line on the SIX Swiss Exchange (on which only the Company could purchase
shares), while shares acquired for delivery under employee share programs were acquired through the
ordinary trading line.
In 2016, under this share buyback program, the Company purchased 60.370 million shares for cancellation
and 4.940 million shares to support its employee share programs and these transactions resulted in an
increase in Treasury stock of $1,280 million. In the year ended December 31, 2015, the Company purchased
60.245 million shares for cancellation and 13.050 million shares to support its employee share programs, of
which 19.955 million shares were purchased for cancellation and 4.350 million shares were purchased to
support its employee share programs in the three months ended December 31, 2015. In the year and three
months ended December 31, 2015, these transactions resulted in an increase in Treasury stock of
$1,501 million and $454 million, respectively.
At the Annual General Meeting of Shareholders on April 21, 2016, shareholders approved the proposal of the
Board of Directors to reduce the share capital of the Company by cancelling 100 million shares which were
bought back under the share buyback program. This cancellation was completed in July 2016, resulting in a
decrease in Treasury stock of $2,047 million and a corresponding total decrease in Capital stock and
additional paid-in capital and in Retained earnings.
Also at the Annual General Meeting of Shareholders on April 21, 2016, shareholders approved the proposal
of the Board of Directors to distribute 0.74 Swiss francs per share to shareholders by way of a nominal
value reduction (reduction in the par value of each share) from 0.86 Swiss francs to 0.12 Swiss francs. In
July 2016, the nominal value reduction was registered in the commercial register of the canton of Zurich,
Switzerland, and was paid. The Company recorded a reduction in Capital stock and additional paid-in
capital of $1,224 million and a reduction in Retained earnings of $402 million in relation to the nominal
value reduction.
In 2016, the Company delivered, out of treasury stock, 8.9 million shares for options exercised in
connection with its Management Incentive Plan and 2.6 million shares under the Employee Share
Acquisition Plan.
In October 2016, the Company announced a new share buyback program for the purchase of up to
$3 billion of its own shares from 2017 to 2019.
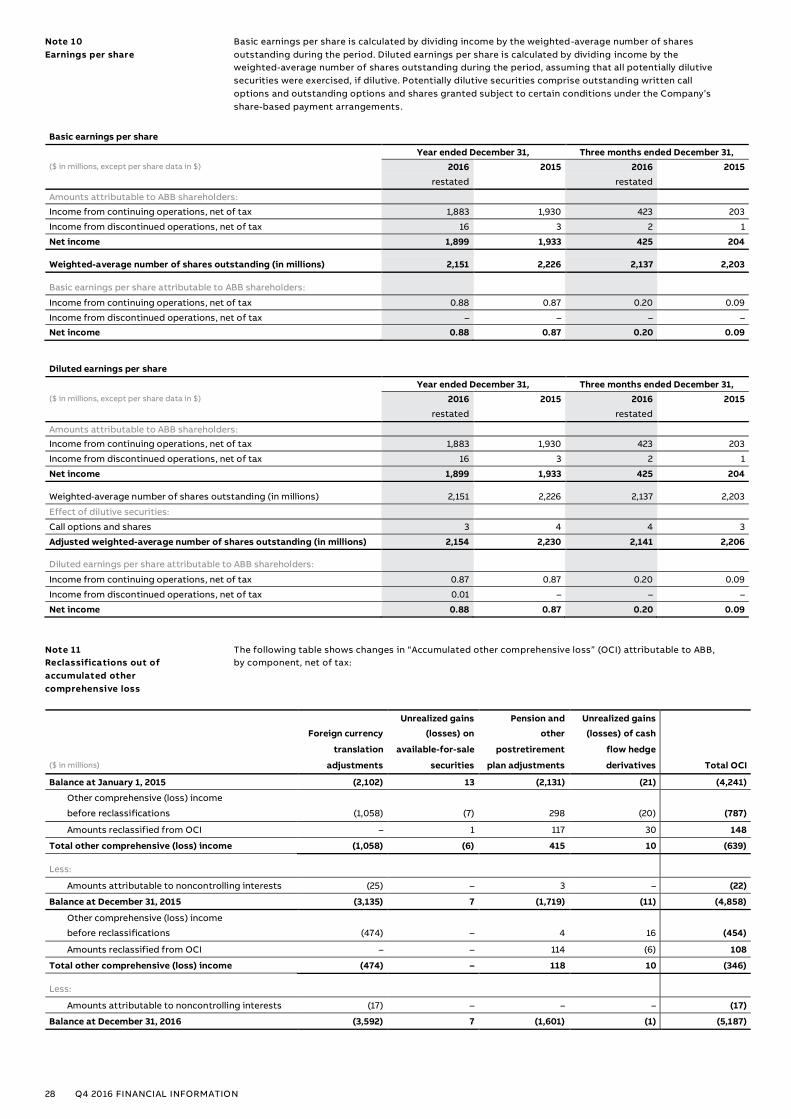
28 Q4 2016 FINANCIAL INFORMATION
Note 10
Earnings per share Basic earnings per share is calculated by dividing income by the weighted-average number of shares
outstanding during the period. Diluted earnings per share is calculated by dividing income by the
weighted-average number of shares outstanding during the period, assuming that all potentially dilutive
securities were exercised, if dilutive. Potentially dilutive securities comprise outstanding written call
options and outstanding options and shares granted subject to certain conditions under the Company’s
share-based payment arrangements.
Basic earnings per share Year ended December 31, Three months ended December 31, ($ in millions, except per share data in $) 2016 2015 2016 2015 restated restated Amounts attributable to ABB shareholders: Income from continuing operations, net of tax 1,883 1,930 423 203 Income from discontinued operations, net of tax 16 3 2 1 Net income 1,899 1,933 425 204 Weighted-average number of shares outstanding (in millions) 2,151 2,226 2,137 2,203 Basic earnings per share attributable to ABB shareholders: Income from continuing operations, net of tax 0.88 0.87 0.20 0.09 Income from discontinued operations, net of tax – – – – Net income 0.88 0.87 0.20 0.09 Diluted earnings per share Year ended December 31, Three months ended December 31, ($ in millions, except per share data in $) 2016 2015 2016 2015 restated restated Amounts attributable to ABB shareholders: Income from continuing operations, net of tax 1,883 1,930 423 203 Income from discontinued operations, net of tax 16 3 2 1 Net income 1,899 1,933 425 204 Weighted-average number of shares outstanding (in millions) 2,151 2,226 2,137 2,203 Effect of dilutive securities: Call options and shares 3 4 4 3 Adjusted weighted-average number of shares outstanding (in millions) 2,154 2,230 2,141 2,206 Diluted earnings per share attributable to ABB shareholders: Income from continuing operations, net of tax 0.87 0.87 0.20 0.09 Income from discontinued operations, net of tax 0.01 – – – Net income 0.88 0.87 0.20 0.09
Note 11
Reclassifications out of
accumulated other
comprehensive loss
The following table shows changes in “Accumulated other comprehensive loss” (OCI) attributable to ABB,
by component, net of tax:
Unrealized gains Pension and Unrealized gains
Foreign currency (losses) on other (losses) of cash
translation available-for-sale postretirement flow hedge
($ in millions) adjustments securities plan adjustments derivatives Total OCI
Balance at January 1, 2015 (2,102) 13 (2,131) (21) (4,241)
Other comprehensive (loss) income
before reclassifications (1,058) (7) 298 (20) (787)
Amounts reclassified from OCI – 1 117 30 148
Total other comprehensive (loss) income (1,058) (6) 415 10 (639)
Less:
Amounts attributable to noncontrolling interests (25) – 3 – (22)
Balance at December 31, 2015 (3,135) 7 (1,719) (11) (4,858)
Other comprehensive (loss) income
before reclassifications (474) – 4 16 (454)
Amounts reclassified from OCI – – 114 (6) 108
Total other comprehensive (loss) income (474) – 118 10 (346)
Less:
Amounts attributable to noncontrolling interests (17) – – – (17)
Balance at December 31, 2016 (3,592) 7 (1,601) (1) (5,187)

29 Q4 2016 FINANCIAL INFORMATION
The following table reflects amounts reclassified out of OCI in respect of pension and other
postretirement plan adjustments and unrealized gains (losses) of cash flow hedge derivatives:
Year ended Three months ended
($ in millions) Location of (gains) losses December 31, December 31,
Details about OCI components reclassified from OCI 2016 2015 2016 2015
Pension and other postretirement plan adjustments:
Amortization of prior service cost Net periodic benefit cost(1) 28 29 6 7
Amortization of net actuarial loss Net periodic benefit cost(1) 85 113 20 29
Net losses from pension settlements Net periodic benefit cost(1) 37 15 37 3
Total before tax 150 157 63 39
Tax Provision for taxes (36) (40) (16) (10)
Amounts reclassified from OCI 114 117 47 29
Unrealized gains (losses) of cash flow hedge derivatives:
Foreign exchange contracts Total revenues 11 36 2 5
Total cost of sales (10) (11) (1) (3)
Commodity contracts Total cost of sales 2 10 – 3
Cash-settled call options SG&A expenses(2) (10) 4 2 (2)
Total before tax (7) 39 3 3
Tax Provision for taxes 1 (9) – (1)
Amounts reclassified from OCI (6) 30 3 2
(1) These components are included in the computation of net periodic benefit cost (see Note 8).
(2) SG&A expenses represent “Selling, general and administrative expenses”.
The amounts in respect of Unrealized gains (losses) on available-for-sale securities were not significant for
the year and three months ended December 31, 2016 and 2015.
Note 12
Restructuring and related
expenses
White Collar Productivity program
In September 2015, the Company announced a two-year program aimed at making the Company leaner, faster
and more customer-focused. Productivity improvements include the rapid expansion and use of regional shared
service centers as well as the streamlining of global operations and head office functions, with business units
moving closer to their respective key markets. In the course of this program, the Company is implementing and
executing various restructuring initiatives across all operating segments and regions.
The following table outlines the costs incurred in the year and three months ended December 31, 2016, the
cumulative costs incurred to date and the total amount of costs expected to be incurred under the program per
operating segment:
Costs incurred Cumulative costs
Year ended December 31, Three months ended December 31, incurred up to Total
($ in millions) 2016 2015 2016 2015 December 31, 2016 expected costs(1)
Electrification Products 14 73 (11) 71 87 89
Discrete Automation and Motion 27 45 (6) 42 72 74
Process Automation 36 96 (37) 86 132 134
Power Grids 33 70 (17) 68 103 105
Corporate and Other 30 86 (19) 85 116 118
Total 140 370 (90) 352 510 520
(1) Total expected costs have been recast to reflect the reorganization of the Company’s operating segments as outlined in Note 13.
Total expected program costs were originally estimated to be $852 million. During 2016, the total expected
program costs were reduced by $332 million, of which $111 million was in the three months ended December 31,
2016. This was primarily due to the realization of significantly higher than originally expected attrition and
internal re-deployment rates. The reductions were made across all operating segments as well as for corporate
functions.
Of the total expected costs of $520 million, the majority is related to employee severance costs.
The Company recorded the following expenses, net of changes in estimates, under this program:
Year ended Three months ended Cumulative costs
December 31, December 31, incurred up to
($ in millions) 2016 2015 2016 2015 December 31, 2016
Employee severance costs 130 364 (99) 346 494
Estimated contract settlement, loss order and other costs 2 5 1 5 7
Inventory and long-lived asset impairments 8 1 8 1 9
Total 140 370 (90) 352 510

30 Q4 2016 FINANCIAL INFORMATION
Expenses, net of change in estimates, associated with this program are recorded in the following line items in
the Consolidated Income Statements:
Year ended December 31, Three months ended December 31,
($ in millions) 2016 2015 2016 2015
Total cost of sales 92 122 (47) 113
Selling, general and administrative expenses 38 187 (39) 183
Non-order related research and development expenses (5) 38 (12) 34
Other income (expense), net 15 23 8 22
Total 140 370 (90) 352
Liabilities associated with the White Collar Productivity program are primarily included in “Other provisions”. The
following table shows the activity from the beginning of the program to December 31, 2016, by expense type.
Employee Contract settlement,
($ in millions) severance costs loss order and other costs Total
Liability at January 1, 2015 – – –
Expenses 364 5 369
Cash payments (34) (1) (35)
Liability at December 31, 2015 330 4 334
Expenses 232 3 235
Cash payments (106) (3) (109)
Change in estimates (102) (1) (103)
Exchange rate differences (23) – (23)
Liability at December 31, 2016 331 3 334
The change in estimates during 2016 of $103 million is due to significantly higher than expected rates of
attrition and internal re-deployment and a lower than expected severance cost per employee for the employee
groups affected by the first phase of restructuring initiated in 2015. The reduction in the liability was recorded
in income from operations, primarily as reductions in Cost of sales of $49 million and in Selling, general and
administrative expenses of $38 million for the year ended December 31, 2016. During the three months ended
December 31, 2016, the change in estimate was $114 million, and related to restructurings initiated in both 2015
and 2016. This reduction was recorded primarily as reductions in Cost of sales of $52 million and in Selling,
general and administrative expenses of $45 million for the three months ended December 31, 2016.
Other restructuring-related activities In the year ended December 31, 2016 and 2015, the Company executed various other restructuring-related
activities and incurred expenses of $171 million and $256 million, respectively. In the three months ended
December 31, 2016 and 2015, these expenses amounted to $80 million and $144 million, respectively. These
expenses were primarily recorded in “Total cost of sales”.
Year ended December 31, Three months ended December 31,
($ in millions) 2016 2015 2016 2015
Employee severance costs 90 207 31 130
Estimated contract settlement, loss order and other costs 40 27 21 11
Inventory and long-lived asset impairments 41 22 28 3
Total 171 256 80 144
At December 31, 2016 and 2015, the balance of other restructuring-related liabilities is primarily included in
“Other provisions”.
Change in estimates In addition to the change in estimate of $103 million relating to the White Collar Productivity Program, a further
$46 million was recorded as a change in estimate to reduce liabilities associated with the Company’s other
restructuring-related activities mainly due to changes in the planned scope of these activities. This was
recorded in income from operations, primarily as reductions in Cost of sales. The combined total change in
estimates for both the year and three months ended December 31, 2016, of $149 million and $139 million,
respectively, resulted in an increase in earnings per share (basic and diluted) of $0.05 in the respective periods.
Note 13
Operating segment data
The Chief Operating Decision Maker (CODM) is the Chief Executive Officer. The CODM allocates resources to
and assesses the performance of each operating segment using the information outlined below. The
Company’s operating segments consist of Electrification Products, Discrete Automation and Motion,
Process Automation and Power Grids. The remaining operations of the Company are included in Corporate
and Other.
Effective January 1, 2016, the Company reorganized its operating segments with the aim of delivering more
customer value in a better, more focused way from its combined power and automation offering. The new
Electrification Products segment includes the business of the former Low Voltage Products segment and
the Medium Voltage Products business from the former Power Products segment. The Process Automation
segment has been expanded to include the Distributed Control Systems business from the former Power
Systems segment, while the remaining businesses of the former Power Products and Power Systems
segments were combined to form the new Power Grids segment. There were no significant changes to the
Discrete Automation and Motion segment.
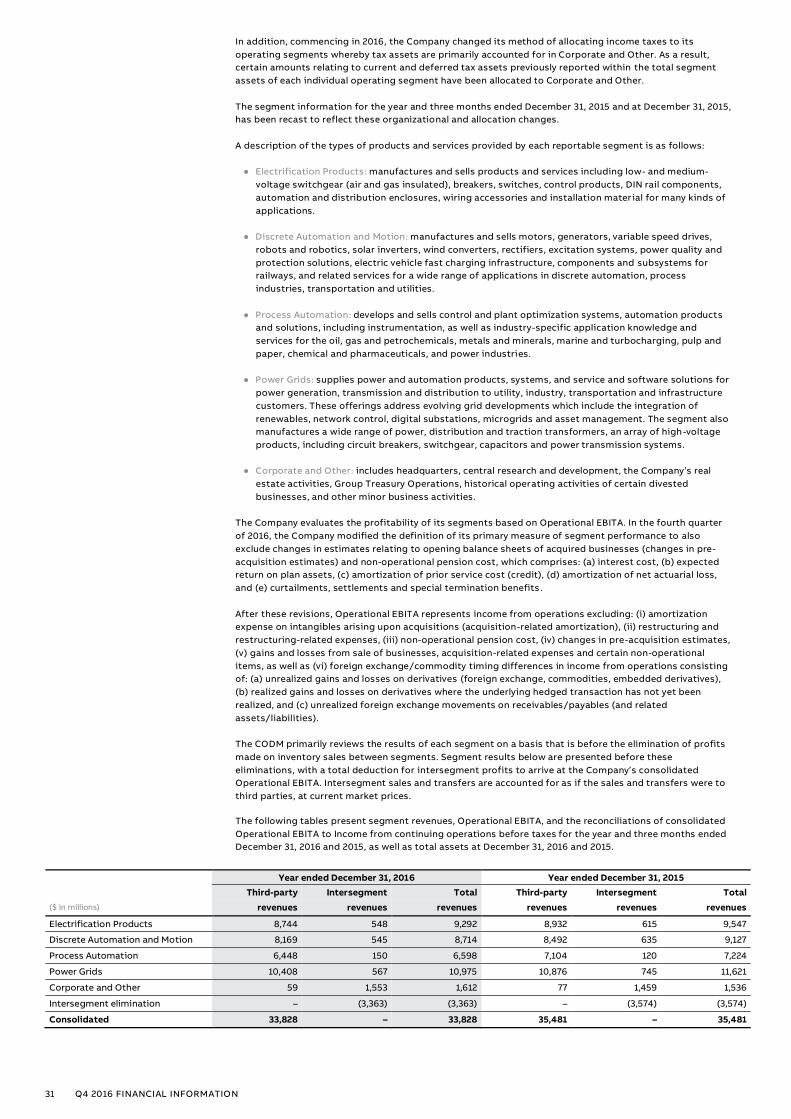
31 Q4 2016 FINANCIAL INFORMATION
In addition, commencing in 2016, the Company changed its method of allocating income taxes to its
operating segments whereby tax assets are primarily accounted for in Corporate and Other. As a result,
certain amounts relating to current and deferred tax assets previously reported within the total segment
assets of each individual operating segment have been allocated to Corporate and Other.
The segment information for the year and three months ended December 31, 2015 and at December 31, 2015,
has been recast to reflect these organizational and allocation changes.
A description of the types of products and services provided by each reportable segment is as follows:
● Electrification Products: manufactures and sells products and services including low- and medium-
voltage switchgear (air and gas insulated), breakers, switches, control products, DIN rail components,
automation and distribution enclosures, wiring accessories and installation material for many kinds of
applications.
● Discrete Automation and Motion: manufactures and sells motors, generators, variable speed drives,
robots and robotics, solar inverters, wind converters, rectifiers, excitation systems, power quality and
protection solutions, electric vehicle fast charging infrastructure, components and subsystems for
railways, and related services for a wide range of applications in discrete automation, process
industries, transportation and utilities.
● Process Automation: develops and sells control and plant optimization systems, automation products
and solutions, including instrumentation, as well as industry-specific application knowledge and
services for the oil, gas and petrochemicals, metals and minerals, marine and turbocharging, pulp and
paper, chemical and pharmaceuticals, and power industries.
● Power Grids: supplies power and automation products, systems, and service and software solutions for
power generation, transmission and distribution to utility, industry, transportation and infrastructure
customers. These offerings address evolving grid developments which include the integration of
renewables, network control, digital substations, microgrids and asset management. The segment also
manufactures a wide range of power, distribution and traction transformers, an array of high -voltage
products, including circuit breakers, switchgear, capacitors and power transmission systems.
● Corporate and Other: includes headquarters, central research and development, the Company’s real
estate activities, Group Treasury Operations, historical operating activities of certain divested
businesses, and other minor business activities.
The Company evaluates the profitability of its segments based on Operational EBITA. In the fourth quarter
of 2016, the Company modified the definition of its primary measure of segment performance to also
exclude changes in estimates relating to opening balance sheets of acquired businesses (changes in pre-
acquisition estimates) and non-operational pension cost, which comprises: (a) interest cost, (b) expected
return on plan assets, (c) amortization of prior service cost (credit), (d) amortization of net actuarial loss,
and (e) curtailments, settlements and special termination benefits.
After these revisions, Operational EBITA represents income from operations excluding: (i) amortization
expense on intangibles arising upon acquisitions (acquisition-related amortization), (ii) restructuring and
restructuring-related expenses, (iii) non-operational pension cost, (iv) changes in pre-acquisition estimates,
(v) gains and losses from sale of businesses, acquisition-related expenses and certain non-operational
items, as well as (vi) foreign exchange/commodity timing differences in income from operations consisting
of: (a) unrealized gains and losses on derivatives (foreign exchange, commodities, embedded derivatives),
(b) realized gains and losses on derivatives where the underlying hedged transaction has not yet been
realized, and (c) unrealized foreign exchange movements on receivables/payables (and related
assets/liabilities).
The CODM primarily reviews the results of each segment on a basis that is before the elimination of profits
made on inventory sales between segments. Segment results below are presented before these
eliminations, with a total deduction for intersegment profits to arrive at the Company’s consolidated
Operational EBITA. Intersegment sales and transfers are accounted for as if the sales and transfers were to
third parties, at current market prices.
The following tables present segment revenues, Operational EBITA, and the reconciliations of consolidated
Operational EBITA to Income from continuing operations before taxes for the year and three months ended
December 31, 2016 and 2015, as well as total assets at December 31, 2016 and 2015.
Year ended December 31, 2016 Year ended December 31, 2015
Third-party Intersegment Total Third-party Intersegment Total
($ in millions) revenues revenues revenues revenues revenues revenues
Electrification Products 8,744 548 9,292 8,932 615 9,547
Discrete Automation and Motion 8,169 545 8,714 8,492 635 9,127
Process Automation 6,448 150 6,598 7,104 120 7,224
Power Grids 10,408 567 10,975 10,876 745 11,621
Corporate and Other 59 1,553 1,612 77 1,459 1,536
Intersegment elimination – (3,363) (3,363) – (3,574) (3,574)
Consolidated 33,828 – 33,828 35,481 – 35,481

32 Q4 2016 FINANCIAL INFORMATION
Three months ended December 31, 2016 Three months ended December 31, 2015
Third-party Intersegment Total Third-party Intersegment Total
($ in millions) revenues revenues revenues revenues revenues revenues
Electrification Products 2,318 144 2,462 2,294 165 2,459
Discrete Automation and Motion 2,079 132 2,211 2,109 179 2,288
Process Automation 1,700 37 1,737 1,892 34 1,926
Power Grids 2,878 164 3,042 2,927 180 3,107
Corporate and Other 18 393 411 20 346 366
Intersegment elimination – (870) (870) – (904) (904)
Consolidated 8,993 – 8,993 9,242 – 9,242
Year ended December 31, Three months ended December 31,
($ in millions) 2016 2015 2016 2015
restated restated
Operational EBITA:
Electrification Products 1,528 1,561 382 403
Discrete Automation and Motion 1,195 1,295 260 291
Process Automation 824 863 231 235
Power Grids 1,021 877 318 293
Corporate and Other and Intersegment elimination (377) (387) (134) (121)
Consolidated Operational EBITA 4,191 4,209 1,057 1,101
Acquisition-related amortization (279) (310) (67) (73)
Restructuring and restructuring-related expenses(1) (543) (674) (68) (531)
Non-operational pension cost (38) (19) (38) (8)
Changes in pre-acquisition estimates (131) (21) (92) (12)
Gains and losses from sale of businesses, acquisition-related expenses
and certain non-operational items (173) (120) (127) (76)
Foreign exchange/commodity timing differences in income from operations:
Unrealized gains and losses on derivatives (foreign exchange,
commodities, embedded derivatives) (65) 67 (22) (13)
Realized gains and losses on derivatives where the underlying hedged
transaction has not yet been realized (5) (68) (16) (18)
Unrealized foreign exchange movements on receivables/payables (and
related assets/liabilities) 30 (15) 51 (23)
Income from operations 2,987 3,049 678 347
Interest and dividend income 73 77 19 21
Interest and other finance expense (261) (286) (31) (63)
Income from continuing operations before taxes 2,799 2,840 666 305
(1) Amounts also include the incremental implementation costs in relation to the White Collar Productivity program.
Total assets(1)
($ in millions) December 31, 2016 December 31, 2015
restated
Electrification Products 9,523 9,474
Discrete Automation and Motion 8,465 9,223
Process Automation 4,153 4,662
Power Grids 8,980 9,422
Corporate and Other 8,378 8,575
Consolidated 39,499 41,356
(1) Total assets are after intersegment eliminations and therefore reflect third-party assets only.
Realignment of segments On October 4, 2016, the Company announced a planned change in the composition of the business
portfolio of its four segments. Effective January 1, 2017, the scope of the Electrification Products segment
has been expanded to include the electric vehicle charging, solar, and power quality businesses from the
Discrete Automation and Motion segment.
In addition, the Discrete Automation and Motion segment has been renamed the Robotics and Motion
segment while the Process Automation segment has been renamed the Industrial Automation segment.

33 Q4 2016 FINANCIAL INFORMATION

34 Q4 2016 FINANCIAL INFORMATION
— FINANCIAL INFORMATION
Supplemental Reconciliations and Definitions
The following reconciliations and definitions include measures which ABB uses to supplement its Interim
Consolidated Financial Information (unaudited) which is prepared in accordance with United States
generally accepted accounting principles (U.S. GAAP). Certain of these financial measures are, or may be,
considered non-GAAP financial measures as defined in the rules of the U.S. Securities and Exchange
Commission (SEC).
While ABB’s management believes that the non-GAAP financial measures herein are useful in evaluating
ABB’s operating results, this information should be considered as supplemental in nature and not as a
substitute for the related financial information prepared in accordance with U.S. GAAP. Therefore these
measures should not be viewed in isolation but considered together with the Interim Consolidated
Financial Information (unaudited) prepared in accordance with U.S. GAAP as of and for the year and three
months ended December 31, 2016.
Comparable growth rates
Growth rates for certain key figures may be presented and discussed on a “comparable” basis. The
comparable growth rate measures growth on a constant currency basis. Since we are a global company,
the comparability of our operating results reported in U.S. dollars is affected by foreign currency exchange
rate fluctuations. We calculate the impacts from foreign currency fluctuations by translati ng the current-
year periods’ reported key figures into U.S. dollar amounts using the exchange rates in effect for the
comparable periods in the previous year.
Comparable growth rates are also adjusted for changes in our business portfolio. Adjustments to our
business portfolio occur due to acquisitions, divestments, or by exiting specific business activities or
customer markets. The adjustment for portfolio changes is calculated as follows: where the results of any
business acquired or divested have not been consolidated and reported for the entire duration of both the
current and comparable periods, the reported key figures of such business are adjusted to exclude the
relevant key figures of any corresponding quarters which are not comparable when computing the
comparable growth rate. Certain portfolio changes which do not qualify as divestments under U.S. GAAP
have been treated in a similar manner to divestments. Changes in our portfolio where we have exited
certain business activities or customer markets are adjusted as if the relevant business was divested in the
period when the decision to cease business activities was taken. We do not adjust for portfolio changes
where the relevant business has annualized revenues of less than $50 million.
The following tables provide reconciliations of reported growth rates of certain key figures to their
respective comparable growth rate.
Divisional comparable growth rate reconciliation
Q4 2016 compared to Q4 2015
Order growth rate Revenue growth rate
US$ Foreign US$ Foreign
(as exchange Portfolio (as exchange Portfolio
Division reported) impact changes Comparable reported) impact changes Comparable
Electrification Products -8% 3% 0% -5% 0% 3% 0% 3%
Discrete Automation and Motion 1% 3% 0% 4% -3% 2% 0% -1%
Process Automation -15% 1% 0% -14% -10% 2% 0% -8%
Power Grids 10% 2% 3% 15% -2% 3% 3% 4%
ABB Group 0% 2% 1% 3% -3% 3% 1% 1%
FY 2016 compared to FY 2015
Order growth rate Revenue growth rate
US$ Foreign US$ Foreign
(as exchange Portfolio (as exchange Portfolio
Division reported) impact changes Comparable reported) impact changes Comparable
Electrification Products -7% 3% 0% -4% -3% 4% 0% 1%
Discrete Automation and Motion -6% 2% 0% -4% -5% 3% 0% -2%
Process Automation -20% 2% 0% -18% -9% 3% 0% -6%
Power Grids -8% 3% 1% -4% -6% 3% 4% 1%
ABB Group -8% 3% 0% -5% -5% 3% 1% -1%
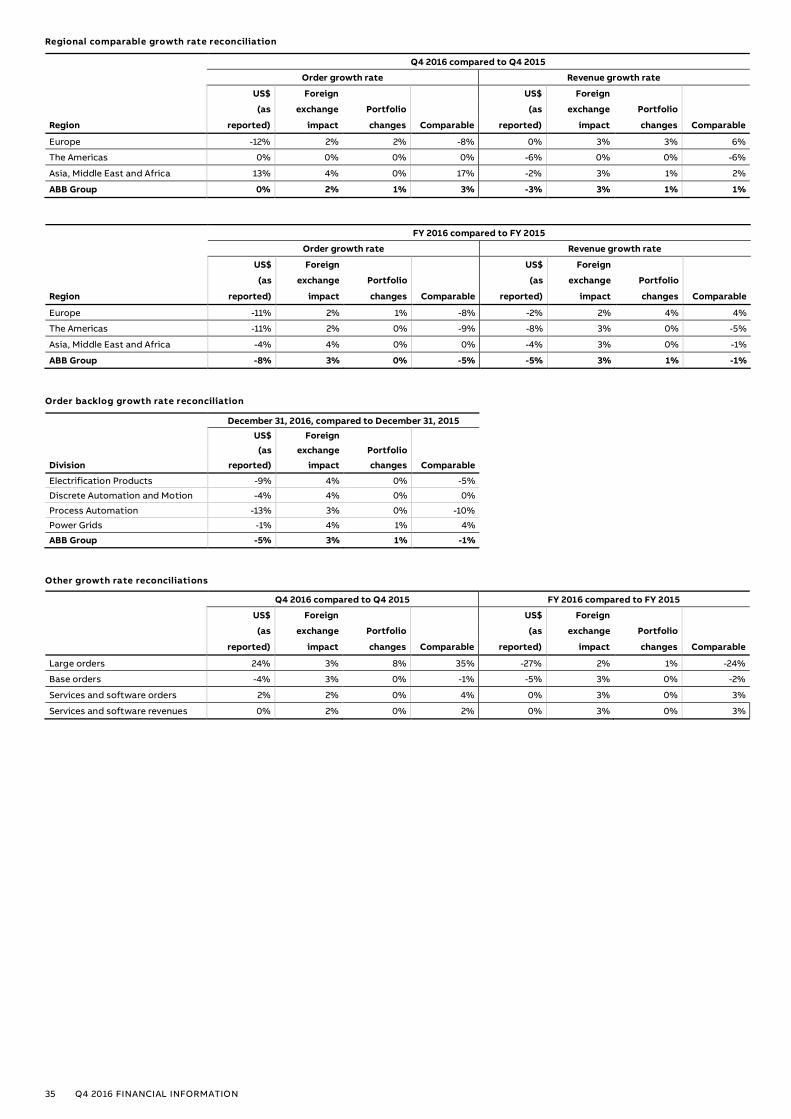
35 Q4 2016 FINANCIAL INFORMATION
Regional comparable growth rate reconciliation
Q4 2016 compared to Q4 2015
Order growth rate Revenue growth rate
US$ Foreign US$ Foreign
(as exchange Portfolio (as exchange Portfolio
Region reported) impact changes Comparable reported) impact changes Comparable
Europe -12% 2% 2% -8% 0% 3% 3% 6%
The Americas 0% 0% 0% 0% -6% 0% 0% -6%
Asia, Middle East and Africa 13% 4% 0% 17% -2% 3% 1% 2%
ABB Group 0% 2% 1% 3% -3% 3% 1% 1%
FY 2016 compared to FY 2015
Order growth rate Revenue growth rate
US$ Foreign US$ Foreign
(as exchange Portfolio (as exchange Portfolio
Region reported) impact changes Comparable reported) impact changes Comparable
Europe -11% 2% 1% -8% -2% 2% 4% 4%
The Americas -11% 2% 0% -9% -8% 3% 0% -5%
Asia, Middle East and Africa -4% 4% 0% 0% -4% 3% 0% -1%
ABB Group -8% 3% 0% -5% -5% 3% 1% -1%
Order backlog growth rate reconciliation
December 31, 2016, compared to December 31, 2015
US$ Foreign
(as exchange Portfolio
Division reported) impact changes Comparable
Electrification Products -9% 4% 0% -5%
Discrete Automation and Motion -4% 4% 0% 0%
Process Automation -13% 3% 0% -10%
Power Grids -1% 4% 1% 4%
ABB Group -5% 3% 1% -1%
Other growth rate reconciliations
Q4 2016 compared to Q4 2015 FY 2016 compared to FY 2015
US$ Foreign US$ Foreign
(as exchange Portfolio (as exchange Portfolio
reported) impact changes Comparable reported) impact changes Comparable
Large orders 24% 3% 8% 35% -27% 2% 1% -24%
Base orders -4% 3% 0% -1% -5% 3% 0% -2%
Services and software orders 2% 2% 0% 4% 0% 3% 0% 3%
Services and software revenues 0% 2% 0% 2% 0% 3% 0% 3%

36 Q4 2016 FINANCIAL INFORMATION
Division realignment: Effective January 1, 2016, we have realigned our organizational structure to better address customer needs
and deliver operational efficiency. Our new streamlined structure is comprised of four operating divisions:
Power Grids, Electrification Products, Discrete Automation and Motion and Process Automation. In
addition, the operations of certain previously divested businesses have been excluded from the results of
the four divisions (but are included in the total ABB Group) for the periods prior to their respective
divestment. See Note 13 to the Interim Consolidated Financial Information (unaudited) for further details
on the realignment.
The following information presents a reconciliation of growth rates of orders and revenues for 2015
compared with 2014 to reflect these organizational changes:
Divisional comparable growth rate reconciliation:
Q4 2015 compared to Q4 2014
Order growth rate Revenue growth rate
US$ Foreign US$ Foreign
(as exchange Portfolio (as exchange Portfolio
Division reported) impact changes Comparable reported) impact changes Comparable
Electrification Products -7% 9% 0% 2% -10% 9% 0% -1%
Discrete Automation and Motion -17% 8% 0% -9% -11% 7% 0% -4%
Process Automation -14% 11% 0% -3% -16% 10% 0% -6%
Power Grids -7% 9% 1% 3% -8% 9% -1% 0%
ABB Group -12% 9% 1% -2% -11% 9% 0% -2%
FY 2015 compared to FY 2014
Order growth rate Revenue growth rate
US$ Foreign US$ Foreign
(as exchange Portfolio (as exchange Portfolio
Division reported) impact changes Comparable reported) impact changes Comparable
Electrification Products -9% 9% 0% 0% -10% 10% 0% 0%
Discrete Automation and Motion -13% 8% 0% -5% -10% 8% 0% -2%
Process Automation -20% 11% 0% -9% -16% 11% 0% -5%
Power Grids -4% 12% 0% 8% -7% 10% -1% 2%
ABB Group -12% 10% 1% -1% -11% 10% 1% 0%
Adjusted services and software
revenues as a percentage of total
revenues
Adjusted services and software revenues as a percentage of total revenues is calculated as Sales of services
and software divided by Total revenues, after reducing both amounts by the amount of revenues recorded
for businesses which have subsequently been divested. Total revenues are also adjusted when we have
exited certain business activities or customer markets as if the relevant business was divested in the
period when the decision to cease business activities was taken. We do not adjust for portfolio changes
where the relevant business has annualized revenues of less than $50 million.
Year ended December 31, Three months ended December 31,
($ in millions, unless otherwise indicated) 2016 2015 2016 2015
Adjusted services and software revenues as a percentage of total revenues
Sales of services and software 6,012 6,004 1,654 1,643
Adjusted services and software revenues 6,012 6,004 1,654 1,643
Total revenues 33,828 35,481 8,993 9,242
Total revenues in divested/exited businesses (134) (574) (44) (131)
Adjusted total revenues 33,694 34,907 8,949 9,111
Adjusted services and software revenues as a percentage of total revenues 17.8% 17.2% 18.5% 18.0%

37 Q4 2016 FINANCIAL INFORMATION
Operational EBITA margin In the fourth quarter of 2016, the Company modified the definition of Operational EBITA to also exclude
the amount of non-operational pension cost and impacts from changes in estimates relating to opening
balance sheets of acquired businesses (changes in pre-acquisition estimates). The new definition is
provided below. The restated reconciliations for prior periods can be below in the section “Reconciliation
of Operational EBITA margin by division for prior periods”.
Definition
Operational EBITA margin
Operational EBITA margin is Operational EBITA as a percentage of Operational revenues.
Operational EBITA
Operational earnings before interest, taxes and acquisition-related amortization (Operational EBITA)
represents Income from operations: excluding (i) acquisition-related amortization (as defined below), (ii)
restructuring and restructuring-related expenses, (iii) non-operational pension cost (as defined below),
(iv) changes in pre-acquisition estimates, (v) gains and losses from sale of businesses, acquisition-related
expenses and certain non-operational items, as well as (vi) foreign exchange/commodity timing
differences in income from operations consisting of: (a) unrealized gains and losses on derivatives (foreign
exchange, commodities, embedded derivatives), (b) realized gains and losses on derivatives where the
underlying hedged transaction has not yet been realized, and (c) unrealized foreign exchange movements
on receivables/payables (and related assets/liabilities). Operational EBITA is our measure of segment
profit but is also used by management to evaluate the profitability of the Company as a whole.
Acquisition-related amortization
Amortization expense on intangibles arising upon acquisitions.
Operational revenues
The Company presents Operational revenues solely for the purpose of allowing the computation of
Operational EBITA margin. Operational revenues are total revenues adjusted for foreign
exchange/commodity timing differences in total revenues of: (i) unrealized gains and losses on derivatives,
(ii) realized gains and losses on derivatives where the underlying hedged transaction has not yet been
realized, and (iii) unrealized foreign exchange movements on receivables (and related assets). Operational
revenues are not intended to be an alternative measure to Total Revenues, which represent our revenues
measured in accordance with U.S. GAAP.
Non-operational pension cost
Non-operational pension cost comprises the total net periodic benefit cost of defined pension benefits
and other postretirement benefits but excludes the current service cost of both components. A breakdown
of the components of non-operational pension cost is provided below.
Reconciliation The following tables provide reconciliations of consolidated Operational EBITA to Net Income and
Operational EBITA Margin by division.
Reconciliation of consolidated
Operational EBITA to Net Income
\
Year ended December 31, Three months ended December 31,
($ in millions) 2016 2015 2016 2015
restated restated
Operational EBITA 4,191 4,209 1,057 1,101
Acquisition-related amortization (279) (310) (67) (73)
Restructuring and restructuring-related expenses(1) (543) (674) (68) (531)
Non-operational pension cost (38) (19) (38) (8)
Changes in pre-acquisition estimates (131) (21) (92) (12)
Gains and losses from sale of businesses, acquisition-related expenses
and certain non-operational items (173) (120) (127) (76)
Foreign exchange/commodity timing differences in income from operations:
Unrealized gains and losses on derivatives (foreign exchange,
commodities, embedded derivatives) (65) 67 (22) (13)
Realized gains and losses on derivatives where the underlying hedged
transaction has not yet been realized (5) (68) (16) (18)
Unrealized foreign exchange movements on receivables/payables (and
related assets/liabilities) 30 (15) 51 (23)
Income from operations 2,987 3,049 678 347
Interest and dividend income 73 77 19 21
Interest and other finance expense (261) (286) (31) (63)
Income from continuing operations before taxes 2,799 2,840 666 305
Provision for taxes (781) (788) (194) (66)
Income from continuing operations, net of tax 2,018 2,052 472 239
Income from discontinued operations, net of tax 16 3 2 1
Net income 2,034 2,055 474 240
(1) Amounts also include the incremental implementation costs in relation to the White Collar Productivity program.
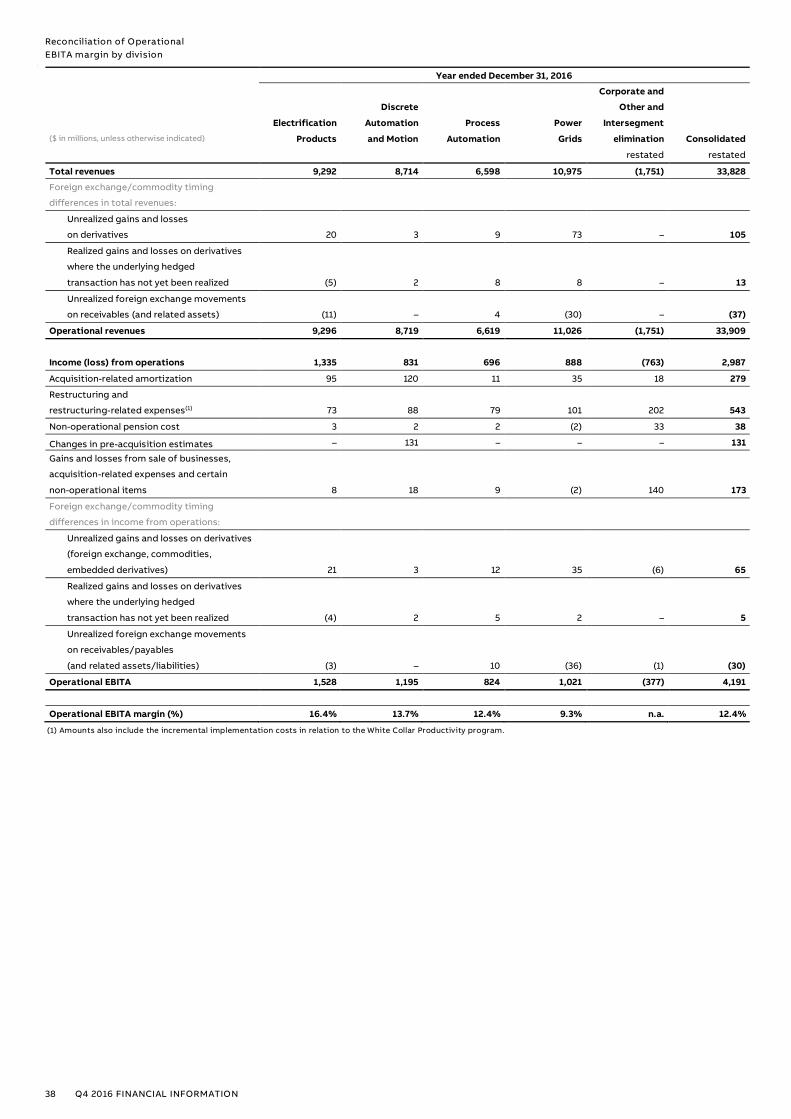
38 Q4 2016 FINANCIAL INFORMATION
Reconciliation of Operational
EBITA margin by division
\
Year ended December 31, 2016
Corporate and
Discrete Other and
Electrification Automation Process Power Intersegment
($ in millions, unless otherwise indicated) Products and Motion Automation Grids elimination Consolidated
restated restated
Total revenues 9,292 8,714 6,598 10,975 (1,751) 33,828
Foreign exchange/commodity timing
differences in total revenues:
Unrealized gains and losses
on derivatives 20 3 9 73 – 105
Realized gains and losses on derivatives
where the underlying hedged
transaction has not yet been realized (5) 2 8 8 – 13
Unrealized foreign exchange movements
on receivables (and related assets) (11) – 4 (30) – (37)
Operational revenues 9,296 8,719 6,619 11,026 (1,751) 33,909
Income (loss) from operations 1,335 831 696 888 (763) 2,987
Acquisition-related amortization 95 120 11 35 18 279
Restructuring and
restructuring-related expenses(1) 73 88 79 101 202 543
Non-operational pension cost 3 2 2 (2) 33 38
Changes in pre-acquisition estimates – 131 – – – 131
Gains and losses from sale of businesses,
acquisition-related expenses and certain
non-operational items 8 18 9 (2) 140 173
Foreign exchange/commodity timing
differences in income from operations:
Unrealized gains and losses on derivatives
(foreign exchange, commodities,
embedded derivatives) 21 3 12 35 (6) 65
Realized gains and losses on derivatives
where the underlying hedged
transaction has not yet been realized (4) 2 5 2 – 5
Unrealized foreign exchange movements
on receivables/payables
(and related assets/liabilities) (3) – 10 (36) (1) (30)
Operational EBITA 1,528 1,195 824 1,021 (377) 4,191
Operational EBITA margin (%) 16.4% 13.7% 12.4% 9.3% n.a. 12.4%
(1) Amounts also include the incremental implementation costs in relation to the White Collar Productivity program.

39 Q4 2016 FINANCIAL INFORMATION
Year ended December 31, 2015
Corporate and
Discrete Other and
Electrification Automation Process Power Intersegment
($ in millions, unless otherwise indicated) Products and Motion Automation Grids elimination Consolidated
Total revenues 9,547 9,127 7,224 11,621 (2,038) 35,481
Foreign exchange/commodity timing
differences in total revenues:
Unrealized gains and losses
on derivatives (21) 23 (2) (92) 1 (91)
Realized gains and losses on derivatives
where the underlying hedged
transaction has not yet been realized 8 (27) 32 64 (1) 76
Unrealized foreign exchange movements
on receivables (and related assets) 2 8 (17) (5) (1) (13)
Operational revenues 9,536 9,131 7,237 11,588 (2,039) 35,453
Income (loss) from operations 1,356 991 685 613 (596) 3,049
Acquisition-related amortization 100 128 12 52 18 310
Restructuring and
restructuring-related expenses(1) 124 125 130 160 135 674
Non-operational pension cost (3) 3 6 3 10 19
Changes in pre-acquisition estimates – 21 – – – 21
Gains and losses from sale of businesses,
acquisition-related expenses and certain
non-operational items 4 26 14 39 37 120
Foreign exchange/commodity timing
differences in income from operations:
Unrealized gains and losses on derivatives
(foreign exchange, commodities,
embedded derivatives) (28) 17 (3) (57) 4 (67)
Realized gains and losses on derivatives
where the underlying hedged
transaction has not yet been realized 6 (27) 26 63 – 68
Unrealized foreign exchange movements
on receivables/payables
(and related assets/liabilities) 2 11 (7) 4 5 15
Operational EBITA 1,561 1,295 863 877 (387) 4,209
Operational EBITA margin (%) 16.4% 14.2% 11.9% 7.6% n.a. 11.9%
(1) Amounts also include the incremental implementation costs in relation to the White Collar Productivity program.

40 Q4 2016 FINANCIAL INFORMATION
Three months ended December 31, 2016
Corporate and
Discrete Other and
Electrification Automation Process Power Intersegment
($ in millions, unless otherwise indicated) Products and Motion Automation Grids elimination Consolidated
restated restated
Total revenues 2,462 2,211 1,737 3,042 (459) 8,993
Foreign exchange/commodity timing
differences in total revenues:
Unrealized gains and losses
on derivatives 18 8 (3) 40 – 63
Realized gains and losses on derivatives
where the underlying hedged
transaction has not yet been realized (1) 2 1 13 – 15
Unrealized foreign exchange movements
on receivables (and related assets) (13) (3) (9) (32) (1) (58)
Operational revenues 2,466 2,218 1,726 3,063 (460) 9,013
Income (loss) from operations 319 89 244 334 (308) 678
Acquisition-related amortization 23 29 2 8 5 67
Restructuring and
restructuring-related expenses(1) 25 31 (21) (5) 38 68
Non-operational pension cost – 2 2 1 33 38
Changes in pre-acquisition estimates – 92 – – – 92
Gains and losses from sale of businesses,
acquisition-related expenses and certain
non-operational items 7 14 9 (8) 105 127
Foreign exchange/commodity timing
differences in income from operations:
Unrealized gains and losses on derivatives
(foreign exchange, commodities,
embedded derivatives) 11 3 (4) 19 (7) 22
Realized gains and losses on derivatives
where the underlying hedged
transaction has not yet been realized (1) 2 5 10 – 16
Unrealized foreign exchange movements
on receivables/payables
(and related assets/liabilities) (2) (2) (6) (41) – (51)
Operational EBITA 382 260 231 318 (134) 1,057
Operational EBITA margin (%) 15.5% 11.7% 13.4% 10.4% n.a. 11.7%
(1) Amounts also include the incremental implementation costs in relation to the White Collar Productivity program.

41 Q4 2016 FINANCIAL INFORMATION
Three months ended December 31, 2015
Corporate and
Discrete Other and
Electrification Automation Process Power Intersegment
($ in millions, unless otherwise indicated) Products and Motion Automation Grids elimination Consolidated
Total revenues 2,459 2,288 1,926 3,107 (538) 9,242
Foreign exchange/commodity timing
differences in total revenues:
Unrealized gains and losses
on derivatives (6) 3 2 (37) 1 (37)
Realized gains and losses on derivatives
where the underlying hedged
transaction has not yet been realized 2 1 4 7 (1) 13
Unrealized foreign exchange movements
on receivables (and related assets) – – 7 14 (1) 20
Operational revenues 2,455 2,292 1,939 3,091 (539) 9,238
Income (loss) from operations 267 134 105 145 (304) 347
Acquisition-related amortization 24 32 3 10 4 73
Restructuring and
restructuring-related expenses(1) 104 81 106 122 118 531
Non-operational pension cost – – 2 – 6 8
Changes in pre-acquisition estimates – 12 – – – 12
Gains and losses from sale of businesses,
acquisition-related expenses and certain
non-operational items 4 26 (5) 1 50 76
Foreign exchange/commodity timing
differences in income from operations:
Unrealized gains and losses on derivatives
(foreign exchange, commodities,
embedded derivatives) 2 8 9 (8) 2 13
Realized gains and losses on derivatives
where the underlying hedged
transaction has not yet been realized 1 (1) 9 9 – 18
Unrealized foreign exchange movements
on receivables/payables
(and related assets/liabilities) 1 (1) 6 14 3 23
Operational EBITA 403 291 235 293 (121) 1,101
Operational EBITA margin (%) 16.4% 12.7% 12.1% 9.5% n.a. 11.9%
(1) Amounts also include the incremental implementation costs in relation to the White Collar Productivity program.
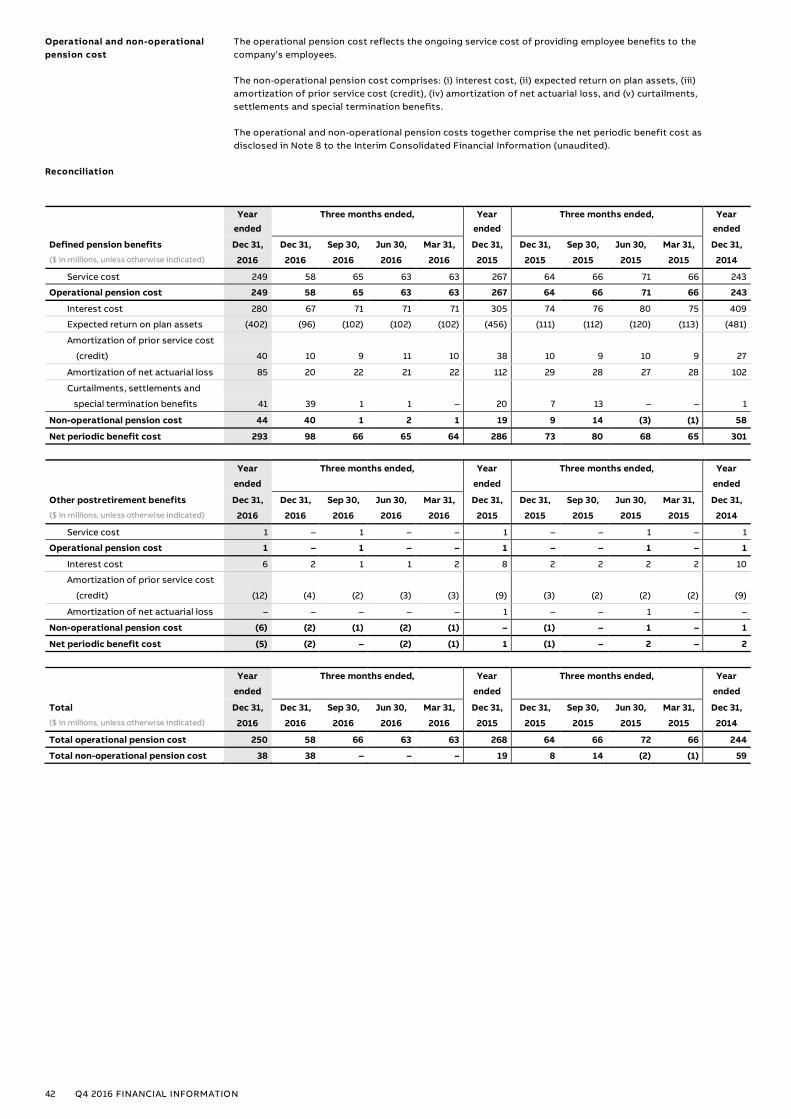
42 Q4 2016 FINANCIAL INFORMATION
Operational and non-operational
pension cost
The operational pension cost reflects the ongoing service cost of providing employee benefits to the
company’s employees.
The non-operational pension cost comprises: (i) interest cost, (ii) expected return on plan assets, (iii)
amortization of prior service cost (credit), (iv) amortization of net actuarial loss, and (v) curtailments,
settlements and special termination benefits.
The operational and non-operational pension costs together comprise the net periodic benefit cost as
disclosed in Note 8 to the Interim Consolidated Financial Information (unaudited).
Reconciliation
Year Three months ended, Year Three months ended, Year
ended ended ended
Defined pension benefits Dec 31, Dec 31, Sep 30, Jun 30, Mar 31, Dec 31, Dec 31, Sep 30, Jun 30, Mar 31, Dec 31,
($ in millions, unless otherwise indicated) 2016 2016 2016 2016 2016 2015 2015 2015 2015 2015 2014
Service cost 249 58 65 63 63 267 64 66 71 66 243
Operational pension cost 249 58 65 63 63 267 64 66 71 66 243
Interest cost 280 67 71 71 71 305 74 76 80 75 409
Expected return on plan assets (402) (96) (102) (102) (102) (456) (111) (112) (120) (113) (481)
Amortization of prior service cost
(credit) 40 10 9 11 10 38 10 9 10 9 27
Amortization of net actuarial loss 85 20 22 21 22 112 29 28 27 28 102
Curtailments, settlements and
special termination benefits 41 39 1 1 – 20 7 13 – – 1
Non-operational pension cost 44 40 1 2 1 19 9 14 (3) (1) 58
Net periodic benefit cost 293 98 66 65 64 286 73 80 68 65 301
Year Three months ended, Year Three months ended, Year
ended ended ended
Other postretirement benefits Dec 31, Dec 31, Sep 30, Jun 30, Mar 31, Dec 31, Dec 31, Sep 30, Jun 30, Mar 31, Dec 31,
($ in millions, unless otherwise indicated) 2016 2016 2016 2016 2016 2015 2015 2015 2015 2015 2014
Service cost 1 – 1 – – 1 – – 1 – 1
Operational pension cost 1 – 1 – – 1 – – 1 – 1
Interest cost 6 2 1 1 2 8 2 2 2 2 10
Amortization of prior service cost
(credit) (12) (4) (2) (3) (3) (9) (3) (2) (2) (2) (9)
Amortization of net actuarial loss – – – – – 1 – – 1 – –
Non-operational pension cost (6) (2) (1) (2) (1) – (1) – 1 – 1
Net periodic benefit cost (5) (2) – (2) (1) 1 (1) – 2 – 2
Year Three months ended, Year Three months ended, Year
ended ended ended
Total Dec 31, Dec 31, Sep 30, Jun 30, Mar 31, Dec 31, Dec 31, Sep 30, Jun 30, Mar 31, Dec 31,
($ in millions, unless otherwise indicated) 2016 2016 2016 2016 2016 2015 2015 2015 2015 2015 2014
Total operational pension cost 250 58 66 63 63 268 64 66 72 66 244
Total non-operational pension cost 38 38 – – – 19 8 14 (2) (1) 59

43 Q4 2016 FINANCIAL INFORMATION
Operational EPS Definition
Operational EPS
Operational EPS is calculated as Operational net income divided by the weighted-average number of
shares outstanding used in determining basic earnings per share.
Operational net income
Operational net income is calculated as Net income attributable to ABB adjusted for the following:
(i) acquisition-related amortization,
(ii) restructuring and restructuring-related expenses,
(iii) non-operational pension cost and,
(iv) changes in pre-acquisition estimates,
(v) gains and losses from sale of businesses, acquisition-related expenses and certain non-operational
items,
(vi) foreign exchange/commodity timing differences in income from operations consisting of: (a)
unrealized gains and losses on derivatives (foreign exchange, commodities, embedded derivatives),
(b) realized gains and losses on derivatives where the underlying hedged transaction has not yet been
realized, and (c) unrealized foreign exchange movements on receivables/payables (and related
assets/liabilities).
(vii) The amount of income tax on operational adjustments either estimated using the Adjusted Group
effective tax rate or in certain specific cases, computed using the actual income tax effects of the
relevant item in (i) to (v) above.
Acquisition-related amortization
Amortization expense on intangibles arising upon acquisitions.
Adjusted Group effective tax rate
The Adjusted Group effective tax rate is computed by dividing an adjusted provision for taxes by an
adjusted income from continuing operations before taxes. Certain amounts recorded in income from
continuing operations before taxes and the related provision for taxes (primarily gains and losses from
sale of businesses) are excluded from the computation.
Constant currency Operational EPS adjustment and Operational EPS growth rate (constant currency)
In connection with ABB’s 2015-2020 targets, Operational EPS growth is measured assuming 2014 as the
base year and uses constant exchange rates. We compute the constant currency operational net income
for all periods using the relevant monthly exchange rates which were in effect during 2014 and any
difference in computed Operational net income is divided by the relevant weighted-average number of
shares outstanding to identify the constant currency Operational EPS adjustment.
Reconciliation
2016 2015 2014
($ in millions, except per share data in $) Q4 Q3 Q2 Q1 Q4 Q3 Q2 Q1 Q4 Q3 Q2 Q1
restated
Net income (attributable to ABB) 425 568 406 500 204 577 588 564 680 734 636 544
Operational adjustments:
Acquisition-related amortization 67 70 71 71 73 74 80 83 90 93 96 101
Restructuring and restructuring-related expenses(1) 68 39 367 69 531 59 58 26 93 55 40 47
Non-operational pension cost 38 – – – 8 14 (2) (1) 21 12 12 14
Changes in pre-acquisition estimates 92 17 14 8 12 9 – – – – – –
Gains and losses from sale of businesses,
acquisition-related expenses and
certain non-operational items 127 35 9 2 76 (6) 39 11 (122) (257) (114) 11
FX/commodity timing differences
in income from operations (13) 24 12 17 54 72 (80) (30) 43 76 20 25
Tax on operational adjustments(2) (93) (58) (123) (46) (189) (64) (17) (25) (18) 91 15 (56)
Operational net income 711 695 756 621 769 735 666 628 787 804 705 686
Weighted-average number of
shares outstanding (in millions) 2,137 2,135 2,149 2,181 2,203 2,219 2,232 2,251 2,266 2,290 2,295 2,301
Operational EPS 0.33 0.33 0.35 0.28 0.35 0.33 0.30 0.28 0.35 0.35 0.31 0.30
Constant currency Operational EPS adjustment 0.02 0.02 0.04 0.05 0.01 0.03 0.03 0.03 – – – –
Operational EPS
(constant currency basis - 2014 exchange rates) 0.35 0.35 0.39 0.33 0.36 0.36 0.33 0.31 0.35 0.35 0.31 0.30
Operational EPS growth rate(3) -5% -2% 18% 2% 0% -6% -3% -7%
Operational EPS growth rate
(constant currency basis - 2014 exchange rates) -3% -3% 18% 4% 5% 2% 7% 5%
(1) Amounts also include the incremental implementation costs in relation to the White Collar Productivity program.
(2) Tax amount is computed by applying the Adjusted Group effective tax rate to the operational adjustments, except for gains and losses from sale of businesses for which
the actual provision for taxes resulting from the gain or loss has been computed.
(3) Growth is computed using unrounded EPS amounts.
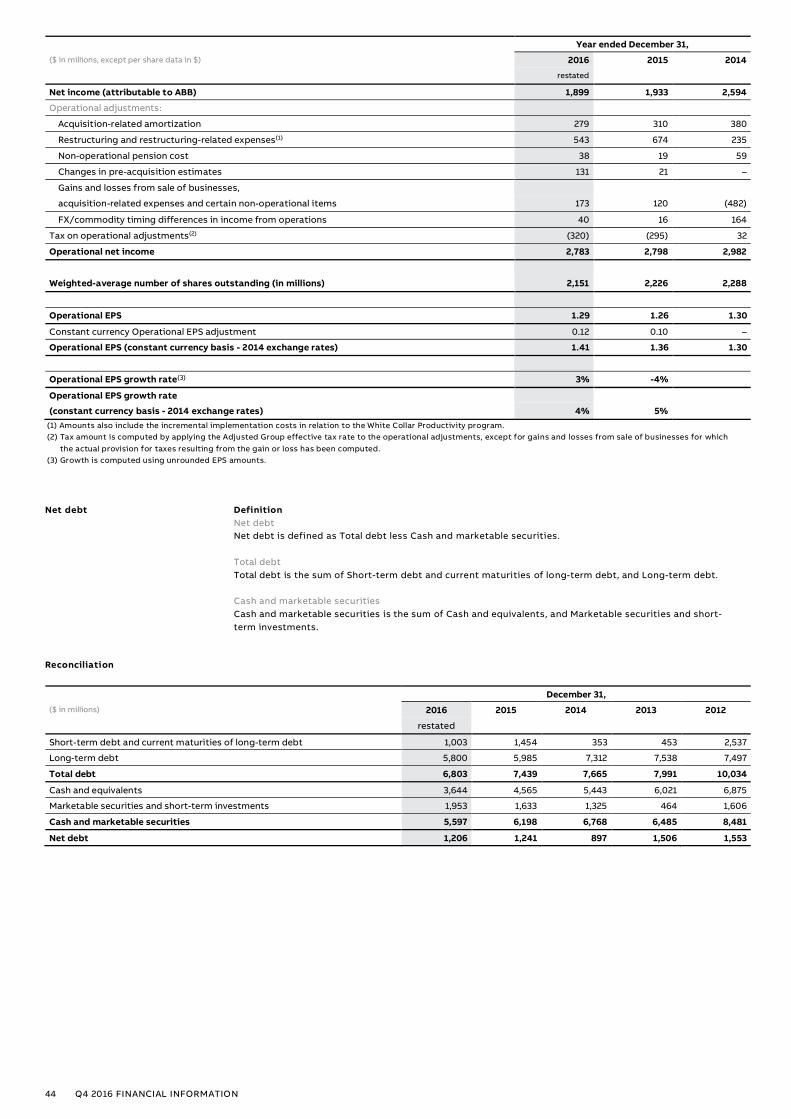
44 Q4 2016 FINANCIAL INFORMATION
Year ended December 31,
($ in millions, except per share data in $) 2016 2015 2014
restated
Net income (attributable to ABB) 1,899 1,933 2,594
Operational adjustments:
Acquisition-related amortization 279 310 380
Restructuring and restructuring-related expenses(1) 543 674 235
Non-operational pension cost 38 19 59
Changes in pre-acquisition estimates 131 21 –
Gains and losses from sale of businesses,
acquisition-related expenses and certain non-operational items 173 120 (482)
FX/commodity timing differences in income from operations 40 16 164
Tax on operational adjustments(2) (320) (295) 32
Operational net income 2,783 2,798 2,982
Weighted-average number of shares outstanding (in millions) 2,151 2,226 2,288
Operational EPS 1.29 1.26 1.30
Constant currency Operational EPS adjustment 0.12 0.10 –
Operational EPS (constant currency basis - 2014 exchange rates) 1.41 1.36 1.30
Operational EPS growth rate(3) 3% -4%
Operational EPS growth rate
(constant currency basis - 2014 exchange rates) 4% 5%
(1) Amounts also include the incremental implementation costs in relation to the White Collar Productivity program.
(2) Tax amount is computed by applying the Adjusted Group effective tax rate to the operational adjustments, except for gains and losses from sale of businesses for which
the actual provision for taxes resulting from the gain or loss has been computed.
(3) Growth is computed using unrounded EPS amounts.
Net debt Definition
Net debt
Net debt is defined as Total debt less Cash and marketable securities.
Total debt
Total debt is the sum of Short-term debt and current maturities of long-term debt, and Long-term debt.
Cash and marketable securities
Cash and marketable securities is the sum of Cash and equivalents, and Marketable securities and short-
term investments.
Reconciliation
December 31,
($ in millions) 2016 2015 2014 2013 2012
restated
Short-term debt and current maturities of long-term debt 1,003 1,454 353 453 2,537
Long-term debt 5,800 5,985 7,312 7,538 7,497
Total debt 6,803 7,439 7,665 7,991 10,034
Cash and equivalents 3,644 4,565 5,443 6,021 6,875
Marketable securities and short-term investments 1,953 1,633 1,325 464 1,606
Cash and marketable securities 5,597 6,198 6,768 6,485 8,481
Net debt 1,206 1,241 897 1,506 1,553

45 Q4 2016 FINANCIAL INFORMATION
Net working capital as a
percentage of revenues
Definition
Net working capital as a percentage of revenues
Net working capital as a percentage of revenues is calculated as Net working capital divided by Adjusted
revenues for the trailing twelve months.
Net working capital
Net working capital is the sum of (i) receivables, net, (ii) inventories, net, and (iii) prepaid expenses; less
(iv) accounts payable, trade, (v) billings in excess of sales, (vi) advances from customers, and (vii) other
current liabilities (excluding primarily: (a) income taxes payable, (b) current derivative liabilities, (c)
pension and other employee benefits, and (d) payables under the share buyback program); and including
the amounts related to these accounts which have been presented as either assets or liabilities held for
sale.
Adjusted revenues for the trailing twelve months
Adjusted revenues for the trailing twelve months includes total revenues recorded by ABB in the twelve
months preceding the relevant balance sheet date adjusted to eliminate revenues of divested businesses
and the estimated impact of annualizing revenues of certain acquisitions which were completed in the
same trailing twelve-month period.
Reconciliation
Dec 31, Sep 30, Jun 30, Mar 31, Dec 31, Sep 30, Jun 30, Mar 31, Dec 31, Sep 30, Jun 30, Mar 31, Dec 31,
($ in millions, unless otherwise indicated) 2016 2016 2016 2016 2015 2015 2015 2015 2014 2014 2014 2014 2013
restated
Net working capital:
Receivables, net 9,696 10,155 10,384 10,131 10,061 10,564 11,071 10,599 11,078 11,788 12,106 12,215 12,146
Inventories, net 4,347 5,017 5,045 5,104 4,757 5,410 5,458 5,346 5,376 5,961 6,210 6,201 6,004
Prepaid expenses 176 242 246 268 225 286 304 289 218 307 306 305 252
Accounts payable, trade (4,446) (4,458) (4,536) (4,323) (4,342) (4,405) (4,564) (4,473) (4,765) (4,820) (4,950) (4,872) (5,112)
Billings in excess of sales (1,241) (1,330) (1,377) (1,331) (1,375) (1,440) (1,505) (1,396) (1,455) (1,560) (1,499) (1,539) (1,714)
Advances from customers (1,398) (1,591) (1,612) (1,601) (1,598) (1,497) (1,512) (1,503) (1,624) (1,628) (1,705) (1,780) (1,726)
Other current liabilities (3,198) (3,153) (3,002) (2,949) (3,127) (3,103) (3,030) (2,900) (3,286) (3,380) (3,381) (3,307) (3,541)
excluding: (1) 738 744 2,505 803 690 802 1,201 1,017 971 1,260 774 710 701
Net working capital in
assets and liabilities held for sale (72) (46) – – – – 1 – – (8) 27 – –
Net working capital 3,864 4,836 5,148 5,299 4,601 5,815 6,223 5,962 5,542 6,660 7,114 7,223 6,309
Total revenues
for the three months ended:
Dec. 31, 2016 / 2015 / 2014 / 2013 8,993 9,242 9,242 9,242 9,242 10,346 10,346 10,346 10,346 11,373 11,373 11,373 11,373
Sep. 30, 2016 / 2015 / 2014 / 2013 8,255 8,255 8,519 8,519 8,519 8,519 9,823 9,823 9,823 9,823 10,535 10,535 10,535
Jun. 30, 2016 / 2015 / 2014 / 2013 8,677 8,677 8,677 9,165 9,165 9,165 9,165 10,190 10,190 10,190 10,190 10,225 10,225
Mar. 31, 2016 / 2015 / 2014 / 2013 7,903 7,903 7,903 7,903 8,555 8,555 8,555 8,555 9,471 9,471 9,471 9,471 9,715
Total revenues
for the trailing twelve months 33,828 34,077 34,341 34,829 35,481 36,585 37,889 38,914 39,830 40,857 41,569 41,604 41,848
Adjustment to annualize/eliminate
revenues of certain
acquisitions/divestments – – – – – (64) (144) (372) (613) (633) (212) 204 460
Adjusted revenues
for the trailing twelve months 33,828 34,077 34,341 34,829 35,481 36,521 37,745 38,542 39,217 40,224 41,357 41,808 42,308
Net working capital
as a percentage of revenues (%) 11.4% 14.2% 15.0% 15.2% 13.0% 15.9% 16.5% 15.5% 14.1% 16.6% 17.2% 17.3% 14.9%
(1) The amounts excluded from Other current liabilities related primarily to (a) income taxes payable, (b) current derivative liabilities, (c) pension and other employee benefits,
and (d) payables under the share buyback program.
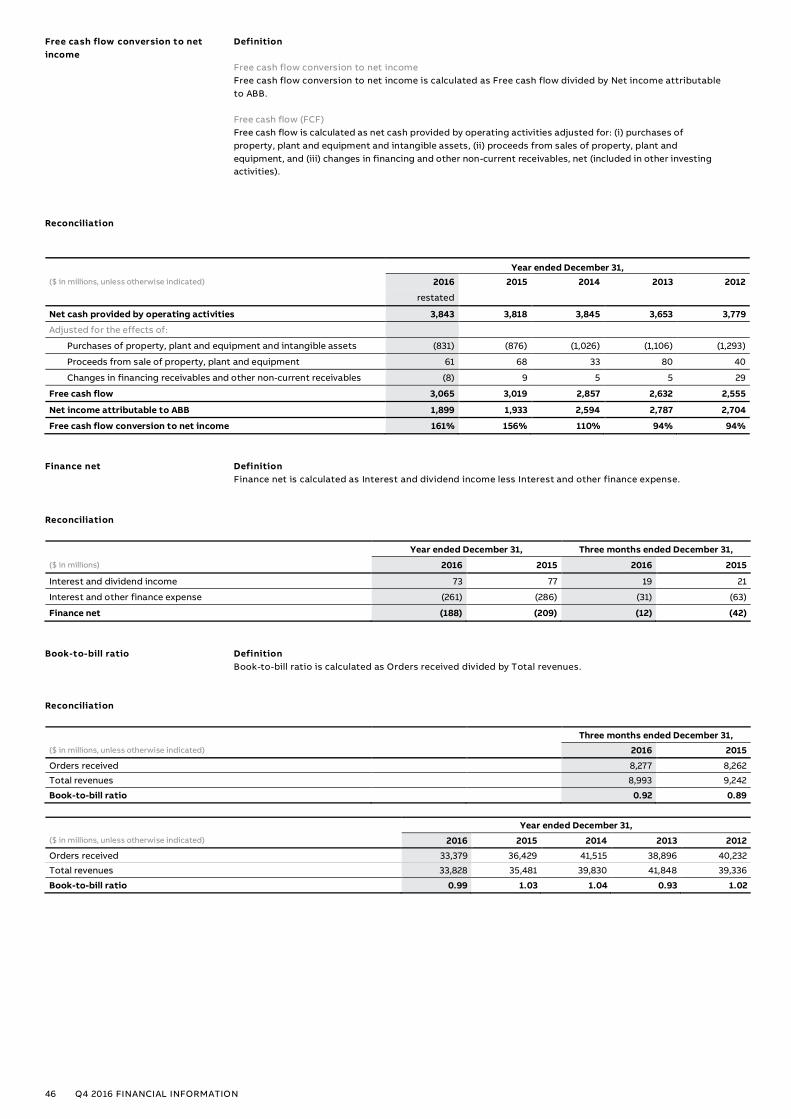
46 Q4 2016 FINANCIAL INFORMATION
Free cash flow conversion to net
income
Definition
Free cash flow conversion to net income
Free cash flow conversion to net income is calculated as Free cash flow divided by Net income attributable
to ABB.
Free cash flow (FCF)
Free cash flow is calculated as net cash provided by operating activities adjusted for: (i) purchases of
property, plant and equipment and intangible assets, (ii) proceeds from sales of property, plant and
equipment, and (iii) changes in financing and other non-current receivables, net (included in other investing
activities).
Reconciliation
Year ended December 31,
($ in millions, unless otherwise indicated) 2016 2015 2014 2013 2012
restated
Net cash provided by operating activities 3,843 3,818 3,845 3,653 3,779
Adjusted for the effects of:
Purchases of property, plant and equipment and intangible assets (831) (876) (1,026) (1,106) (1,293)
Proceeds from sale of property, plant and equipment 61 68 33 80 40
Changes in financing receivables and other non-current receivables (8) 9 5 5 29
Free cash flow 3,065 3,019 2,857 2,632 2,555
Net income attributable to ABB 1,899 1,933 2,594 2,787 2,704
Free cash flow conversion to net income 161% 156% 110% 94% 94%
Finance net Definition
Finance net is calculated as Interest and dividend income less Interest and other finance expense.
Reconciliation
Year ended December 31, Three months ended December 31,
($ in millions) 2016 2015 2016 2015
Interest and dividend income 73 77 19 21
Interest and other finance expense (261) (286) (31) (63)
Finance net (188) (209) (12) (42)
Book-to-bill ratio Definition
Book-to-bill ratio is calculated as Orders received divided by Total revenues.
Reconciliation
Three months ended December 31,
($ in millions, unless otherwise indicated) 2016 2015
Orders received 8,277 8,262
Total revenues 8,993 9,242
Book-to-bill ratio 0.92 0.89
Year ended December 31,
($ in millions, unless otherwise indicated) 2016 2015 2014 2013 2012
Orders received 33,379 36,429 41,515 38,896 40,232
Total revenues 33,828 35,481 39,830 41,848 39,336
Book-to-bill ratio 0.99 1.03 1.04 0.93 1.02
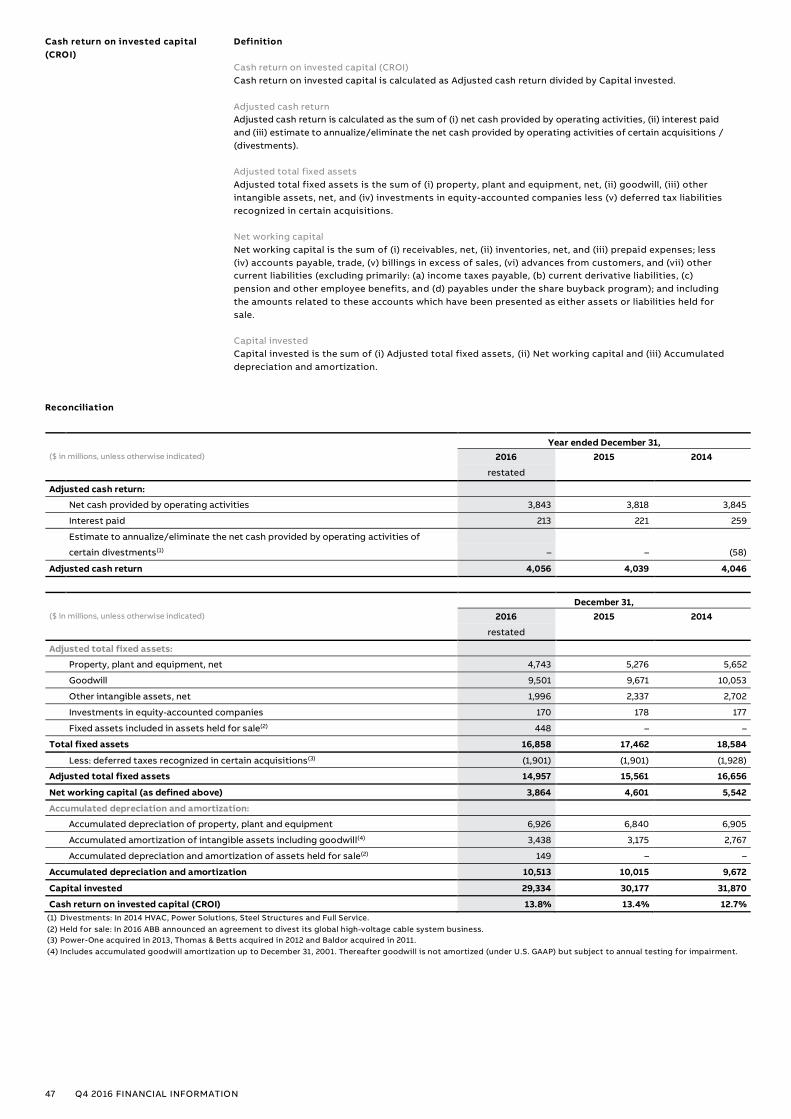
47 Q4 2016 FINANCIAL INFORMATION
Cash return on invested capital
(CROI)
Definition
Cash return on invested capital (CROI)
Cash return on invested capital is calculated as Adjusted cash return divided by Capital invested.
Adjusted cash return
Adjusted cash return is calculated as the sum of (i) net cash provided by operating activities, (ii) interest paid
and (iii) estimate to annualize/eliminate the net cash provided by operating activities of certain acquisitions /
(divestments).
Adjusted total fixed assets
Adjusted total fixed assets is the sum of (i) property, plant and equipment, net, (ii) goodwill, (iii) other
intangible assets, net, and (iv) investments in equity-accounted companies less (v) deferred tax liabilities
recognized in certain acquisitions.
Net working capital
Net working capital is the sum of (i) receivables, net, (ii) inventories, net, and (iii) prepaid expenses; less
(iv) accounts payable, trade, (v) billings in excess of sales, (vi) advances from customers, and (vii) other
current liabilities (excluding primarily: (a) income taxes payable, (b) current derivative liabilities, (c)
pension and other employee benefits, and (d) payables under the share buyback program); and including
the amounts related to these accounts which have been presented as either assets or liabilities held for
sale.
Capital invested
Capital invested is the sum of (i) Adjusted total fixed assets, (ii) Net working capital and (iii) Accumulated
depreciation and amortization.
Reconciliation
Year ended December 31,
($ in millions, unless otherwise indicated) 2016 2015 2014
restated
Adjusted cash return:
Net cash provided by operating activities 3,843 3,818 3,845
Interest paid 213 221 259
Estimate to annualize/eliminate the net cash provided by operating activities of
certain divestments(1) – – (58)
Adjusted cash return 4,056 4,039 4,046
December 31,
($ in millions, unless otherwise indicated) 2016 2015 2014
restated
Adjusted total fixed assets:
Property, plant and equipment, net 4,743 5,276 5,652
Goodwill 9,501 9,671 10,053
Other intangible assets, net 1,996 2,337 2,702
Investments in equity-accounted companies 170 178 177
Fixed assets included in assets held for sale(2) 448 – –
Total fixed assets 16,858 17,462 18,584
Less: deferred taxes recognized in certain acquisitions(3) (1,901) (1,901) (1,928)
Adjusted total fixed assets 14,957 15,561 16,656
Net working capital (as defined above) 3,864 4,601 5,542
Accumulated depreciation and amortization:
Accumulated depreciation of property, plant and equipment 6,926 6,840 6,905
Accumulated amortization of intangible assets including goodwill(4) 3,438 3,175 2,767
Accumulated depreciation and amortization of assets held for sale(2) 149 – –
Accumulated depreciation and amortization 10,513 10,015 9,672
Capital invested 29,334 30,177 31,870
Cash return on invested capital (CROI) 13.8% 13.4% 12.7%
(1) Divestments: In 2014 HVAC, Power Solutions, Steel Structures and Full Service.
(2) Held for sale: In 2016 ABB announced an agreement to divest its global high-voltage cable system business.
(3) Power-One acquired in 2013, Thomas & Betts acquired in 2012 and Baldor acquired in 2011.
(4) Includes accumulated goodwill amortization up to December 31, 2001. Thereafter goodwill is not amortized (under U.S. GAAP) but subject to annual testing for impairment.

48 Q4 2016 FINANCIAL INFORMATION
Reconciliation of Operational
EBITA margin by division for prior
periods
The following tables provide operational EBITA margin reconciliations for prior periods.
\
Three months ended September 30, 2016
Corporate and
Discrete Other and
Electrification Automation Process Power Intersegment
($ in millions, unless otherwise indicated) Products and Motion Automation Grids elimination Consolidated
Total revenues 2,308 2,203 1,523 2,636 (415) 8,255
Foreign exchange/commodity timing
differences in total revenues:
Unrealized gains and losses
on derivatives 6 2 6 20 – 34
Realized gains and losses on derivatives
where the underlying hedged
transaction has not yet been realized (2) – (1) 6 – 3
Unrealized foreign exchange movements
on receivables (and related assets) 1 2 3 (1) 1 6
Operational revenues 2,313 2,207 1,531 2,661 (414) 8,298
Income (loss) from operations 389 276 170 222 (179) 878
Acquisition-related amortization 24 30 3 9 4 70
Restructuring and
restructuring-related expenses(1) (7) (4) 7 12 31 39
Non-operational pension cost 1 – – (1) – –
Changes in pre-acquisition estimates – 17 – – – 17
Gains and losses from sale of businesses,
acquisition-related expenses and certain
non-operational items 1 4 – 2 28 35
Foreign exchange/commodity timing
differences in income from operations:
Unrealized gains and losses on derivatives
(foreign exchange, commodities,
embedded derivatives) 3 2 (1) 4 – 8
Realized gains and losses on derivatives
where the underlying hedged
transaction has not yet been realized (2) 1 2 2 – 3
Unrealized foreign exchange movements
on receivables/payables
(and related assets/liabilities) 3 2 6 3 (1) 13
Operational EBITA 412 328 187 253 (117) 1,063
Operational EBITA margin (%) 17.8% 14.9% 12.2% 9.5% n.a. 12.8%
(1) Amounts also include the incremental implementation costs in relation to the White Collar Productivity program.
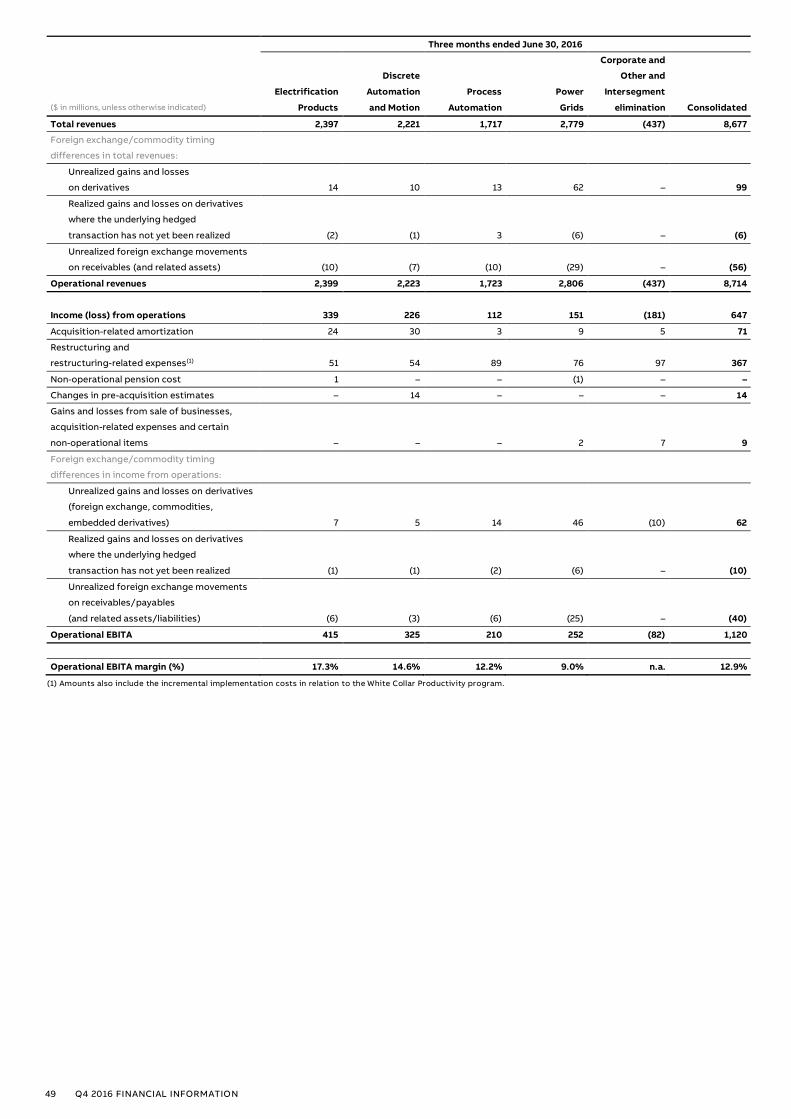
49 Q4 2016 FINANCIAL INFORMATION
Three months ended June 30, 2016
Corporate and
Discrete Other and
Electrification Automation Process Power Intersegment
($ in millions, unless otherwise indicated) Products and Motion Automation Grids elimination Consolidated
Total revenues 2,397 2,221 1,717 2,779 (437) 8,677
Foreign exchange/commodity timing
differences in total revenues:
Unrealized gains and losses
on derivatives 14 10 13 62 – 99
Realized gains and losses on derivatives
where the underlying hedged
transaction has not yet been realized (2) (1) 3 (6) – (6)
Unrealized foreign exchange movements
on receivables (and related assets) (10) (7) (10) (29) – (56)
Operational revenues 2,399 2,223 1,723 2,806 (437) 8,714
Income (loss) from operations 339 226 112 151 (181) 647
Acquisition-related amortization 24 30 3 9 5 71
Restructuring and
restructuring-related expenses(1) 51 54 89 76 97 367
Non-operational pension cost 1 – – (1) – –
Changes in pre-acquisition estimates – 14 – – – 14
Gains and losses from sale of businesses,
acquisition-related expenses and certain
non-operational items – – – 2 7 9
Foreign exchange/commodity timing
differences in income from operations:
Unrealized gains and losses on derivatives
(foreign exchange, commodities,
embedded derivatives) 7 5 14 46 (10) 62
Realized gains and losses on derivatives
where the underlying hedged
transaction has not yet been realized (1) (1) (2) (6) – (10)
Unrealized foreign exchange movements
on receivables/payables
(and related assets/liabilities) (6) (3) (6) (25) – (40)
Operational EBITA 415 325 210 252 (82) 1,120
Operational EBITA margin (%) 17.3% 14.6% 12.2% 9.0% n.a. 12.9%
(1) Amounts also include the incremental implementation costs in relation to the White Collar Productivity program.

50 Q4 2016 FINANCIAL INFORMATION
Three months ended March 31, 2016
Corporate and
Discrete Other and
Electrification Automation Process Power Intersegment
($ in millions, unless otherwise indicated) Products and Motion Automation Grids elimination Consolidated
Total revenues 2,125 2,079 1,621 2,518 (440) 7,903
Foreign exchange/commodity timing
differences in total revenues:
Unrealized gains and losses
on derivatives (18) (17) (7) (49) – (91)
Realized gains and losses on derivatives
where the underlying hedged
transaction has not yet been realized – 1 5 (5) – 1
Unrealized foreign exchange movements
on receivables (and related assets) 11 8 20 32 – 71
Operational revenues 2,118 2,071 1,639 2,496 (440) 7,884
Income (loss) from operations 288 240 170 181 (95) 784
Acquisition-related amortization 24 31 3 9 4 71
Restructuring and
restructuring-related expenses(1) 4 7 4 18 36 69
Non-operational pension cost 1 – – (1) – –
Changes in pre-acquisition estimates – 8 – – – 8
Gains and losses from sale of businesses,
acquisition-related expenses and certain
non-operational items – – – 2 – 2
Foreign exchange/commodity timing
differences in income from operations:
Unrealized gains and losses on derivatives
(foreign exchange, commodities,
embedded derivatives) – (7) 3 (34) 11 (27)
Realized gains and losses on derivatives
where the underlying hedged
transaction has not yet been realized – – – (4) – (4)
Unrealized foreign exchange movements
on receivables/payables
(and related assets/liabilities) 2 3 16 27 – 48
Operational EBITA 319 282 196 198 (44) 951
Operational EBITA margin (%) 15.1% 13.6% 12.0% 7.9% n.a. 12.1%
(1) Amounts also include the incremental implementation costs in relation to the White Collar Productivity program.

51 Q4 2016 FINANCIAL INFORMATION
Three months ended September 30, 2015
Corporate and
Discrete Other and
Electrification Automation Process Power Intersegment
($ in millions, unless otherwise indicated) Products and Motion Automation Grids elimination Consolidated
Total revenues 2,353 2,220 1,659 2,791 (504) 8,519
Foreign exchange/commodity timing
differences in total revenues:
Unrealized gains and losses
on derivatives – 41 27 52 1 121
Realized gains and losses on derivatives
where the underlying hedged
transaction has not yet been realized 3 1 9 13 – 26
Unrealized foreign exchange movements
on receivables (and related assets) (3) (5) (4) (22) – (34)
Operational revenues 2,353 2,257 1,691 2,834 (503) 8,632
Income (loss) from operations 390 264 159 159 (90) 882
Acquisition-related amortization 25 31 3 10 5 74
Restructuring and
restructuring-related expenses(1) 10 16 3 13 17 59
Non-operational pension cost (1) 1 2 1 11 14
Changes in pre-acquisition estimates – 9 – – – 9
Gains and losses from sale of businesses,
acquisition-related expenses and certain
non-operational items (1) – 1 5 (11) (6)
Foreign exchange/commodity timing
differences in income from operations:
Unrealized gains and losses on derivatives
(foreign exchange, commodities,
embedded derivatives) (18) 26 8 33 15 64
Realized gains and losses on derivatives
where the underlying hedged
transaction has not yet been realized 3 3 6 10 – 22
Unrealized foreign exchange movements
on receivables/payables
(and related assets/liabilities) 1 (5) 1 (9) (2) (14)
Operational EBITA 409 345 183 222 (55) 1,104
Operational EBITA margin (%) 17.4% 15.3% 10.8% 7.8% n.a. 12.8%
(1) Amounts also include the incremental implementation costs in relation to the White Collar Productivity program.

52 Q4 2016 FINANCIAL INFORMATION
Three months ended June 30, 2015
Corporate and
Discrete Other and
Electrification Automation Process Power Intersegment
($ in millions, unless otherwise indicated) Products and Motion Automation Grids elimination Consolidated
Total revenues 2,506 2,348 1,875 2,951 (515) 9,165
Foreign exchange/commodity timing
differences in total revenues:
Unrealized gains and losses
on derivatives (23) (8) (23) (102) (1) (157)
Realized gains and losses on derivatives
where the underlying hedged
transaction has not yet been realized 2 – (1) 21 – 22
Unrealized foreign exchange movements
on receivables (and related assets) 8 5 (2) 24 – 35
Operational revenues 2,493 2,345 1,849 2,894 (516) 9,065
Income (loss) from operations 389 293 216 181 (118) 961
Acquisition-related amortization 26 33 3 15 3 80
Restructuring and
restructuring-related expenses(1) 3 25 20 10 – 58
Non-operational pension cost (1) 1 1 1 (4) (2)
Gains and losses from sale of businesses,
acquisition-related expenses and certain
non-operational items – – 15 31 (7) 39
Foreign exchange/commodity timing
differences in income from operations:
Unrealized gains and losses on derivatives
(foreign exchange, commodities,
embedded derivatives) (23) (24) (27) (89) 3 (160)
Unrealized gains and losses on derivatives
(foreign exchange, commodities,
embedded derivatives) 1 – (4) 23 – 20
Unrealized gains and losses on derivatives
(foreign exchange, commodities, 15 12 4 25 4 60
embedded derivatives)
Operational EBITA 410 340 228 197 (119) 1,056
Operational EBITA margin (%) 16.4% 14.5% 12.3% 6.8% n.a. 11.6%
(1) Amounts also include the incremental implementation costs in relation to the White Collar Productivity program.

53 Q4 2016 FINANCIAL INFORMATION
Three months ended March 31, 2015
Corporate and
Discrete Other and
Electrification Automation Process Power Intersegment
($ in millions, unless otherwise indicated) Products and Motion Automation Grids elimination Consolidated
Total revenues 2,229 2,271 1,764 2,772 (481) 8,555
Foreign exchange/commodity timing
differences in total revenues:
Unrealized gains and losses
on derivatives 8 (13) (8) (5) – (18)
Realized gains and losses on derivatives
where the underlying hedged
transaction has not yet been realized 1 (29) 20 23 – 15
Unrealized foreign exchange movements
on receivables (and related assets) (3) 8 (18) (21) – (34)
Operational revenues 2,235 2,237 1,758 2,769 (481) 8,518
Income (loss) from operations 310 300 205 128 (84) 859
Acquisition-related amortization 25 32 3 17 6 83
Restructuring and
restructuring-related expenses(1) 7 3 1 15 – 26
Non-operational pension cost (1) 1 1 1 (3) (1)
Gains and losses from sale of businesses,
acquisition-related expenses and certain
non-operational items 1 – 3 2 5 11
Foreign exchange/commodity timing
differences in income from operations:
Unrealized gains and losses on derivatives
(foreign exchange, commodities,
embedded derivatives) 11 7 7 7 (16) 16
Realized gains and losses on derivatives
where the underlying hedged
transaction has not yet been realized 1 (29) 15 21 – 8
Unrealized foreign exchange movements
on receivables/payables
(and related assets/liabilities) (15) 5 (18) (26) – (54)
Operational EBITA 339 319 217 165 (92) 948
Operational EBITA margin (%) 15.2% 14.3% 12.3% 6.0% n.a. 11.1%
(1) Amounts also include the incremental implementation costs in relation to the White Collar Productivity program.

54 Q4 2016 FINANCIAL INFORMATION
Year ended December 31, 2014
Corporate and
Discrete Other and
Electrification Automation Process Power Intersegment
($ in millions, unless otherwise indicated) Products and Motion Automation Grids elimination Consolidated
Total revenues 10,572 10,142 8,618 12,518 (2,020) 39,830
Foreign exchange/commodity timing
differences in total revenues:
Unrealized gains and losses
on derivatives 25 10 12 192 – 239
Realized gains and losses on derivatives
where the underlying hedged
transaction has not yet been realized – (2) 17 48 – 63
Unrealized foreign exchange movements
on receivables (and related assets) (5) (13) (15) (56) – (89)
Operational revenues 10,592 10,137 8,632 12,702 (2,020) 40,043
Income (loss) from operations 1,562 1,422 931 257 6 4,178
Acquisition-related amortization 113 138 18 89 22 380
Restructuring and
restructuring-related expenses(1) 49 25 36 106 19 235
Non-operational pension cost (2) 6 17 12 26 59
Gains and losses from sale of businesses,
acquisition-related expenses and certain
non-operational items (7) – 32 9 (516) (482)
Foreign exchange/commodity timing
differences in income from operations:
Unrealized gains and losses on derivatives
(foreign exchange, commodities,
embedded derivatives) 23 16 20 168 (4) 223
Realized gains and losses on derivatives
where the underlying hedged
transaction has not yet been realized 1 (2) 13 32 (2) 42
Unrealized foreign exchange movements
on receivables/payables
(and related assets/liabilities) – (10) (22) (66) (3) (101)
Operational EBITA 1,739 1,595 1,045 607 (452) 4,534
Operational EBITA margin (%) 16.4% 15.7% 12.1% 4.8% n.a. 11.3%
(1) Amounts also include the incremental implementation costs in relation to the White Collar Productivity program.

—
ABB Ltd Corporate Communications
P.O. Box 8131
8050 Zurich
Switzerland
Tel: +41 (0)43 317 71 11
Fax: +41 (0)43 317 79 58
www.abb.com