Embed Size (px)
Citation preview

WORKING PAPER
Financial Inclusion Measurement in the Arab WorldJanuary 2017
This paper is jointly published by CGAP (Nadine Chehade, Antoine Navarro) and the Arab Monetary Fund (Yisr Barnieh, Habib Attia) in collaboration with the Arab Monetary Fund’s Financial Inclusion Task Force. The authors thank all those who provided comments during the writing and editing of the document.
Contact the authors for a copy of an Excel spreadsheet containing country-level information used in this paper: [email protected] or [email protected].


iii
EXECUTIVE SUMMARY
Following the request of the central banks of the region, the Arab Monetary Fund’s (AMF) Financial Inclusion Task Force (FITF) was established in 2012 to identify ways to improve financial inclusion in the Arab world. Financial inclusion refers to a state where individuals, including low-income people, and companies, including the smallest ones, have access to and make use of a full range of formal quality fi-nancial services (payments, transfers, savings, credit, and insurance) offered in a re-sponsible and sustainable way by a variety of providers operating in a suitable legal and regulatory environment.
The financial inclusion cause has been embraced globally by central banks and international standard-setting bodies for its impact on any country’s economy: supporting economic growth through the development of the financial sector, improv-ing the financial sector’s stability, or decreasing Anti-Money Laundering/Combating the Financing of Terrorism risks through higher formalization of the economy, are a few of the many tangible virtues of high financial inclusion rates. Organizations such as the G20, the United Nations, and the World Bank have thus committed to advance financial inclusion globally.
In the race toward full financial inclusion, the Arab world lags behind other regions. Nearly 70 percent of adults (168 million) report no account ownership. This figure goes up to 80 percent in the developing countries of the region, constituting the largest area of exclusion from formal financial services. Similarly, access to for-mal credit is less than half the global average.
Low levels of financial inclusion in the region are the result of unserved demand, in the absence of a suitable formal offer. This is notably evidenced by the massive use of informal credit by at least 92 million borrowers. Women, low-income people, and youth are the most excluded.
Detailed and accurate data are necessary to identify priorities and measure progress. While the general diagnosis is undeniable, better understanding financial inclusion patterns in each country will require market studies that analyze the de-mand for financial services. In the meantime, FITF has taken a preliminary step to improve the quality of data collected from financial services providers.
Data will reflect progress only when actual change happens in the Arab markets. Here, public policies aiming at fostering financial inclusion and appropri-ate legal frameworks play a key role, and central banks are well-positioned to drive such policies.
Central banks usually have both the mandate and the skill set that allow them to champion and coordinate the process toward effective national financial in-clusion strategies, though they are not always in charge of all aspects related to financial inclusion.
It is in this context that the AMF and its task force will be working closely with CGAP, the Alliance for Financial Inclusion, and GIZ, among others, to advance measurement of financial inclusion in the Arab world, thereby allowing member countries to accu-rately measure their progress to financial inclusion when they wish.

v
TABLE OF CONTENTS
1. FINANCIAL INCLUSION IS ON THE GLOBAL DEVELOPMENT AGENDA ..................................................................... 1
2. FINANCIAL INCLUSION IN THE ARAB WORLD LAGS BEHIND OTHER REGIONS .................................................................... 2
a. Account Ownership................................................................................................................ 2b. Borrowings from Formal Financial Institutions ........................................................ 4c. Insurance .................................................................................................................................... 5
3. DIFFERENT DATASETS ALLOW FOR A BETTER UNDERSTANDING OF FINANCIAL INCLUSION .................................... 6
a. Demand-Side Data .................................................................................................................. 6b. Supply-Side Data ..................................................................................................................... 8c. Comparing Different Sources and Understanding Data Gaps .............................. 8
4. LOW FINANCIAL INCLUSION IN THE ARAB WORLD RESULTS FROM UNATTENDED DEMAND .......................................... 12
5. GOING FORWARD: ANALYZING POLICY AND REGULATORY FRAMEWORKS ............................................................. 14
6. ANNEXES ............................................................................................ 16
a. G20 Basic Set of Financial Inclusion Indicators .......................................................16b. Alliance for Financial Inclusion Core Set of Indicators .........................................17c. G20 Full Set of Financial Inclusion Indicators ..........................................................18
FIGURES, TABLES, BOX
Figure 1. Account at a formal financial institution (age 15+) by region ................................................................................................................................. 2
Figure 2. Account at a formal financial institution (age 15+) in the Arab world ................................................................................................................. 3
Figure 3. Deposit accounts with commercial banks per 1,000 adults, by region ...................................................................................................... 4
Figure 4. Loan at a formal financial institution (age 15+) by region ................................ 4Figure 5. Loan at a formal financial institution (age 15+) in the Arab world ............... 5Figure 6. Formal account ownership, demand vs. supply-side data,
in the Arab world ...............................................................................................................10

vi
Financial Inclusion Measurement in the Arab World
Figure 7. Formal credit penetration, demand vs. supply-side data, in the Arab world ...............................................................................................................11
Figure 8. Savings vs. formal account ownership (age 15+), by region ..........................13Figure 9. Loans vs. formal loans (age 15+), by region ..........................................................13
Table 1. Demand-side data landscape ........................................................................................... 7Table 2. Supply-side data landscape ............................................................................................... 9Table 3. Microfinance regulations in the Arab world (GCC excluded) ...........................14
Box 1. Focus on the low-income and micro- and small enterprises ...............................12
The following color code is applied to country groups in all graphs:■ Regional peer groups
■ Income-level peer groups
■ Arab countries

vii
ACRONYMS
AMF Arab Monetary Fund
AML/CFT Anti-Money Laundering/Combating the Financing of Terrorism
FAS Financial Access Survey, database collected from financial service providers
Findex Global Financial Inclusion database, collected from individuals through survey
FITF Financial Inclusion Task Force
GCC Gulf Cooperation Council
IMF International Monetary Fund
MSME Micro, Small, and Medium Enterprise
OECD Organization for Economic Co-operation and Development
UAE United Arab Emirates


1
Financial Inclusion Measurement in the Arab World
1. FINANCIAL INCLUSION IS ON THE GLOBAL DEVELOPMENT AGENDA
Financial inclusion refers to a state where individuals, including low-income people, and companies, including the smallest ones, have access to and make use of a full range of formal quality financial services (payments, transfers, savings, credit, and insurance) offered in a responsible and sustainable way by a variety of providers operating in a suitable legal and regulatory environment.
Globally, central banks have embraced financial inclusion because several of its elements fall within the scope of their mandates. Indeed, financial inclusion leads to economic growth through the development of the financial system (e.g., in-creasing the number and total value of formal financial transactions) and to finan-cial stability through a greater diversification of risks (e.g., large deposit bases and portfolios of small loans, both proven to be less vulnerable to shocks). In addition, financial exclusion has been demonstrated to actually increase anti-money launder-ing/combating the financing of terrorism (AML/CFT) risks, on top of having negative consequences on economic and social stability.
It is, therefore, not a coincidence that financial inclusion has caught the atten-tion of some of the most prominent institutions and standard-setting bodies (SSB) globally. In 2010, the G20 recognized financial inclusion as one of the main pillars of the global development agenda, setting up the Global Partnership for Financial Inclusion (GPFI), which released the G20 set of financial inclusion indica-tors (see Annexes A and C). That same year, the Basel Committee released its “Guide-lines for the application of core principles for effective banking supervision to micro-finance activities,” followed in 2015 by the “Range of practice in the regulation and supervision of institutions relevant to financial inclusion.” Even the Financial Action Task Force (FATF) has put in place measures to expand definitions of low-risk and lower-risk transactions, updating its “Guidance on AML/CFT and financial inclusion” in 2013. Finally, the evolving financial inclusion landscape, captured in GPFI’s 2016 white paper, has led SSBs to broaden their scope of action. As such, the 2016 update of the G20 financial inclusion indicators now includes a range of indicators on digital services, mobile phones, and agent banking.1
Improving financial inclusion in the Arab world requires a better understand-ing of the current level of access to financial services. In light of this, over the past year, the AMF FITF, with the support of CGAP,2 decided to collect and analyze the globally established G20 set of financial inclusion indicators3 for Arab countries. These indicators are essential for member countries to formulate a preliminary financial inclusion diagnostic, with the final goal of developing relevant policies to enhance financial inclusion.
1 This paper does not explore data related to digital financial services given the limited number of data points available.2 Housed at the World Bank, CGAP is a global consortium of more than 30 international donors and investors aiming to advance financial inclusion.3 There is a basic and a full set of indicators. Data are collected across 24 categories comprising 2–3 indicators each and cov-ering three dimensions: access, usage, and quality. There is some but not full overlap with the Alliance for Financial Inclusion (AFI) core set of indicators (see annexes).

2
Financial Inclusion Measurement in the Arab World
4 Findex samples in GCC countries include nationals, Arab expatriates, and non-Arabs who were able to answer the survey in Arabic or English.
2. FINANCIAL INCLUSION IN THE ARAB WORLD LAGS BEHIND OTHER REGIONS
All available data suggest that there is a great potential to deepen financial inclusion in the Arab world. Existing datasets on financial inclusion, whether re-garding demand or supply, all point toward the same analysis in terms of the relative position of countries and regions compared to one another.
a. Account Ownership
Launched in 2011, the World Bank’s Global Findex survey has become widely accepted as a benchmarking tool that can be applied across countries and regions, with account ownership being the primary indicator of financial inclusion (see Section 4.c for more details on the Global Findex).
■ According to these figures, the outreach of formal financial services in the Arab world stands at only 21 percent when excluding the Gulf Cooperation Council (GCC) countries, the lowest worldwide (see Figure 1).
■ At 74 percent account ownership, GCC countries4 are above the global average of 61 percent account ownership, although they are still below the 94 percent Orga-nization for Economic Co-operation and Development (OECD) average.
■ Given the relatively small population of GCC countries, account ownership in the entire Arab world remains low at 29 percent.
Source: Findex 2011 and 2014 data, except for bars in purple, computed based on the Findex data.
Note: Findex reports an average of 14% for “Middle East developing countries,” including Egypt, Iraq, Jordan, Lebanon, Palestine, and Yemen. Other figures for the Arab world are calculated as averages weighted by the population aged 151. GCC countries include Bahrain, Kuwait, Oman, Qatar, Saudi Arabia, and United Arab Emirates. The Arab world includes all AMF member countries, namely GCC countries and Algeria, Comoros, Djibouti, Egypt, Iraq, Jordan, Lebanon, Libya, Mauritania, Morocco, Palestine, Somalia, Sudan, Syria, Tunisia, and Yemen.
AverageGCC
EAP World Middleincome
ECA LAC ArabWorld
SSA Lowincome
ArabWorld
excl. GCC
94%
74%69%
61%57%
51% 51%
29% 29%22% 21%
0%
10%
20%
30%
40%
50%
60%
70%
80%
90%
100%
OECD
2014
2011
FIGURE 1. Account at a Formal Financial Institution (age 151), By Region

3
Financial Inclusion Measurement in the Arab World
Non-GCC countries can be grouped in two categories (see Figure 2).
■ Countries, such as Algeria, Lebanon, or Morocco, that have active financial mar-kets yet are slightly below the global average.
■ Other countries that are much lower.
While the Global Findex might have some shortcomings,5 these differences among regions, subregions, and pools of countries are also reflected in the aggregated data from financial service providers that are reported to the International Mon-etary Fund’s Financial Access Survey (IMF FAS) (see Figure 3, Figure 6, and Section 4.b for more details on the IMF FAS).
5 The first Findex surveys were conducted in 2011, coinciding with times of unrest in several Arab countries. Data are not avail-able for the exact same set of countries in 2011 and 2014, with a maximum of 20 countries covered, and only 14 presenting two sets of data.
JordanTunisia
Average Arab WorldMoroccoLebanon
AlgeriaMiddle Income
QatarSaudi Arabia
KuwaitAverage GCC
OmanBahrain
UAEOECD
Syria
Comoros
SudanMauritania
Palestine
Low Income
Arab world excl. GCC
YemenSomalia
IraqDjibouti
Egypt
0% 10% 20% 30% 40% 50% 60% 70% 80% 90% 100%
2011 2014
Source: Findex 2011 and 2014 data, except for Morocco (estimated by applying to the 2011 Findex data the growth rate reported by Bank Al Maghrib on the number of accounts as collected from financial service providers).
Note: Only 2011 data are presented for countries where no data for 2014 are available (Comoros, Djibouti, Morocco, Oman, Qatar, Syria).
FIGURE 2. Account at a Formal Financial Institution (age 151) in the Arab World

4
Financial Inclusion Measurement in the Arab World
b. Borrowings from Formal Financial Institutions
Similar to account ownership, the Arab world lags behind other regions in terms of access to credit from formal financial institutions (see Figure 4). Although 44 percent of adults reported having a loan according to the Global Findex survey, only 6 percent of them are borrowing from a formal financial institution. Credit out-reach in the region, when excluding GCC countries, is less than half of most other developing regions globally.
3,000
3,500
1,000
1,500
2,000
2,500
Highincome
ECA South Asia LAC Lower middleincome
EAP ArabWorld
Upper middleincome
SSA Low income-
500
4,000
Source: IMF FAS 2014 data for 111 countries and 2013 data for 13 countries.
Note: “Deposit accounts” used instead of “number of depositors” because more data points are available. Regional and income group averages computed based on IMF FAS averages weighted by the population over 15 years old.
FIGURE 3. Deposit Accounts with Commercial Banks, per 1,000 Adults, by Region
Source: Findex 2011 and 2014 data.
Note: Findex reports an average of 5.6% for “Middle East developing countries.”
20%
18%
16%
12%
14%
0%
2%
4%
6%
8%
10%
OECD AverageGCC
ECA LAC EAP World Middleincome
Lowincome
SSA ArabWorld
ArabWorld
excl. GCC
18%
13%12%
11% 11% 11%9% 9%
6% 6%5%
2014
2011
FIGURE 4. Loans at a Formal Financial Institution (age 151), by Region

5
Financial Inclusion Measurement in the Arab World
GCC countries, as well as Lebanon and Jordan, have a deeper outreach of formal credit when compared to other countries (see Figure 5).
c. Insurance
Global information on insurance outreach is currently limited because the topic is not covered by the Findex survey, and data are usually not reported in the IMF FAS. The latter is likely due to the limited involvement of central banks in the topic, since insurance services in most countries fall under the supervision of ministries of finance, ministries of economy, or nonbank financial regulators.
Despite the lack of systematic data on the subject, punctual studies have evidenced a limited penetration of insurance services, especially to low-income populations.6
6 According to World Bank (2010), only three countries have a ratio of nonlife insurance premiums exceeding 1.5 percent of GDP, significantly smaller than OECD countries.
2011 2014
MauritaniaTunisia
Low IncomeMiddle Income
OmanSaudi Arabia
QatarSyria
Average GCCJordanKuwait
UAELebanon
OECDBahrain
Egypt
Arab world excl. GCC
PalestineMorocco
Comoros
Average Arab World
Djibouti
YemenSomaliaAlgeria
IraqSudan
0% 5% 10% 15% 20% 25%
Source: Findex, 2011 and 2014 data.
Note: Only 2011 data are presented for countries where no data for 2014 are available (Comoros, Djibouti, Morocco, Oman, Qatar, Syria). Only 2014 data are presented for countries where Findex reports a decrease between 2011 and 2014 (Bahrain, Iraq, Kuwait).
FIGURE 5. Loan at a Formal Financial Institution (age 151) in the Arab World
6
Financial Inclusion Measurement in the Arab World
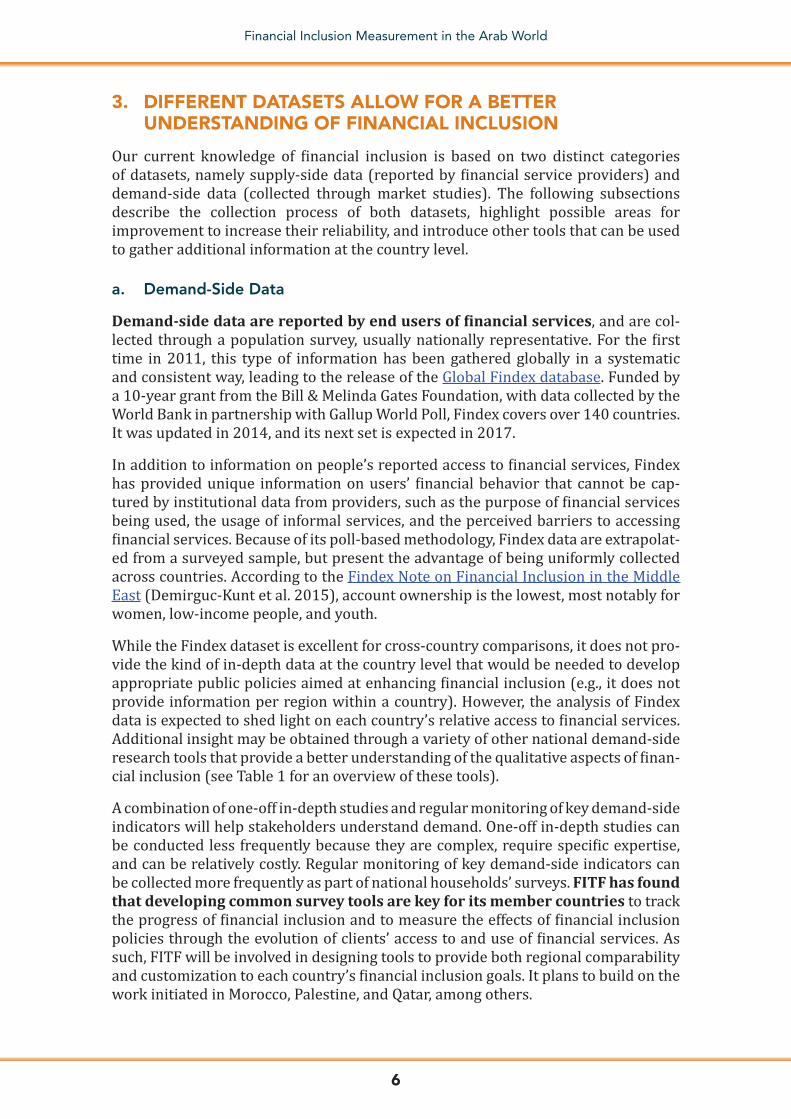
3. DIFFERENT DATASETS ALLOW FOR A BETTER UNDERSTANDING OF FINANCIAL INCLUSION
Our current knowledge of financial inclusion is based on two distinct categories of datasets, namely supply-side data (reported by financial service providers) and demand-side data (collected through market studies). The following subsections describe the collection process of both datasets, highlight possible areas for improvement to increase their reliability, and introduce other tools that can be used to gather additional information at the country level.
a. Demand-Side Data
Demand-side data are reported by end users of financial services, and are col-lected through a population survey, usually nationally representative. For the first time in 2011, this type of information has been gathered globally in a systematic and consistent way, leading to the release of the Global Findex database. Funded by a 10-year grant from the Bill & Melinda Gates Foundation, with data collected by the World Bank in partnership with Gallup World Poll, Findex covers over 140 countries. It was updated in 2014, and its next set is expected in 2017.
In addition to information on people’s reported access to financial services, Findex has provided unique information on users’ financial behavior that cannot be cap-tured by institutional data from providers, such as the purpose of financial services being used, the usage of informal services, and the perceived barriers to accessing financial services. Because of its poll-based methodology, Findex data are extrapolat-ed from a surveyed sample, but present the advantage of being uniformly collected across countries. According to the Findex Note on Financial Inclusion in the Middle East (Demirguc-Kunt et al. 2015), account ownership is the lowest, most notably for women, low-income people, and youth.
While the Findex dataset is excellent for cross-country comparisons, it does not pro-vide the kind of in-depth data at the country level that would be needed to develop appropriate public policies aimed at enhancing financial inclusion (e.g., it does not provide information per region within a country). However, the analysis of Findex data is expected to shed light on each country’s relative access to financial services. Additional insight may be obtained through a variety of other national demand-side research tools that provide a better understanding of the qualitative aspects of finan-cial inclusion (see Table 1 for an overview of these tools).
A combination of one-off in-depth studies and regular monitoring of key demand-side indicators will help stakeholders understand demand. One-off in-depth studies can be conducted less frequently because they are complex, require specific expertise, and can be relatively costly. Regular monitoring of key demand-side indicators can be collected more frequently as part of national households’ surveys. FITF has found that developing common survey tools are key for its member countries to track the progress of financial inclusion and to measure the effects of financial inclusion policies through the evolution of clients’ access to and use of financial services. As such, FITF will be involved in designing tools to provide both regional comparability and customization to each country’s financial inclusion goals. It plans to build on the work initiated in Morocco, Palestine, and Qatar, among others.

7
Financial Inclusion Measurement in the Arab World
TAB
LE 1
. D
eman
d-S
ide
Dat
a La
ndsc
ape
Des
crip
tio
nQ
uant
itat
ive
or
qua
litat
ive
Freq
uenc
ySc
op
eSa
mp
le s
ize
Co
untr
ies
cove
red
Sub
nati
ona
l d
ata
Glo
bal
Fin
dex
Glo
bal
tre
nds
and
cr
oss
-co
untr
y co
mp
aris
on
Qua
litat
ive
3 ye
ars
(201
1,
2014
, 201
7)In
div
idua
l1,
0001
148
No
Wo
rld
Ban
k E
nter
-p
rise
sur
vey/
IFC
E
nter
pri
se fi
nanc
e g
ap d
atab
ase
Qua
lity
of
the
bus
i-ne
ss a
nd in
vest
-m
ent
clim
ate
acro
ss
coun
trie
s
Qua
ntit
ativ
e 1
Q
ualit
ativ
eEv
ery
3–4
year
s si
nce
1998
Firm
Vari
es
1,00
013
5N
o
Fina
ncia
l Inc
lusi
on
Insi
ght
s Su
rvey
s (F
II)In
div
idua
l per
cep
-ti
on
and
beh
avio
r re
gar
din
g d
igit
al
finan
cial
ser
vice
s
Qua
ntit
ativ
e 1
Q
ualit
ativ
e1
year
(ove
r 2–
3 ye
ars)
Ind
ivid
ual
5,00
0–60
,000
10a
Yes
Fins
cop
e/Fi
nAcc
ess
Ind
ivid
uals
’ fina
ncia
l m
anag
emen
t; p
er-
cep
tio
ns r
egar
din
g
finan
cial
ser
vice
s
Qua
ntit
ativ
e 1
Q
ualit
ativ
e4
year
sIn
div
idua
l, so
me
hous
eho
ld
conc
lusi
ons
1,00
0–21
,000
17
Yes
Fina
ncia
l Inc
lusi
on
Trac
ker
Surv
ey
(FIT
S)
Tren
ds
in h
ous
e-ho
lds’
fina
ncia
l b
ehav
ior;
tre
nds
in
po
vert
y le
vels
of
mo
bile
mo
ney
user
s
Qua
ntit
ativ
e 1
Q
ualit
ativ
e1
year
1
qua
rter
lyH
ous
eho
ld
(pan
el)
3,00
0–5,
000
3b
Reg
iona
l
Livi
ng S
tand
ard
s M
easu
rem
ent
Stud
yH
ous
eho
ld w
elfa
re
and
beh
avio
rQ
uant
itat
ive
(lim
ited
qua
l.)Va
ried
(1
985–
2012
)H
ous
eho
ld
(pan
el)
800–
36,0
00 3
8Ye
s
a. B
ang
lad
esh,
Gha
na, I
ndia
, Ind
one
sia,
Ken
ya, N
iger
ia, P
akis
tan,
Rw
and
a, T
anza
nia,
Ug
and
a.
b. U
gan
da,
Pak
ista
n, T
anza
nia.
So
urce
: Bro
ens
Nie
lsen
201
4.

8
Financial Inclusion Measurement in the Arab World
b. Supply-Side Data
Supply-side data are reported by financial service providers and are collected by national authorities (central banks, relevant ministries), by industry bodies (bank-ing association, insurance association), or through surveys sent to financial service providers.
A main global source of supply-side data is the IMF FAS. Initiated in 2009 with first results released in 2010, FAS aims to collect and disseminate internationally com-parable data from financial service providers. It comprises over 150 indicators for 189 countries and focuses on access (or availability) and actual use of financial services, measured relative to population size to allow for cross-country comparison.
Despite comprehensive quality checks by the FAS team, the reliability of the FAS indicators largely depends on the availability and comprehensiveness of each country’s data and each reporting entity’s ability to detect and report significant deviations between their own indicators and FAS definitions.
FITF has identified three ways to improve the quality of FAS data for the Arab world.
■ Improve response rate. Only 19 percent of the data points collected by the IMF FAS are reported by Arab countries, on average. Some FITF members (e.g., Egypt, Palestine, United Arab Emirates) are working with the IMF FAS team to improve the quality of the information collected or reported.
■ Improve the process. Designate a dedicated and active financial inclusion data contact point in the reporting countries that would be in charge of liaising with other institutions, if needed. Central banks are not always in charge of collecting all data pertaining to financial inclusion, but they could liaise with other enti-ties (e.g., insurance supervisor or association, microfinance professional associ-ations, postal networks).
■ Improve content. Data can be improved by analyzing the reasons behind the major differences between supply- and demand-side data (e.g., counting an in-dividual with several accounts as a single account holder, identifying dormant accounts, collecting missing information from financial service providers).
There are other supply-side datasets such as the GSMA Mobile Money Adoption Survey (for mobile money accounts), the World Bank’s Global Payment Survey, the Microfinance Information Exchange (MIX) Market map, and FSPMAPS.com (see Table 2 for more details).
c. Comparing Different Sources and Understanding Data Gaps
In comparing demand- and supply-side data in more detail for similar indicators, FITF has identified important gaps in some countries, even regarding basic indica-tors such as number of account holders or number of borrowers (see Figure 6 and Figure 7). Taking a closer look at the most significant gaps would help in analyzing financial inclusion patterns, as the two indicators complement each other.

9
Financial Inclusion Measurement in the Arab World
TAB
LE 2
. Su
pp
ly-S
ide
Dat
a La
ndsc
ape
Info
rmat
ion
sour
ceFr
eque
ncy
Ana
lyti
cal t
oo
lsG
eosp
atia
l, su
bna
tio
nal
Exa
mp
les
of
“acc
ess”
ind
icat
ors
IMF
FAS
Cen
tral
Ban
ks in
189
co
untr
ies
Ann
ually
sin
ce
2004
No
No
■ B
anks
per
1,0
00 K
m2
■ A
TMs
per
100
,000
ad
ults
GSM
A M
ob
ile M
one
y (M
M) A
do
pti
on
Surv
eyM
M p
rovi
der
s, t
elco
sA
nnua
llyB
ench
mar
king
No
■ N
o. o
f re
gis
tere
d M
M u
sers
■ N
o. o
f ac
tive
MM
ag
ents
■ V
alue
and
vo
lum
e o
f tr
ansa
ctio
ns
Wo
rld
Ban
k G
lob
al
Pay
men
t Su
rvey
Cen
tral
ban
ks20
08, 2
010,
20
12, n
ext
rep
ort
ex
pec
ted
in 2
017
Ben
chm
arki
ngN
o■ V
olu
me
of
tran
sact
ions
■ N
o. o
f co
untr
ies
wit
h co
nsum
er
pro
tect
ion
leg
isla
tio
n
MIX
FIN
clus
ionL
abM
icro
finan
ce in
stit
utio
ns;
incr
easi
ngly
oth
er
finan
cial
ser
vice
s p
rovi
der
s an
d r
egul
ato
rs
Qua
rter
ly;
dep
end
s o
n co
untr
y an
d
pro
vid
ers
Ben
chm
arki
ngYe
s■ N
o. o
f fin
anci
al in
stit
utio
ns b
y ty
pe
or
reg
ion
■ L
oca
tio
ns p
er 1
00,0
00 a
dul
ts■ L
oca
tio
ns p
er 1
,000
Km
2
fsp
map
s.co
mTh
ird-p
arty
pro
vid
ers;
g
eore
fere
ncin
g p
rovi
der
s in
-co
untr
y; s
pat
ial
dev
elo
pm
ent
host
dat
a
1 ro
und
; su
stai
nab
ility
pla
ns
und
er d
iscu
ssio
n
Yes
Yes
■ P
roxi
mit
y to
fina
ncia
l acc
ess
po
ints
, e.g
., nu
mb
er o
f (p
oo
r)
peo
ple
livi
ng w
ithi
n 5
Km
of
a fin
anci
al a
cces
s p
oin
t (u
rban
/ru
ral d
ivid
e)
Sour
ce: B
roen
s N
iels
en 2
014.

10
Financial Inclusion Measurement in the Arab World
Such an analysis would not be easy because demand- and supply-side indicators are different in nature. However, several of the indicators can be compared with a reasonable level of confidence, keeping in mind that needed adjustments cannot always be applied because of missing information. Information may be missing for a variety of reasons, including the following:
■ Difficulties in reporting supply-side data, e.g., in removing duplicates to report a unique number of depositors/borrowers.
■ Unavailable information for supply-side data, e.g., gender-disaggregated data.
■ Unwillingness to report account ownership in demand-side data.
■ Surveys being carried out on adults age 151 on the demand side, where the minimum age for account ownership could be as high as 21 in some countries.
0% 10% 20% 30% 40% 50% 60% 70% 80% 90% 100%
YemenSomalia
IraqDjibouti
EgyptSudan
MauritaniaArab world excl. GCC
ComorosLow income
SyriaPalestine
JordanTunisia Arab World
MoroccoLebanon
Algeria Middle income
Qatar Saudi ArabiaKuwait
Average GCCOman
BahrainUAE
OECD
FAS: Depositors with commercialbanks per 1,000 adults, expressedin %
Findex: Account at a financialinstitution (% age 15+)
Source: Findex and FAS 2014, where possible. Findex 2011 data are used for Comoros, Djibouti, Morocco, Oman, Qatar, and Syria. FAS 2013 data are used for Syria and Yemen. There are no recent FAS data for Bahrain, Iraq, Jordan, Libya, Morocco, Oman, Somalia, Sudan, and UAE for the two indicators, and no recent data for Algeria. Other regions’ averages for FAS are not included due to the limited number of data points.
FIGURE 6. Formal Account Ownership, Demand vs. Supply-Side Data in the Arab World

11
Financial Inclusion Measurement in the Arab World
MauritaniaTunisia
Low IncomeMiddle Income
OmanSaudi Arabia
QatarSyria
Average GCCJordanKuwait
UAELebanon
OECDBahrain
Egypt
Average excl. GCC
PalestineMorocco
Comoros
Arab World
Djibouti
YemenSomaliaAlgeria
IraqSudan
0% 5% 10% 15% 20% 25% 30% 35%
FAS: Borrowers from commercialbanks per 1,000 adults, expressedin %
Findex: Borrowed from afinancial institution (% age 15+)
Source: Findex and FAS 2014, where possible. Findex 2011 data are used for Comoros, Djibouti, Morocco, Oman, Qatar, and Syria. FAS 2013 data are used for Syria and Yemen. There are no recent FAS data for Bahrain, Iraq, Jordan, Libya, Morocco, Oman, Somalia, Sudan, and UAE for the two indicators. Other regions’ averages for FAS are not included due to the limited number of datapoints.
FIGURE 7. Formal Credit Penetration, Demand vs. Supply-Side Data in the Arab World

12
Financial Inclusion Measurement in the Arab World
4. LOW FINANCIAL INCLUSION IN THE ARAB WORLD RESULTS FROM UNATTENDED DEMAND
The weakness of financial inclusion indicators in the Arab world is not because of a lower demand for financial services. On the contrary, the region shows equal or higher financial activity, but lower outreach of formal financial services, be it for account ownership or for credit (see Box 1).
Indeed, on the account ownership front, the Arab world, in general, and non-GCC countries, in particular, is the only region, after Sub-Saharan Africa (SSA), where the number of people who declare that they have saved money significantly exceeds the number of people having an account at formal institutions (see Figure 8). This sug-gests that saving takes place outside of formal channels. In addition, barely one-third of formal account holders are intensive users,7 suggesting that supply might not be adapted to users’ needs. Another possible reason could be poor infrastructure.
On the credit front, the region shows a more active borrowing behavior compared to most others, with 44 percent of adults borrowing money over a year compared to a 42 percent global average and 40 percent average of OECD economies (see Figure 9).
7 “Intensive users” is defined by Findex as account holders at a formal financial institution who report that money is withdrawn from their account three or more times in a typical month.
BOX 1. Focus on Low-Income People and Micro- and Small Enterprises
This report reflects broad evidence that poor families live active financial lives, sav-ing, borrowing, and lending to others, and transferring money, but only a few use formal financial services. Indeed, while demand is present, supply remains limited and/or not adapted.
In the Arab world more specifically:
■ In some countries, postal networks are the main provider of savings and pay-ments services, notably because of their extensive geographic outreach, but they have no lending activities.
■ Microfinance institutions (MFIs), banks, nonbank financial institutions, and nongovernmental institutions (NGOs) are the main providers of credit to low-income households and micro- and small enterprises. In some countries, MFIs fall under the scope of Central Bank regulation and their data may be reported to FAS, although supply-side data for this segment is limited.a
■ Direct involvement of commercial banks remains scarce, as is the case glob-ally. In some countries though, state banks are significant providers of financial services for low-income households and micro- and small enterprises.
a. At the time this report was written, only Comoros, Djibouti, Palestine, Syria, and Yemen reported some infor-mation on depositors and/or borrowers with MFIs to FAS.

13
Financial Inclusion Measurement in the Arab World
However, where 11 percent of adults (or 25 percent of borrowers) borrowed from a formal financial institution globally, only 6 percent did so in the Arab countries, leaving 85 percent of the credit supply to informal players. In effect, 30 percent of adults bor-rowed from families or friends who represent nearly 70 percent of the credit supply. This is one of the biggest gaps in the world (8.5 times more adults borrow informally), second only to SSA.
1.0x
0.8x
2.1x
0.9x0.7x 0.8x 0.7x
1.3x
1.7x
100%90%80%
60%70%
0%10%20%30%40%50%
2.0x
1.5x
0.5x
1.0x
Saved any money in the past year Account at a formal financial institution Demand / supply Index
EAP OECDeconomies
SSA World AverageGCC
LAC ECA ArabWorld
Arab Worldexcl. GCC
0.0x
2.5x
Source: Findex 2014.
Note: Using these two indicators as a comparison of supply and demand vastly approximates—and probably under-estimates—demand, because there are more uses for accounts than saving (e.g., receiving wages and payments, supporting payment tools, such as cards).
FIGURE 8. Savings vs. Formal Account Ownership (age 151), by Region
8.7x
3.9x
7.0x
4.0x
8.5x
3.8x
2.2x
3.2x 2.9x
60%
0%
10%
20%
30%
40%
50%
10.0x
8.0x
6.0x
0.0x
2.0x
4.0x
9.0x
7.0x
1.0x
3.0x
5.0x
Demand / supply Index
SSA AverageGCC
ArabWorld
World Arab Worldexcl. GCC
EAP OECD ECA LAC
Borrowed any money in the past year Loan at a formal financial institution
Source: Findex 2014.
FIGURE 9. Loans vs. Formal Loans (age 151), by Region
14
Financial Inclusion Measurement in the Arab World
5. GOING FORWARD: ANALYZING POLICY AND REGULATORY FRAMEWORKS
Gathering and analyzing quality financial inclusion data is only the first step toward addressing the structural bottlenecks in financial access. Today, over 60 countries worldwide have launched reforms aimed at improving financial inclusion, in-cluding large countries such as Brazil and Mexico.
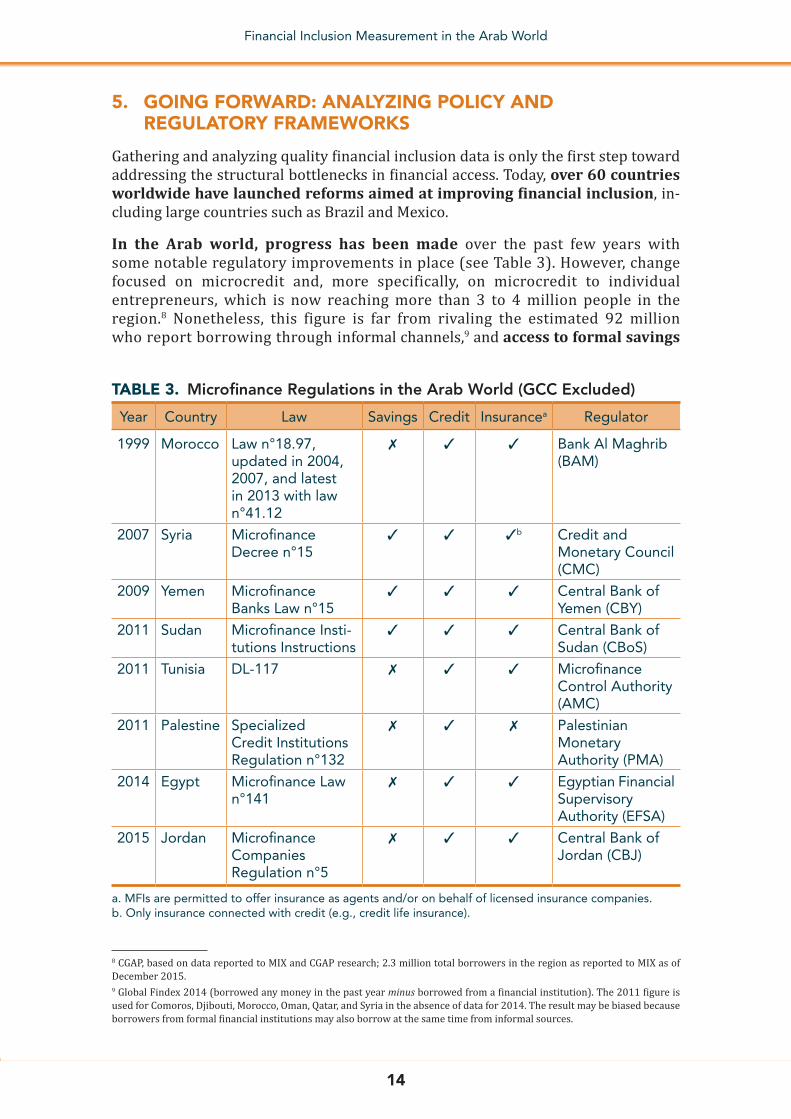
In the Arab world, progress has been made over the past few years with some notable regulatory improvements in place (see Table 3). However, change focused on microcredit and, more specifically, on microcredit to individual entrepreneurs, which is now reaching more than 3 to 4 million people in the region.8 Nonetheless, this figure is far from rivaling the estimated 92 million who report borrowing through informal channels,9 and access to formal savings
8 CGAP, based on data reported to MIX and CGAP research; 2.3 million total borrowers in the region as reported to MIX as of December 2015.9 Global Findex 2014 (borrowed any money in the past year minus borrowed from a financial institution). The 2011 figure is used for Comoros, Djibouti, Morocco, Oman, Qatar, and Syria in the absence of data for 2014. The result may be biased because borrowers from formal financial institutions may also borrow at the same time from informal sources.
TABLE 3. Microfinance Regulations in the Arab World (GCC Excluded)
Year Country Law Savings Credit Insurancea Regulator
1999 Morocco Law n°18.97, updated in 2004, 2007, and latest in 2013 with law n°41.12
✗ ✓ ✓ Bank Al Maghrib (BAM)
2007 Syria Microfinance Decree n°15
✓ ✓ ✓b Credit and Monetary Council (CMC)
2009 Yemen Microfinance Banks Law n°15
✓ ✓ ✓ Central Bank of Yemen (CBY)
2011 Sudan Microfinance Insti-tutions Instructions
✓ ✓ ✓ Central Bank of Sudan (CBoS)
2011 Tunisia DL-117 ✗ ✓ ✓ Microfinance Control Authority (AMC)
2011 Palestine Specialized Credit Institutions Regulation n°132
✗ ✓ ✗ Palestinian Monetary Authority (PMA)
2014 Egypt Microfinance Law n°141
✗ ✓ ✓ Egyptian Financial Supervisory Authority (EFSA)
2015 Jordan Microfinance Companies Regulation n°5
✗ ✓ ✓ Central Bank of Jordan (CBJ)
a. MFIs are permitted to offer insurance as agents and/or on behalf of licensed insurance companies.b. Only insurance connected with credit (e.g., credit life insurance).

15
Financial Inclusion Measurement in the Arab World
is still missing for 68 percent or 168 million adults in the Arab world (Global Findex 2014).10 Much more needs to be done to provide full access to formal financial services.
Improvements in financial inclusion indicators will come only from significant changes in the actual outreach of formal financial services, which in turn require changes in the financial sector architecture. Recently, selected countries have made legal changes authorizing mobile wallets deployment, which is a promising way for-ward. Morocco, the country that has made the most progress toward financial inclu-sion, has proactively changed its policies to embrace financial inclusion, notably by (i) granting a banking license to the postal network in 2009, leading to the creation of Al Barid Bank where over 500,000 new accounts were created during the first years of operation, (ii) making it compulsory for commercial banks to offer low-income banking products, and (iii) allowing the establishment of payment institutions.11
Priorities and solutions will no doubt vary across countries.12 However, enhanc-ing financial inclusion cannot go without also analyzing the legal and regulatory framework, as financial regulators and supervisors have a critical say in expanding financial inclusion opportunities while overseeing market conduct. This is why FITF is planning an exercise to take stock of existing laws, regulations, and mandates re-lated to financial inclusion across its member countries. By doing so, it expects to identify regulatory or institutional bottlenecks that can be corrected to significantly improve access to finance.
REFERENCES
Broens Nielsen, Karina. 2014. “10 Useful Data Sources for Measuring Financial Inclusion.” Blog post. Washington, D.C.: CGAP, 10 January.
Demirguc-Kunt, Asli, Leora Klapper, Dorothe Singer, and Peter Van Oudheusden. 2015. “The Global Findex Database 2014: Measuring Financial Inclusion around the World.” Policy Re-search Working Paper 7255. Washington, D.C.: World Bank.
Demirguc-Kunt, Asli, Leora Klapper, Dorothe Singer, Peter van Oudheusden, Saniya Ansar, and Jake Hess. 2015. “The Global Findex Database 2014: Financial Inclusion in the Middle East.” Findex Notes, #2014-6. Washington, D.C.: World Bank, November.
World Bank. 2010. “The Insurance Sector in the Middle East and North Africa: Challenges and Development Agenda.” Washington, D.C.: World Bank.
10 The 2011 figure is used for Comoros, Djibouti, Morocco, Oman, Qatar, and Syria in the absence of data for 2014.11 Such products are not necessarily offered for free.12 Demirguc-Kunt et al. (2015) notably recommends digitizing wage payments, 80 percent of which are made in cash, as one option to improve financial inclusion in the region. To increase account use, it also recommends finding alternatives to bill and school fees payments.
Contact the authors for a copy of an Excel spreadsheet containing country-level information used in this paper: [email protected] or [email protected].

16
Financial Inclusion Measurement in the Arab World
6. ANNEXES
a. G20 Basic Set of Financial Inclusion Indicators
Categories Indicators Sources Dimension
1 Formally banked adults
% of adults with an account at a formal financial institution
Global Findex Usage
Number of depositors per 1,000 adults OR number of deposit accounts per 1,000 adults (%)
IMF FAS
2 Adults with credit by regulated institutions
% of adults with at least one loan outstanding from a regulated financial institution
Global Findex Usage
Number of borrowers per 1,000 adults OR number of outstanding loans per 1,000 adults (%)
IMF FAS
3 Formally banked enterprises
% of SMEs with an account at a formal financial institution
WBG Enterprise Survey
Usage
Number of SMEs with deposit accounts/number of deposit accounts OR number of SME deposi-tors/number of depositors
IMF FAS
4 Enterprises with outstanding loan or line of cred-it by regulated institutions
% of SMEs with outstanding loan or line of credit
Number of SMEs with outstanding loans/number of outstanding loans OR number of outstanding loans to SMEs/number of outstanding loans
WBG Enterprise Survey
IMF FAS
Usage
5 Points of service Number of branches per 100,000 adults
IMF FAS Access
17
Financial Inclusion Measurement in the Arab World
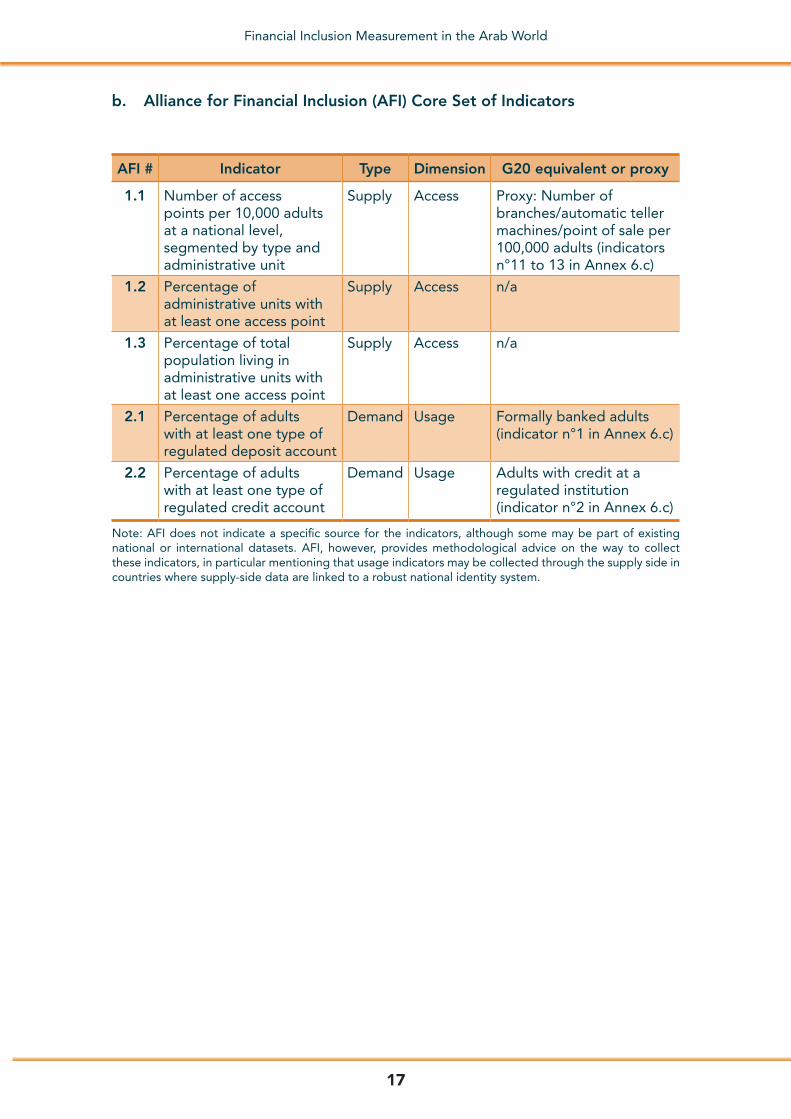
b. Alliance for Financial Inclusion (AFI) Core Set of Indicators
AFI # Indicator Type Dimension G20 equivalent or proxy
1.1 Number of access points per 10,000 adults at a national level, segmented by type and administrative unit
Supply Access Proxy: Number of branches/automatic teller machines/point of sale per 100,000 adults (indicators n°11 to 13 in Annex 6.c)
1.2 Percentage of administrative units with at least one access point
Supply Access n/a
1.3 Percentage of total population living in administrative units with at least one access point
Supply Access n/a
2.1 Percentage of adults with at least one type of regulated deposit account
Demand Usage Formally banked adults (indicator n°1 in Annex 6.c)
2.2 Percentage of adults with at least one type of regulated credit account
Demand Usage Adults with credit at a regulated institution (indicator n°2 in Annex 6.c)
Note: AFI does not indicate a specific source for the indicators, although some may be part of existing national or international datasets. AFI, however, provides methodological advice on the way to collect these indicators, in particular mentioning that usage indicators may be collected through the supply side in countries where supply-side data are linked to a robust national identity system.

18
Financial Inclusion Measurement in the Arab World
c.
G20
Ful
l Set
of
Fina
ncia
l Inc
lusi
on
Ind
icat
ors
Indi
cato
rs o
f the
G20
Bas
ic S
et a
re h
ighl
ight
ed in
bol
d.
2011
2014
G20
#
Cat
ego
ryIn
dic
ato
rSo
urce
and
co
vera
ge
Dim
ensi
onA
spec
tTy
pe
Ave
rag
eA
vera
ge
excl
. GC
CA
vera
ge
GC
CA
vera
ge
Ave
rag
e ex
cl. G
CC
Ave
rag
e G
CC
1Fo
rmal
ly
ban
ked
ad
ults
% o
f ad
ults
wit
h an
ac
coun
t at
a f
orm
al
finan
cial
inst
itut
ion
WB
Glo
bal
Fi
ndex
(cur
rent
, 14
8 co
untr
ies)
Usa
ge
Ind
ivid
uals
Dem
and
24%
18%
55%
29%
21%
74%
Num
ber
of
dep
osi
tors
p
er 1
,000
ad
ults
OR
nu
mb
er o
f d
epo
sit
acco
unts
per
1,0
00
adul
ts (%
)
IMF
FAS
(cur
rent
, 187
co
untr
ies)
Sup
ply
53%
44%
93%
60%
50%
104%
Num
ber o
f dep
osito
rs p
er
1,00
0 ad
ults
OR
num
ber
of d
epos
it ac
coun
ts p
er
1,00
0 ad
ults
(%)
IMF
FAS
(cur
rent
, 187
co
untr
ies)
Sup
ply
40%
35%
73%
43%
37%
80%
2
Ad
ults
wit
h cr
edit
at
reg
ulat
ed
inst
itut
ions
% o
f ad
ults
wit
h at
leas
t o
ne lo
an o
utst
and
ing
fr
om
a r
egul
ated
fina
n-ci
al in
stit
utio
n
WB
Glo
bal
Fi
ndex
(cur
rent
, 14
8 co
untr
ies)
Usa
ge
Ind
ivid
uals
Dem
and
5%4%
7%6%
5%13
%
Num
ber
of
bo
rro
wer
s p
er 1
,000
ad
ults
OR
nu
mb
er o
f o
utst
and
ing
lo
ans
per
1,0
00
adul
ts (%
)
IMF
FAS
(cur
rent
, 187
co
untr
ies)
Sup
ply
12%
10%
24%
15%
12%
30%
Num
ber
of b
orro
wer
s p
er
1,00
0 ad
ults
OR
num
ber
of
out
stan
din
g lo
ans
per
1,
000
adul
ts (%
)
IMF
FAS
(cur
rent
, 187
co
untr
ies)
Sup
ply
9%8%
18%
10%
9%19
%
3A
dul
ts w
ith
insu
ranc
e
Num
ber
of
insu
ranc
e p
olic
y ho
lder
s p
er
1,00
0 ad
ults
, seg
reg
at-
ed b
y lif
e an
d n
onl
ife
insu
ranc
e
IMF
FAS
(cur
rent
, 187
co
untr
ies)
Usa
ge
Ind
ivid
uals
Sup
ply
n/a
n/a
n/a
n/a
n/a
n/a
CG
AP
Sug
ges
ted
pro
xy:
Insu
ranc
e co
rpo
rati
ons
: o
f w
hich
: Life
insu
ranc
e p
olic
ies
3%4%
3%5%
5%n/
a
CG
AP
Sug
ges
ted
pro
xy:
Insu
ranc
e co
rpo
rati
ons
: o
f w
hich
: No
nlife
insu
r-an
ce p
olic
ies
26%
20%
29%
29%
21%
33%
CG
AP
Sug
ges
ted
pro
xy:
Life
insu
ranc
e p
rem
ium
vo
lum
e as
% o
f GD
P
Wo
rld
Ban
k (c
itin
g S
igm
a R
epo
rts,
Sw
iss
Re)
Usa
ge
n/a
0.2%
0.3%
0.1%
0.2%
0.3%
0.1%
4C
ashl
ess
tran
sact
ions
Num
ber
of r
etai
l cas
hles
s tr
ansa
ctio
ns p
er c
apita
C
ashl
ess
tran
sact
ions
are
de
fined
as
the
num
ber o
f pa
ymen
ts b
y ch
eck,
cre
d-it
tran
sfer
s, d
irect
deb
its,
and
paym
ent w
ith c
redi
t an
d de
bit c
ards
.
WB
Glo
bal
Pay
-m
ents
Sys
tem
s Su
rvey
(200
9 d
ata)
Usa
ge
Ind
ivid
uals
Sup
ply
12.3
12.3
12.1
n/a
n/a
n/a
5M
obile
tr
ansa
ctio
nal
use
% o
f ad
ults
who
use
th
eir
mo
bile
dev
ice
to
mak
e a
pay
men
t
WB
Glo
bal
Fi
ndex
(cur
rent
, 14
8 co
untr
ies)
Usa
ge
Ind
ivid
uals
Dem
and
n/a
n/a
n/a
13%
12%
18%
CG
AP
sug
ges
ted
pro
xy:
Mo
bile
pho
ne u
sed
to
p
ay b
ills
(% a
ge
151
)
WB
Glo
bal
Fi
ndex
(cur
rent
, 14
8 co
untr
ies)
Usa
ge
Ind
ivid
uals
Dem
and
5%4%
14%
n/a
n/a
n/a
(Con
tinue
d)

19
Financial Inclusion Measurement in the Arab World
2011
2014
G20
#
Cat
ego
ryIn
dic
ato
rSo
urce
and
co
vera
ge
Dim
ensi
onA
spec
tTy
pe
Ave
rag
eA
vera
ge
excl
. GC
CA
vera
ge
GC
CA
vera
ge
Ave
rag
e ex
cl. G
CC
Ave
rag
e G
CC
1Fo
rmal
ly
ban
ked
ad
ults
% o
f ad
ults
wit
h an
ac
coun
t at
a f
orm
al
finan
cial
inst
itut
ion
WB
Glo
bal
Fi
ndex
(cur
rent
, 14
8 co
untr
ies)
Usa
ge
Ind
ivid
uals
Dem
and
24%
18%
55%
29%
21%
74%
Num
ber
of
dep
osi
tors
p
er 1
,000
ad
ults
OR
nu
mb
er o
f d
epo
sit
acco
unts
per
1,0
00
adul
ts (%
)
IMF
FAS
(cur
rent
, 187
co
untr
ies)
Sup
ply
53%
44%
93%
60%
50%
104%
Num
ber o
f dep
osito
rs p
er
1,00
0 ad
ults
OR
num
ber
of d
epos
it ac
coun
ts p
er
1,00
0 ad
ults
(%)
IMF
FAS
(cur
rent
, 187
co
untr
ies)
Sup
ply
40%
35%
73%
43%
37%
80%
2
Ad
ults
wit
h cr
edit
at
reg
ulat
ed
inst
itut
ions
% o
f ad
ults
wit
h at
leas
t o
ne lo
an o
utst
and
ing
fr
om
a r
egul
ated
fina
n-ci
al in
stit
utio
n
WB
Glo
bal
Fi
ndex
(cur
rent
, 14
8 co
untr
ies)
Usa
ge
Ind
ivid
uals
Dem
and
5%4%
7%6%
5%13
%
Num
ber
of
bo
rro
wer
s p
er 1
,000
ad
ults
OR
nu
mb
er o
f o
utst
and
ing
lo
ans
per
1,0
00
adul
ts (%
)
IMF
FAS
(cur
rent
, 187
co
untr
ies)
Sup
ply
12%
10%
24%
15%
12%
30%
Num
ber
of b
orro
wer
s p
er
1,00
0 ad
ults
OR
num
ber
of
out
stan
din
g lo
ans
per
1,
000
adul
ts (%
)
IMF
FAS
(cur
rent
, 187
co
untr
ies)
Sup
ply
9%8%
18%
10%
9%19
%
3A
dul
ts w
ith
insu
ranc
e
Num
ber
of
insu
ranc
e p
olic
y ho
lder
s p
er
1,00
0 ad
ults
, seg
reg
at-
ed b
y lif
e an
d n
onl
ife
insu
ranc
e
IMF
FAS
(cur
rent
, 187
co
untr
ies)
Usa
ge
Ind
ivid
uals
Sup
ply
n/a
n/a
n/a
n/a
n/a
n/a
CG
AP
Sug
ges
ted
pro
xy:
Insu
ranc
e co
rpo
rati
ons
: o
f w
hich
: Life
insu
ranc
e p
olic
ies
3%4%
3%5%
5%n/
a
CG
AP
Sug
ges
ted
pro
xy:
Insu
ranc
e co
rpo
rati
ons
: o
f w
hich
: No
nlife
insu
r-an
ce p
olic
ies
26%
20%
29%
29%
21%
33%
CG
AP
Sug
ges
ted
pro
xy:
Life
insu
ranc
e p
rem
ium
vo
lum
e as
% o
f GD
P
Wo
rld
Ban
k (c
itin
g S
igm
a R
epo
rts,
Sw
iss
Re)
Usa
ge
n/a
0.2%
0.3%
0.1%
0.2%
0.3%
0.1%
4C
ashl
ess
tran
sact
ions
Num
ber
of r
etai
l cas
hles
s tr
ansa
ctio
ns p
er c
apita
C
ashl
ess
tran
sact
ions
are
de
fined
as
the
num
ber o
f pa
ymen
ts b
y ch
eck,
cre
d-it
tran
sfer
s, d
irect
deb
its,
and
paym
ent w
ith c
redi
t an
d de
bit c
ards
.
WB
Glo
bal
Pay
-m
ents
Sys
tem
s Su
rvey
(200
9 d
ata)
Usa
ge
Ind
ivid
uals
Sup
ply
12.3
12.3
12.1
n/a
n/a
n/a
5M
obile
tr
ansa
ctio
nal
use
% o
f ad
ults
who
use
th
eir
mo
bile
dev
ice
to
mak
e a
pay
men
t
WB
Glo
bal
Fi
ndex
(cur
rent
, 14
8 co
untr
ies)
Usa
ge
Ind
ivid
uals
Dem
and
n/a
n/a
n/a
13%
12%
18%
CG
AP
sug
ges
ted
pro
xy:
Mo
bile
pho
ne u
sed
to
p
ay b
ills
(% a
ge
151
)
WB
Glo
bal
Fi
ndex
(cur
rent
, 14
8 co
untr
ies)
Usa
ge
Ind
ivid
uals
Dem
and
5%4%
14%
n/a
n/a
n/a
(Con
tinue
d)
20
Financial Inclusion Measurement in the Arab World
2011
2014
G20
#
Cat
ego
ryIn
dic
ato
rSo
urce
and
co
vera
ge
Dim
ensi
onA
spec
tTy
pe
Ave
rag
eA
vera
ge
excl
. GC
CA
vera
ge
GC
CA
vera
ge
Ave
rag
e ex
cl. G
CC
Ave
rag
e G
CC
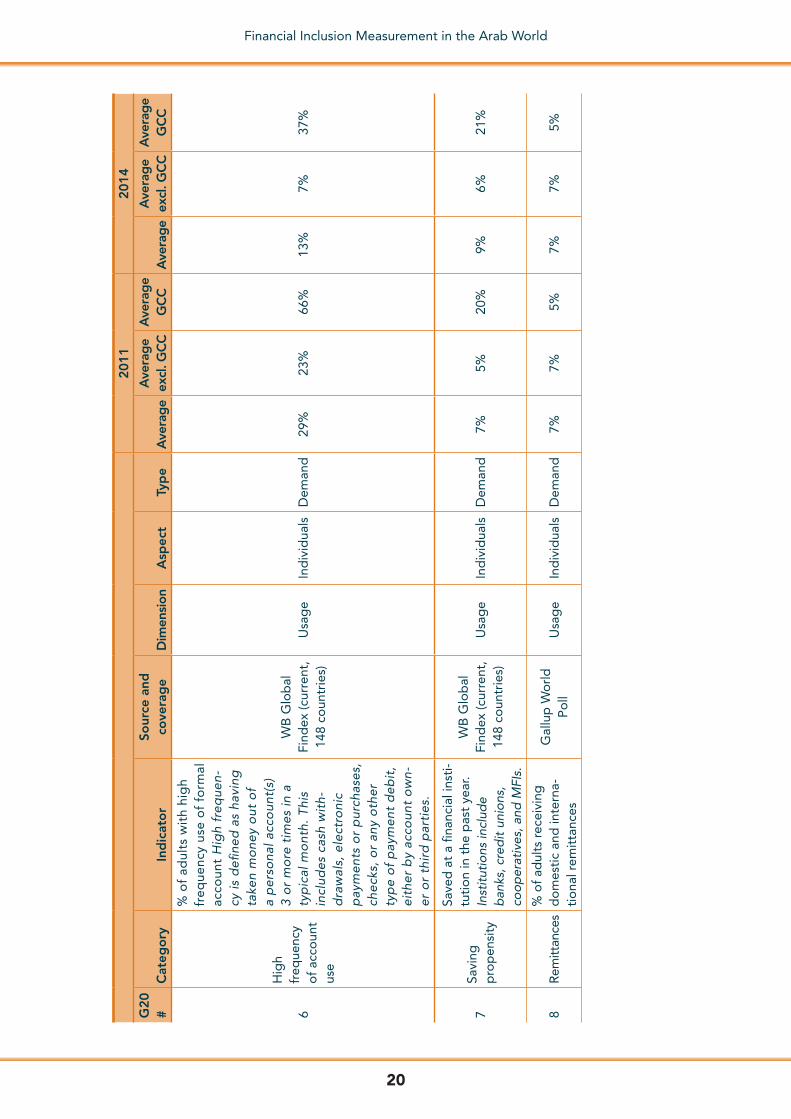
6
Hig
h fr
eque
ncy
of
acco
unt
use
% o
f ad
ults
wit
h hi
gh
freq
uenc
y us
e o
f fo
rmal
ac
coun
t H
igh
freq
uen-
cy is
defi
ned
as
havi
ng
take
n m
one
y o
ut o
f a
per
sona
l acc
oun
t(s)
3
or
mo
re t
imes
in a
ty
pic
al m
ont
h. T
his
incl
udes
cas
h w
ith-
dra
wal
s, e
lect
roni
c p
aym
ents
or
pur
chas
es,
chec
ks, o
r an
y o
ther
ty
pe
of
pay
men
t d
ebit
, ei
ther
by
acco
unt
ow
n-er
or
thir
d p
arti
es.
WB
Glo
bal
Fi
ndex
(cur
rent
, 14
8 co
untr
ies)
Usa
ge
Ind
ivid
uals
Dem
and
29%
23%
66%
13%
7%37
%
7Sa
ving
p
rop
ensi
ty
Save
d a
t a
finan
cial
inst
i-tu
tio
n in
the
pas
t ye
ar.
Inst
itutio
ns in
clud
e b
anks
, cre
dit
unio
ns,
coop
erat
ives
, and
MFI
s.
WB
Glo
bal
Fi
ndex
(cur
rent
, 14
8 co
untr
ies)
Usa
ge
Ind
ivid
uals
Dem
and
7%5%
20%
9%6%
21%
8R
emitt
ance
s%
of
adul
ts r
ecei
ving
d
om
esti
c an
d in
tern
a-ti
ona
l rem
itta
nces
Gal
lup
Wo
rld
P
oll
Usa
ge
Ind
ivid
uals
Dem
and
7%7%
5%7%
7%5%
9Fo
rmal
ly
ban
ked
en
terp
rise
s
% o
f SM
Es
wit
h an
ac
coun
t at
a f
orm
al
finan
cial
inst
itut
ion
WB
Ent
erp
rise
Su
rvey
s ( c
urre
nt,
119
coun
-tr
ies)
. Lat
est
avai
lab
le d
ata
(200
7–20
13).
Usa
ge
Ent
erp
rise
s
Dem
and
73%
73%
n/a
n/a
n/a
n/a
Num
ber
of
SME
s w
ith
dep
osi
t ac
coun
ts/n
um-
ber
of
dep
osi
t ac
coun
ts
OR
num
ber
of
SME
d
epo
sito
rs/n
umb
er o
f d
epo
sito
rs
IMF
FAS
(cur
rent
, 187
co
untr
ies)
Sup
ply
0.01
%0.
01%
n/a
0.01
%0.
01%
n/a
10
Ent
erp
rise
s w
ith
out
-st
and
ing
lo
an o
r lin
e o
f cr
edit
at
reg
ulat
ed
inst
itut
ions
% o
f SM
Es
wit
h o
ut-
stan
din
g lo
an o
r lin
e o
f cr
edit
WB
Ent
erp
rise
Su
rvey
s (c
ur-
rent
, 119
co
un-
trie
s). L
ates
t av
aila
ble
dat
a (2
007–
2013
).
Usa
ge
Ent
erp
rise
s
Dem
and
n/a
n/a
n/a
n/a
n/a
n/a
CG
AP
Sug
ges
ted
pro
xy:
Per
cent
age
of
firm
s w
ith
a b
ank
loan
/lin
e o
f cr
edit
WB
Ent
erp
rise
Su
rvey
s (c
ur-
rent
, 119
co
un-
trie
s). L
ates
t av
aila
ble
dat
a (2
007–
2013
).
Dem
and
22%
22%
n/a
n/a
n/a
n/a
Num
ber
of
SMEs
wit
h ou
tsta
ndin
g lo
ans/
num
-b
er o
f ou
tsta
ndin
g lo
ans
OR
num
ber
of
outs
tand
-in
g lo
ans
to S
MEs
/num
-b
er o
f ou
tsta
ndin
g lo
ans
IMF
FAS
(cur
rent
, 187
co
untr
ies)
Sup
ply
0.0%
0.0%
n/a
0.3%
0.3%
n/a
(Con
tinue
d)

21
Financial Inclusion Measurement in the Arab World
2011
2014
G20
#
Cat
ego
ryIn
dic
ato
rSo
urce
and
co
vera
ge
Dim
ensi
onA
spec
tTy
pe
Ave
rag
eA
vera
ge
excl
. GC
CA
vera
ge
GC
CA
vera
ge
Ave
rag
e ex
cl. G
CC
Ave
rag
e G
CC
6
Hig
h fr
eque
ncy
of
acco
unt
use
% o
f ad
ults
wit
h hi
gh
freq
uenc
y us
e o
f fo
rmal
ac
coun
t H
igh
freq
uen-
cy is
defi
ned
as
havi
ng
take
n m
one
y o
ut o
f a
per
sona
l acc
oun
t(s)
3
or
mo
re t
imes
in a
ty
pic
al m
ont
h. T
his
incl
udes
cas
h w
ith-
dra
wal
s, e
lect
roni
c p
aym
ents
or
pur
chas
es,
chec
ks, o
r an
y o
ther
ty
pe
of
pay
men
t d
ebit
, ei
ther
by
acco
unt
ow
n-er
or
thir
d p
arti
es.
WB
Glo
bal
Fi
ndex
(cur
rent
, 14
8 co
untr
ies)
Usa
ge
Ind
ivid
uals
Dem
and
29%
23%
66%
13%
7%37
%
7Sa
ving
p
rop
ensi
ty
Save
d a
t a
finan
cial
inst
i-tu
tio
n in
the
pas
t ye
ar.
Inst
itutio
ns in
clud
e b
anks
, cre
dit
unio
ns,
coop
erat
ives
, and
MFI
s.
WB
Glo
bal
Fi
ndex
(cur
rent
, 14
8 co
untr
ies)
Usa
ge
Ind
ivid
uals
Dem
and
7%5%
20%
9%6%
21%
8R
emitt
ance
s%
of
adul
ts r
ecei
ving
d
om
esti
c an
d in
tern
a-ti
ona
l rem
itta
nces
Gal
lup
Wo
rld
P
oll
Usa
ge
Ind
ivid
uals
Dem
and
7%7%
5%7%
7%5%
9Fo
rmal
ly
ban
ked
en
terp
rise
s
% o
f SM
Es
wit
h an
ac
coun
t at
a f
orm
al
finan
cial
inst
itut
ion
WB
Ent
erp
rise
Su
rvey
s ( c
urre
nt,
119
coun
-tr
ies)
. Lat
est
avai
lab
le d
ata
(200
7–20
13).
Usa
ge
Ent
erp
rise
s
Dem
and
73%
73%
n/a
n/a
n/a
n/a
Num
ber
of
SME
s w
ith
dep
osi
t ac
coun
ts/n
um-
ber
of
dep
osi
t ac
coun
ts
OR
num
ber
of
SME
d
epo
sito
rs/n
umb
er o
f d
epo
sito
rs
IMF
FAS
(cur
rent
, 187
co
untr
ies)
Sup
ply
0.01
%0.
01%
n/a
0.01
%0.
01%
n/a
10
Ent
erp
rise
s w
ith
out
-st
and
ing
lo
an o
r lin
e o
f cr
edit
at
reg
ulat
ed
inst
itut
ions
% o
f SM
Es
wit
h o
ut-
stan
din
g lo
an o
r lin
e o
f cr
edit
WB
Ent
erp
rise
Su
rvey
s (c
ur-
rent
, 119
co
un-
trie
s). L
ates
t av
aila
ble
dat
a (2
007–
2013
).
Usa
ge
Ent
erp
rise
s
Dem
and
n/a
n/a
n/a
n/a
n/a
n/a
CG
AP
Sug
ges
ted
pro
xy:
Per
cent
age
of
firm
s w
ith
a b
ank
loan
/lin
e o
f cr
edit
WB
Ent
erp
rise
Su
rvey
s (c
ur-
rent
, 119
co
un-
trie
s). L
ates
t av
aila
ble
dat
a (2
007–
2013
).
Dem
and
22%
22%
n/a
n/a
n/a
n/a
Num
ber
of
SMEs
wit
h ou
tsta
ndin
g lo
ans/
num
-b
er o
f ou
tsta
ndin
g lo
ans
OR
num
ber
of
outs
tand
-in
g lo
ans
to S
MEs
/num
-b
er o
f ou
tsta
ndin
g lo
ans
IMF
FAS
(cur
rent
, 187
co
untr
ies)
Sup
ply
0.0%
0.0%
n/a
0.3%
0.3%
n/a
(Con
tinue
d)
22
Financial Inclusion Measurement in the Arab World
2011
2014
G20
#
Cat
ego
ryIn
dic
ato
rSo
urce
and
co
vera
ge
Dim
ensi
onA
spec
tTy
pe
Ave
rag
eA
vera
ge
excl
. GC
CA
vera
ge
GC
CA
vera
ge
Ave
rag
e ex
cl. G
CC
Ave
rag
e G
CC
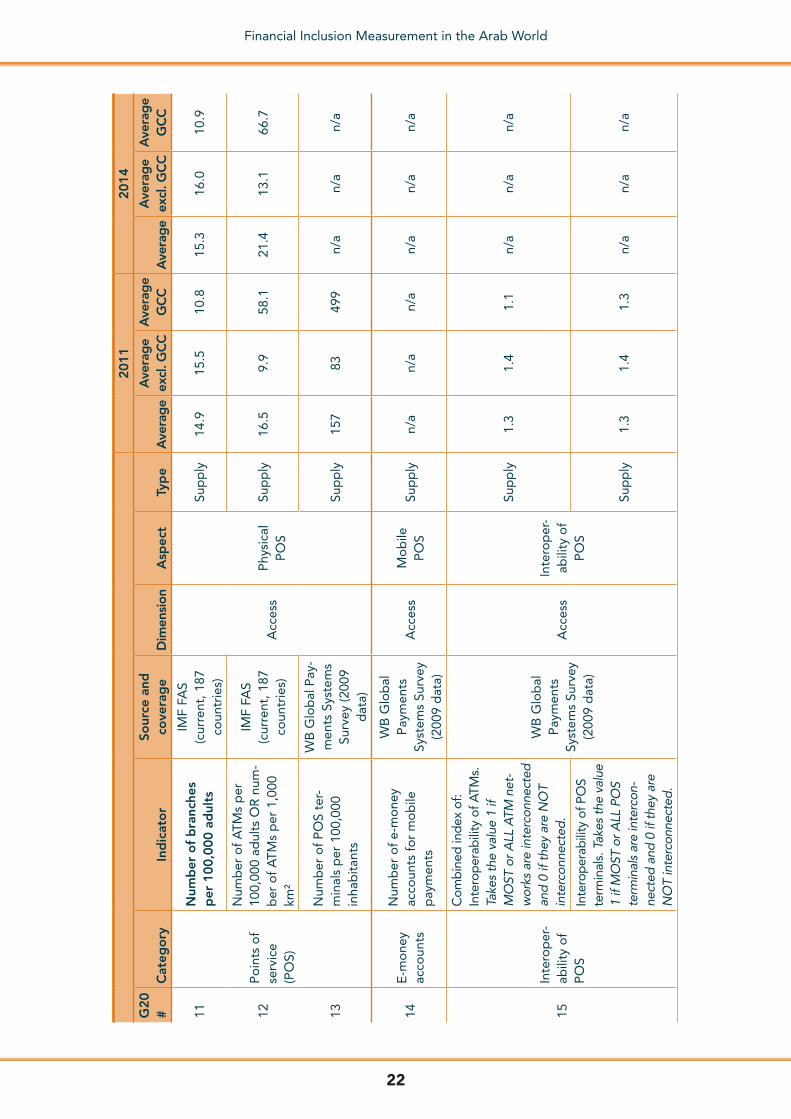
11
Po
ints
of
serv
ice
(PO
S)
Num
ber
of
bra
nche
s p
er 1
00,0
00 a
dul
ts
IMF
FAS
(cur
rent
, 187
co
untr
ies)
Acc
ess
Phy
sica
l P
OS
Sup
ply
14.9
15.5
10.8
15.3
16.0
10.9
12
Num
ber
of
ATM
s p
er
100,
000
adul
ts O
R n
um-
ber
of
ATM
s p
er 1
,000
km
²
IMF
FAS
(cur
rent
, 187
co
untr
ies)
Sup
ply
16.5
9.9
58.1
21.4
13.1
66.7
13N
umb
er o
f P
OS
ter-
min
als
per
100
,000
in
hab
itan
ts
WB
Glo
bal
Pay
-m
ents
Sys
tem
s Su
rvey
(200
9 d
ata)
Sup
ply
157
8349
9n/
an/
an/
a
14E
-mo
ney
acco
unts
Num
ber
of
e-m
one
y ac
coun
ts f
or
mo
bile
p
aym
ents
WB
Glo
bal
P
aym
ents
Sy
stem
s Su
rvey
(2
009
dat
a)
Acc
ess
Mo
bile
P
OS
Sup
ply
n/a
n/a
n/a
n/a
n/a
n/a
15In
tero
per
-ab
ility
of
PO
S
Com
bin
ed in
dex
of:
Inte
rop
erab
ility
of A
TMs.
Ta
kes
the
valu
e 1
if M
OST
or A
LL A
TM n
et-
wor
ks a
re in
terc
onne
cted
an
d 0
if th
ey a
re N
OT
inte
rcon
nect
ed.
WB
Glo
bal
P
aym
ents
Sy
stem
s Su
rvey
(2
009
dat
a)
Acc
ess
Inte
rop
er-
abili
ty o
f P
OS
Sup
ply
1.3
1.4
1.1
n/a
n/a
n/a
Inte
rop
erab
ility
of P
OS
term
inal
s. T
akes
the
valu
e 1
if M
OST
or A
LL P
OS
term
inal
s ar
e in
terc
on-
nect
ed a
nd 0
if th
ey a
re
NO
T in
terc
onne
cted
.
Sup
ply
1.3
1.4
1.3
n/a
n/a
n/a
16Fi
nanc
ial
kno
wle
dg
e
Fina
ncia
l kno
wle
dge
scor
e: A
rithm
etic
sco
re
that
sum
s up
cor
rect
re
spon
ses
to q
uest
ions
ab
out b
asic
fina
ncia
l con
-ce
pts,
suc
h as
(a) i
nflat
ion,
(b
) int
eres
t rat
e, (c
) com
-po
und
inte
rest
, (d)
mon
ey
illus
ion,
(e) r
isk
dive
rsifi
ca-
tion,
(f )
mai
n pu
rpos
e of
in
sura
nce.
WB
Fin
anci
al C
a-p
abili
ty S
urve
ys
& O
ECD
Nat
ion-
al F
inan
cial
Lite
r-ac
y an
d In
clus
ion
Surv
eys
(cur
rent
, 34
cou
ntrie
s co
mb
ined
, es
timat
ed 7
0 co
untr
ies
in 2
ye
ars)
Qua
lity
Fina
ncia
l Li
tera
cy &
C
apab
ility
n/a
6464
n/a
n/a
n/a
n/a
17Fi
nanc
ial
Beh
avio
ur
Sour
ce o
f em
erg
ency
fu
ndin
g R
espo
nse:
If y
ou
had
an e
mer
genc
y th
at
requ
ired
[$10
or 1
/25
of G
DPP
C] u
rgen
tly,
whe
re w
ould
you
get
the
mon
ey?
(a) b
orro
w fr
om
frie
nds/
rela
tive;
(b) w
ork
mor
e; (c
) sel
l ass
ets;
(d)
use
only
sav
ings
; (e)
loan
fr
om s
avin
gs c
lub;
(f )
loan
fr
om b
ank;
(g) w
ould
not
be
abl
e to
find
it.
WB
Glo
bal
Fi
ndex
(fo
rth-
com
ing
, 148
co
untr
ies)
Qua
lity
Fina
ncia
l Li
tera
cy &
C
apab
ility
Dem
and
n/a
n/a
n/a
n/a
n/a
n/a
CG
AP
sugg
este
d pr
oxy:
Sa
ved
for e
mer
genc
ies
in
the
past
yea
r (%
age
151
)18
%16
%29
%n/
an/
an/
a
CG
AP
sug
ges
ted
pro
xy:
Out
stan
din
g lo
an f
or
heal
th o
r em
erg
enci
es
(% a
ge
151
)
16%
17%
10%
0%0%
0%
CG
AP
sug
ges
ted
pro
xy:
Co
min
g u
p w
ith
emer
-g
ency
fun
din
g: n
ot
at a
ll p
oss
ible
(% a
ge
151
)
n/a
n/a
n/a
33.0
%33
.7%
29.5
%
(Con
tinue
d)

23
Financial Inclusion Measurement in the Arab World
2011
2014
G20
#
Cat
ego
ryIn
dic
ato
rSo
urce
and
co
vera
ge
Dim
ensi
onA
spec
tTy
pe
Ave
rag
eA
vera
ge
excl
. GC
CA
vera
ge
GC
CA
vera
ge
Ave
rag
e ex
cl. G
CC
Ave
rag
e G
CC
11
Po
ints
of
serv
ice
(PO
S)
Num
ber
of
bra
nche
s p
er 1
00,0
00 a
dul
ts
IMF
FAS
(cur
rent
, 187
co
untr
ies)
Acc
ess
Phy
sica
l P
OS
Sup
ply
14.9
15.5
10.8
15.3
16.0
10.9
12
Num
ber
of
ATM
s p
er
100,
000
adul
ts O
R n
um-
ber
of
ATM
s p
er 1
,000
km
²
IMF
FAS
(cur
rent
, 187
co
untr
ies)
Sup
ply
16.5
9.9
58.1
21.4
13.1
66.7
13N
umb
er o
f P
OS
ter-
min
als
per
100
,000
in
hab
itan
ts
WB
Glo
bal
Pay
-m
ents
Sys
tem
s Su
rvey
(200
9 d
ata)
Sup
ply
157
8349
9n/
an/
an/
a
14E
-mo
ney
acco
unts
Num
ber
of
e-m
one
y ac
coun
ts f
or
mo
bile
p
aym
ents
WB
Glo
bal
P
aym
ents
Sy
stem
s Su
rvey
(2
009
dat
a)
Acc
ess
Mo
bile
P
OS
Sup
ply
n/a
n/a
n/a
n/a
n/a
n/a
15In
tero
per
-ab
ility
of
PO
S
Com
bin
ed in
dex
of:
Inte
rop
erab
ility
of A
TMs.
Ta
kes
the
valu
e 1
if M
OST
or A
LL A
TM n
et-
wor
ks a
re in
terc
onne
cted
an
d 0
if th
ey a
re N
OT
inte
rcon
nect
ed.
WB
Glo
bal
P
aym
ents
Sy
stem
s Su
rvey
(2
009
dat
a)
Acc
ess
Inte
rop
er-
abili
ty o
f P
OS
Sup
ply
1.3
1.4
1.1
n/a
n/a
n/a
Inte
rop
erab
ility
of P
OS
term
inal
s. T
akes
the
valu
e 1
if M
OST
or A
LL P
OS
term
inal
s ar
e in
terc
on-
nect
ed a
nd 0
if th
ey a
re
NO
T in
terc
onne
cted
.
Sup
ply
1.3
1.4
1.3
n/a
n/a
n/a
16Fi
nanc
ial
kno
wle
dg
e
Fina
ncia
l kno
wle
dge
scor
e: A
rithm
etic
sco
re
that
sum
s up
cor
rect
re
spon
ses
to q
uest
ions
ab
out b
asic
fina
ncia
l con
-ce
pts,
suc
h as
(a) i
nflat
ion,
(b
) int
eres
t rat
e, (c
) com
-po
und
inte
rest
, (d)
mon
ey
illus
ion,
(e) r
isk
dive
rsifi
ca-
tion,
(f )
mai
n pu
rpos
e of
in
sura
nce.
WB
Fin
anci
al C
a-p
abili
ty S
urve
ys
& O
ECD
Nat
ion-
al F
inan
cial
Lite
r-ac
y an
d In
clus
ion
Surv
eys
(cur
rent
, 34
cou
ntrie
s co
mb
ined
, es
timat
ed 7
0 co
untr
ies
in 2
ye
ars)
Qua
lity
Fina
ncia
l Li
tera
cy &
C
apab
ility
n/a
6464
n/a
n/a
n/a
n/a
17Fi
nanc
ial
Beh
avio
ur
Sour
ce o
f em
erg
ency
fu
ndin
g R
espo
nse:
If y
ou
had
an e
mer
genc
y th
at
requ
ired
[$10
or 1
/25
of G
DPP
C] u
rgen
tly,
whe
re w
ould
you
get
the
mon
ey?
(a) b
orro
w fr
om
frie
nds/
rela
tive;
(b) w
ork
mor
e; (c
) sel
l ass
ets;
(d)
use
only
sav
ings
; (e)
loan
fr
om s
avin
gs c
lub;
(f )
loan
fr
om b
ank;
(g) w
ould
not
be
abl
e to
find
it.
WB
Glo
bal
Fi
ndex
(fo
rth-
com
ing
, 148
co
untr
ies)
Qua
lity
Fina
ncia
l Li
tera
cy &
C
apab
ility
Dem
and
n/a
n/a
n/a
n/a
n/a
n/a
CG
AP
sugg
este
d pr
oxy:
Sa
ved
for e
mer
genc
ies
in
the
past
yea
r (%
age
151
)18
%16
%29
%n/
an/
an/
a
CG
AP
sug
ges
ted
pro
xy:
Out
stan
din
g lo
an f
or
heal
th o
r em
erg
enci
es
(% a
ge
151
)
16%
17%
10%
0%0%
0%
CG
AP
sug
ges
ted
pro
xy:
Co
min
g u
p w
ith
emer
-g
ency
fun
din
g: n
ot
at a
ll p
oss
ible
(% a
ge
151
)
n/a
n/a
n/a
33.0
%33
.7%
29.5
%
(Con
tinue
d)

24
Financial Inclusion Measurement in the Arab World
2011
2014
G20
#
Cat
ego
ryIn
dic
ato
rSo
urce
and
co
vera
ge
Dim
ensi
onA
spec
tTy
pe
Ave
rag
eA
vera
ge
excl
. GC
CA
vera
ge
GC
CA
vera
ge
Ave
rag
e ex
cl. G
CC
Ave
rag
e G
CC
18D
iscl
osu
re
Req
uire
-m
ents
Dis
clo
sure
ind
ex c
om
-b
inin
g e
xist
ence
of
a va
riet
y o
f d
iscl
osu
re
req
uire
men
ts:
(1) P
lain
lang
uag
e re
-q
uire
men
t (e
.g.,
und
er-
stan
dab
le, p
rohi
biti
on
of h
idd
en c
laus
es),
(2) L
ocal
lang
uag
e re
qui
rem
ent,
(3) P
re-
scrib
ed s
tand
ard
ized
d
iscl
osur
e fo
rmat
, (4
) Rec
ours
e rig
hts
and
pro
cess
es (5
) Tot
al
rate
to
be
pai
d fo
r a
cred
it (b
asic
cos
ts p
lus
com
mis
sion
rat
es, f
ees,
in
sura
nce,
tax
es).
WB
Glo
bal
Fi
nanc
ial
Co
nsum
er P
ro-
tect
ion
Surv
ey
(cur
rent
, 102
co
untr
ies)
201
3 d
ata
Qua
lity
Mar
ket
Co
nduc
t &
C
ons
umer
P
rote
ctio
n
n/a
n/a
n/a
n/a
n/a
n/a
n/a
CG
AP
sug
ges
ted
pro
xy:
Co
unt
of
6 p
rici
ng d
is-
clo
sure
req
uire
men
ts3.
73.
93.
23.
73.
93.
2
19D
isp
ute
Res
olu
tio
n
Ind
ex re
flect
ing
the
exis
-te
nce
of fo
rmal
inte
rnal
an
d e
xter
nal d
isp
ute
reso
lutio
n m
echa
nism
s:
(a) I
nter
nal d
ispu
te re
solu
-tio
n m
echa
nism
indi
cato
r:
law
or r
egul
atio
n se
ttin
g
stan
dard
s fo
r com
plai
nts
reso
lutio
n an
d ha
ndlin
g
by fi
nanc
ial i
nstit
utio
ns
(incl
udin
g tim
elin
ess,
ac-
cess
ibili
ty, r
equi
rem
ents
to
impl
emen
t com
plai
nts
hand
ling
proc
edur
es)
(b) E
xter
nal d
ispu
te re
so-
lutio
n m
echa
nism
indi
ca-
tor:
Syst
em in
pla
ce th
at
allo
ws
a cu
stom
er to
see
k af
ford
able
and
effi
cien
t re
cour
se w
ith a
third
par
-ty
(sup
ervi
sory
age
ncy,
a
finan
cial
om
buds
man
or
equi
vale
nt in
stitu
tion)
WB
Glo
bal
Fi
nanc
ial
Co
nsum
er
Pro
tect
ion
Surv
ey (c
urre
nt,
102
coun
trie
s)
2013
dat
a
Qua
lity
Mar
ket
Co
nduc
t &
C
ons
umer
P
rote
ctio
n
n/a
n/a
n/a
n/a
n/a
n/a
n/a
CG
AP
sug
ges
ted
pro
xy:
Cou
nt o
f int
erna
l mec
h-an
ism
s 1
cou
nt o
f ext
er-
nal m
echa
nism
s
n/a
n/a
n/a
n/a
n/a
n/a
(Con
tinue
d)

25
Financial Inclusion Measurement in the Arab World
2011
2014
G20
#
Cat
ego
ryIn
dic
ato
rSo
urce
and
co
vera
ge
Dim
ensi
onA
spec
tTy
pe
Ave
rag
eA
vera
ge
excl
. GC
CA
vera
ge
GC
CA
vera
ge
Ave
rag
e ex
cl. G
CC
Ave
rag
e G
CC
18D
iscl
osu
re
Req
uire
-m
ents
Dis
clo
sure
ind
ex c
om
-b
inin
g e
xist
ence
of
a va
riet
y o
f d
iscl
osu
re
req
uire
men
ts:
(1) P
lain
lang
uag
e re
-q
uire
men
t (e
.g.,
und
er-
stan
dab
le, p
rohi
biti
on
of h
idd
en c
laus
es),
(2) L
ocal
lang
uag
e re
qui
rem
ent,
(3) P
re-
scrib
ed s
tand
ard
ized
d
iscl
osur
e fo
rmat
, (4
) Rec
ours
e rig
hts
and
pro
cess
es (5
) Tot
al
rate
to
be
pai
d fo
r a
cred
it (b
asic
cos
ts p
lus
com
mis
sion
rat
es, f
ees,
in
sura
nce,
tax
es).
WB
Glo
bal
Fi
nanc
ial
Co
nsum
er P
ro-
tect
ion
Surv
ey
(cur
rent
, 102
co
untr
ies)
201
3 d
ata
Qua
lity
Mar
ket
Co
nduc
t &
C
ons
umer
P
rote
ctio
n
n/a
n/a
n/a
n/a
n/a
n/a
n/a
CG
AP
sug
ges
ted
pro
xy:
Co
unt
of
6 p
rici
ng d
is-
clo
sure
req
uire
men
ts3.
73.
93.
23.
73.
93.
2
19D
isp
ute
Res
olu
tio
n
Ind
ex re
flect
ing
the
exis
-te
nce
of fo
rmal
inte
rnal
an
d e
xter
nal d
isp
ute
reso
lutio
n m
echa
nism
s:
(a) I
nter
nal d
ispu
te re
solu
-tio
n m
echa
nism
indi
cato
r:
law
or r
egul
atio
n se
ttin
g
stan
dard
s fo
r com
plai
nts
reso
lutio
n an
d ha
ndlin
g
by fi
nanc
ial i
nstit
utio
ns
(incl
udin
g tim
elin
ess,
ac-
cess
ibili
ty, r
equi
rem
ents
to
impl
emen
t com
plai
nts
hand
ling
proc
edur
es)
(b) E
xter
nal d
ispu
te re
so-
lutio
n m
echa
nism
indi
ca-
tor:
Syst
em in
pla
ce th
at
allo
ws
a cu
stom
er to
see
k af
ford
able
and
effi
cien
t re
cour
se w
ith a
third
par
-ty
(sup
ervi
sory
age
ncy,
a
finan
cial
om
buds
man
or
equi
vale
nt in
stitu
tion)
WB
Glo
bal
Fi
nanc
ial
Co
nsum
er
Pro
tect
ion
Surv
ey (c
urre
nt,
102
coun
trie
s)
2013
dat
a
Qua
lity
Mar
ket
Co
nduc
t &
C
ons
umer
P
rote
ctio
n
n/a
n/a
n/a
n/a
n/a
n/a
n/a
CG
AP
sug
ges
ted
pro
xy:
Cou
nt o
f int
erna
l mec
h-an
ism
s 1
cou
nt o
f ext
er-
nal m
echa
nism
s
n/a
n/a
n/a
n/a
n/a
n/a
(Con
tinue
d)
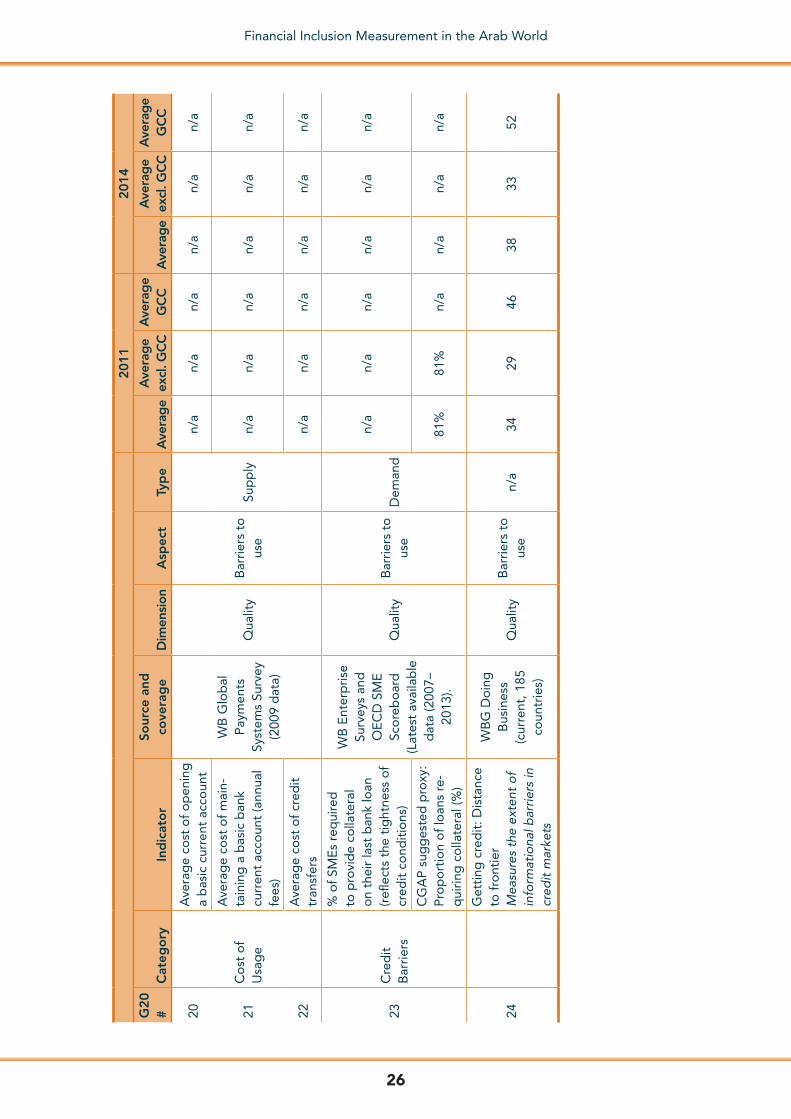
26
Financial Inclusion Measurement in the Arab World
2011
2014
G20
#
Cat
ego
ryIn
dic
ato
rSo
urce
and
co
vera
ge
Dim
ensi
onA
spec
tTy
pe
Ave
rag
eA
vera
ge
excl
. GC
CA
vera
ge
GC
CA
vera
ge
Ave
rag
e ex
cl. G
CC
Ave
rag
e G
CC
20
Co
st o
f U
sag
e
Ave
rag
e co
st o
f o
pen
ing
a
bas
ic c
urre
nt a
cco
unt
WB
Glo
bal
P
aym
ents
Sy
stem
s Su
rvey
(2
009
dat
a)
Qua
lity
Bar
rier
s to
us
eSu
pp
ly
n/a
n/a
n/a
n/a
n/a
n/a
21
Ave
rag
e co
st o
f m
ain-
tain
ing
a b
asic
ban
k cu
rren
t ac
coun
t (a
nnua
l fe
es)
n/a
n/a
n/a
n/a
n/a
n/a
22A
vera
ge
cost
of
cred
it
tran
sfer
sn/
an/
an/
an/
an/
an/
a
23C
red
it
Bar
rier
s
% o
f SM
Es
req
uire
d
to p
rovi
de
colla
tera
l o
n th
eir
last
ban
k lo
an
(refl
ects
the
tig
htne
ss o
f cr
edit
co
ndit
ions
)
WB
Ent
erp
rise
Su
rvey
s an
d
OE
CD
SM
E
Sco
reb
oar
d
(Lat
est
avai
lab
le
dat
a ( 2
007–
2013
).
Qua
lity
Bar
rier
s to
us
eD
eman
d
n/a
n/a
n/a
n/a
n/a
n/a
CG
AP
sug
ges
ted
pro
xy:
Pro
po
rtio
n o
f lo
ans
re-
qui
ring
co
llate
ral (
%)
81%
81%
n/a
n/a
n/a
n/a
24
Get
ting
cre
dit
: Dis
tanc
e to
fro
ntie
r M
easu
res
the
exte
nt o
f in
form
atio
nal b
arrie
rs in
cr
edit
mar
kets
WB
G D
oin
g
Bus
ines
s (c
urre
nt, 1
85
coun
trie
s)
Qua
lity
Bar
rier
s to
us
en/
a34
2946
3833
52


![T The h e d o u Bedouin TThe he BBedouinedouin ......Arab Society in Israel – An Information Manual for Policy Makers (2009) [Hebrew] Economic Benefits of Social Inclusion and Arab-Jewish](https://img.dokumen.tips/doc/110x75/5f4bbeff9b9d421760522cd8/t-the-h-e-d-o-u-bedouin-tthe-he-bbedouinedouin-arab-society-in-israel-a.jpg)