Embed Size (px)
Citation preview
Report on the State of Financial Inclusion in
the Philippines
Inclusive Finance Advocacy Staff
Supervision and Examination Sector
State of Financial Inclusion in the Philippines | 2012 Data Updates
2
Background
The Bangko Sentral ng Pilipinas (BSP) continues to develop a financial inclusion data
framework that will allow it to monitor progress, identify gaps and craft evidence-based
financial inclusion policies. Initial work has been done to assess the state of financial
inclusion in the Philippines, leveraging on datasets derived from regulatory reports provided
by supervised institutions to the BSP, and on readily available information as of end-year
2011. Said report provided baseline information on the levels and trends of financial
inclusion in the country.
Through the Inclusive Finance Advocacy Staff (IFAS)1, several initiatives were
undertaken to improve data collection and continuously monitor information related to
financial inclusion. One of these initiatives is the institutionalized information sharing with
other departments within the BSP as well as with other agencies that are handling inclusion-
relevant data. This facilitated the gathering of information on other major financial service
providers such as non-bank financial institutions (NBFIs), e-money agents and credit
cooperatives.
As one of the key components in its financial inclusion strategy, the BSP created a
Data and Measurement Working Group (DMG) within the Inclusive Finance Steering
Committee (IFSC), a bank-wide committee that was constituted to ensure a coordinated
focus in pursuing programs supportive of finance inclusion. The DMG assists in the data
requirements of the IFSC and ascertains the proper measurement of the effectiveness of
financial inclusion programs.
Other key data initiatives include: (i) creation of a financial inclusion database and e-
library; (ii) spatial mapping and geo-coding of access points; and (iii) preparatory work for
product catalogue and national baseline survey.
The end-year 2012 data updates leverage on the key data elements presented in the
maiden report and serve as an inventory of the progress made from 2011 to 2012. These
updates also form part of the stocktaking process in the envisioned data framework.
1 IFAS is the dedicated unit that implements, coordinates and advocates the microfinance and financial
inclusion initiatives of the BSP.

State of Financial Inclusion in the Philippines | 2012 Data Updates
3
Data Highlights
Access
• The Philippine banking system’s overall physical network continued to expand. The number
of domestic banking offices and automated teller machines (ATMs) increased by 4% and
15%, respectively.
• While the percentage of unbanked cities and municipalities in the country remained at 37%
(611 out of 1,634), our micro-banking office (MBO) policy has enabled banking presence in
areas that were previously unserved. The number of municipalities without regular banking
offices but have MBOs increased by 35% to 50 in 2012 from 37 in 2011.
• The number of alternative financial service providers (FSPs)2 increased by 20% to 46,218 in
2012 from 38,397 in 2011. While the increase is partly due to additional data on access
points which were not captured in the maiden report3, the numbers suggest a significant
area of opportunity. It shows the potential of expanding the reach of financial services
especially in areas with no banks.
• One new feature of the 2012 status report is the analysis of the geographic distribution of
banks and alternative FSPs in relation to population and poverty incidence. Results of
geocoding and spatial mapping validated the expected correlations, specifically for banking
distribution. The maps confirmed that the geographic distribution of banks is skewed toward
areas with large population and/or low poverty incidence. Alternative FSPs, on the other
hand, seem to prove otherwise. They are available even in areas with small population
and/or high poverty incidence. Because of their presence in areas that are not served by
banks, there will be a significant reduction in the percentage of unserved municipalities. Of
the 611 unbanked municipalities, 395 municipalities (65%) have access to alternative FSPs.
This indicates that only 216 municipalities (equivalent to 13% of 1,634 cities and
municipalities and 4% of the total Philippine population) are left unserved.
• As to the access indicators, bank density remains at 6 banking offices per city/municipality.
On the average, there is one bank and 2 ATMs for every 10,000 Filipino adults. Similar to the
observation noted in the maiden report, there are some marked regional disparities where
concentration is at NCR, CALABARZON and Central Luzon while regions such as Eastern
Visayas and ARMM are often mentioned for consistently belonging in the bottom group for
most of the indicators.
2 Alternative FSPs include NSSLAs, credit cooperatives, pawnshops and other nonbank financial institutions
(NBFIs), ATMs, remittance agents, e-money agents, and money changers/ foreign exchange dealers. 3 Data on cooperatives, NSSLAs and other NBFIs, and more complete information on e-money agents were
collected starting 2012.
State of Financial Inclusion in the Philippines | 2012 Data Updates
4
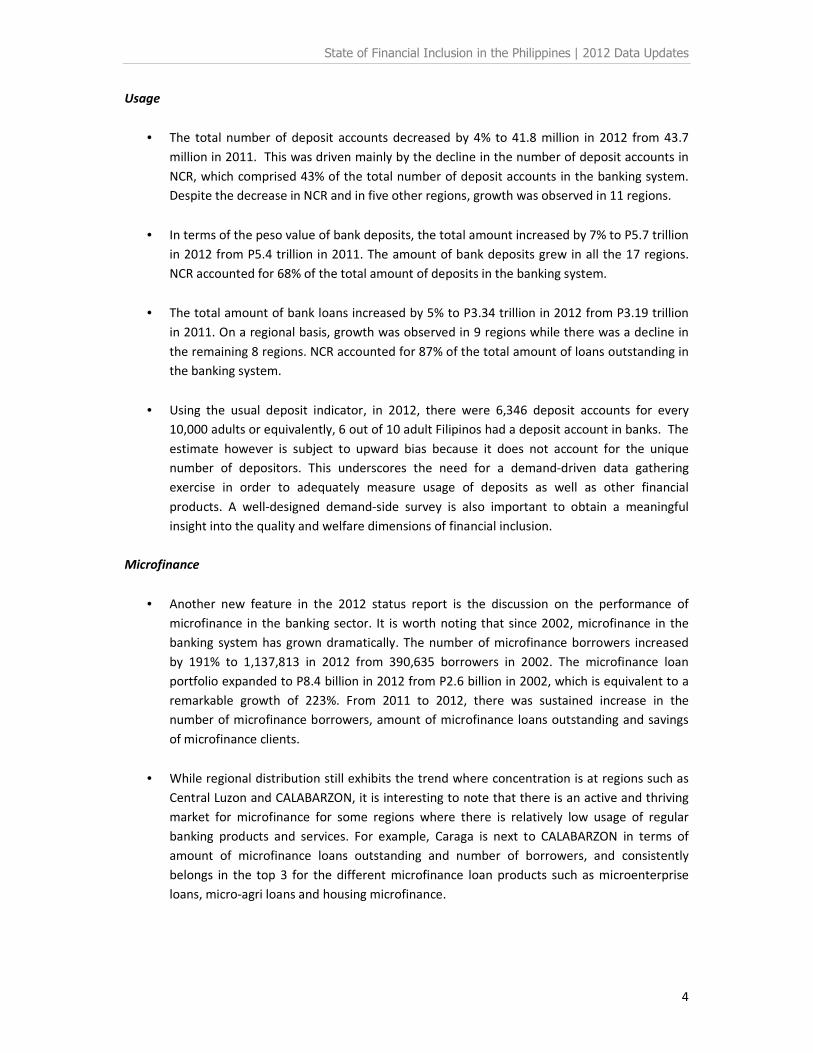
Usage
• The total number of deposit accounts decreased by 4% to 41.8 million in 2012 from 43.7
million in 2011. This was driven mainly by the decline in the number of deposit accounts in
NCR, which comprised 43% of the total number of deposit accounts in the banking system.
Despite the decrease in NCR and in five other regions, growth was observed in 11 regions.
• In terms of the peso value of bank deposits, the total amount increased by 7% to P5.7 trillion
in 2012 from P5.4 trillion in 2011. The amount of bank deposits grew in all the 17 regions.
NCR accounted for 68% of the total amount of deposits in the banking system.
• The total amount of bank loans increased by 5% to P3.34 trillion in 2012 from P3.19 trillion
in 2011. On a regional basis, growth was observed in 9 regions while there was a decline in
the remaining 8 regions. NCR accounted for 87% of the total amount of loans outstanding in
the banking system.
• Using the usual deposit indicator, in 2012, there were 6,346 deposit accounts for every
10,000 adults or equivalently, 6 out of 10 adult Filipinos had a deposit account in banks. The
estimate however is subject to upward bias because it does not account for the unique
number of depositors. This underscores the need for a demand-driven data gathering
exercise in order to adequately measure usage of deposits as well as other financial
products. A well-designed demand-side survey is also important to obtain a meaningful
insight into the quality and welfare dimensions of financial inclusion.
Microfinance
• Another new feature in the 2012 status report is the discussion on the performance of
microfinance in the banking sector. It is worth noting that since 2002, microfinance in the
banking system has grown dramatically. The number of microfinance borrowers increased
by 191% to 1,137,813 in 2012 from 390,635 borrowers in 2002. The microfinance loan
portfolio expanded to P8.4 billion in 2012 from P2.6 billion in 2002, which is equivalent to a
remarkable growth of 223%. From 2011 to 2012, there was sustained increase in the
number of microfinance borrowers, amount of microfinance loans outstanding and savings
of microfinance clients.
• While regional distribution still exhibits the trend where concentration is at regions such as
Central Luzon and CALABARZON, it is interesting to note that there is an active and thriving
market for microfinance for some regions where there is relatively low usage of regular
banking products and services. For example, Caraga is next to CALABARZON in terms of
amount of microfinance loans outstanding and number of borrowers, and consistently
belongs in the top 3 for the different microfinance loan products such as microenterprise
loans, micro-agri loans and housing microfinance.
State of Financial Inclusion in the Philippines | 2012 Data Updates
5
ACCESS
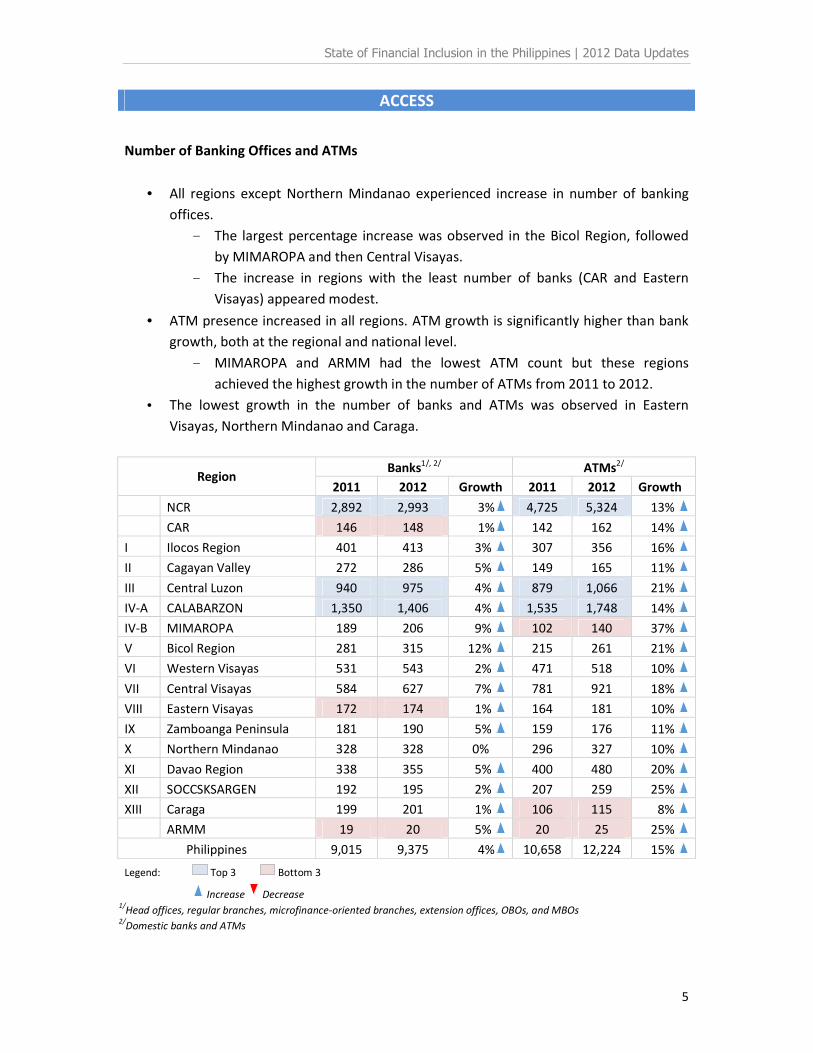
Number of Banking Offices and ATMs
• All regions except Northern Mindanao experienced increase in number of banking
offices.
- The largest percentage increase was observed in the Bicol Region, followed
by MIMAROPA and then Central Visayas.
- The increase in regions with the least number of banks (CAR and Eastern
Visayas) appeared modest.
• ATM presence increased in all regions. ATM growth is significantly higher than bank
growth, both at the regional and national level.
- MIMAROPA and ARMM had the lowest ATM count but these regions
achieved the highest growth in the number of ATMs from 2011 to 2012.
• The lowest growth in the number of banks and ATMs was observed in Eastern
Visayas, Northern Mindanao and Caraga.
Region Banks1/, 2/ ATMs2/
2011 2012 Growth 2011 2012 Growth
NCR 2,892 2,993 3% 4,725 5,324 13%
CAR 146 148 1% 142 162 14%
I Ilocos Region 401 413 3% 307 356 16%
II Cagayan Valley 272 286 5% 149 165 11%
III Central Luzon 940 975 4% 879 1,066 21%
IV-A CALABARZON 1,350 1,406 4% 1,535 1,748 14%
IV-B MIMAROPA 189 206 9% 102 140 37%
V Bicol Region 281 315 12% 215 261 21%
VI Western Visayas 531 543 2% 471 518 10%
VII Central Visayas 584 627 7% 781 921 18%
VIII Eastern Visayas 172 174 1% 164 181 10%
IX Zamboanga Peninsula 181 190 5% 159 176 11%
X Northern Mindanao 328 328 0% 296 327 10%
XI Davao Region 338 355 5% 400 480 20%
XII SOCCSKSARGEN 192 195 2% 207 259 25%
XIII Caraga 199 201 1% 106 115 8%
ARMM 19 20 5% 20 25 25%
Philippines 9,015 9,375 4% 10,658 12,224 15%
Legend: Top 3 Bottom 3
Increase Decrease 1/
Head offices, regular branches, microfinance-oriented branches, extension offices, OBOs, and MBOs 2/
Domestic banks and ATMs
State of Financial Inclusion in the Philippines | 2012 Data Updates
6
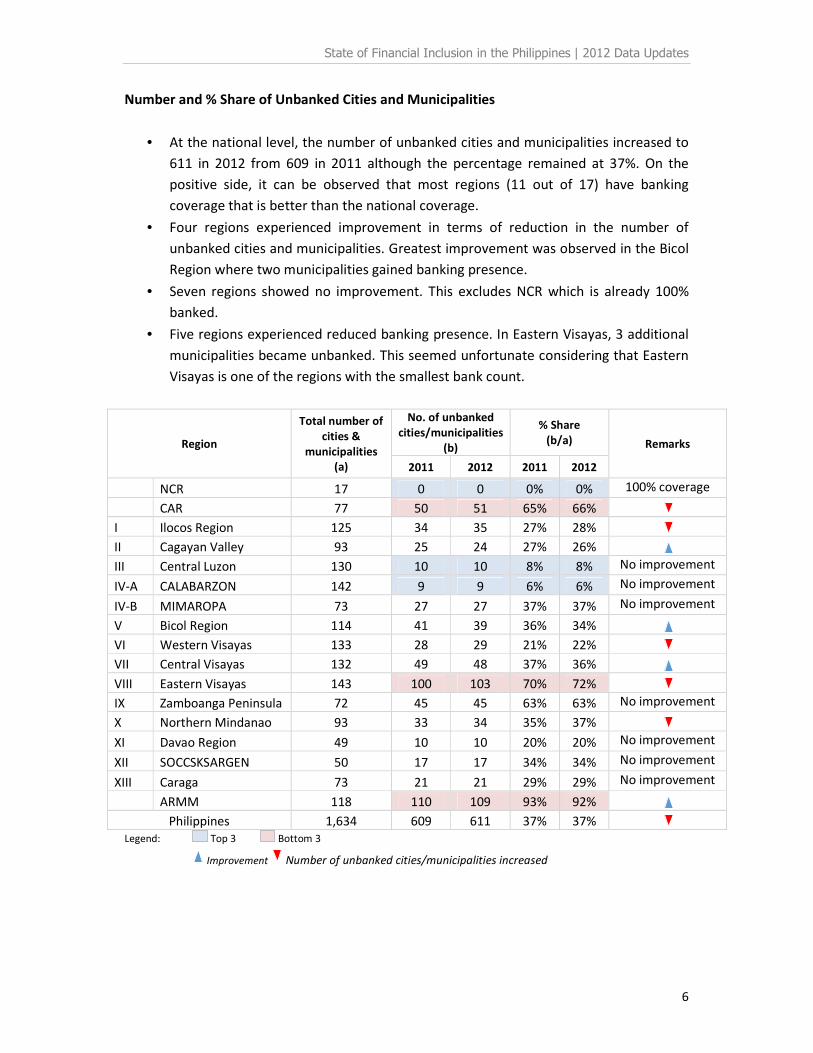
Number and % Share of Unbanked Cities and Municipalities
• At the national level, the number of unbanked cities and municipalities increased to
611 in 2012 from 609 in 2011 although the percentage remained at 37%. On the
positive side, it can be observed that most regions (11 out of 17) have banking
coverage that is better than the national coverage.
• Four regions experienced improvement in terms of reduction in the number of
unbanked cities and municipalities. Greatest improvement was observed in the Bicol
Region where two municipalities gained banking presence.
• Seven regions showed no improvement. This excludes NCR which is already 100%
banked.
• Five regions experienced reduced banking presence. In Eastern Visayas, 3 additional
municipalities became unbanked. This seemed unfortunate considering that Eastern
Visayas is one of the regions with the smallest bank count.
Region
Total number of
cities &
municipalities
(a)
No. of unbanked
cities/municipalities
(b)
% Share
(b/a) Remarks
2011 2012 2011 2012
NCR 17 0 0 0% 0% 100% coverage
CAR 77 50 51 65% 66%
I Ilocos Region 125 34 35 27% 28%
II Cagayan Valley 93 25 24 27% 26%
III Central Luzon 130 10 10 8% 8% No improvement
IV-A CALABARZON 142 9 9 6% 6% No improvement
IV-B MIMAROPA 73 27 27 37% 37% No improvement
V Bicol Region 114 41 39 36% 34%
VI Western Visayas 133 28 29 21% 22%
VII Central Visayas 132 49 48 37% 36%
VIII Eastern Visayas 143 100 103 70% 72%
IX Zamboanga Peninsula 72 45 45 63% 63% No improvement
X Northern Mindanao 93 33 34 35% 37%
XI Davao Region 49 10 10 20% 20% No improvement
XII SOCCSKSARGEN 50 17 17 34% 34% No improvement
XIII Caraga 73 21 21 29% 29% No improvement
ARMM 118 110 109 93% 92%
Philippines 1,634 609 611 37% 37% Legend: Top 3 Bottom 3
Improvement Number of unbanked cities/municipalities increased

State of Financial Inclusion in the Philippines | 2012 Data Updates
7
With Bank in 2011, Unbanked in 2012
• Twelve municipalities lost banking presence in 2012.
Province Municipality Population
1 AKLAN BALETE 27,197
2 APAYAO FLORA 16,743
3 EASTERN SAMAR TAFT 17,183
4 ILOCOS NORTE PIDDIG 20,606
5 ILOCOS SUR BANAYOYO 7,694
6 ILOILO BADIANGAN 26,218
7 LA UNION SAN JUAN 35,098
8 LEYTE JAVIER (BUGHO) 23,878
9 MISAMIS ORIENTAL BALINGOAN 10,175
10 MISAMIS ORIENTAL LUGAIT 18,639
11 SOUTHERN LEYTE SAINT BERNARD 25,169
12 SURIGAO DEL NORTE TUBOD 12,569
Access Situation in Municipalities4 that Became Unbanked in 2012
• In 11 out of 12 municipalities, there were alternative providers of financial services.
Province Municipality
Savings
&
Credita/
Creditb/
Remittancec/
Othersd/
Total
1 AKLAN BALETE 1 2 0 0 3
2 APAYAO FLORA 0 0 0 0 0
3 EASTERN SAMAR TAFT 0 4 3 0 7
4 ILOCOS NORTE PIDDIG 1 1 0 0 2
5 ILOCOS SUR BANAYOYO 1 0 0 0 1
6 ILOILO BADIANGAN 0 1 0 0 1
7 LA UNION SAN JUAN 1 3 1 1 6
8 LEYTE JAVIER (BUGHO) 0 0 1 0 1
9 MISAMIS ORIENTAL BALINGOAN 0 2 1 0 3
10 MISAMIS ORIENTAL LUGAIT 2 1 1 1 5
11 SOUTHERN LEYTE SAINT BERNARD 0 3 4 0 7
12 SURIGAO DEL NORTE TUBOD 1 0 0 0 1 a/
NSSLAs, credit cooperatives b/
NBFIs, pawnshops c/
Remittance agents, cash-in/cash-out (e-money) agents d/
Offsite ATMs, money changers/FX dealers
4 See Annex 1 for the access situation in the 40 poorest municipalities in the Philippines.

State of Financial Inclusion in the Philippines | 2012 Data Updates
8
Unbanked in 2011, With Bank in 2012
• Banking presence was established in 10 municipalities that used to be unbanked. In 2
of these municipalities, the establishment of MBOs was the reason for the banking
presence.
Province Municipality Population No. of bank(s) Remarks
1 ANTIQUE LAWA-AN 25,211 1 MBO
2 CAMARINES SUR LAGONOY 51,814 2 Regular branch, MBO
3 CAMARINES SUR TINAMBAC 62,435 2 2 MBOs
4 CEBU RONDA 18,582 1 Head Office
5 ILOCOS SUR SANTA LUCIA 24,981 1 Regular branch
6 LANAO DEL
NORTE BACOLOD 21,818 1 Extension Office
7 MAGUINDANAO BULUAN 38,106 1 Regular branch
8 PANGASINAN DASOL 26,991 1 Regular branch
9 QUIRINO NAGTIPUNAN 22,473 1 Regular Branch
10 SURIGAO DEL
NORTE ALEGRIA 14,539 1 Regular branch
Monitoring of Micro-Banking Offices (MBOs)
• MBOs continued to increase in number. Highest growth rate was noted for the
period from March to June 2012, when growth spiked at 18%.
• The number of cities and municipalities with MBOs likewise increased, indicating
wider reach. There is also an upward trend in the number of municipalities without
regular bank offices but with MBOs. This suggests that banks are increasingly
establishing presence in municipalities where it is not economically viable to set up a
full-blown branch thereby promoting access to financial services for people living in
remote areas.
Q4
2011
Q1
2012
Q2
2012
Q3
2012
Q4
2012
Number of MBOs 251 272 320 344 370
% Increase 8% 18% 8% 8%
Number of cities and municipalities with
MBOs 138 157 192 217 232
Number of cities and municipalities
without head office/branches but with
MBOs
37 37 46 49 50
State of Financial Inclusion in the Philippines | 2012 Data Updates
9
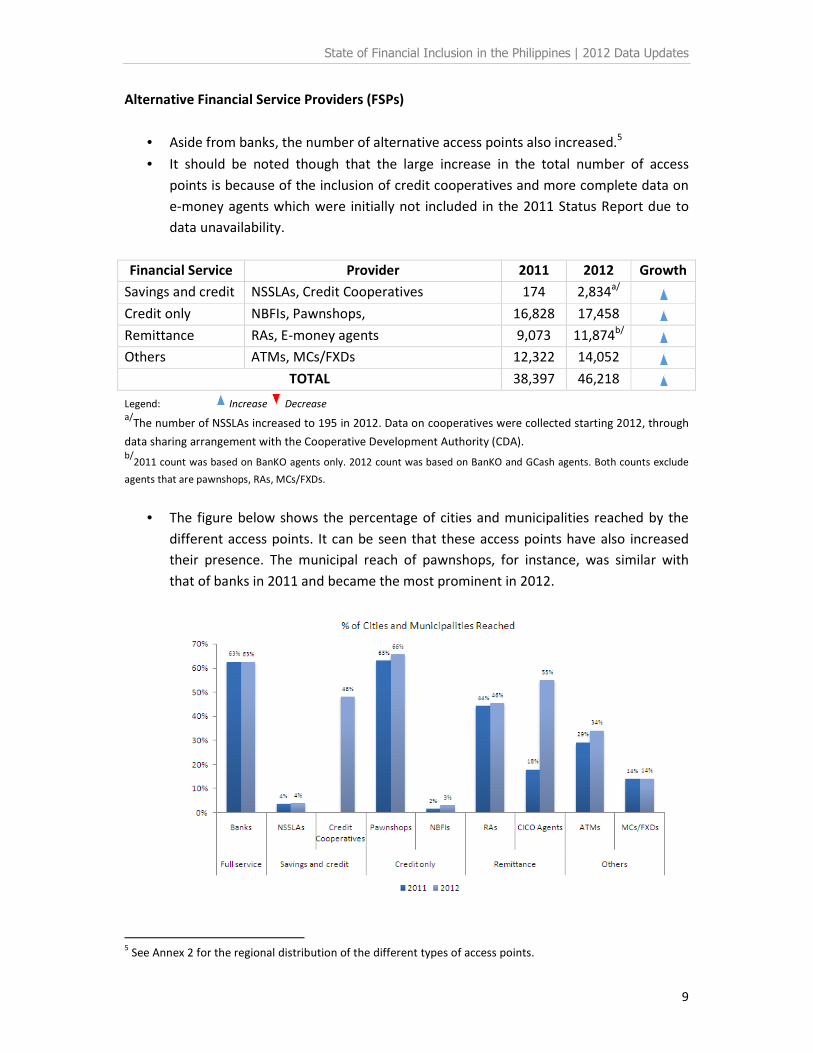
Alternative Financial Service Providers (FSPs)
• Aside from banks, the number of alternative access points also increased.5
• It should be noted though that the large increase in the total number of access
points is because of the inclusion of credit cooperatives and more complete data on
e-money agents which were initially not included in the 2011 Status Report due to
data unavailability.
Financial Service Provider 2011 2012 Growth
Savings and credit NSSLAs, Credit Cooperatives 174 2,834a/
Credit only NBFIs, Pawnshops, 16,828 17,458
Remittance RAs, E-money agents 9,073 11,874b/
Others ATMs, MCs/FXDs 12,322 14,052
TOTAL 38,397 46,218
Legend: Increase Decrease
a/The number of NSSLAs increased to 195 in 2012. Data on cooperatives were collected starting 2012, through
data sharing arrangement with the Cooperative Development Authority (CDA). b/
2011 count was based on BanKO agents only. 2012 count was based on BanKO and GCash agents. Both counts exclude
agents that are pawnshops, RAs, MCs/FXDs.
• The figure below shows the percentage of cities and municipalities reached by the
different access points. It can be seen that these access points have also increased
their presence. The municipal reach of pawnshops, for instance, was similar with
that of banks in 2011 and became the most prominent in 2012.
5 See Annex 2 for the regional distribution of the different types of access points.
State of Financial Inclusion in the Philippines | 2012 Data Updates
10
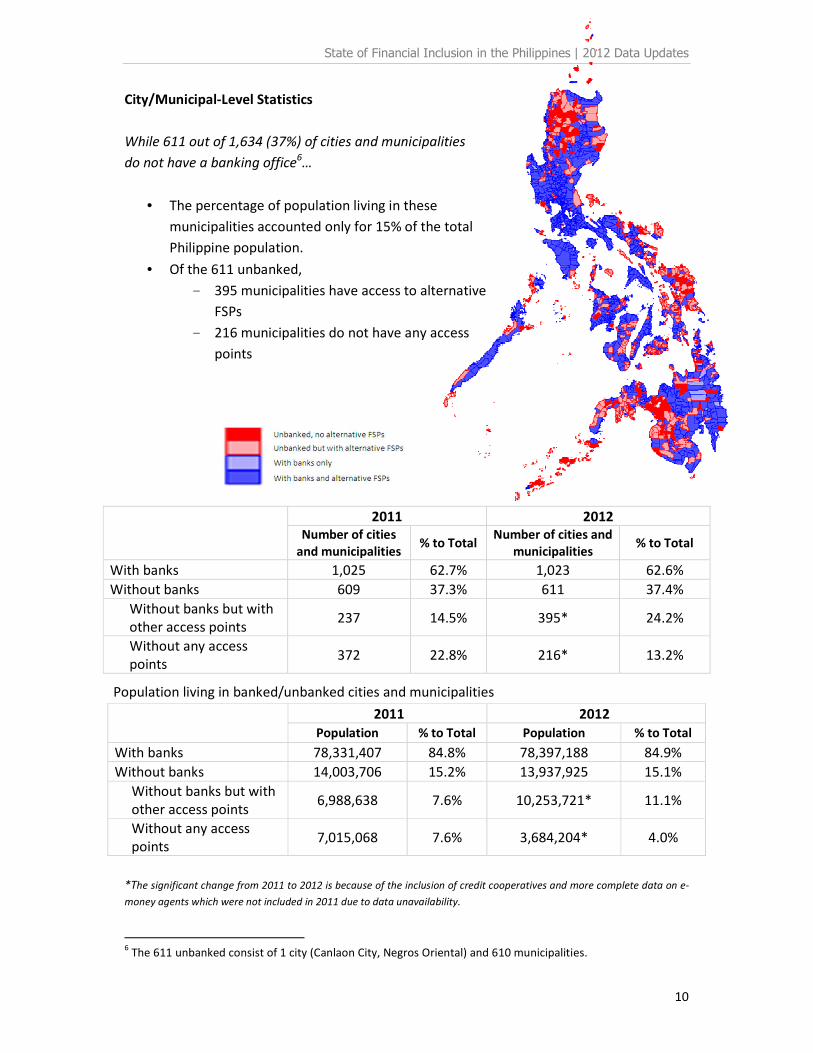
City/Municipal-Level Statistics
While 611 out of 1,634 (37%) of cities and municipalities
do not have a banking office6…
• The percentage of population living in these
municipalities accounted only for 15% of the total
Philippine population.
• Of the 611 unbanked,
- 395 municipalities have access to alternative
FSPs
- 216 municipalities do not have any access
points
2011 2012
Number of cities
and municipalities % to Total
Number of cities and
municipalities % to Total
With banks 1,025 62.7% 1,023 62.6%
Without banks 609 37.3% 611 37.4%
Without banks but with
other access points 237 14.5% 395* 24.2%
Without any access
points 372 22.8% 216* 13.2%
Population living in banked/unbanked cities and municipalities
2011 2012
Population % to Total Population % to Total
With banks 78,331,407 84.8% 78,397,188 84.9%
Without banks 14,003,706 15.2% 13,937,925 15.1%
Without banks but with
other access points 6,988,638 7.6% 10,253,721* 11.1%
Without any access
points 7,015,068 7.6% 3,684,204* 4.0%
*The significant change from 2011 to 2012 is because of the inclusion of credit cooperatives and more complete data on e-
money agents which were not included in 2011 due to data unavailability.
6 The 611 unbanked consist of 1 city (Canlaon City, Negros Oriental) and 610 municipalities.
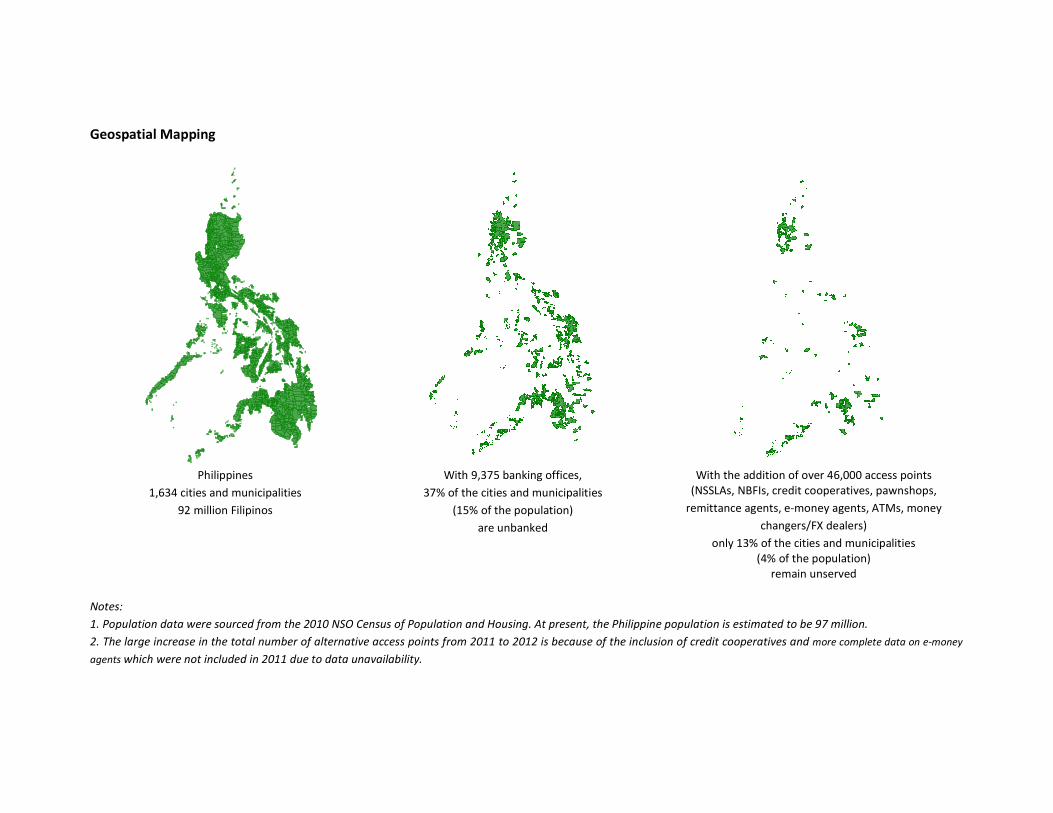
Geospatial Mapping
Philippines
1,634 cities and municipalities
92 million Filipinos
With 9,375 banking offices,
37% of the cities and municipalities
(15% of the population)
are unbanked
With the addition of over 46,000 access points
(NSSLAs, NBFIs, credit cooperatives, pawnshops,
remittance agents, e-money agents, ATMs, money
changers/FX dealers)
only 13% of the cities and municipalities
(4% of the population)
remain unserved
Notes:
1. Population data were sourced from the 2010 NSO Census of Population and Housing. At present, the Philippine population is estimated to be 97 million.
2. The large increase in the total number of alternative access points from 2011 to 2012 is because of the inclusion of credit cooperatives and more complete data on e-money
agents which were not included in 2011 due to data unavailability.
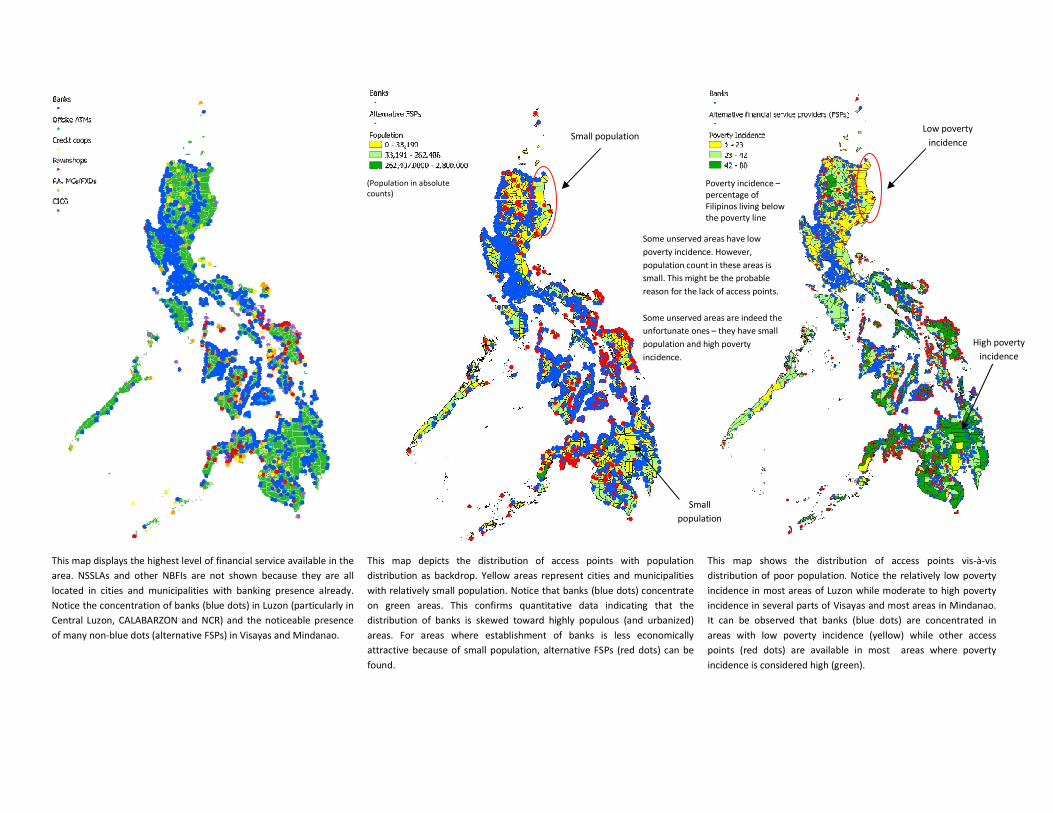
This map displays the highest level of financial service available in the
area. NSSLAs and other NBFIs are not shown because they are all
located in cities and municipalities with banking presence already.
Notice the concentration of banks (blue dots) in Luzon (particularly in
Central Luzon, CALABARZON and NCR) and the noticeable presence
of many non-blue dots (alternative FSPs) in Visayas and Mindanao.
This map depicts the distribution of access points with population
distribution as backdrop. Yellow areas represent cities and municipalities
with relatively small population. Notice that banks (blue dots) concentrate
on green areas. This confirms quantitative data indicating that the
distribution of banks is skewed toward highly populous (and urbanized)
areas. For areas where establishment of banks is less economically
attractive because of small population, alternative FSPs (red dots) can be
found.
This map shows the distribution of access points vis-à-vis
distribution of poor population. Notice the relatively low poverty
incidence in most areas of Luzon while moderate to high poverty
incidence in several parts of Visayas and most areas in Mindanao.
It can be observed that banks (blue dots) are concentrated in
areas with low poverty incidence (yellow) while other access
points (red dots) are available in most areas where poverty
incidence is considered high (green).
(Population in absolute
counts)
Poverty incidence –
percentage of
Filipinos living below
the poverty line
Small population
High poverty
incidence
Some unserved areas have low
poverty incidence. However,
population count in these areas is
small. This might be the probable
reason for the lack of access points.
Some unserved areas are indeed the
unfortunate ones – they have small
population and high poverty
incidence.
Low poverty
incidence
Small
population

Access Indicators
Indicator 2011 2012 Growth
Average number of banking offices per city/municipality 5.5 5.7 4%
Number of banks per 10,000 adults 1.4 1.4 No improvement
Number of ATMs per 10,000 adults 1.7 1.9 12%
Number of banks per 1,000 sq. km* 64 66 3%
Number of ATMs per 1,000 sq. km* 75 86 15% *Based on habitable land area
Legend: Increase Decrease
• Bank density remained at 6 banks per city/municipality, on the average. Only 4
regions were above the national indicator.
o NCR – 176 (extreme outlier)
o CALABARZON – 10
o Central Luzon – 8
o Davao Region – 7
• The number of banks per 10,000 adults did not change from 2011 to 2012. On the
average, there is one bank for every 10,000 adults. Same is true for most regions.
Only 2 regions exceeded the national indicator.
o NCR – 4
o CALABARZON – 2
• On the average, there are 2 ATMs for every 10,000 adults. Only 3 regions were equal
to/greater than the national indicator.
o NCR – 6
o CALABARZON and Central Visayas – 2
• In 2012, there were 66 banks and 86 ATMs per 1,000 sq. km. The indicators for the
following regions exceeded the national average:
o NCR – 6,205 banks and 11,038 ATMs (extreme outlier)
o CALABARZON – 134 banks and 166 ATMs
o Central Luzon – 81 banks and 89 ATMs
o Central Visayas – 65 banks and 96 ATMs
• ARMM and Eastern Visayas consistently belong to the bottom group in all the access
indicators.
State of Financial Inclusion in the Philippines | 2012 Data Updates
14
USAGE
Deposits
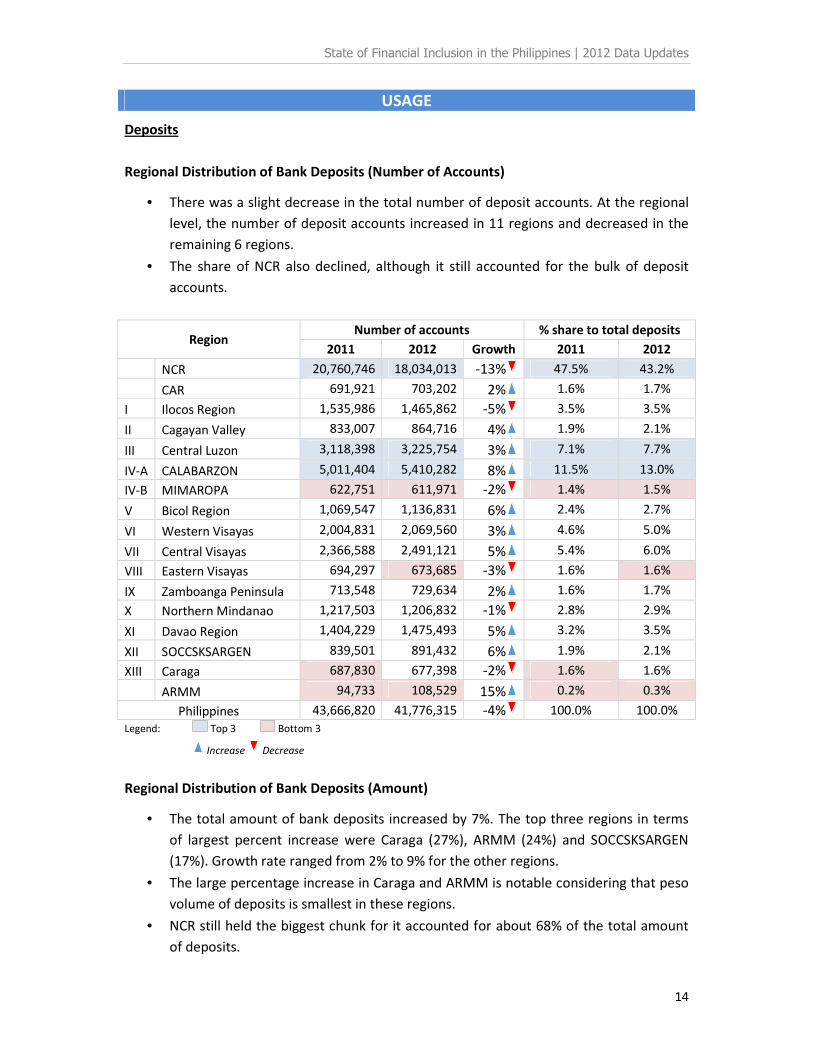
Regional Distribution of Bank Deposits (Number of Accounts)
• There was a slight decrease in the total number of deposit accounts. At the regional
level, the number of deposit accounts increased in 11 regions and decreased in the
remaining 6 regions.
• The share of NCR also declined, although it still accounted for the bulk of deposit
accounts.
Region Number of accounts % share to total deposits
2011 2012 Growth 2011 2012
NCR 20,760,746 18,034,013 -13% 47.5% 43.2%
CAR 691,921 703,202 2% 1.6% 1.7%
I Ilocos Region 1,535,986 1,465,862 -5% 3.5% 3.5%
II Cagayan Valley 833,007 864,716 4% 1.9% 2.1%
III Central Luzon 3,118,398 3,225,754 3% 7.1% 7.7%
IV-A CALABARZON 5,011,404 5,410,282 8% 11.5% 13.0%
IV-B MIMAROPA 622,751 611,971 -2% 1.4% 1.5%
V Bicol Region 1,069,547 1,136,831 6% 2.4% 2.7%
VI Western Visayas 2,004,831 2,069,560 3% 4.6% 5.0%
VII Central Visayas 2,366,588 2,491,121 5% 5.4% 6.0%
VIII Eastern Visayas 694,297 673,685 -3% 1.6% 1.6%
IX Zamboanga Peninsula 713,548 729,634 2% 1.6% 1.7%
X Northern Mindanao 1,217,503 1,206,832 -1% 2.8% 2.9%
XI Davao Region 1,404,229 1,475,493 5% 3.2% 3.5%
XII SOCCSKSARGEN 839,501 891,432 6% 1.9% 2.1%
XIII Caraga 687,830 677,398 -2% 1.6% 1.6%
ARMM 94,733 108,529 15% 0.2% 0.3%
Philippines 43,666,820 41,776,315 -4% 100.0% 100.0%
Legend: Top 3 Bottom 3
Increase Decrease
Regional Distribution of Bank Deposits (Amount)
• The total amount of bank deposits increased by 7%. The top three regions in terms
of largest percent increase were Caraga (27%), ARMM (24%) and SOCCSKSARGEN
(17%). Growth rate ranged from 2% to 9% for the other regions.
• The large percentage increase in Caraga and ARMM is notable considering that peso
volume of deposits is smallest in these regions.
• NCR still held the biggest chunk for it accounted for about 68% of the total amount
of deposits.

State of Financial Inclusion in the Philippines | 2012 Data Updates
15
Region
Amount of deposits
(in billion pesos)
% share to total
deposits
2011 2012 Growth 2011 2012
NCR 3,639.7 3,890.9 7% 67.8% 67.7%
CAR 51.0 54.9 8% 0.9% 1.0%
I Ilocos Region 102.6 107.4 5% 1.9% 1.9%
II Cagayan Valley 58.7 62.7 7% 1.1% 1.1%
III Central Luzon 269.2 282.2 5% 5.0% 4.9%
IV-A CALABARZON 365.6 396.7 8% 6.8% 6.9%
IV-B MIMAROPA 29.1 31.8 9% 0.5% 0.6%
V Bicol Region 63.1 68.2 8% 1.2% 1.2%
VI Western Visayas 155.3 160.9 4% 2.9% 2.8%
VII Central Visayas 261.8 281.6 8% 4.9% 4.9%
VIII Eastern Visayas 44.8 48.8 9% 0.8% 0.8%
IX Zamboanga Peninsula 48.5 52.3 8% 0.9% 0.9%
X Northern Mindanao 80.1 85.8 7% 1.5% 1.5%
XI Davao Region 113.5 116.0 2% 2.1% 2.0%
XII SOCCSKSARGEN 53.6 62.7 17% 1.0% 1.1%
XIII Caraga 29.9 38.0 27% 0.6% 0.7%
ARMM 4.4 5.5 24% 0.1% 0.1%
Philippines 5,371.0 5,746.3 7% 100.0% 100.0%
Legend: Top 3 Bottom 3
Increase Decrease
Sizing of Bank Deposits
• More than three-fourths of deposit accounts were below P15,000. In terms of
amount, these comprised only for about 1% of the total amount of bank deposits.
Deposit Size No. of accounts % share to
total
Amount
(in billions)
% share to
total
P 15,000 & Below 31,638,319 75.7% 62.2 1.1%
P 15,000.01 - P 40,000 3,501,798 8.4% 89.6 1.6%
P 40,000.01 - P 60,000 1,253,598 3.0% 61.3 1.1%
P 60,000.01 - P 80,000 700,542 1.7% 48.3 0.8%
P 80,000.01 - P 100,000 527,462 1.3% 47.3 0.8%
P 100,000.01 - P 150,000 971,737 2.3% 115.9 2.0%
P 150,000.01 - P 200,000 506,426 1.2% 87.5 1.5%
P 200,000.01 - P 250,000 428,420 1.0% 94.7 1.6%
P 250,000.01 - P 300,000 299,065 0.7% 82.1 1.4%
P 300,000.01 - P 400,000 368,842 0.9% 126.4 2.2%
P 400,000.01 - P 500,000 343,944 0.8% 156.0 2.7%
P 500,000.01 - P 750,000 376,294 0.9% 222.1 3.9%
P 750,000.01 - P 1,000,000 201,412 0.5% 178.0 3.1%

State of Financial Inclusion in the Philippines | 2012 Data Updates
16
Deposit Size No. of accounts % share to
total
Amount
(in billions)
% share to
total
P 1,000,000.01 - P 1,500,000 207,276 0.5% 244.9 4.3%
P 1,500,000.01 - P 2,000,000 91,061 0.2% 158.6 2.8%
Over P 2,000,000 370,847 0.9% 3,971.4 69.1%
Total 41,787,043 100.0% 5,746.4 100.0%
Legend: Top 3 Bottom 3
Deposits in Non-Banks
• Deposits in non-bank financial institutions authorized to have deposit-taking
activities (i.e., Non-Stock Savings and Loans Associations or NSSLAs) experienced
remarkable growth since 2002. In 2012, deposits in NSSLAs amounted to P22.9
billion.
Deposits of Microfinance Clients of Banks with Microfinance Operations
• Deposits of microfinance clients amounted to P6.3 billion of which P2.3 billion (37%)
were microdeposits. A significant portion (66%) of microdeposits came from rural
banks with microfinance operations.
Total Regular Deposits Microdeposits
Microfinance Oriented Thrift Banks 99,901,404 10,909,618 88,991,786
Microfinance Engaged Thrift Banks 295,519,727 48,265,327 247,254,401
Microfinance Oriented Rural Banks 1,579,875,549 54,829,859 1,525,045,690
Microfinance Engaged Cooperative Banks 139,294,547 108,092,547 31,201,999
Microfinance Engaged Rural Banks 4,159,652,631 3,742,356,091 417,296,540
Microfinance Engaged Universal Bank 16,988 16,988 0
Microfinance Engaged Regular Commercial Bank 24,677,864 0 24,677,864
Total 6,298,938,710 3,964,470,430 2,334,468,280
State of Financial Inclusion in the Philippines | 2012 Data Updates
17
Loans
Regional Distribution of Bank Loans7 (Amount)
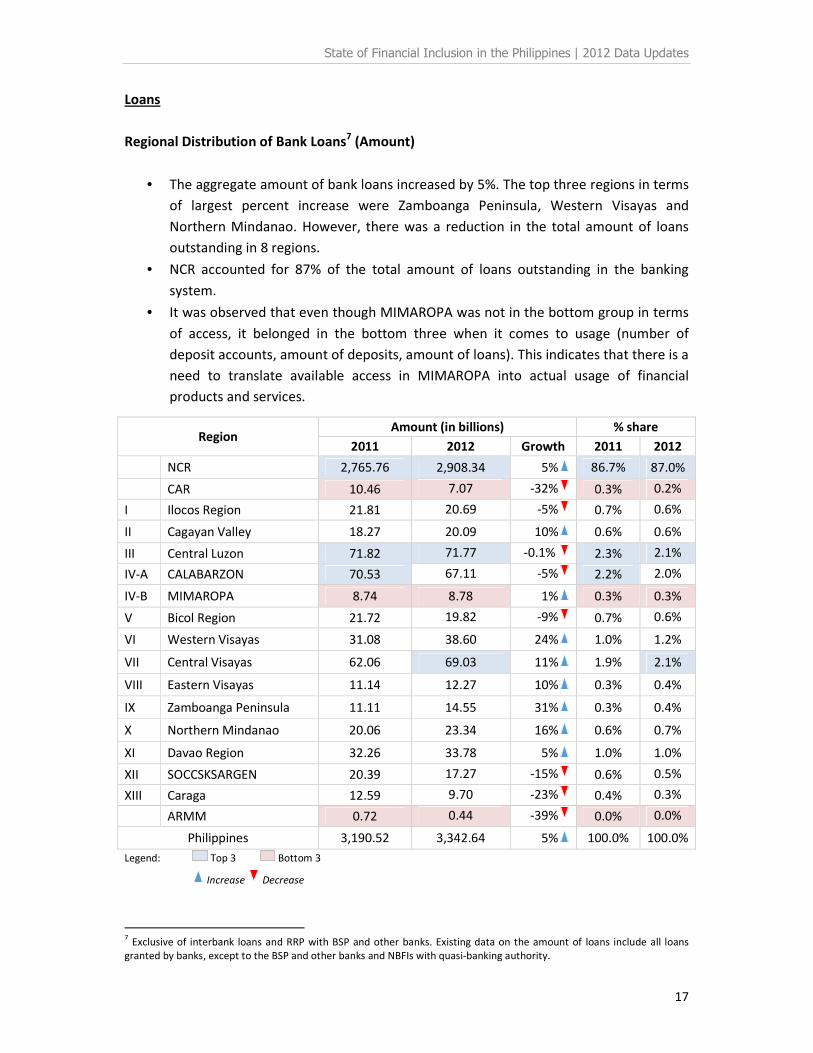
• The aggregate amount of bank loans increased by 5%. The top three regions in terms
of largest percent increase were Zamboanga Peninsula, Western Visayas and
Northern Mindanao. However, there was a reduction in the total amount of loans
outstanding in 8 regions.
• NCR accounted for 87% of the total amount of loans outstanding in the banking
system.
• It was observed that even though MIMAROPA was not in the bottom group in terms
of access, it belonged in the bottom three when it comes to usage (number of
deposit accounts, amount of deposits, amount of loans). This indicates that there is a
need to translate available access in MIMAROPA into actual usage of financial
products and services.
Region Amount (in billions) % share
2011 2012 Growth 2011 2012
NCR 2,765.76 2,908.34 5% 86.7% 87.0%
CAR 10.46 7.07 -32% 0.3% 0.2%
I Ilocos Region 21.81 20.69 -5% 0.7% 0.6%
II Cagayan Valley 18.27 20.09 10% 0.6% 0.6%
III Central Luzon 71.82 71.77 -0.1% 2.3% 2.1%
IV-A CALABARZON 70.53 67.11 -5% 2.2% 2.0%
IV-B MIMAROPA 8.74 8.78 1% 0.3% 0.3%
V Bicol Region 21.72 19.82 -9% 0.7% 0.6%
VI Western Visayas 31.08 38.60 24% 1.0% 1.2%
VII Central Visayas 62.06 69.03 11% 1.9% 2.1%
VIII Eastern Visayas 11.14 12.27 10% 0.3% 0.4%
IX Zamboanga Peninsula 11.11 14.55 31% 0.3% 0.4%
X Northern Mindanao 20.06 23.34 16% 0.6% 0.7%
XI Davao Region 32.26 33.78 5% 1.0% 1.0%
XII SOCCSKSARGEN 20.39 17.27 -15% 0.6% 0.5%
XIII Caraga 12.59 9.70 -23% 0.4% 0.3%
ARMM 0.72 0.44 -39% 0.0% 0.0%
Philippines 3,190.52 3,342.64 5% 100.0% 100.0%
Legend: Top 3 Bottom 3
Increase Decrease
7 Exclusive of interbank loans and RRP with BSP and other banks. Existing data on the amount of loans include all loans
granted by banks, except to the BSP and other banks and NBFIs with quasi-banking authority.
State of Financial Inclusion in the Philippines | 2012 Data Updates
18
Regional Distribution of Microfinance Loans of Banks
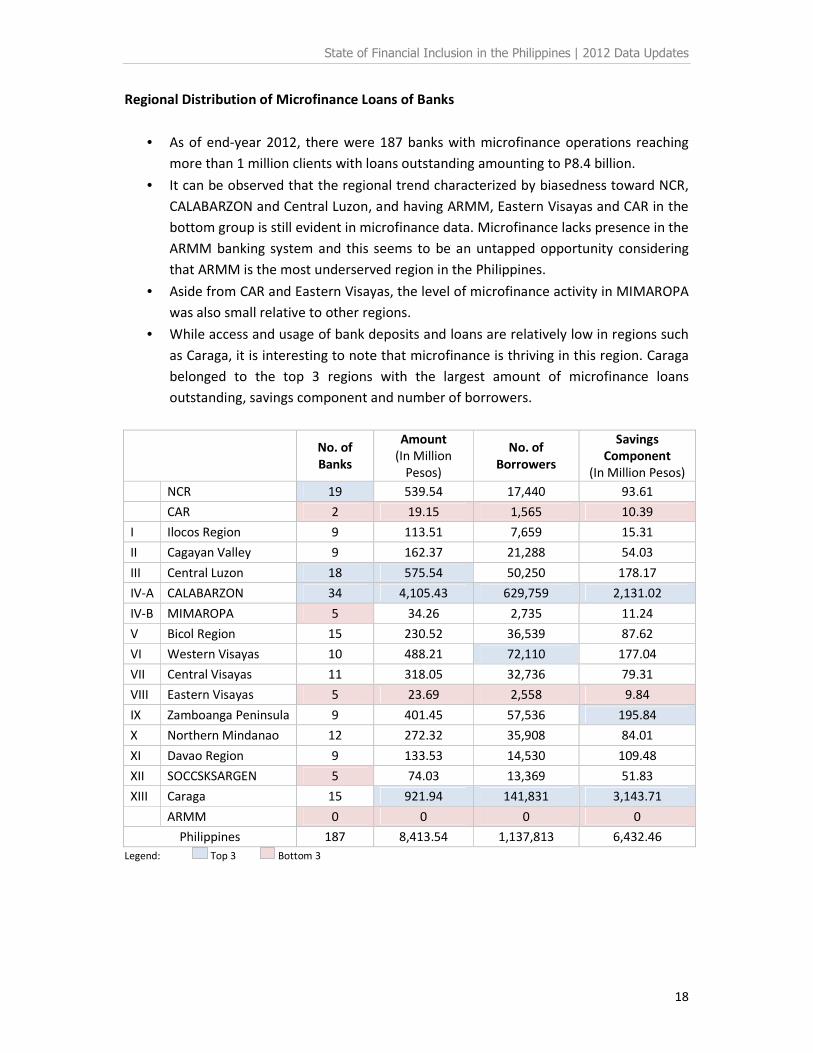
• As of end-year 2012, there were 187 banks with microfinance operations reaching
more than 1 million clients with loans outstanding amounting to P8.4 billion.
• It can be observed that the regional trend characterized by biasedness toward NCR,
CALABARZON and Central Luzon, and having ARMM, Eastern Visayas and CAR in the
bottom group is still evident in microfinance data. Microfinance lacks presence in the
ARMM banking system and this seems to be an untapped opportunity considering
that ARMM is the most underserved region in the Philippines.
• Aside from CAR and Eastern Visayas, the level of microfinance activity in MIMAROPA
was also small relative to other regions.
• While access and usage of bank deposits and loans are relatively low in regions such
as Caraga, it is interesting to note that microfinance is thriving in this region. Caraga
belonged to the top 3 regions with the largest amount of microfinance loans
outstanding, savings component and number of borrowers.
No. of
Banks
Amount
(In Million
Pesos)
No. of
Borrowers
Savings
Component
(In Million Pesos)
NCR 19 539.54 17,440 93.61
CAR 2 19.15 1,565 10.39
I Ilocos Region 9 113.51 7,659 15.31
II Cagayan Valley 9 162.37 21,288 54.03
III Central Luzon 18 575.54 50,250 178.17
IV-A CALABARZON 34 4,105.43 629,759 2,131.02
IV-B MIMAROPA 5 34.26 2,735 11.24
V Bicol Region 15 230.52 36,539 87.62
VI Western Visayas 10 488.21 72,110 177.04
VII Central Visayas 11 318.05 32,736 79.31
VIII Eastern Visayas 5 23.69 2,558 9.84
IX Zamboanga Peninsula 9 401.45 57,536 195.84
X Northern Mindanao 12 272.32 35,908 84.01
XI Davao Region 9 133.53 14,530 109.48
XII SOCCSKSARGEN 5 74.03 13,369 51.83
XIII Caraga 15 921.94 141,831 3,143.71
ARMM 0 0 0 0
Philippines 187 8,413.54 1,137,813 6,432.46
Legend: Top 3 Bottom 3
State of Financial Inclusion in the Philippines | 2012 Data Updates
19
Regional Distribution of Microfinance Loans, Classified as to Purpose
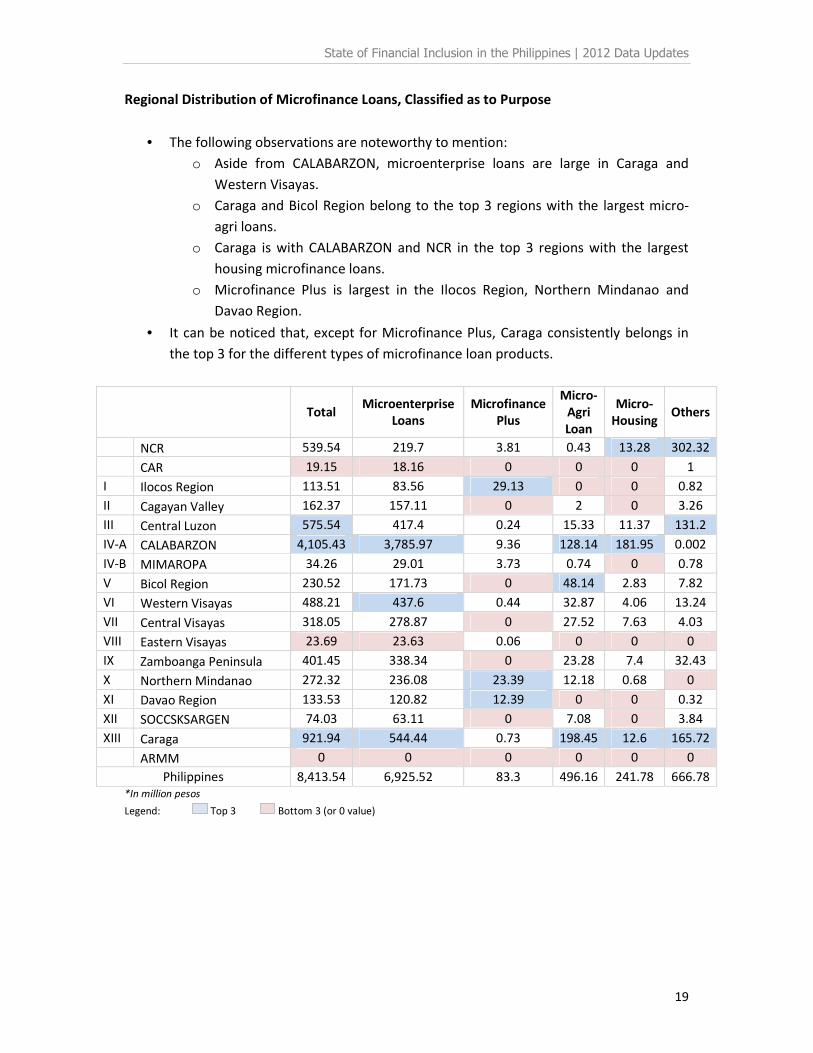
• The following observations are noteworthy to mention:
o Aside from CALABARZON, microenterprise loans are large in Caraga and
Western Visayas.
o Caraga and Bicol Region belong to the top 3 regions with the largest micro-
agri loans.
o Caraga is with CALABARZON and NCR in the top 3 regions with the largest
housing microfinance loans.
o Microfinance Plus is largest in the Ilocos Region, Northern Mindanao and
Davao Region.
• It can be noticed that, except for Microfinance Plus, Caraga consistently belongs in
the top 3 for the different types of microfinance loan products.
Total
Microenterprise
Loans
Microfinance
Plus
Micro-
Agri
Loan
Micro-
Housing Others
NCR 539.54 219.7 3.81 0.43 13.28 302.32
CAR 19.15 18.16 0 0 0 1
I Ilocos Region 113.51 83.56 29.13 0 0 0.82
II Cagayan Valley 162.37 157.11 0 2 0 3.26
III Central Luzon 575.54 417.4 0.24 15.33 11.37 131.2
IV-A CALABARZON 4,105.43 3,785.97 9.36 128.14 181.95 0.002
IV-B MIMAROPA 34.26 29.01 3.73 0.74 0 0.78
V Bicol Region 230.52 171.73 0 48.14 2.83 7.82
VI Western Visayas 488.21 437.6 0.44 32.87 4.06 13.24
VII Central Visayas 318.05 278.87 0 27.52 7.63 4.03
VIII Eastern Visayas 23.69 23.63 0.06 0 0 0
IX Zamboanga Peninsula 401.45 338.34 0 23.28 7.4 32.43
X Northern Mindanao 272.32 236.08 23.39 12.18 0.68 0
XI Davao Region 133.53 120.82 12.39 0 0 0.32
XII SOCCSKSARGEN 74.03 63.11 0 7.08 0 3.84
XIII Caraga 921.94 544.44 0.73 198.45 12.6 165.72
ARMM 0 0 0 0 0 0
Philippines 8,413.54 6,925.52 83.3 496.16 241.78 666.78
*In million pesos
Legend: Top 3 Bottom 3 (or 0 value)
State of Financial Inclusion in the Philippines | 2012 Data Updates
20
Usage Indicators
• The availability of more information on usage leaves much to be desired. Most of the
data are coming from the supply side and are limited to banks. Deposit figures in
NSSLAs are aggregated while there is currently no available information on savings in
credit cooperatives. So far, the usage indicator that can be measured using available
data is the number of deposit accounts per 10,000 adults.
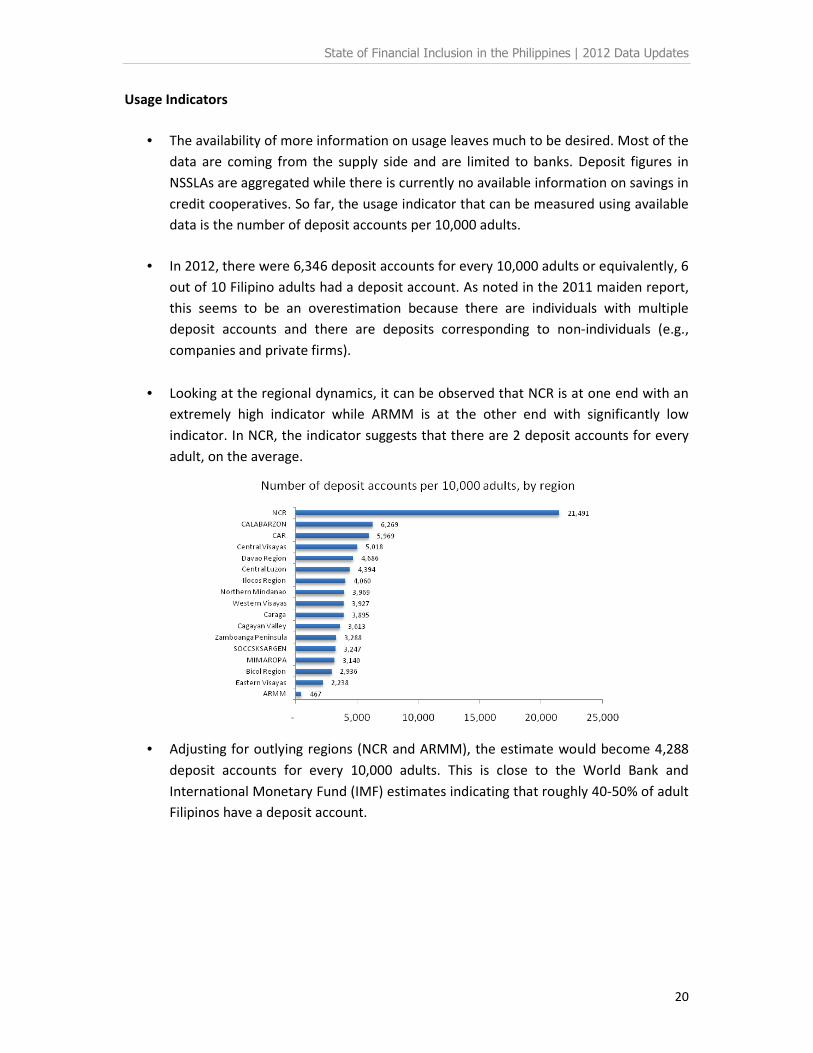
• In 2012, there were 6,346 deposit accounts for every 10,000 adults or equivalently, 6
out of 10 Filipino adults had a deposit account. As noted in the 2011 maiden report,
this seems to be an overestimation because there are individuals with multiple
deposit accounts and there are deposits corresponding to non-individuals (e.g.,
companies and private firms).
• Looking at the regional dynamics, it can be observed that NCR is at one end with an
extremely high indicator while ARMM is at the other end with significantly low
indicator. In NCR, the indicator suggests that there are 2 deposit accounts for every
adult, on the average.
• Adjusting for outlying regions (NCR and ARMM), the estimate would become 4,288
deposit accounts for every 10,000 adults. This is close to the World Bank and
International Monetary Fund (IMF) estimates indicating that roughly 40-50% of adult
Filipinos have a deposit account.

State of Financial Inclusion in the Philippines | 2012 Data Updates
21
• At present, there are still varying estimates on access to deposit accounts. The
following table shows the estimates from different sources:
Source Estimate
BSP Consumer Finance Survey (2009) 21.5% of households have a deposit account
Global Findex (2011) 26.6% of adults have an account at a formal financial
institution
World Bank Development Indicators
(2011) 8
459 deposit accounts per 1,000 adults
IMF Financial Access Survey (2012) 9
498 deposit accounts per 1,000 adults
BSP supply-side data (2012) 6,346 deposit accounts for every 10,000 (all regions)
4,288 deposit accounts for every 10,000 adults
(excluding NCR and ARMM)
• The above underscores the need for a demand-driven data gathering exercise in
order to adequately measure usage of financial products and services. A well-
designed demand-side survey will contribute in obtaining a broader and deeper
insight not only on usage but also on the quality and welfare dimensions of financial
inclusion.
8 Number of deposit account holders at commercial banks. For many countries data cover the total number of
deposit accounts due to lack of information on account holders. The major types of deposits are checking
accounts, savings accounts, and time deposits. 9 Deposit accounts with commercial banks per 1,000 adults
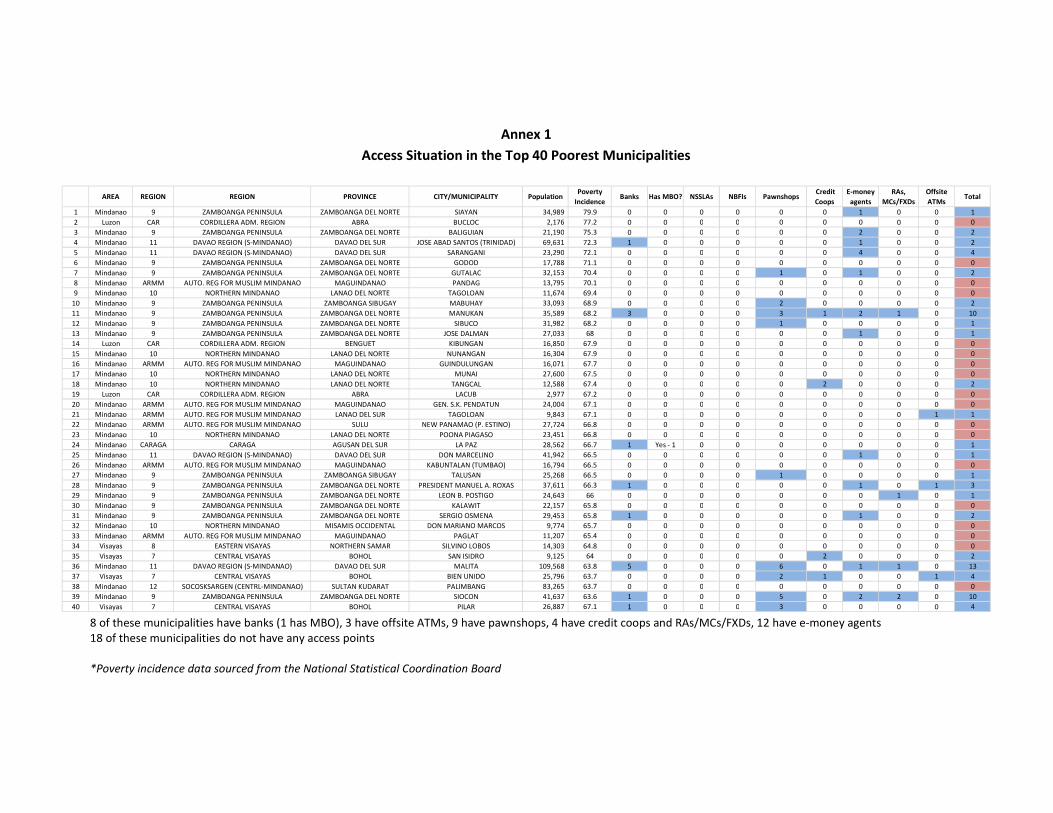
Annex 1
Access Situation in the Top 40 Poorest Municipalities
AREA REGION REGION PROVINCE CITY/MUNICIPALITY PopulationPoverty
IncidenceBanks Has MBO? NSSLAs NBFIs Pawnshops
Credit
Coops
E-money
agents
RAs,
MCs/FXDs
Offsite
ATMsTotal
1 Mindanao 9 ZAMBOANGA PENINSULA ZAMBOANGA DEL NORTE SIAYAN 34,989 79.9 0 0 0 0 0 0 1 0 0 1
2 Luzon CAR CORDILLERA ADM. REGION ABRA BUCLOC 2,176 77.2 0 0 0 0 0 0 0 0 0 0
3 Mindanao 9 ZAMBOANGA PENINSULA ZAMBOANGA DEL NORTE BALIGUIAN 21,190 75.3 0 0 0 0 0 0 2 0 0 2
4 Mindanao 11 DAVAO REGION (S-MINDANAO) DAVAO DEL SUR JOSE ABAD SANTOS (TRINIDAD) 69,631 72.3 1 0 0 0 0 0 1 0 0 2
5 Mindanao 11 DAVAO REGION (S-MINDANAO) DAVAO DEL SUR SARANGANI 23,290 72.1 0 0 0 0 0 0 4 0 0 4
6 Mindanao 9 ZAMBOANGA PENINSULA ZAMBOANGA DEL NORTE GODOD 17,788 71.1 0 0 0 0 0 0 0 0 0 0
7 Mindanao 9 ZAMBOANGA PENINSULA ZAMBOANGA DEL NORTE GUTALAC 32,153 70.4 0 0 0 0 1 0 1 0 0 2
8 Mindanao ARMM AUTO. REG FOR MUSLIM MINDANAO MAGUINDANAO PANDAG 13,795 70.1 0 0 0 0 0 0 0 0 0 0
9 Mindanao 10 NORTHERN MINDANAO LANAO DEL NORTE TAGOLOAN 11,674 69.4 0 0 0 0 0 0 0 0 0 0
10 Mindanao 9 ZAMBOANGA PENINSULA ZAMBOANGA SIBUGAY MABUHAY 33,093 68.9 0 0 0 0 2 0 0 0 0 2
11 Mindanao 9 ZAMBOANGA PENINSULA ZAMBOANGA DEL NORTE MANUKAN 35,589 68.2 3 0 0 0 3 1 2 1 0 10
12 Mindanao 9 ZAMBOANGA PENINSULA ZAMBOANGA DEL NORTE SIBUCO 31,982 68.2 0 0 0 0 1 0 0 0 0 1
13 Mindanao 9 ZAMBOANGA PENINSULA ZAMBOANGA DEL NORTE JOSE DALMAN 27,033 68 0 0 0 0 0 0 1 0 0 1
14 Luzon CAR CORDILLERA ADM. REGION BENGUET KIBUNGAN 16,850 67.9 0 0 0 0 0 0 0 0 0 0
15 Mindanao 10 NORTHERN MINDANAO LANAO DEL NORTE NUNANGAN 16,304 67.9 0 0 0 0 0 0 0 0 0 0
16 Mindanao ARMM AUTO. REG FOR MUSLIM MINDANAO MAGUINDANAO GUINDULUNGAN 16,071 67.7 0 0 0 0 0 0 0 0 0 0
17 Mindanao 10 NORTHERN MINDANAO LANAO DEL NORTE MUNAI 27,600 67.5 0 0 0 0 0 0 0 0 0 0
18 Mindanao 10 NORTHERN MINDANAO LANAO DEL NORTE TANGCAL 12,588 67.4 0 0 0 0 0 2 0 0 0 2
19 Luzon CAR CORDILLERA ADM. REGION ABRA LACUB 2,977 67.2 0 0 0 0 0 0 0 0 0 0
20 Mindanao ARMM AUTO. REG FOR MUSLIM MINDANAO MAGUINDANAO GEN. S.K. PENDATUN 24,004 67.1 0 0 0 0 0 0 0 0 0 0
21 Mindanao ARMM AUTO. REG FOR MUSLIM MINDANAO LANAO DEL SUR TAGOLOAN 9,843 67.1 0 0 0 0 0 0 0 0 1 1
22 Mindanao ARMM AUTO. REG FOR MUSLIM MINDANAO SULU NEW PANAMAO (P. ESTINO) 27,724 66.8 0 0 0 0 0 0 0 0 0 0
23 Mindanao 10 NORTHERN MINDANAO LANAO DEL NORTE POONA PIAGASO 23,451 66.8 0 0 0 0 0 0 0 0 0 0
24 Mindanao CARAGA CARAGA AGUSAN DEL SUR LA PAZ 28,562 66.7 1 Yes - 1 0 0 0 0 0 0 0 1
25 Mindanao 11 DAVAO REGION (S-MINDANAO) DAVAO DEL SUR DON MARCELINO 41,942 66.5 0 0 0 0 0 0 1 0 0 1
26 Mindanao ARMM AUTO. REG FOR MUSLIM MINDANAO MAGUINDANAO KABUNTALAN (TUMBAO) 16,794 66.5 0 0 0 0 0 0 0 0 0 0
27 Mindanao 9 ZAMBOANGA PENINSULA ZAMBOANGA SIBUGAY TALUSAN 25,268 66.5 0 0 0 0 1 0 0 0 0 1
28 Mindanao 9 ZAMBOANGA PENINSULA ZAMBOANGA DEL NORTE PRESIDENT MANUEL A. ROXAS 37,611 66.3 1 0 0 0 0 0 1 0 1 3
29 Mindanao 9 ZAMBOANGA PENINSULA ZAMBOANGA DEL NORTE LEON B. POSTIGO 24,643 66 0 0 0 0 0 0 0 1 0 1
30 Mindanao 9 ZAMBOANGA PENINSULA ZAMBOANGA DEL NORTE KALAWIT 22,157 65.8 0 0 0 0 0 0 0 0 0 0
31 Mindanao 9 ZAMBOANGA PENINSULA ZAMBOANGA DEL NORTE SERGIO OSMENA 29,453 65.8 1 0 0 0 0 0 1 0 0 2
32 Mindanao 10 NORTHERN MINDANAO MISAMIS OCCIDENTAL DON MARIANO MARCOS 9,774 65.7 0 0 0 0 0 0 0 0 0 0
33 Mindanao ARMM AUTO. REG FOR MUSLIM MINDANAO MAGUINDANAO PAGLAT 11,207 65.4 0 0 0 0 0 0 0 0 0 0
34 Visayas 8 EASTERN VISAYAS NORTHERN SAMAR SILVINO LOBOS 14,303 64.8 0 0 0 0 0 0 0 0 0 0
35 Visayas 7 CENTRAL VISAYAS BOHOL SAN ISIDRO 9,125 64 0 0 0 0 0 2 0 0 0 2
36 Mindanao 11 DAVAO REGION (S-MINDANAO) DAVAO DEL SUR MALITA 109,568 63.8 5 0 0 0 6 0 1 1 0 13
37 Visayas 7 CENTRAL VISAYAS BOHOL BIEN UNIDO 25,796 63.7 0 0 0 0 2 1 0 0 1 4
38 Mindanao 12 SOCOSKSARGEN (CENTRL-MINDANAO) SULTAN KUDARAT PALIMBANG 83,265 63.7 0 0 0 0 0 0 0 0 0 0
39 Mindanao 9 ZAMBOANGA PENINSULA ZAMBOANGA DEL NORTE SIOCON 41,637 63.6 1 0 0 0 5 0 2 2 0 10
40 Visayas 7 CENTRAL VISAYAS BOHOL PILAR 26,887 67.1 1 0 0 0 3 0 0 0 0 4 8 of these municipalities have banks (1 has MBO), 3 have offsite ATMs, 9 have pawnshops, 4 have credit coops and RAs/MCs/FXDs, 12 have e-money agents
18 of these municipalities do not have any access points
*Poverty incidence data sourced from the National Statistical Coordination Board
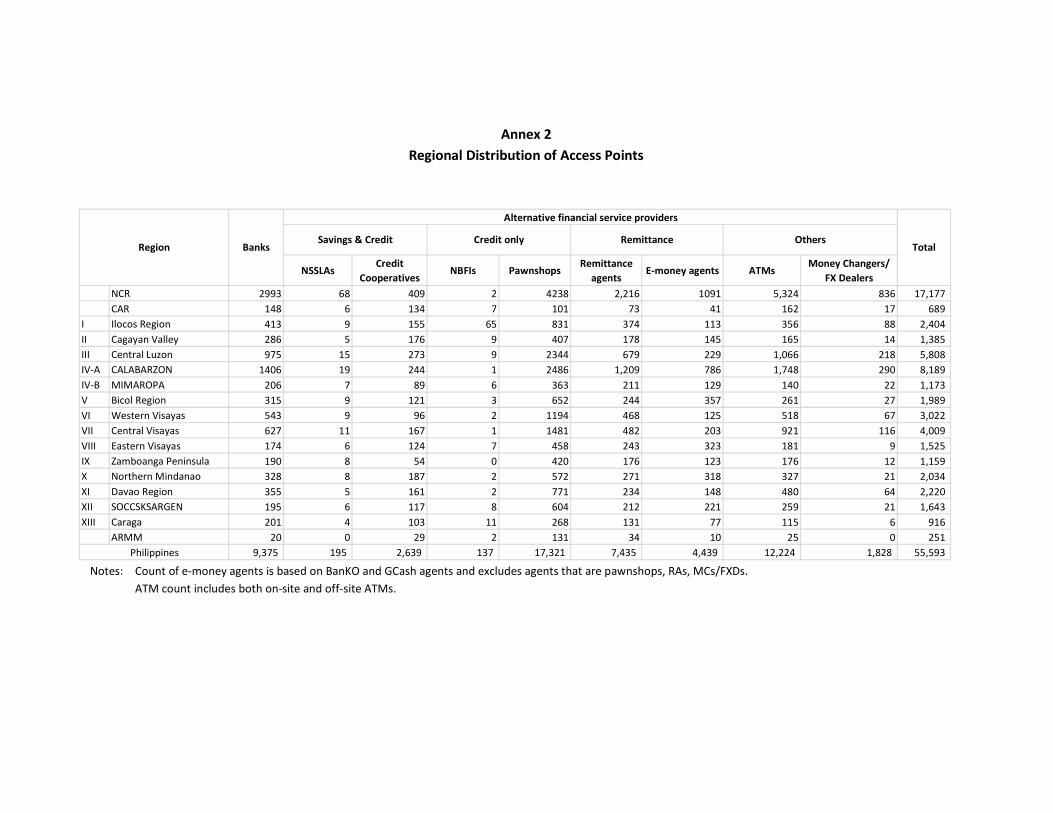
Annex 2
Regional Distribution of Access Points
NSSLAsCredit
CooperativesNBFIs Pawnshops
Remittance
agentsE-money agents ATMs
Money Changers/
FX Dealers
NCR 2993 68 409 2 4238 2,216 1091 5,324 836 17,177
CAR 148 6 134 7 101 73 41 162 17 689
I Ilocos Region 413 9 155 65 831 374 113 356 88 2,404
II Cagayan Valley 286 5 176 9 407 178 145 165 14 1,385
III Central Luzon 975 15 273 9 2344 679 229 1,066 218 5,808
IV-A CALABARZON 1406 19 244 1 2486 1,209 786 1,748 290 8,189
IV-B MIMAROPA 206 7 89 6 363 211 129 140 22 1,173
V Bicol Region 315 9 121 3 652 244 357 261 27 1,989
VI Western Visayas 543 9 96 2 1194 468 125 518 67 3,022
VII Central Visayas 627 11 167 1 1481 482 203 921 116 4,009
VIII Eastern Visayas 174 6 124 7 458 243 323 181 9 1,525
IX Zamboanga Peninsula 190 8 54 0 420 176 123 176 12 1,159
X Northern Mindanao 328 8 187 2 572 271 318 327 21 2,034
XI Davao Region 355 5 161 2 771 234 148 480 64 2,220
XII SOCCSKSARGEN 195 6 117 8 604 212 221 259 21 1,643
XIII Caraga 201 4 103 11 268 131 77 115 6 916
ARMM 20 0 29 2 131 34 10 25 0 251
9,375 195 2,639 137 17,321 7,435 4,439 12,224 1,828 55,593
Total
Philippines
Remittance OthersRegion Banks
Alternative financial service providers
Savings & Credit Credit only
Notes: Count of e-money agents is based on BanKO and GCash agents and excludes agents that are pawnshops, RAs, MCs/FXDs.
ATM count includes both on-site and off-site ATMs.