Embed Size (px)
Citation preview

Finance and Administration Meeting Portland State University
Academic and Student Recreation Center (ASRC) University Conference Room 515
Wednesday, 6/8/2016 9:00 AM - 12:00 PM PT
1. Call to Order/Roll/Declaration of Quorum
2. Consent Agenda
a. Approve Minutes from March 16, 2016 Meeting DraftMinutes03-04-16 - Page 2
b. Action Item Summary
3. Vice President's Report
a. Video Highlighting the Work of Finance & Administration Employees
b. Finance & Administration Employee Spotlight
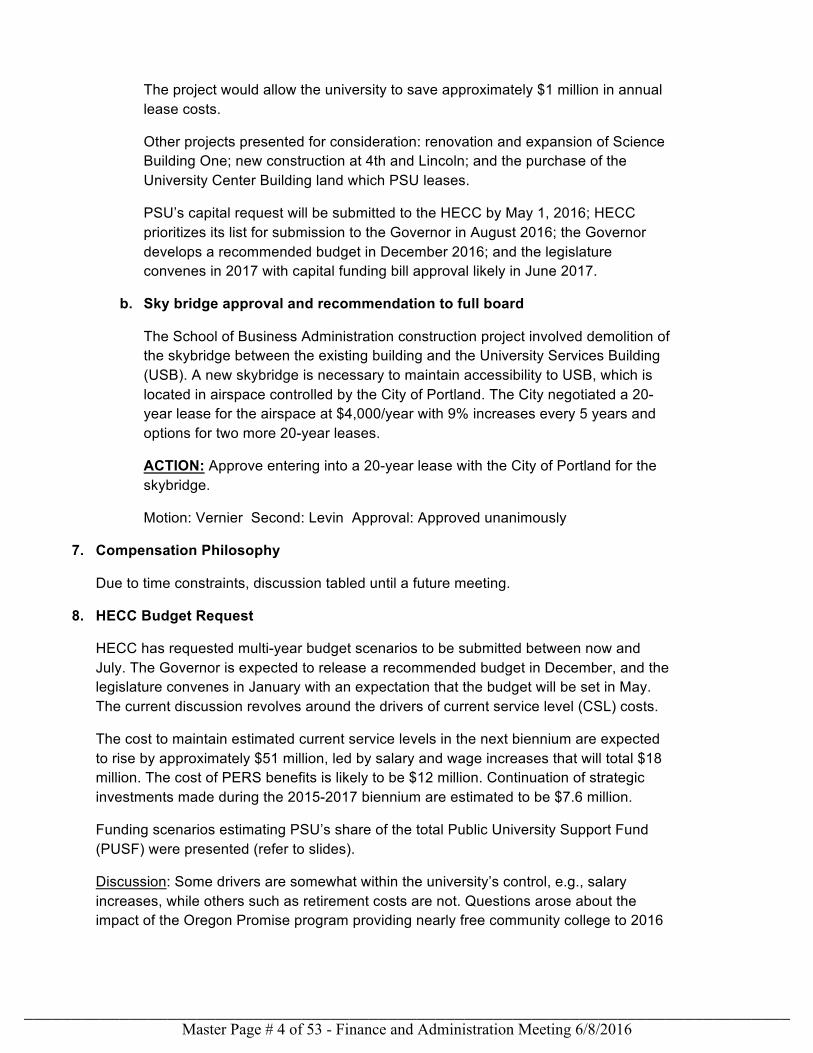
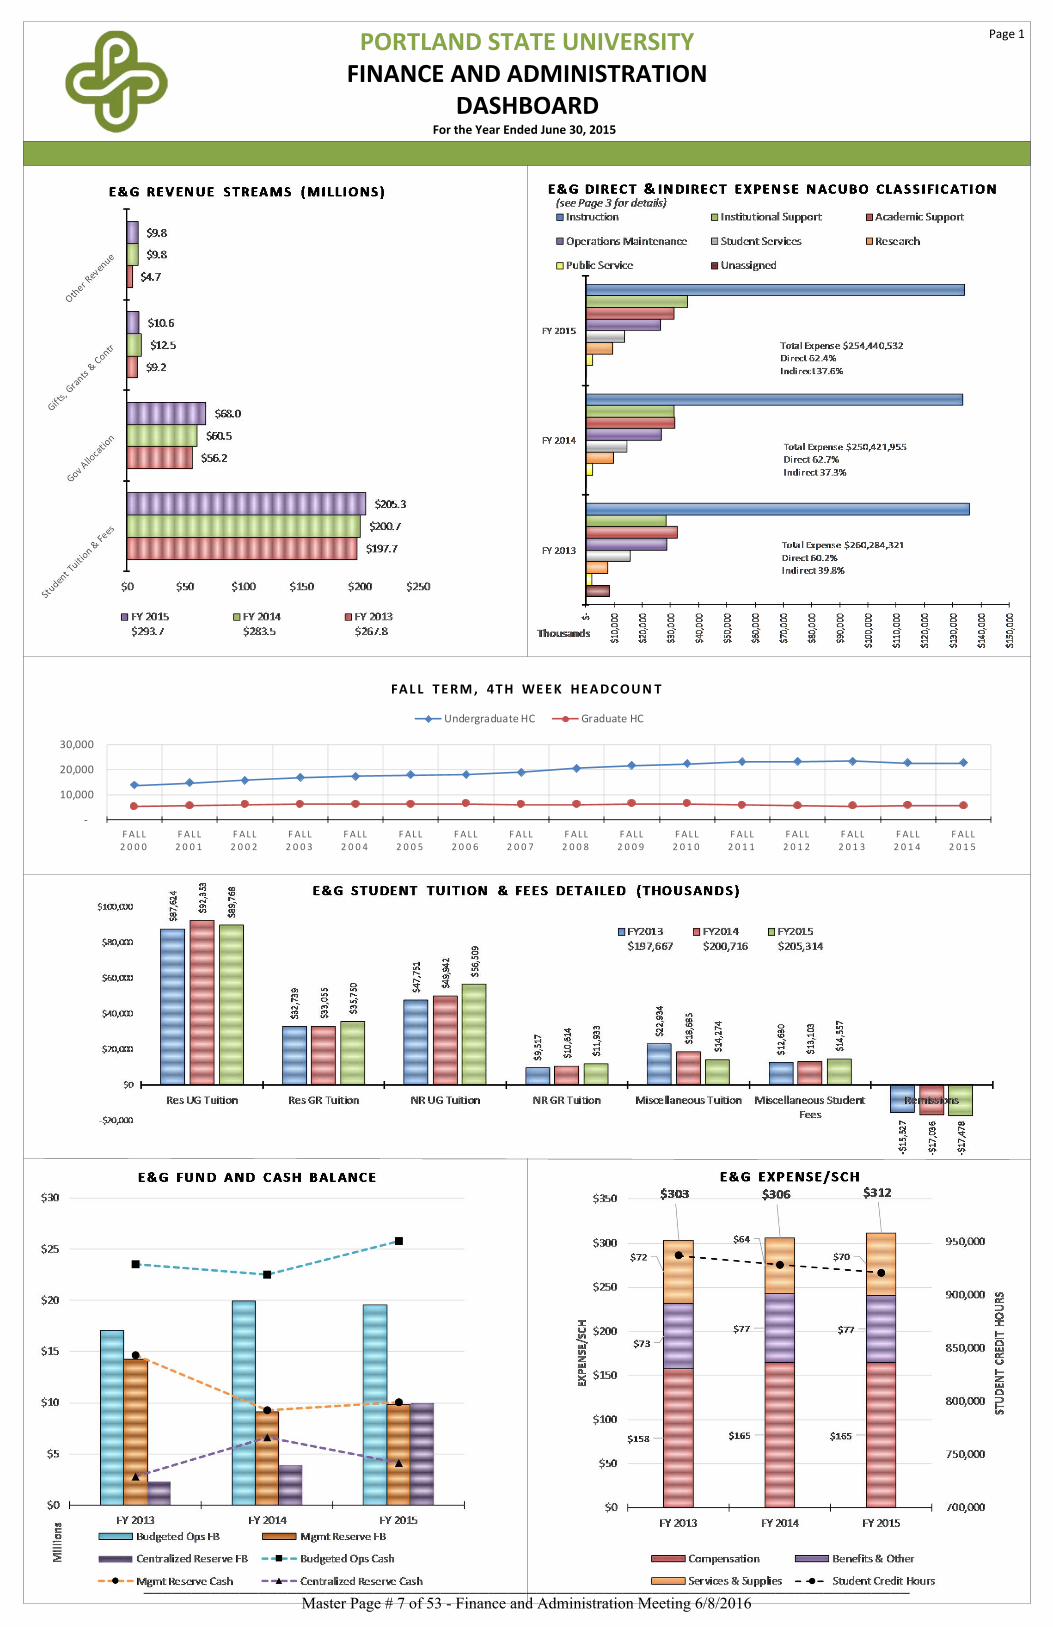
c. Update - Final Dashboard FY2015 Dashboard PDF Format FINAL - Page 7
4. 3rd Quarter Budget Reports
a. Enrollment
b. Quarterly Financial Reports
5. Reserve Policy
a. Resolution Recommending Approval of University Reserve Policy Reserves Management Policy Cover Sheet - Page 10 Resolution Approving Reserves Management Policy - Page 14 Proposed Reserves Management Policy and Procedures 06012016 - Page 15 OUS Policy Budgeted Operations Fund Balances - Page 19
6. FY17 Budget
a. Recommended Operating Budget for Fiscal Year 2016-2017
b. Resolution Recommending Approval of the University's FY16-17 Operating Budget Budget Resolution Cover Sheet Final - Page 22 2016-17 Operating Budget Resolution Final - Page 24 Appendix I 2016-17 Operating Budget Resolution - Page 27
7. Break
8. Risk Analysis Presentation
9. 2016-2017 Finance & Administration Committee Work Plan
10. Questions and Comments
11. Adjourn

PORTLAND STATE UNIVERSITY BOARD OF TRUSTEES FINANCE AND ADMINISTRATION COMMITTEE
MEETING #12 March 16, 2016 Academic and Student Recreation Center University Conference Room 9 am – 12 pm
Minutes
Committee Members Present: Rick Miller, Christine Vernier, Irving Levin, Gale Castillo, Erica Bestpitch
Board Members Present: Maria Carolina Gonzalez-Prats, Maude Hines, Swati Adarkar, Margaret Kirkpatrick, Lindsay Stewart
Committee Members Not Present: Wim Wiewel (ex officio), Pete Nickerson University Staff Present: David Reese, Kevin Reynolds, Andria Johnson, Susan Klees, Shelley Winn, Cathy Kirchner, Don Forsythe, Dan Zalkow, Kathi Ketcheson, Pam Hutchins, John Fraire, Jason Abbott
1. Call to Order/Roll/Declaration of Quorum
Chair Miller called the meeting to order at 9:08 am. Roll was called and quorum established.
2. Consent Agenda
ACTION: Amend February 4, 2016 meeting minutes to reflect that Erica Bestpitch was not present.
Motion to approve amended minutes: Vernier Second: Castillo Approval: approved unanimously
3. Vice President’s Report
Vice President Reynolds reported that the university’s purchase of the Broadway Housing Building from the PSU Foundation was completed on March 10th. The transaction will save the university approximately $1.6 million in recurring annual expense. He reviewed the F&A Committee annual goals and remarked that the committee will review the dashboard, item #2 on the list, today.
4. Budget Reports
a. 4th Week Winter Enrollment Report
Master Page # 2 of 53 - Finance and Administration Meeting 6/8/2016________________________________________________________________________________

Headcount at the end of the 4th week was down slightly at -0.1% compared to Winter 2015;; Student Credit Hours (SCH) were -0.2%. The FY16 budget planned for a 1.6% increase in SCH and resident/non-resident mix consistent with the previous year.
To recap 2015-2016 thus far, Summer SCH was -6.7% and Fall SCH was +0.2%.
b. 2nd Quarter Financial Reports
Gross tuition revenue was down by $1.6 million compared to the budget, which was set before the reduction in the tuition rate increase. Reduced tuition was offset somewhat by increases in student fees. Other revenues were up for the second quarter, with the exception of auxiliaries. Note that the purchase of the Broadway Housing Building will eliminate approximately $900,000 in Auxiliary revenue and expenses.
On the expenditure side, salaries and wages in the E&G budget are on target. Benefits expenditures were lower than budget, notably in E&G budgets.
The net impact of revenue and expenditure trends to date suggests that the E&G fund balance will increase during this fiscal year.
Discussion: Questions arose about the amount of reserve funds available to units, and the amount of reserves actually spent. Trustees would like to see the reserves in quarterly budget updates.
5. Dashboards
The dashboard presented reflects input from Chair Miller and Pete Nickerson. It shows major areas of financial performance that can be tracked annually.
Discussion: Some questions and comments raised included a desire to track financial performance relative to other universities, and to communicate to students where their tuition dollars are being spent. It would be helpful to have the formulas listed.
6. Capital Projects
a. Capital projects request presentation
The top priority presented was new construction at 4th & Montgomery proposed to include 90,000 square feet of space for the Graduate School of Education (GSE), classrooms and other departmental space. The building would also include 14,000 square feet of retail space owned by PSU, and 100,000 - 150,000 square feet to be occupied by other organizations including the City of Portland and a non-profit organization that works closely with GSE.
Financing would include $46 million in State-paid debt, Article XI-G Bonds, and $6 million in University-paid debt in the form of Article XI-F Bonds.
Master Page # 3 of 53 - Finance and Administration Meeting 6/8/2016________________________________________________________________________________
The project would allow the university to save approximately $1 million in annual lease costs.
Other projects presented for consideration: renovation and expansion of Science Building One;; new construction at 4th and Lincoln;; and the purchase of the University Center Building land which PSU leases.
PSU’s capital request will be submitted to the HECC by May 1, 2016;; HECC prioritizes its list for submission to the Governor in August 2016;; the Governor develops a recommended budget in December 2016;; and the legislature convenes in 2017 with capital funding bill approval likely in June 2017.
b. Sky bridge approval and recommendation to full board
The School of Business Administration construction project involved demolition of the skybridge between the existing building and the University Services Building (USB). A new skybridge is necessary to maintain accessibility to USB, which is located in airspace controlled by the City of Portland. The City negotiated a 20-year lease for the airspace at $4,000/year with 9% increases every 5 years and options for two more 20-year leases.
ACTION: Approve entering into a 20-year lease with the City of Portland for the skybridge.
Motion: Vernier Second: Levin Approval: Approved unanimously
7. Compensation Philosophy
Due to time constraints, discussion tabled until a future meeting.
8. HECC Budget Request
HECC has requested multi-year budget scenarios to be submitted between now and July. The Governor is expected to release a recommended budget in December, and the legislature convenes in January with an expectation that the budget will be set in May. The current discussion revolves around the drivers of current service level (CSL) costs.
The cost to maintain estimated current service levels in the next biennium are expected to rise by approximately $51 million, led by salary and wage increases that will total $18 million. The cost of PERS benefits is likely to be $12 million. Continuation of strategic investments made during the 2015-2017 biennium are estimated to be $7.6 million.
Funding scenarios estimating PSU’s share of the total Public University Support Fund (PUSF) were presented (refer to slides).
Discussion: Some drivers are somewhat within the university’s control, e.g., salary increases, while others such as retirement costs are not. Questions arose about the impact of the Oregon Promise program providing nearly free community college to 2016
Master Page # 4 of 53 - Finance and Administration Meeting 6/8/2016________________________________________________________________________________

high school graduates. For 2015-2016, PSU had 998 resident freshmen students. There is a desire to have the institution’s budget reflect its values.
9. Multi-year budget scenario Six year forecast scenarios were presented with the following assumptions:
a. Historical salary increases and escalation of PERS costs, and Current Service Level (CSL) increases in State allocations;;
b. Inflationary costs held to 2% plus PERS increases, with the same CSL increases. Discussion. Minimum wage increases have a modest impact at approximately $900,000 over the next biennium. The 6-year forecasts do not build in costs associated with addressing salary compression that occurs as a result of the minimum wage increases. The Student Success and Completion Model (SSCM) provides funding based on a) mission differential;; b) student credit hours;; and c) outcomes based funding. There is a stop loss/gain provision that phases out in 2020. PSU benefited from the model in the 2015-2017 biennium. Additional gains will only be possible with increased state funding of the SSCM. Changes in the formula could benefit PSU only at the expense of another institution.
10. Tuition Recommendation for 2016-2017 Academic Year
a. Trevor Jacobson, Public Affairs Director for ASPSU and member of the Student Budget Advisory Committee (SBAC) provided input, reporting that tuition increases, while necessary, impose hardships on students. David Martinez, ASPSU Vice President also read a statement opposing any increase in tuition.
b. Anna Vedder, Chair of the Student Fee Committee (SFC) responsible for allocating the mandatory incidental fee collected from students, reported that SFC wrestles with the same issues. Over the last 10 years the fee has been relatively flat and fee funded areas are adept at conserving money. The SFC recommends a fee increase due to low enrollment and rising costs. Additionally, the increase in the fee during summer session was recommended because originally fewer services were available during summer. That has changed and services are similar to those offered during the academic year.
c. Tuition memo/context
Assumptions made include flat enrollment in keeping with trends seen in recent years, increases in minimum wage, maintaining the goal of generating 1.6% net operating income, increases to tuition and mandatory fees to be less than or equal to 3.5% annually, and the revenue and cost drivers for FY17.
Comparing PSU’s resident undergraduate tuition rates to our peer institutions shows that our rates are near the bottom of the range. Resident graduate tuition is above the midpoint, as is non-resident undergraduate tuition. Non-resident graduate rates fall below the midpoint.
Master Page # 5 of 53 - Finance and Administration Meeting 6/8/2016________________________________________________________________________________

Proposed tuition and mandatory fee increases for the 2016-2017 academic year were presented:
Resident Undergraduate $6/credit hour 4% Resident Graduate $12/credit hour 3.4% Non-resident Undergraduate $18/credit hour 3.6% Non-resident Graduate $20/credit hour 3.6%
Student Building Fee $0 Incidental Fee $3/term 1.4% Health Service Fee $5/term 3.9% Recreation Center Fee $3/term 7.3%
Overall for resident undergraduates the increases proposed, assuming a full-time load of 15 credits, is a 3.77% increase.
ACTION: The committee would like to see a contingency plan anticipating cuts of 2-3-5% strategic budget reductions that considers all areas of the university. The goal is to understand to what extent inflationary pressures can be met with reductions rather than tuition increases.
d. Resolution recommending approval of tuition rates proposed
Motion: Levin Second: Vernier Approve: Levin, Vernier, Miller, Bestpitch. Opposed: Castillo Motion passed.
11. Questions and Comments
12. Adjourn
Chair Miller adjourned the meeting at 1:03 pm
Master Page # 6 of 53 - Finance and Administration Meeting 6/8/2016________________________________________________________________________________
PORTLAND STATE UNIVERSITYFINANCE AND ADMINISTRATION
DASHBOARDFor the Year Ended June 30, 2015
Page 1
‐
10,000
20,000
30,000
FALL 2 0 0 0
FALL 2 0 0 1
FALL 2 0 0 2
F ALL 2 0 0 3
FALL 2 0 0 4
FALL 2 0 0 5
FALL 2 0 0 6
FALL 2 0 0 7
F ALL 2 0 0 8
F ALL 2 0 0 9
FALL 2 0 1 0
FALL 2 0 1 1
FALL 2 0 1 2
F ALL 2 0 1 3
F ALL 2 0 1 4
FALL 2 0 1 5
FAL L TERM, 4TH WEEK HEADCOUN T
Undergraduate HC Graduate HC
Master Page # 7 of 53 - Finance and Administration Meeting 6/8/2016________________________________________________________________________________

PORTLAND STATE UNIVERSITYFINANCE AND ADMINISTRATION
DASHBOARDFor the Year Ended June 30, 2015
Page 2
0.35
0.38
0.36
0.34
0.35
0.36
0.37
0.38
FY 2013 FY 2014 FY 2015
ViabilityRatio
Higher is Better
Advised Range: 1.25 < X > 2.00
ExpendableNetAssetsOutstandingDebt
0.20 0.19
0.18
0.16
0.17
0.18
0.19
0.20
FY 2013 FY 2014 FY 2015
PrimaryReserveRatio
Advised Range: X > or = 0.400
Higher is Better
Expendable Net AssetsTotal Oper. Expense & Interest
4.55%
4.75%
4.87%
4.20%
4.40%
4.60%
4.80%
5.00%
FY 2013 FY 2014 FY 2015
DebtBurdenRatio
Ceiling: X < 7.00%
Lower is Better
DebtService Princ. &Int.TotalExpenses
(0.33) 0.51
2.44
(1.00)
‐
1.00
2.00
3.00
FY 2013 FY 2014 FY 2015
DebtServiceCoverageRatio
Higher is Better
Advised Range: X > or = 1.25
3 year
Average 0.88
Change in Unrestricted Net AssetsDebt Service Princ. &Int.
0.82
0.75
0.69
0.50
0.60
0.70
0.80
0.90
FY 2013 FY 2014 FY 2015
DebttoOperatingRevenuesRatio
Lower is Better
Advised Range: Internal Goal Not Set
Oustanding DebtTotalOperating Revenue
‐9.72%
‐5.89%
3.30%
‐15.00%
‐10.00%
‐5.00%
0.00%
5.00%
FY 2013 FY 2014 FY 2015
NetOperatingRevenueRatio
Advised Range: 2.00% < X > 4.00%
Higher is Better
Change in Net AssetsTotal Unrestricted Revenue
‐5.16%
3.79%
17.33%
‐10.00%
0.00%
10.00%
20.00%
FY 2013 FY 2014 FY 2015
ReturnonNetAssets
Advised Range: 3.00% < X > 4.00%
Higher is Better
ChangeinNetAssetsNetAssets
283,000
290,000
295,000
270,000
280,000
290,000
300,000
FY 2013 FY 2014 FY 2015
DeferredMaintenanceOutstanding(000's)
Lower is Better
Advised Range: Internal Goal Not Set
(1.09)
0.36
2.97
(2.00)
‐
2.00
4.00
FY 2013 FY 2014 FY 2015
CompositeFinancialIndex(CFI)
Advised Range: X >3.00
Higher is Better
1.19
1.44 1.37
‐
0.50
1.00
1.50
2.00
FY 2013 FY 2014 FY 2015
PSUonlyCurrentRatio
Advised Range: X >1.00
Higher is Better
Current AssetsCurrent Liability
1.33
4.72
0.86
8.66
0
5
10Primary Reserve Ratio
Net OperatingRevenue Ratio
Viability Ratio
Return on Nets Assets
FY2015CFIStrengthFactors
PSU CREDIT RATING
Agency Rating Outlook
MOODYS A1 StableS&P A Stable
Red Arrow – ATTENTION out of the advised range;Yellow Arrow – BE AWARE only one year in advised range or within the advised range but trending in a wrong direction; Green Arrow – GOOD within the advised range for more than one year;White Arrow – Internal goal not set;Arrow Direction – most recent year trend
References: The Board Role in Financial Oversight, AGB, Natalie Krawitz; Strategic Financial Analysis for Higher Education, Prager, Sealy & Co., LLC Master Page # 8 of 53 - Finance and Administration Meeting 6/8/2016________________________________________________________________________________

PORTLAND STATE UNIVERSITYFINANCE AND ADMINISTRATION
DASHBOARDFor the Year Ended June 30, 2015
Page 3
Viability Ratio ‐ How much of the total Debt could be covered with the
Expendable Net Assets if the Long‐term Debt is due today
0.355 0.375 0.359
FY 2013 FY 2014 FY 2015
Expendable Net Assets (Numerator)
PSU Gift Grants and Contracts (1,163) 2,042 2,290
PSU Student Loans 8,254 8,444 8,320
PSU Debt 1,539 14,526 1
PSU Unrestricted 54,205 32,369 45,214
CU Unrestricted Net Assets 2,070 1,945 3,000
CU Temporarily Restricted Net Assets 35,641 42,908 35,283
CU Net Investment in Plant (5,282) (4,819) (4,363)
Total Expendable Net Assets (Numerator) 95,264 97,415 89,745
Outstanding Debt (Denominator)
PSU XI‐F Principal 173,056 167,834 161,837
PSU Institutional COPs 24,617 23,334 22,106
PSU Institutional SELP 18,824 17,927 16,941
PSU LID Assessments 4,059 3,826 3,584
CU Notes Payable 2,545 2,459 2,367
CU Bonds Payable 45,270 44,210 43,105
Total Outstanding Debt (Denominator) 268,371 259,590 249,940
Primary Reserve Ratio ‐ How long the Institution could function using its
Expendable Nets Assets to cover Operating Expenses and Interest if revenue
generation ceases
0.195 0.194 0.177
FY 2013 FY 2014 FY 2015
Expendable Net Assets (Numerator)
PSU Gift Grants and Contracts (1,163) 2,042 2,290
PSU Student Loans 8,254 8,444 8,320
PSU Debt 1,539 14,526 1
PSU Unrestricted 54,205 32,369 45,214
CU Unrestricted Net Assets 2,070 1,945 3,000
CU Temporarily Restricted Net Assets 35,641 42,908 35,283
CU Net Investment in Plant (5,282) (4,819) (4,363)
Total Expendable Net Assets (Numerator) 95,264 97,415 89,745
Expense (Denominator)
PSU Total Operating Expense 456,858 465,581 449,907
PSU Interest Expense (From Non Operating, Only Debt Related) 9,639 10,281 10,061
CU Total University Support and Expenses 21,450 25,108 45,947
Total Expense (Denominator) 487,947 500,970 505,915
Debt Service Coverage Ratio ‐ measures the net income available to cover
annual debt service payments
(0.33) 0.51 2.44
FY 2013 FY 2014 FY 2015
Adjusted Change in Unrestricted Net Assets from Operations (Numerator)
PSU Net Operating Income (Loss) (132,634) (121,668) (98,115)
PSU Net Nonoperating Revenue 88,748 94,410 114,503
PSU Interest Expense 9,639 10,281 10,061
PSU Depreciation Expense 22,644 24,442 26,256
CU Change in Unrestricted Net Assets & Investment in Plant 645 338 1,511
CU Interest Expense 3,045 2,997 2,944
CU Depreciation Expense 897 893 919
Total Change in Unrestricted Net Assets (Numerator) (7,016) 11,693 58,079
Debt Service ‐ Principal & Interest (Denominator)
PSU XI‐F Debt Service 12,126 14,282 15,069
PSU Institutional COPs Debt Service 2,983 2,306 2,200
PSU SELP Debt Service 1,913 1,920 2,031
PSU LID Assessments Debt Service 392 392 392
CU Debt Service Corbett 255 255 255
CU Debt Service Broadway 3,850 3,888 3,886
Total Debt Service (Denominator) 21,519 23,043 23,833
Debt to Operating Revenues Ratio ‐ measures the amount of leverage
relative to the size of the operations
0.823 0.751 0.694
FY 2013 FY 2014 FY 2015
Outstanding Debt (Numerator)
PSU XI‐F Principal 173,056 167,834 161,837
PSU Institutional COPs 24,617 23,334 22,106
PSU Institutional SELP 18,824 17,927 16,941
PSU LID Assessments 4,059 3,826 3,584
CU Notes Payable 2,545 2,459 2,367
CU Bonds Payable 45,270 44,210 43,105
Total Outstanding Debt (Numerator) 268,371 259,590 249,940
Unrestricted Revenue (Denominator)
PSU Operating Revenues 324,224 343,913 351,792
CU Unrestricted Revenues 1,899 1,929 8,604
Total Unrestricted Income (Denominator) 326,123 345,842 360,396
Debt Burden Ratio ‐ Annual Debt Service as a percentage of Total
Expenses
4.55% 4.75% 4.87%
FY 2013 FY 2014 FY 2015
Debt Service ‐ Principal & Interest (Numerator)
PSU XI‐F Interest 7,268 8,076 7,892
PSU XI‐F Principal 4,858 6,206 7,177
PSU Institutional COPs Interest 1,065 1,023 973
PSU Institutional COPs Principal 1,918 1,283 1,227
PSU SELP Interest 1,138 1,023 1,046
PSU SELP Principal 775 897 985
PSU LID Assessments Interest 168 159 150
PSU LID Assessments Principal 224 233 242
CU Interest on Capital Debt 3,045 2,997 2,944
CU Principal on Capital Debt 1,060 1,146 1,197
Total Debt Service (Numerator) 21,519 23,043 23,833
Total Expenditures (Denominator)
PSU Total Operating Expenses 456,858 465,581 449,907
PSU Total Nonoperating Expenses (Interest, Only Debt Related) 9,639 10,281 10,061
(PSU Depreciation) (22,644) (24,442) (26,256)
PSU Principal Payments 7,775 8,619 9,631
CU Total University Support and Expenses 21,450 25,108 45,947
(CU Depreciation) (897) (893) (919)
CU Principal Payments 1,060 1,146 1,197
Total Expenditures (Denominator) 473,241 485,400 489,568
Net Operating Revenues Ratio ‐ how much Unrestricted Operating Net
Assets brings every $1.00 of Operating Unrestricted Revenue
(0.097) (0.059) 0.033
FY 2013 FY 2014 FY 2015
NOI +Net Nonoperating Revenues + CU Change in Unrestricted Net Assets
(Numerator)
PSU Net Operations Income (Loss) (132,634) (121,668) (98,115)
PSU Net Nonoperating Revenue (Expenses) 88,748 94,410 114,503
(PSU Investment Activities ‐ Internal Bank & Endowments only) ‐ (991) (610)
CU Total Change In Unrestricted Assets 645 338 1,511
Total Change in Operating net Assets (Numerator) (43,241) (27,911) 17,289
Total Unrestricted Operating Income (Denominator)
PSU Operating Revenues 324,224 343,913 351,792
PSU Non Operating Revenues 88,748 94,410 114,503
PSU Gain (Loss) on Sale of Assets ‐ 1,084 52
PSU Interest Expense 9,639 10,281 10,061
(PSU Investment Activities ‐ Internal Bank & Endowments only) ‐ (991) (610)
CU Unrestricted Revenues 22,096 25,447 47,459
Total Unrestricted Income (Denominator) 444,707 474,144 523,257
Return on Nets Assets Ratio ‐ Measure the change in the Net Assets of
the current year weighed by the Total Net Assets at the beginning of the year.
Measures if the Institution is better than in previous years
‐5.16% 3.79% 17.33%
FY 2013 FY 2014 FY 2015
Change in Net Assets (Numerator)
PSU Change in Net Assets (23,053) (3,121) 39,694
CU Change in Net Assets 10,035 12,183 (3,270)
Total Change in Net Assets (Numerator) (13,018) 9,062 36,424
Net Assets (Denominator)
PSU Net Assets "Beginning" 192,335 169,280 128,240
CU Net Assets "Beginning" 59,727 69,762 81,949
Total Net Assets (Denominator) 252,062 239,042 210,189
Current Ratio ‐ Measure the liquidity with ability to pay short term
liabilities with short term assets
1.19 1.44 1.37
FY 2013 FY 2014 FY 2015
Current Assets (Numerator)
PSU Current Assets 87,348 128,266 115,921
CU Current Assets
Total Current Assets (Numerator) 87,348 128,266 115,921
Current Liability (Denominator)
PSU Current Liabil ities 73,117 89,214 84,389
CU Current Liabil ities
Total Current Liability (Denominator) 73,117 89,214 84,389
References: The Board Role in Financial Oversight, AGB, Natalie Krawitz; Strategic Financial Analysis for Higher Education, Prager, Sealy & Co., LLC
NACUBO CLASSIFICATION CATEGORIES
Instruction – expenses for credit and noncredit courses; academic, vocational, and technical instruction; remedial and tutorial instruction; and regular, special, and extension sessions.
Research – expenses for activities specifically organized to produce research, whether commissioned by an external agency or within the institution.
Public Service – expenses for activities established primarily to provide non‐instructional services beneficial to individuals and groups external to the institution.
Operation and Maintenance of Plant – expenses for the administration, supervision, operation, maintenance, preservation, and protection of the institution’s physical plant.
NACUBO CLASSIFICATION CATEGORIES
Academic Support – expenses incurred to provide support services for the institution’s primary missions: instruction, research, and public service. The category includes libraries, provision of services, academic administration, media, and support for curriculum and course development.
Student Services – expenses incurred for offices of admissions and the registrar and activities with the primary purpose of contributing to students’ emotional and physical well‐being and intellectual, cultural, and social development outside the context of the formal instruction program.
Institutional Support – expenses for central, executive‐level activities, governing board, legal services, fiscal operations, governing board, information technology, and HR.
Master Page # 9 of 53 - Finance and Administration Meeting 6/8/2016________________________________________________________________________________

1
AGENDA ITEM: 5 DATE: June 8, 2015 TITLE: Resolution Approving Reserves Management Policy SUMMARY OF ITEM: An important component of the Board of Trustees’ responsibility for
financial oversight of the University is requiring the maintenance of adequate financial reserves. In its publication The Board’s Role in Financial Oversight, the Association of Governing Boards (AGB) states:
“Unrestricted net assets (fund balance/reserves) are the foundation
of prudent financial management and support the goal of financial flexibility. Strong fund balances/reserves help the institution make the case for higher credit ratings, thus enabling the issuance of debt, such as bonds at lower interest rates, for capital projects. Unrestricted net assets protect an institution from the shock of unexpected events (e.g., abrupt declines in state support, shifts in enrollment, [or the devastation that can result from natural disasters]). They also provide the flexibility to take advantage of unbudgeted opportunities. Again, using an external benchmark based on unrestricted net assets of peer institutions may help guide budget planning. The ability to sustain net assets at a targeted level should be reviewed annually and adjusted if economic conditions warrant. A best practice in this regard would be to have unrestricted net assets that (1) equal at least 150 days or five months of operating expenses and (2) exceed institutional debt.” (Krawitz, The Board’s Role in Financial Oversight, AGB Press, 2015, p.23.) The National Association of College and University Business Officers (NACUBO) also recommends that institutions maintain 150 days or five months of operating expenses in unrestricted net assets.
In order to assure maintenance of adequate financial reserves and to
guide University budget development, the University should have a clear Reserves Management Policy. The draft Reserves Management Policy presented for your consideration uses the Primary Reserve Ratio as the metric for measuring financial strength and the adequacy of reserves. The Primary Reserve Ratio compares expendable net assets, as the numerator, to total expenses, as the denominator. (Expendable net assets are assets that the University can access
BOARD OF TRUSTEES FINANCE & ADMINISTRATION COMMITTEE
Master Page # 10 of 53 - Finance and Administration Meeting 6/8/2016________________________________________________________________________________

2
quickly in order to satisfy its obligations.) This ratio indicates how long the University could operate using existing expendable funds only. The following chart illustrates the correlation between Primary Reserve Ratio and days of operating expense that could be covered by existing unrestricted net assets:
Primary
Reserve Ratio Days of
Operating Expenses 0.45 164 0.4 146 0.35 128 0.3 110 0.25 91 0.2 73 0.15 55
Based on PSU’s audited 2014-15 financial statements, the University’s
current Primary Reserve Ratio is 0.177, which is approximately 65 days of operating expenses.
The recommended draft policy establishes 0.25 as the University’s
target minimum Primary Reserve Ratio, which is equivalent to approximately three months (91 days) of operating expenses. The policy would establish the AGB- and NACUBO-recommended primary reserve ratio of 0.4 as an aspirational target.
0.25 is recommended as the appropriate target Primary Reserve Ratio
in light of the fiscal realities confronting the University. It is expected that it will take several years to achieve 0.25. Establishing a higher benchmark, although sound fiscal management, would place significant pressure on the University budget and tuition. At a time of scarce resources and significant concerns regarding affordability, we recommend establishing a benchmark that is lower than best practices, but which still provides a significant and healthier level of reserves for the University.
The draft policy directs that approximately one-half of the overall
University reserves be maintained in the Central Reserve. This is accomplished by establishing 12.5% of the annual Education and General Fund (E&G) and central University operating budget as the target minimum for the Central Reserve. In addition, the draft policy directs E&G-funded units throughout the University to establish 12.5% of their respective E&G budgets as their unit Operating Reserve target minimum. By holding approximately one-half of the University’s expendable net assets centrally and allowing the other one-half to be maintained at the unit level, the policy provides operational flexibility to units while maintaining a prudent level of
Master Page # 11 of 53 - Finance and Administration Meeting 6/8/2016________________________________________________________________________________
3
reserves university-wide. The University could, if necessary, transfer funds from unit reserves to the Central Reserve.
The draft policy also requires specific reserve accounts for specific
purposes: (1) the Policy requires that Auxiliary enterprises and service departments (such as Housing, Parking, Campus Recreation, and University Place Hotel), which are not within the E&G Fund, to also maintain three months of total annual departmental expenses; (2) the Policy requires Auxiliary enterprises and service departments to work with the Finance and Administration division to establish and maintain adequate reserves to fund the repair or replacement of depreciable assets; (3) the Policy requires University units that are responsible for debt service to set aside adequate funds to cover one year of their debt service obligation; and (4) the Policy requires the University to maintain an adequate Risk Management Claims Reserve to cover anticipated property and casualty claims, within the layer of risk retained by the University, based on claims experience and actuarial forecasts. Items (1) and (2) above are necessary to assure that Auxiliary enterprises and service departments avoid significant fluctuations in fees charged to University users and minimize the risk of shortfalls that would put pressure on the University’s E&G and other funds. Item (3) is necessary to assure that adequate funds are available for debt service and to avoid the risk of a shortfall putting pressure on the University’s E&G and other funds. Item (4) is part of any sound risk management strategy.
Rebuilding University reserves should be an institutional priority.
Prior to the recession, the University had approximately $99 million in expendable net assets, resulting in a Primary Reserve Ratio of approximately 0.29 in FY 2011. The University’s current Primary Reserve Ratio of 0.177 is based on expendable net assets of approximately $55.8 million. This is a 44% decline in expendable net assets over a five-year period. The availability of adequate reserves, coupled with budget cuts, permitted the University to weather significant state budget cuts during the recession. However, the resilience to manage through another recession or future unforeseen event requires the replenishing of the University’s unrestricted net assets.
This policy would replace the Oregon University System policy
regarding Budgeted Operations Fund Balances, adopted by the State Board of Higher Education in 2004. A copy of that policy is attached as background material. The OUS policy required that institutions develop budgets that targeted an ending biennial budgeted operations fund balance of approximately 10% of annual budgeted operations revenue, with a permissible +/- variance of 5%. This old OUS policy is inadequate for current University needs. The OUS policy was written at a time when OUS was a state agency. Its requirements
Master Page # 12 of 53 - Finance and Administration Meeting 6/8/2016________________________________________________________________________________
4
were significantly below the recommendations applicable to colleges and universities, it was not adjusted as OUS achieved greater autonomy from the state, and it did not take into account the lessons of the Great Recession. In addition, as a stand-along entity, the University is now responsible for its own credit rating and no longer has recourse to the pooled funds of a seven-university state system in the event of a shortfall, unforeseen need or disaster.
Overall, this policy is recommended to the Board as an appropriate
balancing of short-term needs, the current financial reality, and long-term institutional stability. This policy will be a key consideration in the development of future budgets to be brought to the Board.
REQUESTED COMMITTEE ACTION: Recommend that the full Board approve a resolution approving the
Reserves Management Policy ATTACHED DOCUMENTS: 1. Resolution 2. Draft Reserves Management Policy BACKGROUND READING: Previous Oregon University System Policy: Budgeted Operations Fund Balances
Master Page # 13 of 53 - Finance and Administration Meeting 6/8/2016________________________________________________________________________________
1
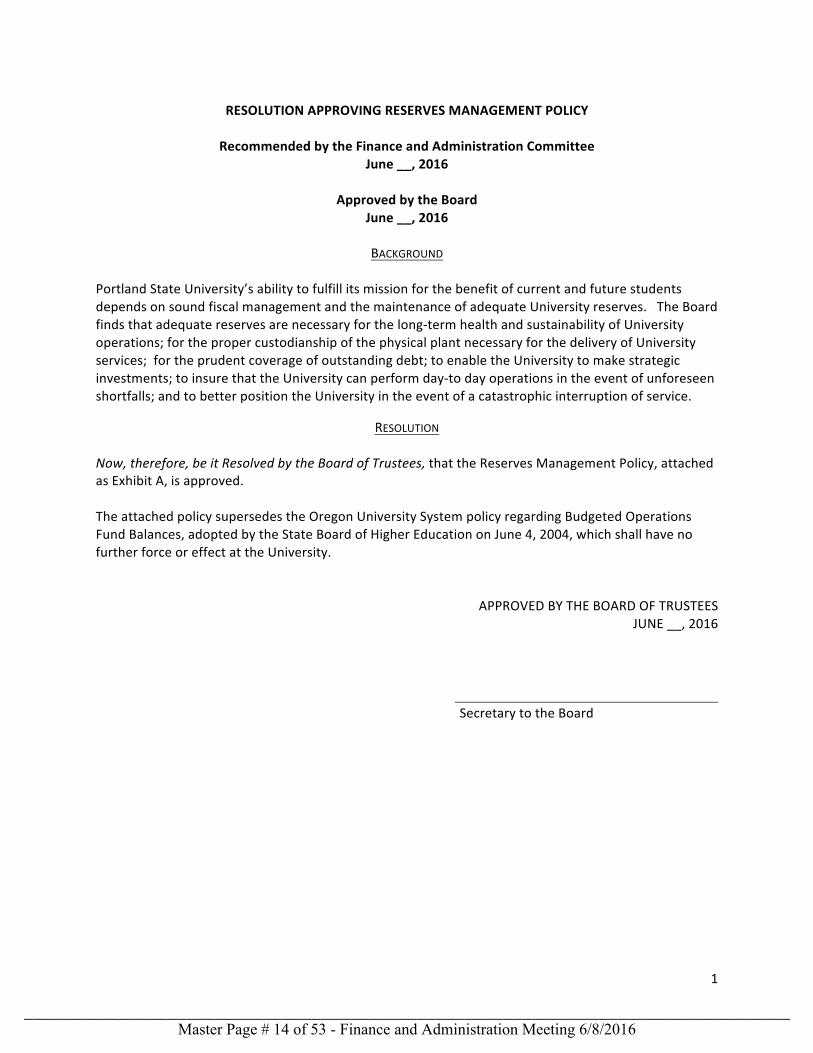
RESOLUTION APPROVING RESERVES MANAGEMENT POLICY
Recommended by the Finance and Administration Committee June __, 2016
Approved by the Board
June __, 2016
BACKGROUND
Portland State University’s ability to fulfill its mission for the benefit of current and future students depends on sound fiscal management and the maintenance of adequate University reserves. The Board finds that adequate reserves are necessary for the long-‐term health and sustainability of University operations; for the proper custodianship of the physical plant necessary for the delivery of University services; for the prudent coverage of outstanding debt; to enable the University to make strategic investments; to insure that the University can perform day-‐to day operations in the event of unforeseen shortfalls; and to better position the University in the event of a catastrophic interruption of service.
RESOLUTION Now, therefore, be it Resolved by the Board of Trustees, that the Reserves Management Policy, attached as Exhibit A, is approved. The attached policy supersedes the Oregon University System policy regarding Budgeted Operations Fund Balances, adopted by the State Board of Higher Education on June 4, 2004, which shall have no further force or effect at the University.
APPROVED BY THE BOARD OF TRUSTEES JUNE __, 2016
Secretary to the Board
Master Page # 14 of 53 - Finance and Administration Meeting 6/8/2016________________________________________________________________________________

1
RESERVES MANAGEMENT POLICY
Portland State University’s ability to fulfill its mission for the benefit of current and future students depends on sound fiscal management and the maintenance of adequate University reserves. The Board finds that adequate reserves are necessary for the long-term health and sustainability of University operations; for the proper custodianship of the physical plant necessary for the delivery of University services; for the prudent coverage of outstanding debt; to enable the University to make strategic investments; to insure that the University can perform day-to day operations in the event of unforeseen shortfalls; and to better position the University in the event of a catastrophic interruption of service. University operations are susceptible to the volatility of primary revenue streams, operational cost drivers beyond the University’s control, contractual obligations that are difficult to minimize during periods of financial distress, the business cycles of disparate business enterprises, and the risk of complete or partial interruption of University services.
This policy sets forth the principles governing the establishment and maintenance of University reserves. This policy describes the framework for establishing University reserves through the set-aside or restriction of financial assets. While this is a stand-alone policy, the Reserves Management Policy should be considered in conjunction with other University budget, debt and financial management policies and procedures.
I. Definitions
A. “Board” means the Portland State University Board of Trustees or the Executive and Audit Committee when authorized to act on behalf of the Board.
B. “Capital Reserves” means funds restricted for the repair or replacement of existing physical plant and equipment.
C. “Central Reserve” means the unallocated E&G Fund balances held centrally and managed by the Finance and Administration division.
D. “Debt-Paying Entity” means a department of the University directly responsible for the generation of revenues for the payment of principal and interest on a distinct issuance of University-Paid Debt.
E. “Educational and General (E&G) Fund” means the family of funds utilized for the core mission of the University—including funds appropriated by the state, tuition and fees, indirect cost recovery, and other miscellaneous income derived through the provision of education.
F. “Maximum Annual Debt Service” means the greatest amount of principal and interest required to be paid during any fiscal year for a department’s current debt portfolio and existing debt service schedule.
G. “Operating Reserves” means E&G fund balances held and managed at the divisional level.
Master Page # 15 of 53 - Finance and Administration Meeting 6/8/2016________________________________________________________________________________

2
H. “Primary Reserve Ratio” is a ratio measuring the financial strength of the University by comparing expendable net assets to total expenses. Expendable net assets represent those assets that the University can access quickly and spend to satisfy its debt and operating expense obligations. This ratio provides a snapshot of financial strength and flexibility by indicating how long the University could operate using existing expendable funds only.
I. “Risk Management Claims Reserve” means the fund through which the University’s property and casualty claim expenses are paid, within any applicable deductible.
J. “Treasury Reserve” means the fund through which all University-Paid Debt service and associated treasury fees are processed for payment to outside agencies. Additionally, this fund acts as the repository for cash balances equal to the Maximum Annual Debt Service for each individual Debt Paying Entity.
K. “University-Paid Debt” means borrowings that are expected to be repaid from revenues of the University. This includes Article XI-F(1) Bonds, certain Article XI-Q Bonds, certain Certificates of Participation (COPs), certain State Energy Loan Program (SELP) loans, revenue bonds, bank products, commercial paper, and alternative financing structures, such as public-private partnerships, that would be included in the University’s balance sheet or considered on-credit by rating agencies.
L. “Working Capital” means current assets minus current liabilities.
II. Roles and Responsibilities
The Board retains authority and responsibility for:
A. Reviewing annual reports on the University’s Primary Reserve Ratio and component reserves.
B. Approval of the set-aside and restriction of cash to achieve the goals and requirements of this Policy, generally as part of the annual budget process.
C. Establishment and approval of a plan to increase the Primary Reserve Ratio, generally as part of the annual budget process, if the Primary Reserve Ratio is below the minimum required by this Policy.
D. Reviewing this policy at least every five years and amending the policy whenever necessary.
The Board delegates to the President, who may further delegate to other University officials, authority and responsibility for:
A. Implementing this policy and overseeing management of daily activities related thereto. B. Establishing a comprehensive program for Central, Operating, Working Capital, Capital,
Treasury and Risk Management Claims Reserve establishment, management and reporting. Such a program is to clearly assign responsibilities within the University and require regular monitoring to satisfy reserve requirements.
C. During annual budget processes, recommending corrective action when reserve levels are below the minimum target.
Master Page # 16 of 53 - Finance and Administration Meeting 6/8/2016________________________________________________________________________________

3
D. Recommending appropriate action and use of reserve balances if unforeseen events and economic factors require short-term deficit spending and a reduction to the Primary Reserve Ratio.
E. Analyzing and presenting recommendations to the Board regarding Operating and Capital Reserve levels and emergency use.
III. Reserve Goals & Objectives
The Primary Reserve Ratio is the measure by which the Board monitors the University’s long-term financial sustainability and the adequacy of University reserves. The Board establishes 0.25 as the target minimum Primary Reserve Ratio for the University. This is equal to maintaining expendable net assets adequate to cover at least three months of University expenses.
The Board recognizes that the National Association of College and University Business Officers (NACUBO), an organization representing more than 2,500 colleges, universities, and higher education service providers with a mission to advance the economic viability, business practices and support of higher education institutions, recommends a Primary Reserve Ratio of 0.4 or greater. The Board establishes 0.4 as an aspirational Primary Reserve Ratio.
IV. Component Reserve Standards
A. Central Reserve
As a target minimum, the University will hold as fund balance, 12.5% of the annual E&G Fund budget and an additional 12.5% of the central University operating budget, for the Central Reserve managed by the Finance and Administration division.
B. Operating Reserves
University divisions within the E&G Fund shall, on behalf of their units, establish 12.5% of their respective annual E&G Fund budget as an Operating Reserve target minimum.
The University may, if necessary, transfer some or all funds from Operating Reserves if Central Reserves are inadequate to meet University needs.
C. Working Capital for Auxiliary Enterprises and Service Departments
Auxiliary enterprises and service departments shall maintain sufficient Working Capital to promote the efficient and effective operation of the unit, avoid significant fluctuations in fees charged for services, and minimize the potential for unanticipated financial shortfalls that may impact other funds of the institution. As a target minimum, auxiliary enterprises and service departments are to hold three months of total annual departmental expense as a Working Capital balance (based on actual expenditure data excluding depreciation).
D. Capital Reserves for Auxiliary Enterprises, Service Departments and Self-Liquidating Activities
Master Page # 17 of 53 - Finance and Administration Meeting 6/8/2016________________________________________________________________________________
4
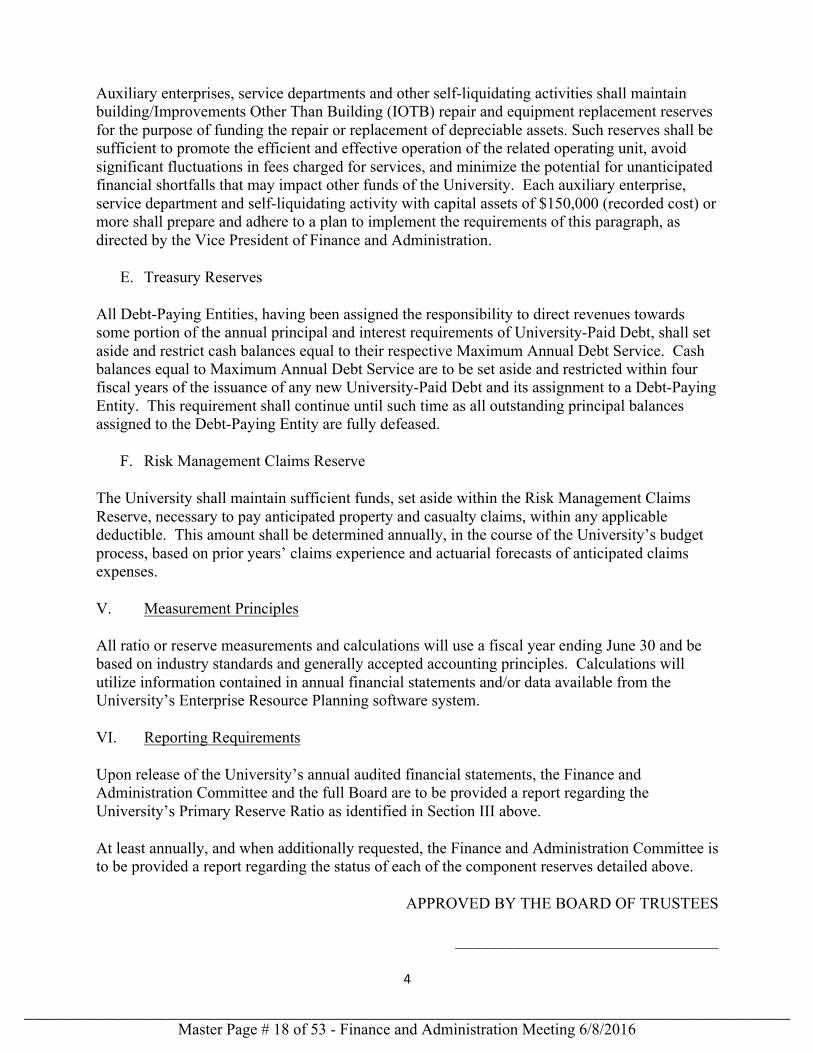
Auxiliary enterprises, service departments and other self-liquidating activities shall maintain building/Improvements Other Than Building (IOTB) repair and equipment replacement reserves for the purpose of funding the repair or replacement of depreciable assets. Such reserves shall be sufficient to promote the efficient and effective operation of the related operating unit, avoid significant fluctuations in fees charged for services, and minimize the potential for unanticipated financial shortfalls that may impact other funds of the University. Each auxiliary enterprise, service department and self-liquidating activity with capital assets of $150,000 (recorded cost) or more shall prepare and adhere to a plan to implement the requirements of this paragraph, as directed by the Vice President of Finance and Administration.
E. Treasury Reserves
All Debt-Paying Entities, having been assigned the responsibility to direct revenues towards some portion of the annual principal and interest requirements of University-Paid Debt, shall set aside and restrict cash balances equal to their respective Maximum Annual Debt Service. Cash balances equal to Maximum Annual Debt Service are to be set aside and restricted within four fiscal years of the issuance of any new University-Paid Debt and its assignment to a Debt-Paying Entity. This requirement shall continue until such time as all outstanding principal balances assigned to the Debt-Paying Entity are fully defeased.
F. Risk Management Claims Reserve
The University shall maintain sufficient funds, set aside within the Risk Management Claims Reserve, necessary to pay anticipated property and casualty claims, within any applicable deductible. This amount shall be determined annually, in the course of the University’s budget process, based on prior years’ claims experience and actuarial forecasts of anticipated claims expenses.
V. Measurement Principles
All ratio or reserve measurements and calculations will use a fiscal year ending June 30 and be based on industry standards and generally accepted accounting principles. Calculations will utilize information contained in annual financial statements and/or data available from the University’s Enterprise Resource Planning software system.
VI. Reporting Requirements
Upon release of the University’s annual audited financial statements, the Finance and Administration Committee and the full Board are to be provided a report regarding the University’s Primary Reserve Ratio as identified in Section III above.
At least annually, and when additionally requested, the Finance and Administration Committee is to be provided a report regarding the status of each of the component reserves detailed above.
APPROVED BY THE BOARD OF TRUSTEES
_________________________________
Master Page # 18 of 53 - Finance and Administration Meeting 6/8/2016________________________________________________________________________________

BUDGETED OPERATIONS FUND BALANCES
(Adopted by the Oregon State Board of Higher Education, Meeting #734, June 4, 2004, pp. 244-245;
Amended by the Board, Meeting #738, September 10, 2004.)
Background:
Responsible fiscal management requires adequate reserves, or fund balances, to mitigate current and
future risks. Adequate fund balances are essential to offsetting cyclical variations in revenues and
expenditures and to protect against 1) catastrophic events, 2) unforeseen revenue declines and
expenditure gaps, 3) unexpected legal obligations, and 4) failures and health/safety/code issues in
infrastructure or major business systems.
The focus of this policy is fund balances within the budgeted operations funds, which are the primary
operating funds through which all basic instruction and institution administration occur. Budgeted
operations funds include state General Funds and Other Funds Limited, made up principally of student
tuition and fees and also including educational department sales and services, indirect cost recovery,
and other operating revenues.
For the purpose of gauging their relative value, budgeted operations fund balances can be expressed
either as a percentage of annual budgeted operating revenues or as operating expenditures sufficient to
fund a specified period. The Government Finance Officers Association, for example, recommends that
fund balances be maintained at a level that represents 5 to 15 percent of operating revenues, or is
sufficient to fund no less than one to two months of operating expenditures.
Obviously, the level of budgeted operations fund balance should be related to the likelihood of need.
Given the timing of tuition assessments, revenue cycles at OUS institutions tend to spike quarterly while
expenditures remain relatively flat. When combined with the volatility of state funding over the past
several biennia—as well as fluctuations in enrollment and tuition dollars—the need to maintain fund
balances sufficient to stabilize the operating revenue stream for short periods is clearly imperative. The
institutions, for example, are particularly vulnerable to shortfalls in revenue collections during the first
quarter of each biennium.
Responsible fiscal policy, then, suggests that the institutions should maintain ending biennial budgeted
operations fund balances sufficient to stabilize the operating revenue stream and cover unforeseen
contingencies equal to approximately one month’s operating expenditures, or about 10 percent of their
annual budgeted operations revenues.
At the same time, because of the funding mix of state General Funds and student tuition and fees, any excess balances could be interpreted to represent unwarranted tuition and fee rates. Consequently, ending biennial budgeted operations fund balances should not exceed approximately two months of budgeted operations expenditures, or about 15 percent of annual budgeted operations revenues. Fund Balance Defined:
Master Page # 19 of 53 - Finance and Administration Meeting 6/8/2016________________________________________________________________________________

Fund balance is defined as the difference between the assets and liabilities of a fund. Given this definition, fund balance can be described as the available resources of the fund, which can be significantly different than cash balances due to accrual accounting. For instance, at June 30 of each fiscal year, campuses have received payments for summer session tuition and fees. Since summer session activity occurs predominantly in July, these receipts are recorded as a liability (deferred revenue) at June 30 to comport with accounting rules. As a result, cash balances may be higher than fund balances.
As noted above, fund balance is the difference between the assets and liabilities of a fund.
Generally Accepted Accounting Principles (GAAP), promulgated by independent standards-setting
groups, set forth rules for the proper recording and valuation of assets and liabilities. Each OUS
institution is required to follow GAAP. Therefore, fund balance is defined consistently across all OUS
institutions.
Budgeted Operations Fund Balances at June 30, 2004:
Institution Fund Balance Commitments Defined: Higher education institutions operate in a fiscal environment and on a business cycle that does not tightly correlate with the biennial budget process. As a result, institution management may make certain internal budgetary commitments against their fund balances. Among other reasons, these internal budgetary commitments are necessary in order to help maintain continuity of programs and provide funds for entrepreneurial activities and/or to provide incentives for certain desired outcomes. Examples of these budgetary commitments include, but are not limited to, commitments to maintain balances for certain departments, commitments to fund certain future actions, or
Master Page # 20 of 53 - Finance and Administration Meeting 6/8/2016________________________________________________________________________________
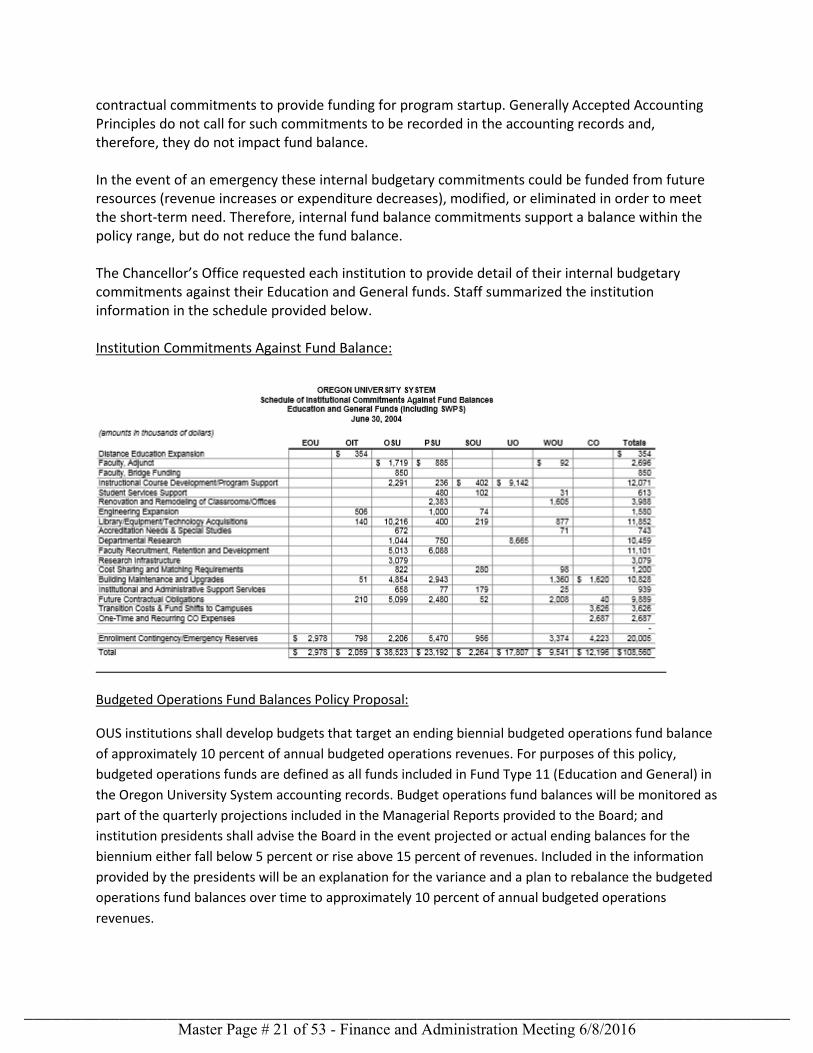
contractual commitments to provide funding for program startup. Generally Accepted Accounting Principles do not call for such commitments to be recorded in the accounting records and, therefore, they do not impact fund balance. In the event of an emergency these internal budgetary commitments could be funded from future resources (revenue increases or expenditure decreases), modified, or eliminated in order to meet the short-term need. Therefore, internal fund balance commitments support a balance within the policy range, but do not reduce the fund balance. The Chancellor’s Office requested each institution to provide detail of their internal budgetary commitments against their Education and General funds. Staff summarized the institution information in the schedule provided below. Institution Commitments Against Fund Balance:
Budgeted Operations Fund Balances Policy Proposal:
OUS institutions shall develop budgets that target an ending biennial budgeted operations fund balance
of approximately 10 percent of annual budgeted operations revenues. For purposes of this policy,
budgeted operations funds are defined as all funds included in Fund Type 11 (Education and General) in
the Oregon University System accounting records. Budget operations fund balances will be monitored as
part of the quarterly projections included in the Managerial Reports provided to the Board; and
institution presidents shall advise the Board in the event projected or actual ending balances for the
biennium either fall below 5 percent or rise above 15 percent of revenues. Included in the information
provided by the presidents will be an explanation for the variance and a plan to rebalance the budgeted
operations fund balances over time to approximately 10 percent of annual budgeted operations
revenues.
Master Page # 21 of 53 - Finance and Administration Meeting 6/8/2016________________________________________________________________________________
AGENDA ITEM: 6 DATE: June 8, 2016 TITLE: Resolution Concerning University FY16-17 Operating Budget SUMMARY OF ITEM: Portland State University has completed its budget development
process with the guiding principle of presenting a balanced budget. REQUESTED COMMITTEE ACTION: Approve the attached resolution regarding the University’s 2016-
2017 fiscal year budget and recommend approval to the full Board.
First, a base budget was developed assuming flat enrollment and a consistent student mix (resident/non-resident), additional revenue generated by the tuition increase authorized by the Board in March, and the level of state appropriation to public universities proposed by the Higher Education Coordinating Commission (HECC) per the Student Success and Completion Model (SSCM). Base expenditure budgets were set at a level matching this anticipated level of overall base funds which includes a $5 million positive operating margin. Each division was assigned a base budget of adjusted 2015-16 budget plus 3%.
Second, the Integrated Planning of Enrollment and Budget (IPEB) process forecasted flat enrollment from FY2015-16’s lower than budgeted performance. This process included the schools, colleges and administration and resulted in a settle-down for the FY2016-17 Academic Affairs budget.
Third, a portion of the balanced budget includes a strategic investment pool of $1.75 million. Proposals were submitted to and reviewed by the President’s executive committee. Over the 2015-17 biennium the University designated a total of $7.42 million for critical and strategic initiatives.
ATTACHED DOCUMENTS: 1. Resolution Concerning University FY16-17 Operating Budget
BOARD OF TRUSTEES FINANCE & ADMINISTRATION COMMITTEE
Master Page # 22 of 53 - Finance and Administration Meeting 6/8/2016________________________________________________________________________________
2. Appendix I – Operating Budget Supplemental Information BACKGROUND READING: None
Master Page # 23 of 53 - Finance and Administration Meeting 6/8/2016________________________________________________________________________________

RESOLUTION CONCERNING UNIVERSITY FY16-‐17 OPERATING BUDGET
Approved by the Finance and Administration Committee, June 8, 2016
BACKGROUND
A. PSU’s All Funds Budget includes revenues and expenses in five fund types:
1. Education and General (E&G) -‐ PSU’s core operations. E&G includes funds from tuition, state appropriations (general fund), and fees.
2. Designated Operations -‐ Fees charged for external activities, non-‐credit programs, workshops, community service programs, conferences and related activities.
3. Service Departments -‐ Departments that provide a service internal to the university, which includes telecommunications, copying/plotter services, and the Survey Research Lab.
4. Auxiliary Enterprises -‐ University services that generally do not receive state support, including Housing, Student Activities, Athletics, Health Services, and Parking.
5. Restricted Funds – Funds that can only be used for a designated purpose, such as gifts, grants, contracts, and student financial aid.
B. The guiding principles for fiscal year 2016-‐17 budget planning were to develop a balanced
budget with a positive operating margin of $5 million for E&G funds, modest tuition increases with a corresponding increase to remissions, and identifying cost savings that do not impact students and the University’s core mission.
C. Fiscal year 2016-‐17 represents the third year of budget development under Performance Based Budgeting. Revenue and expenditure budgets were developed in three phases.
D. First, a base budget was developed assuming flat enrollment and a consistent student mix (resident/non-‐resident), additional revenue generated by the tuition increase authorized by the Board in March, and the level of state appropriation to public universities proposed by the Higher Education Coordinating Commission (HECC) per the Student Success and Completion Model (SSCM). Base expenditure budgets were set at a level matching this anticipated level of overall base funds. Each division was assigned a base budget of adjusted 2015-‐16 budget plus 3%. It is expected that each division will pay for all increased costs, both known and unknown, including salary increases (bargained or otherwise), benefit cost increases, and all other inflationary costs.
E. Second, the Integrated Planning of Enrollment and Budget (IPEB) process forecasted flat
enrollment from FY2015-‐16’s lower than budgeted performance. This process included the schools, colleges and administration and resulted in a settle-‐down for the FY2016-‐17 Academic Affairs budget.
Master Page # 24 of 53 - Finance and Administration Meeting 6/8/2016________________________________________________________________________________
F. Third, a portion of the balanced budget includes a strategic investment pool of $1.75 million. Proposals were submitted to and reviewed by the President’s executive committee. Over the 2015-‐17 biennium the University designated a total of $7.42 million for critical and strategic initiatives.
RESOLUTION Now, therefore, be it Resolved by the Board of Trustees, that the University All Funds Budget for the 2016-‐17 fiscal year be approved as follows:
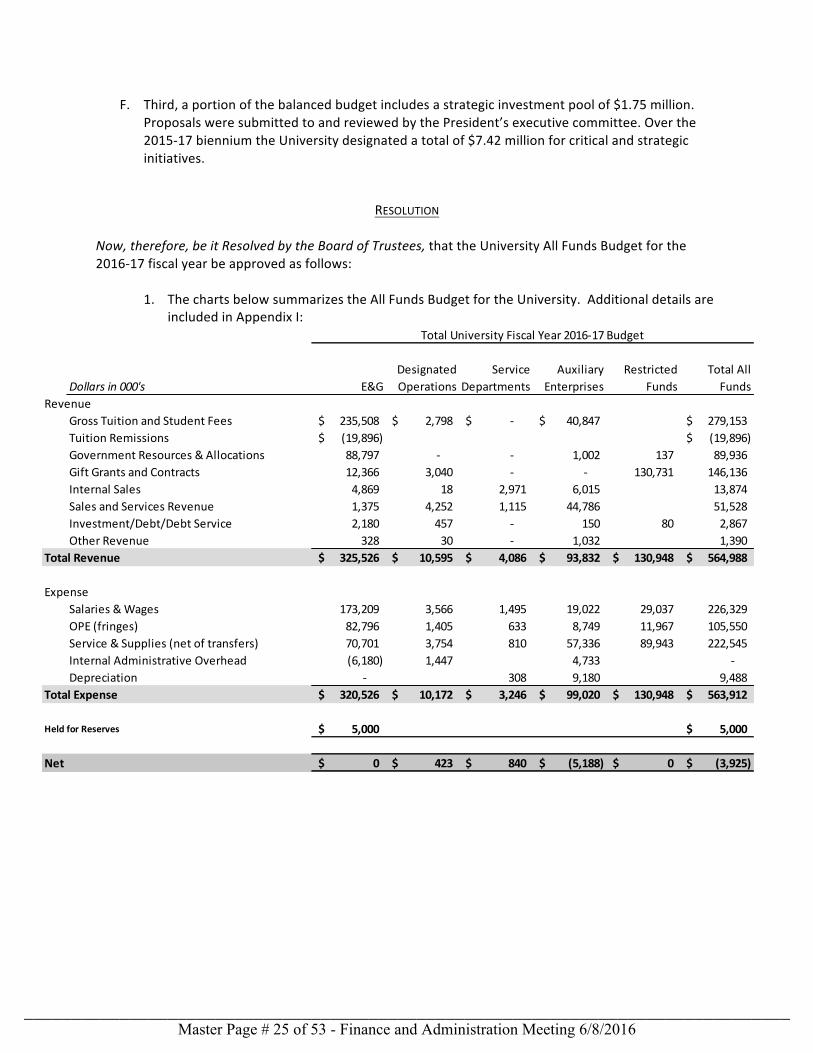
1. The charts below summarizes the All Funds Budget for the University. Additional details are included in Appendix I:
Dollars in 000's E&G Designated Operations
Service Departments
Auxiliary Enterprises
Restricted Funds
Total All Funds
Revenue Gross Tuition and Student Fees 235,508$ 2,798$ -‐$ 40,847$ 279,153$ Tuition Remissions (19,896)$ (19,896)$ Government Resources & Allocations 88,797 -‐ -‐ 1,002 137 89,936 Gift Grants and Contracts 12,366 3,040 -‐ -‐ 130,731 146,136 Internal Sales 4,869 18 2,971 6,015 13,874 Sales and Services Revenue 1,375 4,252 1,115 44,786 51,528 Investment/Debt/Debt Service 2,180 457 -‐ 150 80 2,867 Other Revenue 328 30 -‐ 1,032 1,390
Total Revenue 325,526$ 10,595$ 4,086$ 93,832$ 130,948$ 564,988$
Expense Salaries & Wages 173,209 3,566 1,495 19,022 29,037 226,329 OPE (fringes) 82,796 1,405 633 8,749 11,967 105,550 Service & Supplies (net of transfers) 70,701 3,754 810 57,336 89,943 222,545 Internal Administrative Overhead (6,180) 1,447 4,733 -‐ Depreciation -‐ 308 9,180 9,488
Total Expense 320,526$ 10,172$ 3,246$ 99,020$ 130,948$ 563,912$
Held for Reserves 5,000$ 5,000$
Net 0$ 423$ 840$ (5,188)$ 0$ (3,925)$
Total University Fiscal Year 2016-‐17 Budget
Master Page # 25 of 53 - Finance and Administration Meeting 6/8/2016________________________________________________________________________________

*The Office of the President includes the Office of General Counsel, University Communications, Global Diversity and Inclusion, Internal Audit and the Board of Trustees, in addition to the Office of the President itself.
2. Some of the amounts in this resolution may change in the final adopted budget for fiscal year 2016-‐17, based on changed needs or circumstances. The President is authorized to make adjustments to the budget presented here as long as those amounts do not materially change the overall budget.
APPROVED BY THE BOARD OF TRUSTEES JUNE __, 2016
Secretary to the Board
Dollars in 000's E&G Designated Operations
Service Departments
Auxiliary Enterprises
Restricted Funds
Total All Funds
Academic Affairs 210,444$ 9,375$ 226$ 2,172$ 58,115$ 280,332$ Office of the President* 7,755 -‐ -‐ -‐ 431 8,186 PSU Foundation 6,714 -‐ -‐ -‐ -‐ 6,714 Enrollment Management & Student Affairs 10,876 187 -‐ 49,030 1,295 61,388 Research and Strategic Partnerships 8,152 610 1,288 884 11,805 22,738 Finance and Administration 48,915 -‐ 2,523 27,236 10 78,684 Athletics 2,257 -‐ -‐ 4,558 575 7,390 General University 25,412 -‐ (791) 15,141 58,717 98,480
Total Expenditure Budget 320,526$ 10,172$ 3,246$ 99,020$ 130,948$ 563,912$
Held for Reserves 5,000$ 5,000$
Total with Held for Reserves Amount 325,526$ 10,172$ 3,246$ 99,020$ 130,948$ 568,912$
Fiscal Year 2016-‐17 Expenditure Budget
Master Page # 26 of 53 - Finance and Administration Meeting 6/8/2016________________________________________________________________________________
Appendix I – Operating Budget Supplemental Information
Finance and Administration Committee
June 8, 2016
Master Page # 27 of 53 - Finance and Administration Meeting 6/8/2016________________________________________________________________________________

Portland State UniversitySummary of Operating BudgetFiscal Year 2016‐17Dollars in 000's
FY15 Actual FY16 Budget FY17 Budget Dollars Percent
Revenue Student Tuition and Fees 205,314$ 212,422$ 215,612$ 3,190$ 2%Government Resources & Allocations 67,994 77,578 88,797 11,219 14%Gifts Grants and Contracts 10,626 11,326 12,366 1,040 9%Investment/Debt/Debt Service 2,782 2,180 2,180 ‐ 0%Internal Sales 5,167 5,252 4,869 (383) ‐7%Other Revenue 1,861 1,626 1,703 77 5%
Total Revenue 293,743$ 310,383$ 325,526$ 15,143$ 5%
Expense Salaries & Wages 149,441 161,118 173,209 12,091 8%OPE (fringes) 69,825 80,046 82,796 2,751 3%Service & Supplies (net of transfers) 58,304 63,610 64,521 911 1%
Total Expense 277,570$ 304,773$ 320,526$ 15,753$ 5%
Net (held for reserves/initiatives) 16,173$ 5,610$ 5,000$ (610)$
Education and General (E&G) ‐ Portland State University (Recurring Only)Change from FY16 to FY17 Budget
70% 68% 66%
23%25%
27%4%
4%
4%1%
1%1%
1%1%
$‐
$50,000
$100,000
$150,000
$200,000
$250,000
$300,000
$350,000
FY15 Actual FY16 Budget FY17 Budget
Education and General ‐ Revenues
Other Revenue
Investment/Debt/Debt Service
Gifts Grants and Contracts
Government Resources & Allocations
Student Tuition and Fees
54% 53% 54%
25%26%
26%
21%
21%20%
‐
50,000
100,000
150,000
200,000
250,000
300,000
350,000
FY15 Actual FY16 Budget FY17 Budget
Education and General ‐ Expenses
Service & Supplies (net of transfers)
OPE (fringes)
Salaries & Wages
Appendix I 1
Master Page # 28 of 53 - Finance and Administration Meeting 6/8/2016________________________________________________________________________________
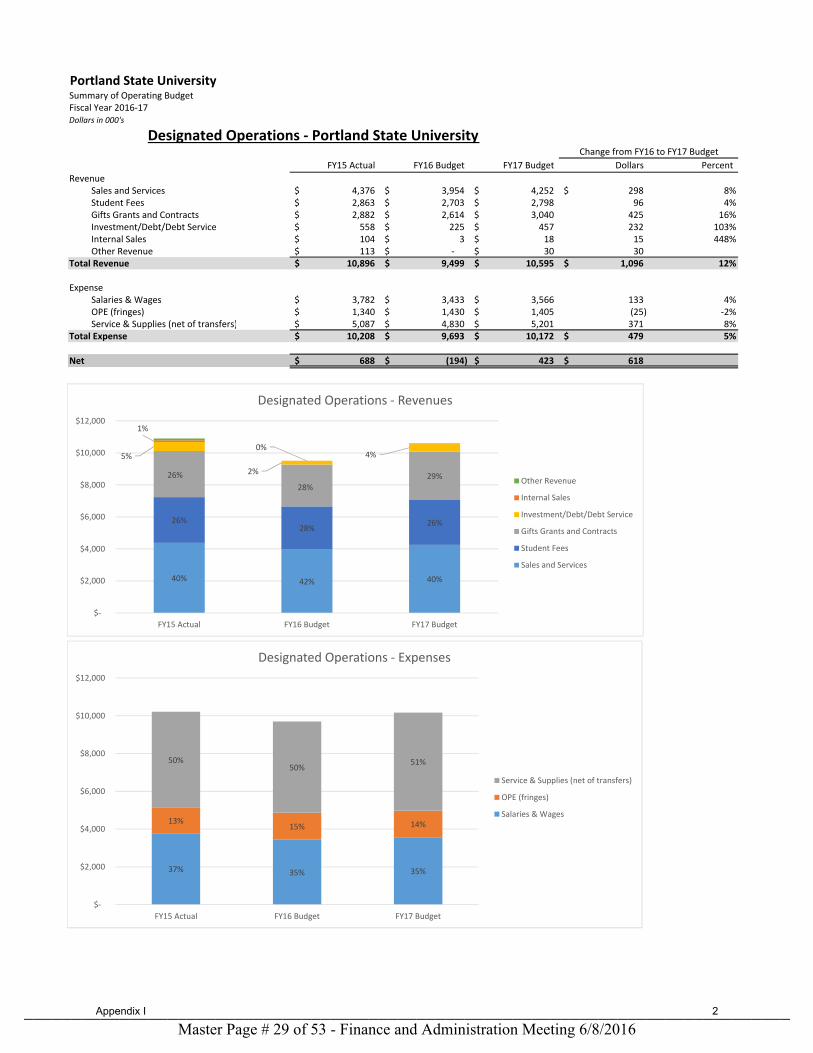
Portland State UniversitySummary of Operating BudgetFiscal Year 2016‐17Dollars in 000's
FY15 Actual FY16 Budget FY17 Budget Dollars Percent
Revenue Sales and Services 4,376$ 3,954$ 4,252$ 298$ 8%Student Fees 2,863$ 2,703$ 2,798$ 96 4%Gifts Grants and Contracts 2,882$ 2,614$ 3,040$ 425 16%Investment/Debt/Debt Service 558$ 225$ 457$ 232 103%Internal Sales 104$ 3$ 18$ 15 448%Other Revenue 113$ ‐$ 30$ 30
Total Revenue 10,896$ 9,499$ 10,595$ 1,096$ 12%
Expense Salaries & Wages 3,782$ 3,433$ 3,566$ 133 4%OPE (fringes) 1,340$ 1,430$ 1,405$ (25) ‐2%Service & Supplies (net of transfers) 5,087$ 4,830$ 5,201$ 371 8%
Total Expense 10,208$ 9,693$ 10,172$ 479$ 5%
Net 688$ (194)$ 423$ 618$
Designated Operations ‐ Portland State UniversityChange from FY16 to FY17 Budget
40% 42% 40%
26%28%
26%
26%
28%29%
5%
2%
4%
1%
0%
$‐
$2,000
$4,000
$6,000
$8,000
$10,000
$12,000
FY15 Actual FY16 Budget FY17 Budget
Designated Operations ‐ Revenues
Other Revenue
Internal Sales
Investment/Debt/Debt Service
Gifts Grants and Contracts
Student Fees
Sales and Services
37% 35% 35%
13%15% 14%
50%50%
51%
$‐
$2,000
$4,000
$6,000
$8,000
$10,000
$12,000
FY15 Actual FY16 Budget FY17 Budget
Designated Operations ‐ Expenses
Service & Supplies (net of transfers)
OPE (fringes)
Salaries & Wages
Appendix I 2
Master Page # 29 of 53 - Finance and Administration Meeting 6/8/2016________________________________________________________________________________

Portland State UniversitySummary of Operating BudgetFiscal Year 2016‐17Dollars in 000's
FY15 Actual FY16 Budget FY17 Budget Dollars Percent
Revenue Internal Sales 2,661$ 2,761$ 2,971$ 211$ 8%Sales and Services 1,054 1,152 1,115 (37) ‐3%
Total Revenue 3,715$ 3,912$ 4,086$ 174$ 4%
Expense Salaries & Wages 1,066 1,336 1,495 159 12%OPE (fringes) 421 564 633 69 12%Service & Supplies (net of transfers) 2,119 2,258 1,118 (1,140) ‐50%
Total Expense 3,606$ 4,158$ 3,246$ (912)$ ‐22%
Net 109$ (246)$ 840$ 1,086$
Service Centers ‐ Portland State UniversityChange from FY16 to FY17 Budget
72% 71% 73%
28%29%
27%
$‐
$500
$1,000
$1,500
$2,000
$2,500
$3,000
$3,500
$4,000
$4,500
FY15 Actual FY16 Budget FY17 Budget
Service Centers ‐ Revenues
Sales and Services
Internal Sales
30%32% 46%
12%
14%20%
58%
54%
34%
‐
500
1,000
1,500
2,000
2,500
3,000
3,500
4,000
4,500
FY15 Actual FY16 Budget FY17 Budget
Service Centers ‐ Expenses
Service & Supplies (net of transfers)
OPE (fringes)
Salaries & Wages
Appendix I 3
Master Page # 30 of 53 - Finance and Administration Meeting 6/8/2016________________________________________________________________________________

Portland State UniversitySummary of Operating BudgetFiscal Year 2016‐17Dollars in 000's
FY15 Actual FY16 Budget FY17 Budget Dollars Percent
Revenue Student Fees 41,582$ 47,550$ 40,847$ (6,703)$ ‐14%Sales and Services 43,506 41,913 44,786 2,873 7%Internal Sales 6,737 7,075 6,015 (1,060) ‐15%Government Resources & Allocations 973 973 1,002 29 3%Investment/Debt/Debt Service 188 150 150 0 0%Other Revenue 4,495 2,300 1,032 (1,268) ‐55%
Total Revenue 97,481$ 99,960$ 93,832$ (6,128)$ ‐6%
Expense Salaries & Wages 18,267 18,569 19,022 453 2%OPE (fringes) 8,092 9,003 8,749 (254) ‐3%Service & Supplies (net of transfers) 78,214 80,173 71,250 (8,924) ‐11%
Total Expense 104,573$ 107,745$ 99,020$ (8,725)$ ‐8%
Net (7,092)$ (7,785)$ (5,188)$ 2,597$
Auxiliary Enterprises ‐ Portland State UniversityChange from FY16 to FY17 Budget
43%48%
44%
45%42%
48%
7%7%
6%1%
1%1%
4%2% 1%
$‐
$20,000
$40,000
$60,000
$80,000
$100,000
$120,000
FY15 Actual FY16 Budget FY17 Budget
Auxiliary Enterprises ‐ Revenues
Other Revenue
Investment/Debt/Debt Service
Government Resources & Allocations
Internal Sales
Sales and Services
Student Fees
17% 17% 19%
8% 8% 9%
75% 75%72%
0
20,000
40,000
60,000
80,000
100,000
120,000
FY15 Actual FY16 Budget FY17 Budget
Auxiliary Enterprises ‐ Expenses
Service & Supplies (net of transfers)
OPE (fringes)
Salaries & Wages
Appendix I 4
Master Page # 31 of 53 - Finance and Administration Meeting 6/8/2016________________________________________________________________________________

Portland State UniversitySummary of Operating BudgetFiscal Year 2016‐17Dollars in 000's
FY15 Actual FY16 Budget FY17 Budget Dollars Percent
Revenue Gifts Grants and Contracts 127,356$ 120,789$ 130,731$ 9,942$ 8%Government Resources & Allocations 710 ‐ 137 137 Investment/Debt/Debt Service 105 ‐ 80 80
Total Revenue $128,171 $120,789 $130,948 $10,159 8%
Expense Salaries & Wages 28,140 14,223 29,037 14,814 104%OPE (fringes) 11,577 6,842 11,967 5,125 75%Service & Supplies (net of transfers) 88,084 99,724 89,943 (9,781) ‐10%
Total Expense 127,801$ 120,789$ 130,948$ 10,159$ 8%
Net 370$ ‐$ 0$ 0$
Restricted Funds ‐ Portland State UniversityChange from FY16 to FY17 Budget
99%100%
100%
$‐
$20,000
$40,000
$60,000
$80,000
$100,000
$120,000
$140,000
FY15 Actual FY16 Budget FY17 Budget
Restricted Funds ‐ Revenues
Investment/Debt/Debt Service
Government Resources & Allocations
Gifts Grants and Contracts
22%12%
22%
9%
6%
9%
69%
82%
69%
‐
20,000
40,000
60,000
80,000
100,000
120,000
140,000
FY15 Actual FY16 Budget FY17 Budget
Restricted Funds ‐ Expenses
Service & Supplies (net of transfers)
OPE (fringes)
Salaries & Wages
Appendix I 5
Master Page # 32 of 53 - Finance and Administration Meeting 6/8/2016________________________________________________________________________________
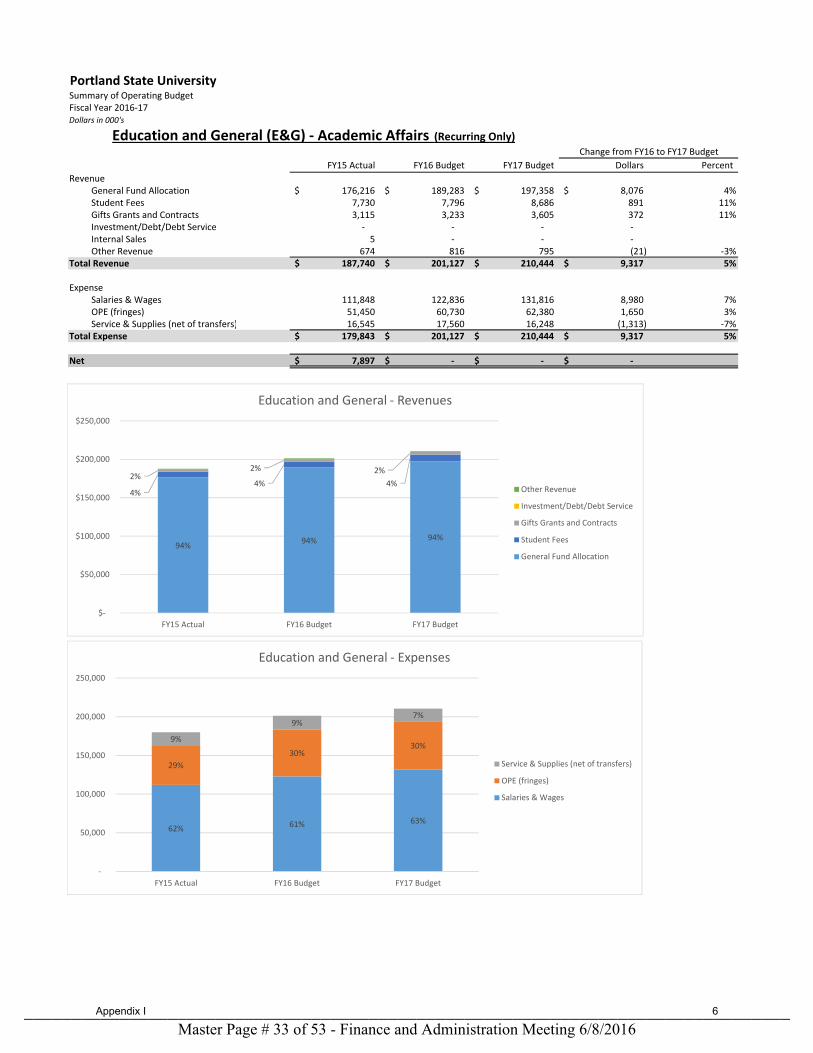
Portland State UniversitySummary of Operating BudgetFiscal Year 2016‐17Dollars in 000's
FY15 Actual FY16 Budget FY17 Budget Dollars Percent
Revenue General Fund Allocation 176,216$ 189,283$ 197,358$ 8,076$ 4%Student Fees 7,730 7,796 8,686 891 11%Gifts Grants and Contracts 3,115 3,233 3,605 372 11%Investment/Debt/Debt Service ‐ ‐ ‐ ‐ Internal Sales 5 ‐ ‐ ‐ Other Revenue 674 816 795 (21) ‐3%
Total Revenue 187,740$ 201,127$ 210,444$ 9,317$ 5%
Expense Salaries & Wages 111,848 122,836 131,816 8,980 7%OPE (fringes) 51,450 60,730 62,380 1,650 3%Service & Supplies (net of transfers) 16,545 17,560 16,248 (1,313) ‐7%
Total Expense 179,843$ 201,127$ 210,444$ 9,317$ 5%
Net 7,897$ ‐$ ‐$ ‐$
Education and General (E&G) ‐ Academic Affairs (Recurring Only)Change from FY16 to FY17 Budget
94%94% 94%
4%4% 4%
2%2% 2%
$‐
$50,000
$100,000
$150,000
$200,000
$250,000
FY15 Actual FY16 Budget FY17 Budget
Education and General ‐ Revenues
Other Revenue
Investment/Debt/Debt Service
Gifts Grants and Contracts
Student Fees
General Fund Allocation
62% 61% 63%
29%
30%30%
9%
9%7%
‐
50,000
100,000
150,000
200,000
250,000
FY15 Actual FY16 Budget FY17 Budget
Education and General ‐ Expenses
Service & Supplies (net of transfers)
OPE (fringes)
Salaries & Wages
Appendix I 6
Master Page # 33 of 53 - Finance and Administration Meeting 6/8/2016________________________________________________________________________________
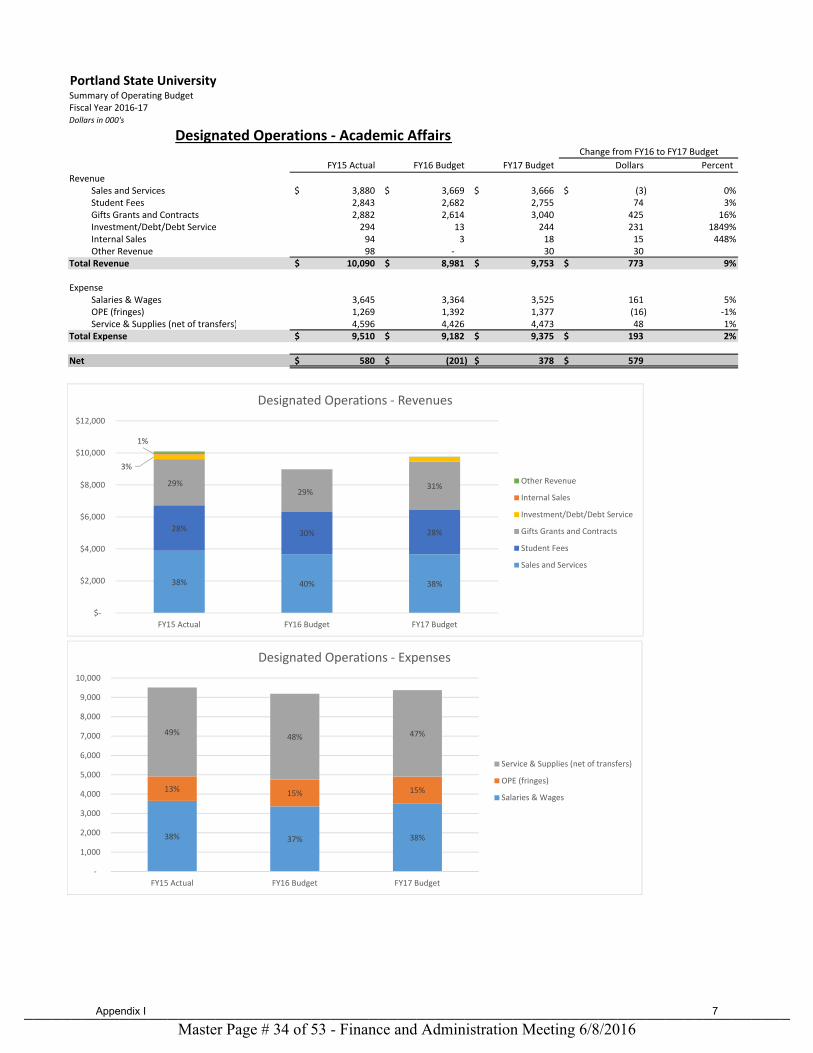
Portland State UniversitySummary of Operating BudgetFiscal Year 2016‐17Dollars in 000's
FY15 Actual FY16 Budget FY17 Budget Dollars Percent
Revenue Sales and Services 3,880$ 3,669$ 3,666$ (3)$ 0%Student Fees 2,843 2,682 2,755 74 3%Gifts Grants and Contracts 2,882 2,614 3,040 425 16%Investment/Debt/Debt Service 294 13 244 231 1849%Internal Sales 94 3 18 15 448%Other Revenue 98 ‐ 30 30
Total Revenue 10,090$ 8,981$ 9,753$ 773$ 9%
Expense Salaries & Wages 3,645 3,364 3,525 161 5%OPE (fringes) 1,269 1,392 1,377 (16) ‐1%Service & Supplies (net of transfers) 4,596 4,426 4,473 48 1%
Total Expense 9,510$ 9,182$ 9,375$ 193$ 2%
Net 580$ (201)$ 378$ 579$
Designated Operations ‐ Academic AffairsChange from FY16 to FY17 Budget
38% 40% 38%
28%30% 28%
29%29%
31%
3%
1%
$‐
$2,000
$4,000
$6,000
$8,000
$10,000
$12,000
FY15 Actual FY16 Budget FY17 Budget
Designated Operations ‐ Revenues
Other Revenue
Internal Sales
Investment/Debt/Debt Service
Gifts Grants and Contracts
Student Fees
Sales and Services
38% 37% 38%
13% 15% 15%
49%48% 47%
‐
1,000
2,000
3,000
4,000
5,000
6,000
7,000
8,000
9,000
10,000
FY15 Actual FY16 Budget FY17 Budget
Designated Operations ‐ Expenses
Service & Supplies (net of transfers)
OPE (fringes)
Salaries & Wages
Appendix I 7
Master Page # 34 of 53 - Finance and Administration Meeting 6/8/2016________________________________________________________________________________

Portland State UniversitySummary of Operating BudgetFiscal Year 2016‐17Dollars in 000's
FY15 Actual FY16 Budget FY17 Budget Dollars Percent
Revenue Internal Sales 147$ 170$ 215$ 45$ 26%Sales and Services 95 8 22 15 192%
Total Revenue 242$ 178$ 237$ 60$ 33%
Expense Salaries & Wages 8 10 10 ‐ 0%OPE (fringes) 4 2 2 (0) ‐11%Service & Supplies (net of transfers) 181 180 214 35 19%
Total Expense 193$ 192$ 226$ 34$ 18%
Net 49$ (14)$ 11$ 25$
Service Centers ‐ Academic AffairsChange from FY16 to FY17 Budget
61%96%
91%
39%
4%
9%
$‐
$50
$100
$150
$200
$250
$300
FY15 Actual FY16 Budget FY17 Budget
Service Centers ‐ Revenues
Sales and Services
Internal Sales
4% 5% 4%
2% 1% 1%
94% 94%
95%
‐
50
100
150
200
250
FY15 Actual FY16 Budget FY17 Budget
Service Centers‐ Expenses
Service & Supplies (net of transfers)
OPE (fringes)
Salaries & Wages
Appendix I 8
Master Page # 35 of 53 - Finance and Administration Meeting 6/8/2016________________________________________________________________________________
Portland State UniversitySummary of Operating BudgetFiscal Year 2016‐17Dollars in 000's
FY15 Actual FY16 Budget FY17 Budget Dollars Percent
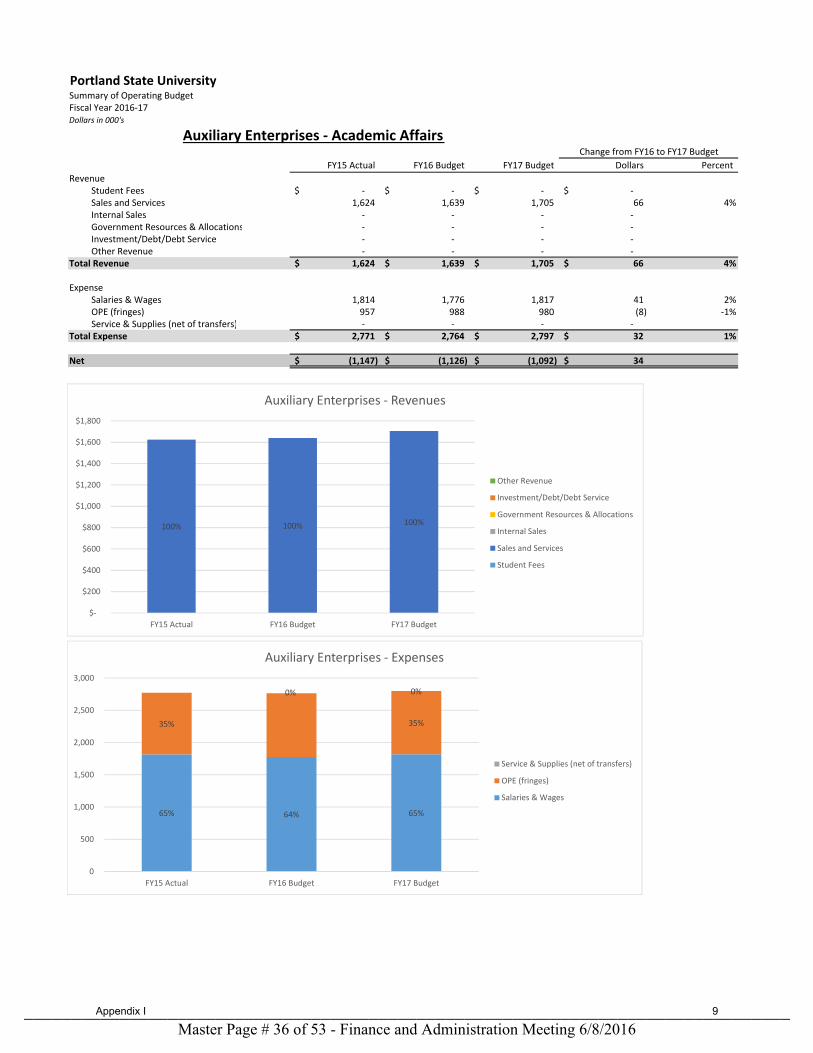
Revenue Student Fees ‐$ ‐$ ‐$ ‐$ Sales and Services 1,624 1,639 1,705 66 4%Internal Sales ‐ ‐ ‐ ‐ Government Resources & Allocations ‐ ‐ ‐ ‐ Investment/Debt/Debt Service ‐ ‐ ‐ ‐ Other Revenue ‐ ‐ ‐ ‐
Total Revenue 1,624$ 1,639$ 1,705$ 66$ 4%
Expense Salaries & Wages 1,814 1,776 1,817 41 2%OPE (fringes) 957 988 980 (8) ‐1%Service & Supplies (net of transfers) ‐ ‐ ‐ ‐
Total Expense 2,771$ 2,764$ 2,797$ 32$ 1%
Net (1,147)$ (1,126)$ (1,092)$ 34$
Auxiliary Enterprises ‐ Academic AffairsChange from FY16 to FY17 Budget
100% 100% 100%
$‐
$200
$400
$600
$800
$1,000
$1,200
$1,400
$1,600
$1,800
FY15 Actual FY16 Budget FY17 Budget
Auxiliary Enterprises ‐ Revenues
Other Revenue
Investment/Debt/Debt Service
Government Resources & Allocations
Internal Sales
Sales and Services
Student Fees
65% 64% 65%
35% 35%
0% 0%
0
500
1,000
1,500
2,000
2,500
3,000
FY15 Actual FY16 Budget FY17 Budget
Auxiliary Enterprises ‐ Expenses
Service & Supplies (net of transfers)
OPE (fringes)
Salaries & Wages
Appendix I 9
Master Page # 36 of 53 - Finance and Administration Meeting 6/8/2016________________________________________________________________________________
Portland State UniversitySummary of Operating BudgetFiscal Year 2016‐17Dollars in 000's
FY15 Actual FY16 Budget FY17 Budget Dollars Percent
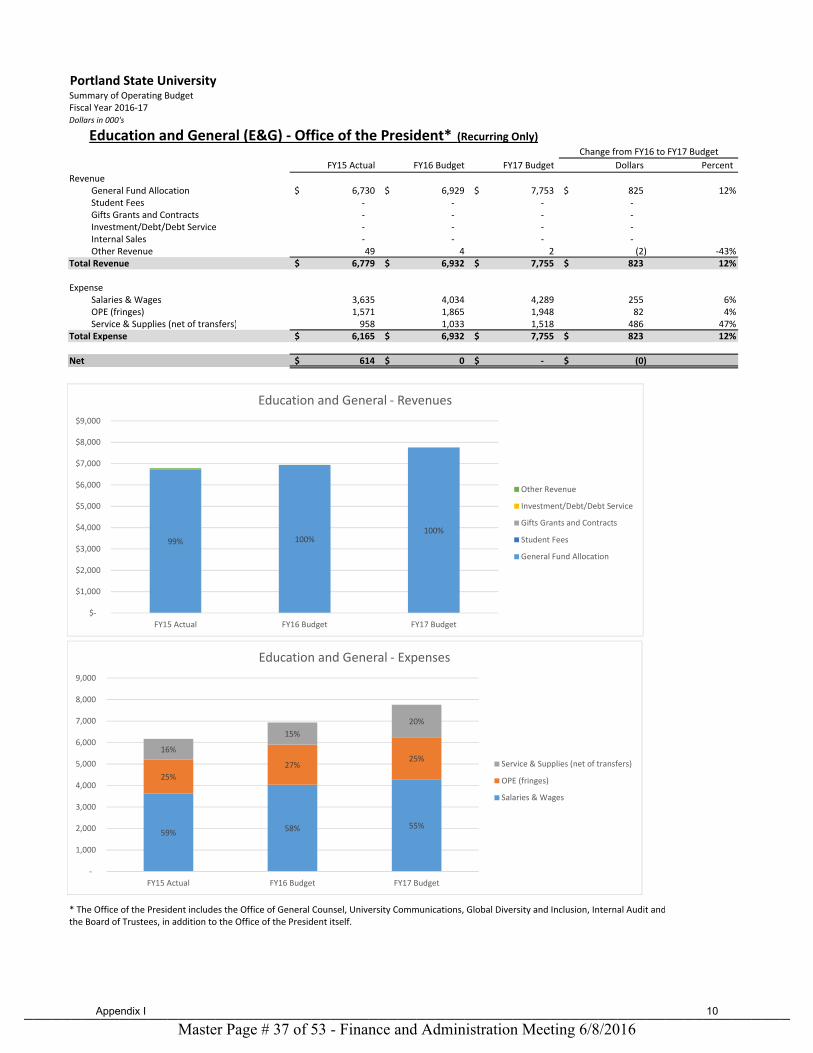
Revenue General Fund Allocation 6,730$ 6,929$ 7,753$ 825$ 12%Student Fees ‐ ‐ ‐ ‐ Gifts Grants and Contracts ‐ ‐ ‐ ‐ Investment/Debt/Debt Service ‐ ‐ ‐ ‐ Internal Sales ‐ ‐ ‐ ‐ Other Revenue 49 4 2 (2) ‐43%
Total Revenue 6,779$ 6,932$ 7,755$ 823$ 12%
Expense Salaries & Wages 3,635 4,034 4,289 255 6%OPE (fringes) 1,571 1,865 1,948 82 4%Service & Supplies (net of transfers) 958 1,033 1,518 486 47%
Total Expense 6,165$ 6,932$ 7,755$ 823$ 12%
Net 614$ 0$ ‐$ (0)$
* The Office of the President includes the Office of General Counsel, University Communications, Global Diversity and Inclusion, Internal Audit andthe Board of Trustees, in addition to the Office of the President itself.
Education and General (E&G) ‐ Office of the President* (Recurring Only)Change from FY16 to FY17 Budget
99% 100%100%
$‐
$1,000
$2,000
$3,000
$4,000
$5,000
$6,000
$7,000
$8,000
$9,000
FY15 Actual FY16 Budget FY17 Budget
Education and General ‐ Revenues
Other Revenue
Investment/Debt/Debt Service
Gifts Grants and Contracts
Student Fees
General Fund Allocation
59% 58% 55%
25%
27%25%
16%
15%
20%
‐
1,000
2,000
3,000
4,000
5,000
6,000
7,000
8,000
9,000
FY15 Actual FY16 Budget FY17 Budget
Education and General ‐ Expenses
Service & Supplies (net of transfers)
OPE (fringes)
Salaries & Wages
Appendix I 10
Master Page # 37 of 53 - Finance and Administration Meeting 6/8/2016________________________________________________________________________________

Portland State UniversitySummary of Operating BudgetFiscal Year 2016‐17Dollars in 000's
FY15 Actual FY16 Budget FY17 Budget Dollars Percent
Revenue Sales and Services ‐$ ‐$ ‐$ ‐$ Student Fees ‐ ‐ ‐ ‐ Gifts Grants and Contracts ‐ ‐ ‐ ‐ Investment/Debt/Debt Service 15 8 8 ‐ 0%Internal Sales ‐ ‐ ‐ ‐ Other Revenue ‐ ‐ ‐ ‐
Total Revenue 15$ 8$ 8$ ‐$ 0%
Expense Salaries & Wages ‐ ‐ ‐ ‐ OPE (fringes) ‐ ‐ ‐ ‐ Service & Supplies (net of transfers) 26 ‐ ‐ ‐
Total Expense 26$ ‐$ ‐$ ‐$
Net (11)$ 8$ 8$ ‐$
* The Office of the President includes the Office of General Counsel, University Communications, Global Diversity and Inclusion, Internal Audit andthe Board of Trustees, in addition to the Office of the President itself.
Designated Operations ‐ Office of the President*Change from FY16 to FY17 Budget
100%
100% 100%
$‐
$2
$4
$6
$8
$10
$12
$14
$16
FY15 Actual FY16 Budget FY17 Budget
Designated Operations ‐ Revenues
Other Revenue
Internal Sales
Investment/Debt/Debt Service
Gifts Grants and Contracts
Student Fees
Sales and Services
100%
‐
5
10
15
20
25
30
FY15 Actual FY16 Budget FY17 Budget
Designated Operations ‐ Expenses
Service & Supplies (net of transfers)
OPE (fringes)
Salaries & Wages
Appendix I 11
Master Page # 38 of 53 - Finance and Administration Meeting 6/8/2016________________________________________________________________________________

Portland State UniversitySummary of Operating BudgetFiscal Year 2016‐17Dollars in 000's
FY15 Actual FY16 Budget FY17 Budget Dollars Percent
Revenue General Fund Allocation 5,910$ 6,693$ 6,714$ 21$ 0%Student Fees ‐ ‐ ‐ ‐ Gifts Grants and Contracts ‐ ‐ ‐ ‐ Investment/Debt/Debt Service ‐ ‐ ‐ ‐ Internal Sales ‐ ‐ ‐ ‐ Other Revenue ‐ ‐ ‐ ‐
Total Revenue 5,910$ 6,693$ 6,714$ 21$ 0%
Expense Salaries & Wages ‐ ‐ ‐ ‐ OPE (fringes) ‐ ‐ ‐ ‐ Service & Supplies (net of transfers) 5,910 6,693 6,714 21 0%
Total Expense 5,910$ 6,693$ 6,714$ 21$ 0%
Net 0$ ‐$ ‐$ ‐$
Education and General (E&G) ‐ PSU Foundation (Recurring Only)Change from FY16 to FY17 Budget
100%100% 100%
$‐
$1,000
$2,000
$3,000
$4,000
$5,000
$6,000
$7,000
$8,000
FY15 Actual FY16 Budget FY17 Budget
Education and General ‐ Revenues
Other Revenue
Investment/Debt/Debt Service
Gifts Grants and Contracts
Student Fees
General Fund Allocation
0% 0% 0%0% 0% 0%
100%100% 100%
‐
1,000
2,000
3,000
4,000
5,000
6,000
7,000
8,000
FY15 Actual FY16 Budget FY17 Budget
Education and General ‐ Expenses
Service & Supplies (net of transfers)
OPE (fringes)
Salaries & Wages
Appendix I 12
Master Page # 39 of 53 - Finance and Administration Meeting 6/8/2016________________________________________________________________________________
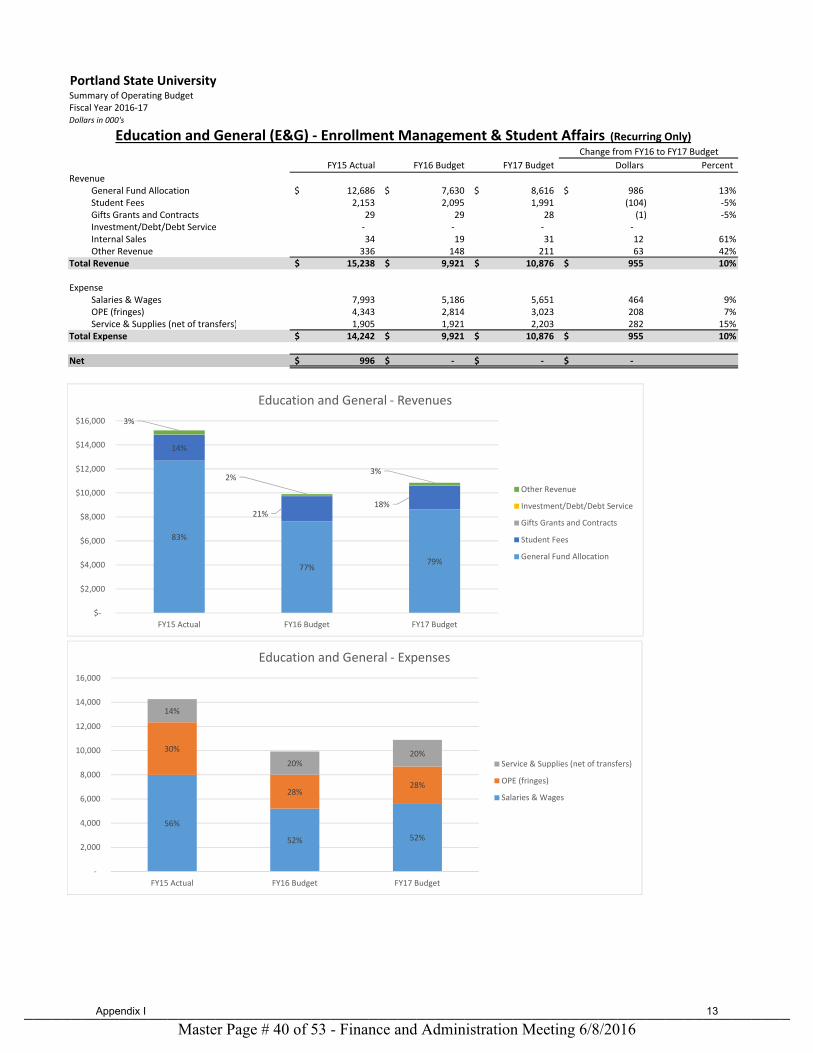
Portland State UniversitySummary of Operating BudgetFiscal Year 2016‐17Dollars in 000's
FY15 Actual FY16 Budget FY17 Budget Dollars Percent
Revenue General Fund Allocation 12,686$ 7,630$ 8,616$ 986$ 13%Student Fees 2,153 2,095 1,991 (104) ‐5%Gifts Grants and Contracts 29 29 28 (1) ‐5%Investment/Debt/Debt Service ‐ ‐ ‐ ‐ Internal Sales 34 19 31 12 61%Other Revenue 336 148 211 63 42%
Total Revenue 15,238$ 9,921$ 10,876$ 955$ 10%
Expense Salaries & Wages 7,993 5,186 5,651 464 9%OPE (fringes) 4,343 2,814 3,023 208 7%Service & Supplies (net of transfers) 1,905 1,921 2,203 282 15%
Total Expense 14,242$ 9,921$ 10,876$ 955$ 10%
Net 996$ ‐$ ‐$ ‐$
Change from FY16 to FY17 Budget
Education and General (E&G) ‐ Enrollment Management & Student Affairs (Recurring Only)
83%
77%79%
14%
21%18%
3%
2%3%
$‐
$2,000
$4,000
$6,000
$8,000
$10,000
$12,000
$14,000
$16,000
FY15 Actual FY16 Budget FY17 Budget
Education and General ‐ Revenues
Other Revenue
Investment/Debt/Debt Service
Gifts Grants and Contracts
Student Fees
General Fund Allocation
56%
52% 52%
30%
28%28%
14%
20%20%
‐
2,000
4,000
6,000
8,000
10,000
12,000
14,000
16,000
FY15 Actual FY16 Budget FY17 Budget
Education and General ‐ Expenses
Service & Supplies (net of transfers)
OPE (fringes)
Salaries & Wages
Appendix I 13
Master Page # 40 of 53 - Finance and Administration Meeting 6/8/2016________________________________________________________________________________
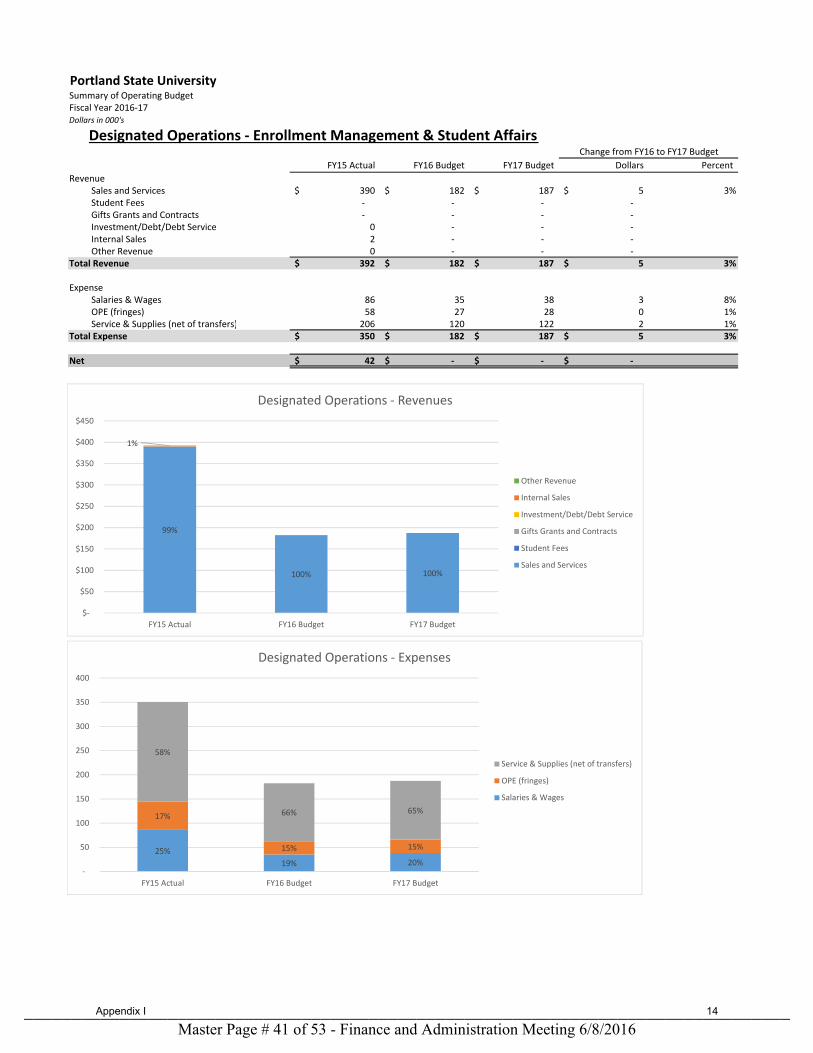
Portland State UniversitySummary of Operating BudgetFiscal Year 2016‐17Dollars in 000's
FY15 Actual FY16 Budget FY17 Budget Dollars Percent
Revenue Sales and Services 390$ 182$ 187$ 5$ 3%Student Fees ‐ ‐ ‐ ‐ Gifts Grants and Contracts ‐ ‐ ‐ ‐ Investment/Debt/Debt Service 0 ‐ ‐ ‐ Internal Sales 2 ‐ ‐ ‐ Other Revenue 0 ‐ ‐ ‐
Total Revenue 392$ 182$ 187$ 5$ 3%
Expense Salaries & Wages 86 35 38 3 8%OPE (fringes) 58 27 28 0 1%Service & Supplies (net of transfers) 206 120 122 2 1%
Total Expense 350$ 182$ 187$ 5$ 3%
Net 42$ ‐$ ‐$ ‐$
Designated Operations ‐ Enrollment Management & Student AffairsChange from FY16 to FY17 Budget
99%
100% 100%
1%
$‐
$50
$100
$150
$200
$250
$300
$350
$400
$450
FY15 Actual FY16 Budget FY17 Budget
Designated Operations ‐ Revenues
Other Revenue
Internal Sales
Investment/Debt/Debt Service
Gifts Grants and Contracts
Student Fees
Sales and Services
25%
19% 20%
17%
15% 15%
58%
66% 65%
‐
50
100
150
200
250
300
350
400
FY15 Actual FY16 Budget FY17 Budget
Designated Operations ‐ Expenses
Service & Supplies (net of transfers)
OPE (fringes)
Salaries & Wages
Appendix I 14
Master Page # 41 of 53 - Finance and Administration Meeting 6/8/2016________________________________________________________________________________

Portland State UniversitySummary of Operating BudgetFiscal Year 2016‐17Dollars in 000's
FY15 Actual FY16 Budget FY17 Budget Dollars Percent
Revenue Student Fees 26,212$ 32,910$ 25,979$ (6,931)$ ‐21%Sales and Services 21,880 20,196 21,706 1,511 7%Internal Sales 1,832 1,698 1,475 (223) ‐13%Government Resources & Allocations ‐ ‐ ‐ ‐ Investment/Debt/Debt Service 41 30 35 5 17%Other Revenue 3,922 1,859 137 (1,722) ‐93%
Total Revenue 53,887$ 56,692$ 49,332$ (7,360)$ ‐13%
Expense Salaries & Wages 11,376 11,924 12,437 513 4%OPE (fringes) 4,869 5,492 5,428 (65) ‐1%Service & Supplies (net of transfers) 37,001 40,805 31,165 (9,640) ‐24%
Total Expense 53,246$ 58,222$ 49,030$ (9,192)$ ‐16%
Net 641$ (1,529)$ 302$ 1,831$
Auxiliary Enterprises ‐ Enrollment Management & Student AffairsChange from FY16 to FY17 Budget
49%58%
53%
41%
36%
44%
3%
3%
3%
7% 3%
0%
$‐
$10,000
$20,000
$30,000
$40,000
$50,000
$60,000
FY15 Actual FY16 Budget FY17 Budget
Auxiliary Enterprises ‐ Revenues
Other Revenue
Investment/Debt/Debt Service
Government Resources & Allocations
Internal Sales
Sales and Services
Student Fees
21% 20% 25%
9% 9% 11%
70%71%
64%
0
10,000
20,000
30,000
40,000
50,000
60,000
70,000
FY15 Actual FY16 Budget FY17 Budget
Auxiliary Enterprises ‐ Expenses
Service & Supplies (net of transfers)
OPE (fringes)
Salaries & Wages
Appendix I 15
Master Page # 42 of 53 - Finance and Administration Meeting 6/8/2016________________________________________________________________________________

Portland State UniversitySummary of Operating BudgetFiscal Year 2016‐17Dollars in 000's
FY15 Actual FY16 Budget FY17 Budget Dollars Percent
Revenue General Fund Allocation 1,951$ 2,026$ 2,201$ 175$ 9%Student Fees ‐ ‐ ‐ ‐ Gifts Grants and Contracts 5,133 5,570 5,951 381 7%Investment/Debt/Debt Service ‐ ‐ ‐ ‐ Internal Sales ‐ ‐ ‐ ‐ Other Revenue ‐ ‐ ‐ ‐
Total Revenue 7,084$ 7,596$ 8,152$ 556$ 7%
Expense Salaries & Wages 3,783 3,902 4,575 673 17%OPE (fringes) 2,006 2,337 2,633 296 13%Service & Supplies (net of transfers) 981 1,357 944 (413) ‐30%
Total Expense 6,769$ 7,596$ 8,152$ 556$ 7%
Net 315$ ‐$ ‐$ ‐$
Change from FY16 to FY17 Budget
Education and General (E&G) ‐ Research and Strategic Partnerships (Recurring Only)
28% 27% 27%
72%73%
73%
$‐
$1,000
$2,000
$3,000
$4,000
$5,000
$6,000
$7,000
$8,000
$9,000
FY15 Actual FY16 Budget FY17 Budget
Education and General ‐ Revenues
Other Revenue
Investment/Debt/Debt Service
Gifts Grants and Contracts
Student Fees
General Fund Allocation
56% 51%56%
30%31%
32%14%
18%
12%
‐
1,000
2,000
3,000
4,000
5,000
6,000
7,000
8,000
9,000
FY15 Actual FY16 Budget FY17 Budget
Education and General ‐ Expenses
Service & Supplies (net of transfers)
OPE (fringes)
Salaries & Wages
Appendix I 16
Master Page # 43 of 53 - Finance and Administration Meeting 6/8/2016________________________________________________________________________________
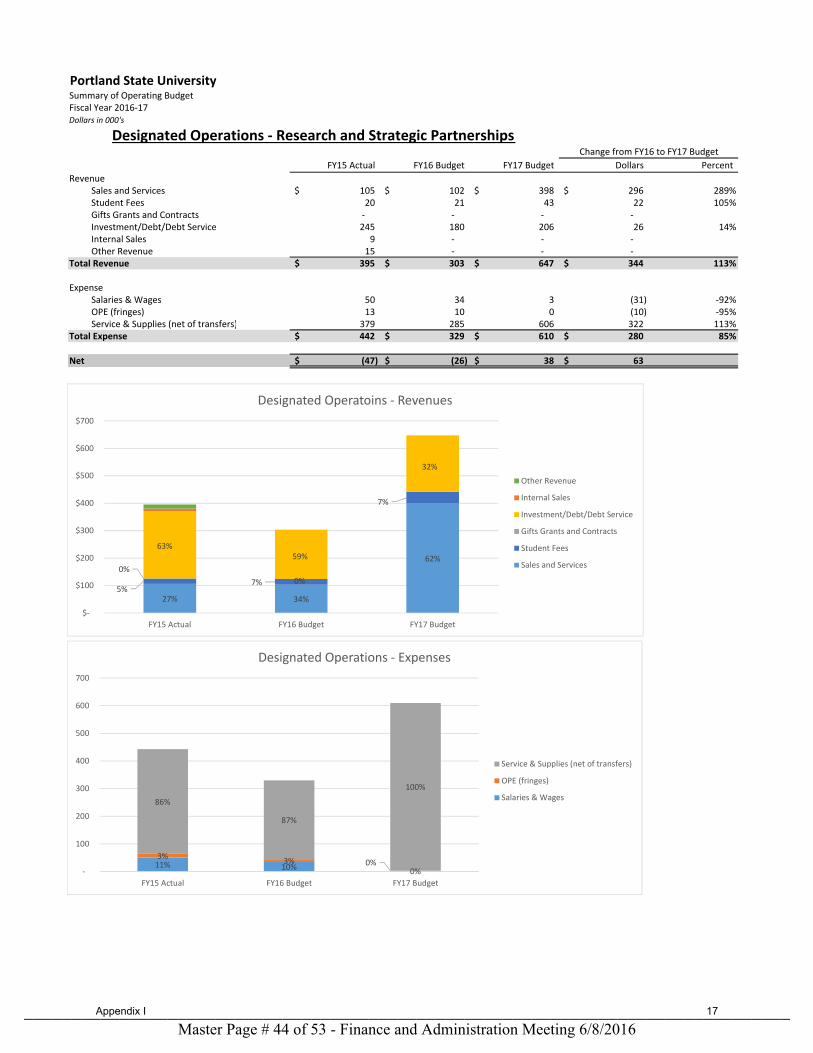
Portland State UniversitySummary of Operating BudgetFiscal Year 2016‐17Dollars in 000's
FY15 Actual FY16 Budget FY17 Budget Dollars Percent
Revenue Sales and Services 105$ 102$ 398$ 296$ 289%Student Fees 20 21 43 22 105%Gifts Grants and Contracts ‐ ‐ ‐ ‐ Investment/Debt/Debt Service 245 180 206 26 14%Internal Sales 9 ‐ ‐ ‐ Other Revenue 15 ‐ ‐ ‐
Total Revenue 395$ 303$ 647$ 344$ 113%
Expense Salaries & Wages 50 34 3 (31) ‐92%OPE (fringes) 13 10 0 (10) ‐95%Service & Supplies (net of transfers) 379 285 606 322 113%
Total Expense 442$ 329$ 610$ 280$ 85%
Net (47)$ (26)$ 38$ 63$
Designated Operations ‐ Research and Strategic PartnershipsChange from FY16 to FY17 Budget
27% 34%
62%
5%7%
7%
0%
0%
63%59%
32%
$‐
$100
$200
$300
$400
$500
$600
$700
FY15 Actual FY16 Budget FY17 Budget
Designated Operatoins ‐ Revenues
Other Revenue
Internal Sales
Investment/Debt/Debt Service
Gifts Grants and Contracts
Student Fees
Sales and Services
11% 10% 0%
3%3% 0%
86%
87%
100%
‐
100
200
300
400
500
600
700
FY15 Actual FY16 Budget FY17 Budget
Designated Operations ‐ Expenses
Service & Supplies (net of transfers)
OPE (fringes)
Salaries & Wages
Appendix I 17
Master Page # 44 of 53 - Finance and Administration Meeting 6/8/2016________________________________________________________________________________

Portland State UniversitySummary of Operating BudgetFiscal Year 2016‐17Dollars in 000's
FY15 Actual FY16 Budget FY17 Budget Dollars Percent
Revenue Internal Sales 299$ 528$ 470$ (58)$ ‐11%Sales and Services 634 662 833 170 26%
Total Revenue 933$ 1,190$ 1,303$ 112$ 9%
Expense Salaries & Wages 485 515 583 67 13%OPE (fringes) 226 219 244 26 12%Service & Supplies (net of transfers) 452 463 461 (2) 0%
Total Expense 1,163$ 1,197$ 1,288$ 91$ 8%
Net (230)$ (6)$ 15$ 21$
Service Centers ‐ Research and Strategic PartnershipsChange from FY16 to FY17 Budget
32%
44% 36%
68%
56% 64%
$‐
$200
$400
$600
$800
$1,000
$1,200
$1,400
FY15 Actual FY16 Budget FY17 Budget
Service Centers ‐ Revenues
Sales and Services
Internal Sales
42% 43%45%
19% 18%19%
39% 39%
36%
‐
200
400
600
800
1,000
1,200
1,400
FY15 Actual FY16 Budget FY17 Budget
Service Centers ‐ Expenses
Service & Supplies (net of transfers)
OPE (fringes)
Salaries & Wages
Appendix I 18
Master Page # 45 of 53 - Finance and Administration Meeting 6/8/2016________________________________________________________________________________

Portland State UniversitySummary of Operating BudgetFiscal Year 2016‐17Dollars in 000's
FY15 Actual FY16 Budget FY17 Budget Dollars Percent
Revenue Student Fees ‐$ ‐$ ‐$ ‐$ Sales and Services 574 526 495 (31) ‐6%Internal Sales 225 225 225 ‐ 0%Government Resources & Allocations ‐ ‐ ‐ ‐ Investment/Debt/Debt Service ‐ ‐ ‐ ‐ Other Revenue 5 ‐ ‐ ‐
Total Revenue 804$ 751$ 720$ (31)$ ‐4%
Expense Salaries & Wages 72 85 0 (85) ‐100%OPE (fringes) 20 38 ‐ (38) ‐100%Service & Supplies (net of transfers) 789 770 884 114 15%
Total Expense 881$ 893$ 884$ (9)$ ‐1%
Net (77)$ (143)$ (164)$ (21)$
Auxiliary Enterprises ‐ Research and Strategic PartnershipsChange from FY16 to FY17 Budget
71%70% 69%
28%30%
31%
1%
$‐
$100
$200
$300
$400
$500
$600
$700
$800
$900
FY15 Actual FY16 Budget FY17 Budget
Auxiliary Enterprises ‐ Revenues
Other Revenue
Investment/Debt/Debt Service
Government Resources & Allocations
Internal Sales
Sales and Services
Student Fees
8% 10%0%
2%4%
0%
90% 86%
100%
0
100
200
300
400
500
600
700
800
900
1,000
FY15 Actual FY16 Budget FY17 Budget
Auxiliary Enterprises ‐ Expenses
Service & Supplies (net of transfers)
OPE (fringes)
Salaries & Wages
Appendix I 19
Master Page # 46 of 53 - Finance and Administration Meeting 6/8/2016________________________________________________________________________________

Portland State UniversitySummary of Operating BudgetFiscal Year 2016‐17Dollars in 000's
FY15 Actual FY16 Budget FY17 Budget Dollars Percent
Revenue General Fund Allocation 40,131$ 42,719$ 44,477$ 1,758$ 4%Student Fees 35 58 58 ‐ 0%Gifts Grants and Contracts 52 ‐ 1 1 Investment/Debt/Debt Service 0 ‐ ‐ ‐ Internal Sales 3,452 3,731 4,151 420 11%Other Revenue 367 223 228 5 2%
Total Revenue 44,037$ 46,731$ 48,915$ 2,184$ 5%
Expense Salaries & Wages 20,999 23,842 24,949 1,107 5%OPE (fringes) 9,924 11,684 11,876 192 2%Service & Supplies (net of transfers) 10,876 11,205 12,090 885 8%
Total Expense 41,799$ 46,731$ 48,915$ 2,184$ 5%
Net 2,238$ ‐$ ‐$ ‐$
Education and General (E&G) ‐Finance and Administration (Recurring Only)Change from FY16 to FY17 Budget
91% 91% 91%
8%8%
8%1%
1% 1%
$‐
$10,000
$20,000
$30,000
$40,000
$50,000
$60,000
FY15 Actual FY16 Budget FY17 Budget
Education and General ‐ Revenues
Other Revenue
Internal Sales
Investment/Debt/Debt Service
Gifts Grants and Contracts
Student Fees
General Fund Allocation
50%51% 51%
24%
25% 24%
26%
24%25%
‐
10,000
20,000
30,000
40,000
50,000
60,000
FY15 Actual FY16 Budget FY17 Budget
Education and General ‐ Expenses
Service & Supplies (net of transfers)
OPE (fringes)
Salaries & Wages
Appendix I 20
Master Page # 47 of 53 - Finance and Administration Meeting 6/8/2016________________________________________________________________________________

Portland State UniversitySummary of Operating BudgetFiscal Year 2016‐17Dollars in 000's
FY15 Actual FY16 Budget FY17 Budget Dollars Percent
Revenue Internal Sales 2,194$ 2,062$ 2,286$ 224$ 11%Sales and Services 320 482 260 (222) ‐46%
Total Revenue 2,514$ 2,544$ 2,546$ 2$ 0%
Expense Salaries & Wages 556 810 902 92 11%OPE (fringes) 183 344 387 44 13%Service & Supplies (net of transfers) 2,197 1,616 1,234 (382) ‐24%
Total Expense 2,936$ 2,770$ 2,523$ (246)$ ‐9%
Net (422)$ (225)$ 23$ 248$
Service Centers ‐ Finance and AdministrationChange from FY16 to FY17 Budget
87% 81%90%
13% 19%10%
$‐
$500
$1,000
$1,500
$2,000
$2,500
$3,000
FY15 Actual FY16 Budget FY17 Budget
Service Centers ‐ Revenues
Sales and Services
Internal Sales
19%29% 36%
6%
12%15%
75%59% 49%
‐
500
1,000
1,500
2,000
2,500
3,000
3,500
FY15 Actual FY16 Budget FY17 Budget
Service Centers ‐ Expenses
Service & Supplies (net of transfers)
OPE (fringes)
Salaries & Wages
Appendix I 21
Master Page # 48 of 53 - Finance and Administration Meeting 6/8/2016________________________________________________________________________________
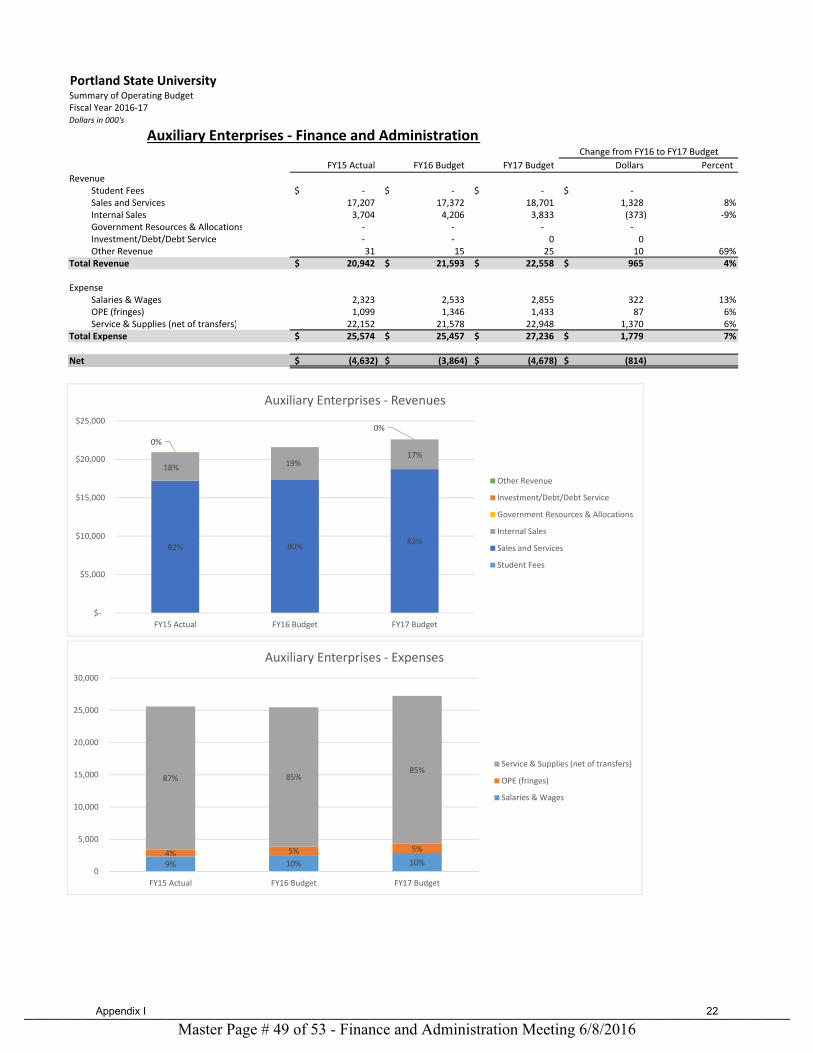
Portland State UniversitySummary of Operating BudgetFiscal Year 2016‐17Dollars in 000's
FY15 Actual FY16 Budget FY17 Budget Dollars Percent
Revenue Student Fees ‐$ ‐$ ‐$ ‐$ Sales and Services 17,207 17,372 18,701 1,328 8%Internal Sales 3,704 4,206 3,833 (373) ‐9%Government Resources & Allocations ‐ ‐ ‐ ‐ Investment/Debt/Debt Service ‐ ‐ 0 0 Other Revenue 31 15 25 10 69%
Total Revenue 20,942$ 21,593$ 22,558$ 965$ 4%
Expense Salaries & Wages 2,323 2,533 2,855 322 13%OPE (fringes) 1,099 1,346 1,433 87 6%Service & Supplies (net of transfers) 22,152 21,578 22,948 1,370 6%
Total Expense 25,574$ 25,457$ 27,236$ 1,779$ 7%
Net (4,632)$ (3,864)$ (4,678)$ (814)$
Auxiliary Enterprises ‐ Finance and AdministrationChange from FY16 to FY17 Budget
82% 80%83%
18% 19%17%
0%
0%
$‐
$5,000
$10,000
$15,000
$20,000
$25,000
FY15 Actual FY16 Budget FY17 Budget
Auxiliary Enterprises ‐ Revenues
Other Revenue
Investment/Debt/Debt Service
Government Resources & Allocations
Internal Sales
Sales and Services
Student Fees
9% 10% 10%4% 5% 5%
87% 85%85%
0
5,000
10,000
15,000
20,000
25,000
30,000
FY15 Actual FY16 Budget FY17 Budget
Auxiliary Enterprises ‐ Expenses
Service & Supplies (net of transfers)
OPE (fringes)
Salaries & Wages
Appendix I 22
Master Page # 49 of 53 - Finance and Administration Meeting 6/8/2016________________________________________________________________________________

Portland State UniversitySummary of Operating BudgetFiscal Year 2016‐17Dollars in 000's
FY15 Actual FY16 Budget FY17 Budget Dollars Percent
Revenue General Fund Allocation 1,373$ 1,414$ 2,257$ 843$ 60%Student Fees ‐ ‐ ‐ ‐ Gifts Grants and Contracts ‐ ‐ ‐ ‐ Investment/Debt/Debt Service ‐ ‐ ‐ ‐ Internal Sales ‐ ‐ ‐ ‐ Other Revenue ‐ ‐ ‐ ‐
Total Revenue 1,373$ 1,414$ 2,257$ 843$ 60%
Expense Salaries & Wages 853 929 1,454 526 57%OPE (fringes) 439 486 775 289 60%Service & Supplies (net of transfers) 2 ‐ 28 28
Total Expense 1,294$ 1,414$ 2,257$ 843$ 60%
Net 79$ ‐$ ‐$ ‐$
Education and General (E&G) ‐ Athletics (Recurring Only)Change from FY16 to FY17 Budget
100% 100%
100%
$‐
$500
$1,000
$1,500
$2,000
$2,500
FY15 Actual FY16 Budget FY17 Budget
Education and General ‐ Revenues
Other Revenue
Internal Sales
Investment/Debt/Debt Service
Gifts Grants and Contracts
Student Fees
General Fund Allocation
66% 66%
64%
34%34%
34%
0%
‐
500
1,000
1,500
2,000
2,500
FY15 Actual FY16 Budget FY17 Budget
Education and General ‐ Expenses
Service & Supplies (net of transfers)
OPE (fringes)
Salaries & Wages
Appendix I 23
Master Page # 50 of 53 - Finance and Administration Meeting 6/8/2016________________________________________________________________________________
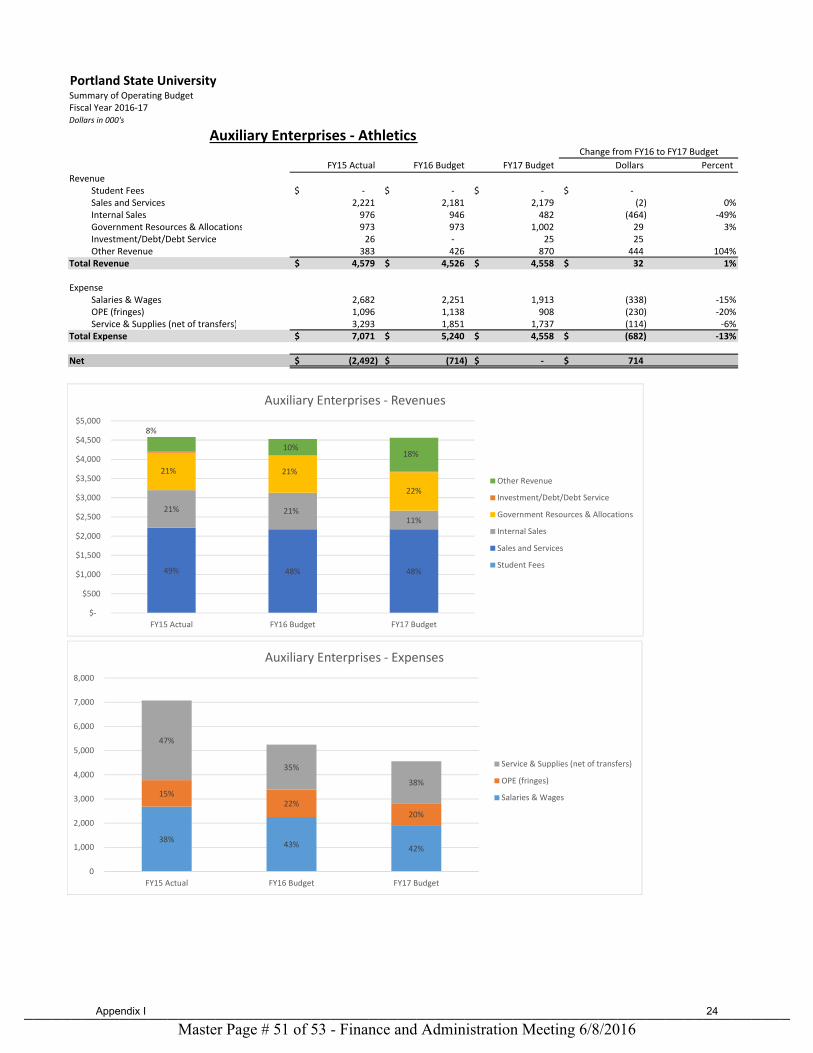
Portland State UniversitySummary of Operating BudgetFiscal Year 2016‐17Dollars in 000's
FY15 Actual FY16 Budget FY17 Budget Dollars Percent
Revenue Student Fees ‐$ ‐$ ‐$ ‐$ Sales and Services 2,221 2,181 2,179 (2) 0%Internal Sales 976 946 482 (464) ‐49%Government Resources & Allocations 973 973 1,002 29 3%Investment/Debt/Debt Service 26 ‐ 25 25 Other Revenue 383 426 870 444 104%
Total Revenue 4,579$ 4,526$ 4,558$ 32$ 1%
Expense Salaries & Wages 2,682 2,251 1,913 (338) ‐15%OPE (fringes) 1,096 1,138 908 (230) ‐20%Service & Supplies (net of transfers) 3,293 1,851 1,737 (114) ‐6%
Total Expense 7,071$ 5,240$ 4,558$ (682)$ ‐13%
Net (2,492)$ (714)$ ‐$ 714$
Auxiliary Enterprises ‐ AthleticsChange from FY16 to FY17 Budget
49% 48% 48%
21% 21%11%
21% 21%
22%
8%
10%18%
$‐
$500
$1,000
$1,500
$2,000
$2,500
$3,000
$3,500
$4,000
$4,500
$5,000
FY15 Actual FY16 Budget FY17 Budget
Auxiliary Enterprises ‐ Revenues
Other Revenue
Investment/Debt/Debt Service
Government Resources & Allocations
Internal Sales
Sales and Services
Student Fees
38%43% 42%
15%22%
20%
47%
35%
38%
0
1,000
2,000
3,000
4,000
5,000
6,000
7,000
8,000
FY15 Actual FY16 Budget FY17 Budget
Auxiliary Enterprises ‐ Expenses
Service & Supplies (net of transfers)
OPE (fringes)
Salaries & Wages
Appendix I 24
Master Page # 51 of 53 - Finance and Administration Meeting 6/8/2016________________________________________________________________________________

Portland State UniversitySummary of Operating BudgetFiscal Year 2016‐17Dollars in 000's
FY15 Actual FY16 Budget FY17 Budget Dollars Percent
Revenue General Fund Allocation 13,753$ 19,857$ 20,924$ 1,068$ 5%Student Fees 4,639 3,502 3,373 (129) ‐4%Gifts Grants and Contracts 2,297 2,493 2,781 287 12%Investment/Debt/Debt Service 2,782 2,180 2,180 ‐ 0%Internal Sales 1,677 1,502 687 (814) ‐54%Other Revenue 435 435 467 32 7%
Total Revenue 25,582$ 29,969$ 30,412$ 444$ 1%
Expense Salaries & Wages 329 388 474 86 22%OPE (fringes) 92 129 162 33 26%Service & Supplies (net of transfers) 21,128 23,841 24,776 935 4%
Total Expense 21,549$ 24,359$ 25,412$ 1,054$ 4%
Net (held for reserves/initiatives in FY17) 4,033$ 5,610$ 5,000$ (610)$
Education and General (E&G) ‐ General University (Recurring Only)Change from FY16 to FY17 Budget
54%
66% 69%
18%
11%
9%
8% 9%11%
7%7%2%
1%
2% 2%
$‐
$5,000
$10,000
$15,000
$20,000
$25,000
$30,000
$35,000
FY15 Actual FY16 Budget FY17 Budget
Education and General ‐ Revenues
Other Revenue
Internal Sales
Investment/Debt/Debt Service
Gifts Grants and Contracts
Student Fees
General Fund Allocation
2%2% 2%0%
1%
98%97% 97%
‐
5,000
10,000
15,000
20,000
25,000
30,000
FY15 Actual FY16 Budget FY17 Budget
Education and General ‐ Expenses
Service & Supplies (net of transfers)
OPE (fringes)
Salaries & Wages
Appendix I 25
Master Page # 52 of 53 - Finance and Administration Meeting 6/8/2016________________________________________________________________________________

Portland State UniversitySummary of Operating BudgetFiscal Year 2016‐17Dollars in 000's
FY15 Actual FY16 Budget FY17 Budget Dollars Percent
Revenue Student Fees 15,370$ 14,640$ 14,869$ 229$ 2%Sales and Services ‐ ‐ ‐ ‐ Internal Sales ‐ ‐ ‐ ‐ Government Resources & Allocations ‐ ‐ ‐ ‐ Investment/Debt/Debt Service 121 120 90 (30) ‐25%Other Revenue 154 ‐ ‐ ‐
Total Revenue 15,645$ 14,760$ 14,959$ 199$ 1%
Expense Salaries & Wages ‐ ‐ ‐ ‐ OPE (fringes) 51 ‐ 15,141 15,141 Service & Supplies (net of transfers) 15,877 16,098 15,141 (957) ‐6%
Total Expense 15,928$ 16,098$ 30,282$ 14,184$ 88%
Net (283)$ (1,338)$ (15,323)$ (13,985)$
Auxiliary Enterprises ‐ General UniversityChange from FY16 to FY17 Budget
98% 99% 99%
1%1% 1%
$‐
$2,000
$4,000
$6,000
$8,000
$10,000
$12,000
$14,000
$16,000
$18,000
FY15 Actual FY16 Budget FY17 Budget
Auxiliary Enterprises ‐ Revenues
Other Revenue
Investment/Debt/Debt Service
Government Resources & Allocations
Internal Sales
Sales and Services
Student Fees
100% 100%
50%
‐
5,000
10,000
15,000
20,000
25,000
30,000
35,000
FY15 Actual FY16 Budget FY17 Budget
Auxiliary Enterprises ‐ Expenses
Service & Supplies (net of transfers)
OPE (fringes)
Salaries & Wages
Appendix I 26
Master Page # 53 of 53 - Finance and Administration Meeting 6/8/2016________________________________________________________________________________