Embed Size (px)
Citation preview

1
FINAL YEAR PROJECT II: DISSERTATION
MODELLING OF HYDRAULIC FLIP INSIDE A SCALED-UP DIESEL
INJECTOR NOZZLE
PREPARED BY:
SHATHISWARAN A/L UTHRAPATHY
14998
SUPERVISOR:
DR. RAHMAT ISKANDAR KHAIRUL SHAZI
Preliminary report submitted in partial fulfilment of the requirement for the
Bachelor of Engineering (Hons)
(Mechanical Engineering)
JANUARY 2015
Universiti Teknologi PETRONAS,
32610 Bandar Seri Iskandar,
Perak Darul Ridzuan

i
CERTIFICATION OF APPROVAL
MODELLING OF HYDRAULIC FLIP INSIDE A SCALED-UP DIESEL
INJECTOR NOZZLE
BY
SHATHISWARAN A/L UTHRAPATHY
14998
A project dissertation submitted to the
Mechanical Engineering Programme
Universiti Teknologi PETRONAS
in partial fulfilment of the requirement for the
BACHELOR OF ENGINEERING (Hons)
(MECHANICAL)
Approved by,
_____________________
(DR. RAHMAT ISKANDAR)
UNIVERSITI TEKNOLOGI PETRONAS
TRONOH, PERAK
JANUARY 2015

ii
CERTIFICATION OF ORIGINALITY
This is to certify that I am responsible for the work submitted in this project,
that the original work is my own except as specified in the references and
acknowledgements, and that the original work contained herein have not
been undertaken or done by unspecified sources or persons.
___________________________________________
SHATHISWARAN A/L UTHRAPATHY

iii
ABSTRACT
The ignition process in diesel engines is mainly depending on the
quality of mixing process of highly compressed air and fuel. The quality of
mixing process here refers to how well the air atoms and fuel atoms are in
contact with each other. Mixture of air and fuel particles can induced ignition,
but the time frame for a particular ignition is depending on the surrounding
parameters. These parameters either delay or furtherance the time frame of
ignition. Atomization process that took place in the nozzle and is one of the
parameters that enhances the ignition process. Atomization is a process where
the fuel in the form of liquid is broken into tiny small particles. Good
atomization is required for a better ignition process. The efficiency of
atomization is affected by several condition. This paper mainly focused on
two conditions. Cavitation and hydraulic flip are those two conditions.
Cavitation can enhance atomization process while hydraulic flip reduces the
effectiveness of atomization. Hydraulic flip begins when the cavitation
bubble goes beyond the super-critical cavitation condition. Eventually, the
downstream ambient air which is usually at higher pressure compared to
vapor saturation process will enter into the cavitation domain to produce a
layer which separates the liquid and the nozzle wall. This phenomenon has a
great impact on the structure and atomization of liquid jet. This study is
mainly on designing the nozzle which can prevent hydraulic flip. The design
of Martynov (2005) was drawn in a computer aided software
(SOLIDWORKS, 2014). The validation and simulation of the created nozzle
design were performed using computational fluid design software (ANSYS
15.0). Modification of nozzle done by attaching trip wire at the throat of the
rectangular nozzle. Trip wire alter the characteristic of the separated shear
layer by changing the periodic shedding behavior which dependent on the
formation and coalescence of micro-vortex cavity at separated shear layer and
re-entrance motion. Shedding frequency increases due to attachment of trip
wire. Higher frequency relates to shorter length of cavitation area.

iv
ACKNOWLEDGEMENT
First and foremost, I would like to thank my supervisor, Dr.
RAHMAT ISKANDAR for all his support for me in completing this project.
Without his coaching and supervision, I would not have made it this far.
I would also like to thank my university, Universiti Teknologi
PETRONAS, UTP for giving me an opportunity to carry out this project
successfully.
I am also very grateful for all the support given by my family who
were always there by my side. I would also like to thank my family, friends
and others who have helped me in completing my final year project as a
mechanical engineering student in UTP.

1
TABLE OF CONTENTS
CHAPTER 1: INTRODUCTION
1.1 BACKGROUND……………………………………………………… 1
1.2 PROBLEM STATEMENT…………………………………………… 2
1.3 OBJECTIVE………………………………………………………….. 2
1.4 SCOPE OF STUDY…………………………………………………...2
CHAPTER 2: LITERATURE REVIEW
2.1 CAVITATION………………………………………………………... 3
2.2 SIMILARITY CRITERIA AND SCALE EFFECTS………………… 5
2.3 HYDRAULIC FLIP…………………………………………………... 5
2.4 EFFECT OF TRIP WIRE ON CAVITATION BEHAVIOUR IN NOZZLE... 7
CHAPTER 3: METHODOLOGY/PROJECT WORK
3.1 PROJECT ACTIVITIES……………………………………………... 10
3.1.1 PROBLEM IDENTIFICATION AND DATA GATHERING…….. 11
3.1.2 DESIGN OF MODEL……………………………………………… 11
3.1.3 SIMULATION AND VALIDATION OF MODEL……………….. 14
3.1.4 MODIFICATION TO THE MODEL……………………………... 16
3.1.5 SIMULATION SETUP…………………………………………….. 18
3.1.6 REVIEW AND ANALYSIS OF THE RESULT…………………... 19
3.2 KEY MILESTONE…………………………………………………… 20
3.3 GANTT CHART……………………………………………………… 20
CHAPTER 4: RESULT AND DISCUSSION
4.1 OVERALL RESULT SUMMARY…………………………………... 21
4.1.1 RESULT FOR UNMODIFIED DIESEL INJECTOR NOZZLE MODEL
211
4.1.2 RESULT FOR MODIFIED DIESEL INJECTOR NOZZLE MODEL ...... 22
4.2 COMPARISON BETWEEN DIFFENT DIESEL INJECTOR MODEL
RESULT (ROOSEN (1996) EXPERIMENTAL RESULT, MARTYNOV
(2005) SIMULATION RESULT AND SIMULATION RESULT OBTAINED
FOR THIS STUDY…………………………………………………... 25
4.4 COMPARISON BETWEEEN UNMODIFIED DIESEL INJECTOR
NOZZLE MODEL AND MODIFIED DIESEL INJECTOR NOZZLE
MODEL. ……………………………………………………………... 29
CHAPTER 5: CONCLUSIONS…………………………………………… 31
CHAPTER 6: REFERENCES……………………………………………... 32
CHAPTER 7: APPENDIX…………………………………………………. 33
2
LIST OF FIGURES
Figure 2.1: Characteristic types of spray formation while flowing through the large
scale circular nozzle (Soteriou, 1999)…………………….…….……….4
Figure 2.2: Schematic of an axisymmetric cavitating nozzle……………............... .. 6
Figure 3.1: Workflow of project…….…………………………...……………….….10
Figure 3.2: Design of diesel injector nozzle…………………………………..….….11
Figure 3.3: Full diesel injector nozzle designed in SOLIDWORKS 2014..................12
Figure 3.4: Sketch of diesel injector nozzle……………….……..………………..…12
Figure 3.5: Quarter section of Diesel injector nozzle………………….....……….....13
Figure 3.6: Technical drawing of Diesel injector nozzle………....…...............….….13
Figure 3.7: Effect of mesh element size on percentage error……….....………….…16
Figure 3.8: Trip wire model designed in SOLIDWORKS 2015……………........….17
Figure 3.9: Technical drawing of trip wire………………………………………..…17
Figure 3.10: Trip wire attached at the entrance of the nozzle throat………………...18
Figure 3.11: Steps of analysing data…………………………………………….…...19
Figure 3.12: Key Milestone…………………………………………...………….….20
Figure 4.1: Total pressure for inlet cavitation flow (unmodified)…………….…......21
Figure 4.2: Water velocity for inlet cavitation flow (unmodified)……………..…....21
Figure 4.3: Water vapour volume fraction for inlet cavitation flow
(unmodified) ……………………………………….…………………………..21
Figure 4.4: Total pressure for super-cavitation flow (unmodified)……….……...….22
Figure 4.5: Water velocity for super-cavitation flow (unmodified)…….………..….22
Figure 4.6: Water vapour volume fraction for super-cavitation flow
(unmodified).............................................................................................22
Figure 4.7: Total pressure for the inlet cavitation flow (modified)…………..….…..23
Figure 4.8: Water velocity for inlet cavitation flow (modified)……………..….…...23
Figure 4.9: Water vapour volume fraction for inlet cavitation flow (modified).........23
Figure 4.10: Total pressure for super-cavitation flow (modified)……….……….….24
Figure 4.11: Water velocity for super-cavitation flow (modified)…....……….…….24
Figure 4.12: Water vapour volume fraction for super-cavitation flow (modified)….24
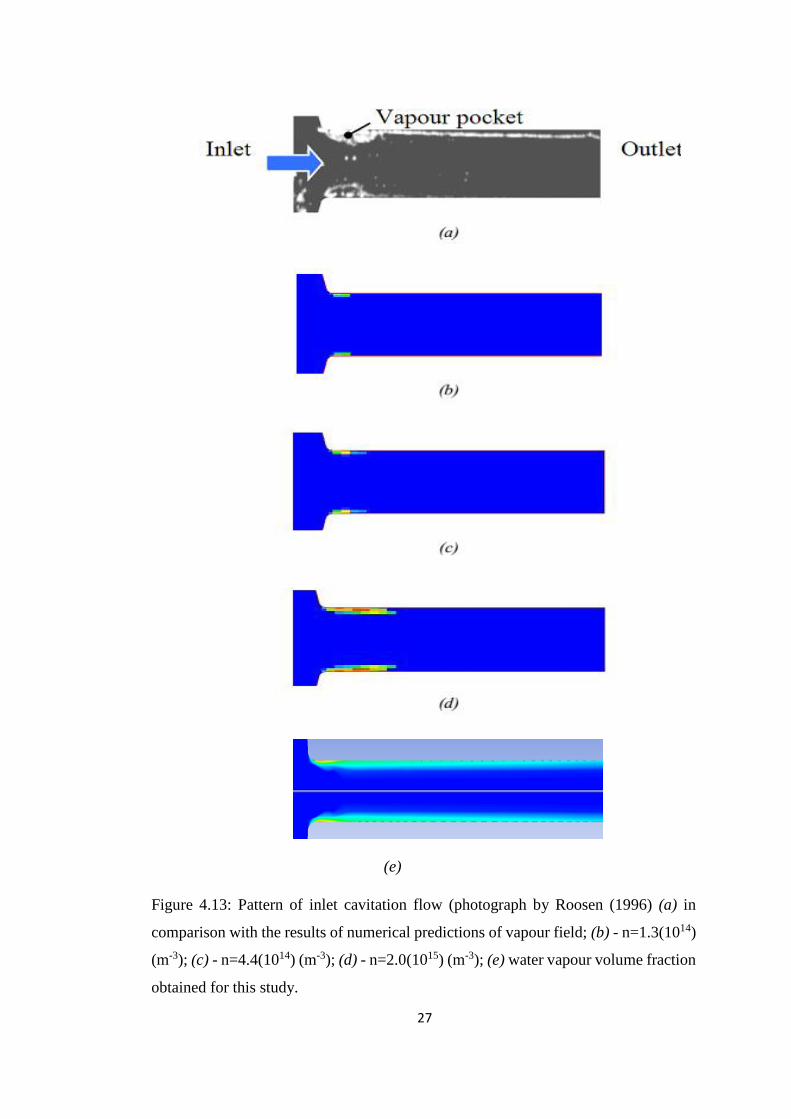
Figure 4.13: Pattern of inlet cavitation flow (photograph by Roosen (1996) (a) in
comparison with the results of numerical predictions of vapour

3
field; (b) - n=1.3(1014) (m-3); (c) - n=4.4(1014) (m-3); (d) -
n=2.0(1015) (m-3); (e) water vapour volume fraction obtained for
this study……………………………………………..………….27
Figure 4.14: Pattern of super-cavitation flow (photograph by Roosen (1996) (a) in
comparison with the results of numerical predictions cavitation
pockets using n=1.3(1014) (m-3) (b), n=4.4(1014) (m-3) (c), water
vapour volume fraction obtained for this study
(d)……………………………………………………………………….28
Figure 4.15: Water vapour volume fraction contour for the super cavitating flow
using different mesh element sizes; (a) mesh 4; (b) mesh 2……...30

4
LIST OF TABLES
Table 2.1: Experimental result from Sato & Saito (2001)……………...……………7
Table 2.2: Variables associated with the study of effect of trip wire
inside a long circular-cylindrical orifice………………...……….….........8
Table 2.3: Experimental result with and without trip wire attachment….…………...8
Table 3.1: Grid use in the study of mesh dependence………………….………...…14
Table 3.2: Actual, theoretical value, percentage error and time taken
by CPU for computation using different meshes…...……………...……15
Table 3.3: Boundary conditions for simulation of Diesel injector nozzle………….18
Table 3.4: Gantt chart……………………………………………………...……….20
Table 4.1: Water vapour volume fraction contour of unmodified and
modified Diesel injector nozzle………………………………..……....24

1
CHAPTER 1:
INTRODUCTION
1.1 BACKGROUND
Diesel engine is effective for heavy duty tasks such as load carrying lorries.
This is because the energy density extracted from diesel is much higher than the energy
density extracted from gasoline. Ignition process in diesel engines is initiated when fuel
is injected into the piston which contains compressed hot air. For a better ignition, fuel
spray needs to be in fine particles. Fine fuel particles have a greater surface area in
contact with the air particles.
Atomization is the process where the fuel in the form of liquid is broken down
into fine particles. Atomization of fuel takes place in the diesel injector nozzle. Diesel
injector nozzle sprays the fine fuel particles in the piston. Fine particles are not
produced once the downstream air enters the nozzle and forms a layer that separates
the nozzle wall and the fuel. This phenomenon is termed as hydraulic flip. Hydraulic
flip is a condition that is not highly recommended for atomization.
This project investigates cavitation in diesel injector nozzle. Cavitation in the
high pressure nozzle is related to hydraulic flip (Sou, 2007). When the cavitation
bubble goes beyond the super-critical cavitation condition, hydraulic flip begins.
Eventually, the downstream ambient air at higher pressure compared to vapor
saturation pressure will enter into the cavitation domain to produce a layer which
separates the liquid and the nozzle wall. This phenomenon has a great impact on the
structure and atomization of liquid jet. The layer formed in the nozzle reduces the area
in which fuel is flowing through. The velocity of the fuel flow in nozzle increases since
fuel flow area is reduced. Furthermore, there will be no friction between nozzle wall
and fuel since the layer of downstream air separates the two interface. Turbulence is
reduced and the resultant atomization quality drops.

2
1.2 PROBLEM STATEMENT
Hydraulic flip in a condition where the structure and the break-up of the fuel
from the nozzle is affected. The hydraulic flip condition will prevent the liquid in the
jet from touching the wall of nozzle. This will eliminate the turbulence production at
the wall of nozzle. Hydraulic flip is highly not favorable in the diesel injection nozzle.
The problem statement of this project is to simulate the diesel injection nozzle using
simulation software to understand the internal flow characteristic specifically
cavitation behavior.
1.3 OBJECTIVE
The objectives of this project are:
i. To study the parameters and conditions which contribute to cavitation and
hydraulic flip
ii. To model Sergey Martynov’s design in SOLIDWORKS
iii. To modify and simulate Sergey Martynov’s design using ANSYS
1.4 SCOPE OF STUDY
This project mainly will cover the topic from Martynov (2005) on the
hydraulic flip. Study of the hydraulic flip and condition that affect hydraulic flip is
studied. Martynov (2005) design was modeled in SOLIDWORKS 2014. The created
design was validated in ANSYS 15.0. The result obtained from the simulation was
compared with the Roosen (1996) and Martynov (2005) result. Once the validation
process in completed, modification of the nozzle is modeled before simulating it to
obtain the final result.
3
CHAPTER 2:
LITERATURE REVIEW
2.1 CAVITATION
The fuel spray behavior depends on the fuel properties, geometry of injectors,
upstream flow condition and also condition at the downstream of the injector nozzle.
Process of formation of voids in a liquid due to a sudden drop pressure, when the local
pressure drop, when the local tension exceeds the tensile strength of the liquid is
termed as cavitation (Brennen, 1995).
Cavitation is the development and collapse of vapor phase in liquid when the
local pressure drops below the saturation pressure at given temperature. Cavitation
can be divided into two categories. The first is termed as hydrodynamic cavitation
where the cavitation is initiated because of the reduction of static pressure inside the
nozzle by the hydrodynamic motion of liquid. The second is called as acoustics
cavitation where the cavitation occurs by the propagation of pressure wave inside the
nozzle (Martynov, 2005).
A cavitation number describes the nature of the flow. It is a parameter that
relates the pressure drop to the local static pressure. Critical cavitation number marks
the inception of cavitation and allows the flow to be classified as non-cavitating or
cavitating (Martynov, 2005). Cavitation inception is the term for the flow condition
when the hydrodynamic cavitation first appears in the nozzle; cavitation desinence is
the term used for the condition when the cavitation vanishes from the flow inside the
diesel injector due to minor changes in the parameter of the flow. Equation 2.1 shows
the cavitation number introduced by Bergwerk (1959):
𝐶𝑁 =𝑃1−𝑃2
𝑃2−𝑃𝑣 (2.1)
where P1 is the pressure at the inlet of the nozzle, P2 is the pressure at the outlet of the
nozzle and Pv is the vapour pressure, usually associated with the saturation pressure
in the liquid.

4
Experimental studies of cavitation flow in nozzles with different shapes have
revealed there is relationship between the cavitation number and the extent of the
cavitation region. The result of the relationship mentioned above is classification of
cavitation flow regime depending on the cavitation number, namely: incipient,
developed (sub-cavitation and transitional cavitation) and super-cavitating (Sato &
Saito, 2001). At a certain value of cavitation number CNinc, inception of cavitation
occurs in the vena contracta region i.e. zone of recirculation flow downstream the
nozzle entrance. During sub-cavitation stage cavitation bubbles fill the separation
region, and changes in CN have little affect on the length of cavitation region. Further
increase in CN enlarges the cavity length (transitional cavitation) and at a certain point
(CNsuper, supercavitation number) cavitation zone rapidly extends to the outlet of
nozzle (supercavitation). At high cavitation number CN> CNsuper cavitation zone
exceeds the nozzle hole and forms jet cavitation when the nozzle is submerged in a
liquid (Sato & Saito, 2001).
Figure 2.1 illustrates the type of spray produced at different cavitation number.
In image (a) cavitation does not occur. As a result, the exit flow is a turbulent jet.
Image (b) shows the exit flow in the presence of cavitation and the result is a fairly
atomizing jet. Image (c) illustrates the exit flow as an atomizing jet. This atomizing
jet is produced when the cavitation number is at CNsuper. Image (d) shows the exit flow
as total hydraulic flip jet. This type of exit flow is produced when the cavitation
number exeeds the CNsuper.
(a)
(b) (c)
(d)
Figure 2.1: Characteristic types of spray formation while flowing through the
large-scale circular nozzle (Soteriou, 1999)
(c) (b)

5
2.2 SIMILARITY CRITERIA AND SCALE EFFECTS
According to Ashley (1997), the standard modern diesel injector typically has
a nozzle diameter of 0.2mm and injection pressure of 2000 bar. He also stated that the
injection speed ranges between 200-400 m/s. Since the nozzle size is too small, it is
difficult to visually observe the flow inside the nozzle. To overcome this difficulty,
application of special methods and equipment are needed. Scaling theory is applied,
where a larger model of the nozzle can be used. The result from the large scale
experiments can then extrapolated to real-scale flows (Soteriou, 1999). Parameters
that were found to be very vital for the description of the cavitation flow are densities
and coefficient of dynamic viscosity of liquid and vapor phases (ρl, ρv, µl, µv)
coefficient of surface tension (s), speed of sound in liquid (c), spatial scale of the flow
(l∞), pressure upstream and downstream the cavitation region (P1 and P2) and velocity
scale of the flow (µ∞) (Lecoffre, 1999)
Cavitation number, CN and Reynolds number, Re is the most important criteria
that describe the similarity in the experimental studies of cavitation flow in a real size
nozzle (Bergwerk, 1959). Usually We and Fr number are neglected in high speed
cavitation flow with prevailing inertia force. In practice, to make two cavitation flows
similar, the scale effects associated with the liquid quality and viscous nature of the
flow should be minimised.
2.3 HYDRAULIC FLIP
Hydraulic flip is an atypical conduct that can happen in short, ideal, nozzle yet
is not thought to be regular in real injector nozzle. Separation of the flow occurs at the
inlet corner and an undisturbed flow is achieved through the nozzle. Downstream gas
surrounds the liquid in the nozzle and kept the liquid away from the nozzle wall. In
short, sharp-edged nozzles, the vena contracta affects the atomization of the nozzle
(Karasawa, 1992).
Figure 2.2 illustrate the vena contracta phenomena. Vena contracta is a reduction of
flow area that happens because of the flow separation at the nozzle walls. Nozzle effect
on the spray is determined by the contraction inside the nozzle.
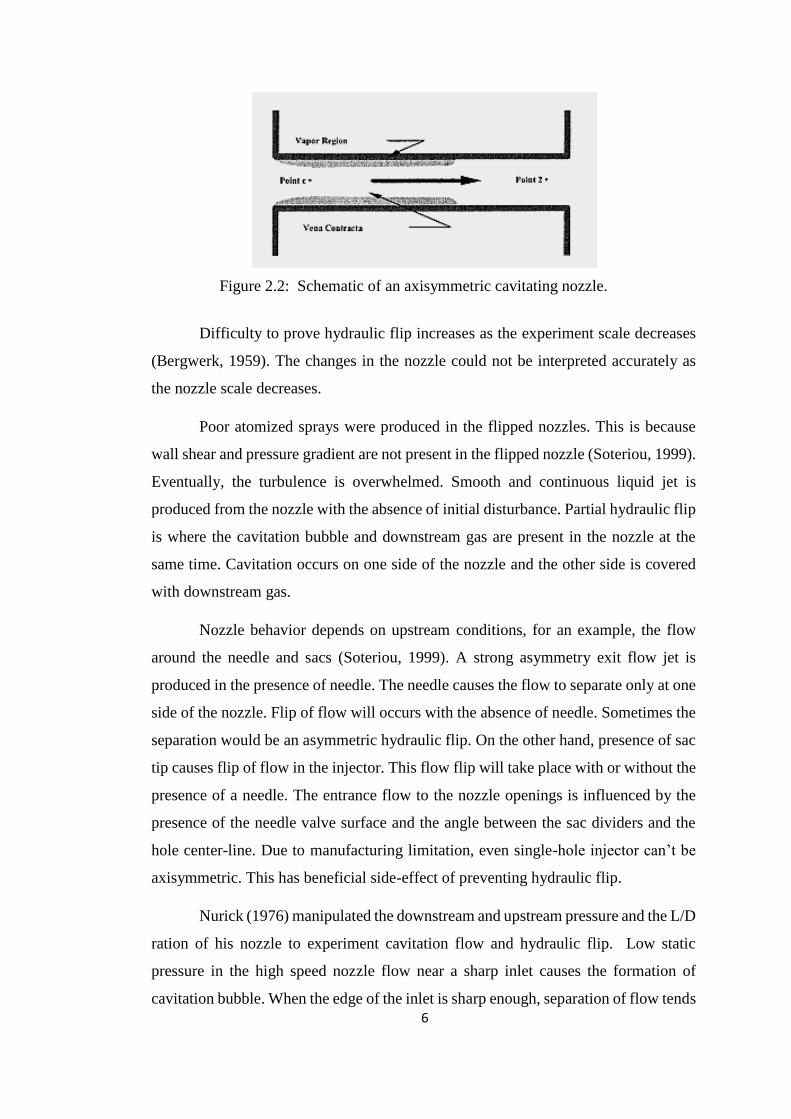
6
Difficulty to prove hydraulic flip increases as the experiment scale decreases
(Bergwerk, 1959). The changes in the nozzle could not be interpreted accurately as
the nozzle scale decreases.
Poor atomized sprays were produced in the flipped nozzles. This is because
wall shear and pressure gradient are not present in the flipped nozzle (Soteriou, 1999).
Eventually, the turbulence is overwhelmed. Smooth and continuous liquid jet is
produced from the nozzle with the absence of initial disturbance. Partial hydraulic flip
is where the cavitation bubble and downstream gas are present in the nozzle at the
same time. Cavitation occurs on one side of the nozzle and the other side is covered
with downstream gas.
Nozzle behavior depends on upstream conditions, for an example, the flow
around the needle and sacs (Soteriou, 1999). A strong asymmetry exit flow jet is
produced in the presence of needle. The needle causes the flow to separate only at one
side of the nozzle. Flip of flow will occurs with the absence of needle. Sometimes the
separation would be an asymmetric hydraulic flip. On the other hand, presence of sac
tip causes flip of flow in the injector. This flow flip will take place with or without the
presence of a needle. The entrance flow to the nozzle openings is influenced by the
presence of the needle valve surface and the angle between the sac dividers and the
hole center-line. Due to manufacturing limitation, even single-hole injector can’t be
axisymmetric. This has beneficial side-effect of preventing hydraulic flip.
Nurick (1976) manipulated the downstream and upstream pressure and the L/D
ration of his nozzle to experiment cavitation flow and hydraulic flip. Low static
pressure in the high speed nozzle flow near a sharp inlet causes the formation of
cavitation bubble. When the edge of the inlet is sharp enough, separation of flow tends
Figure 2.2: Schematic of an axisymmetric cavitating nozzle.
7
to occur and formation of vena contracta inside the nozzle begins. This contraction at
the inlet tends to decrease the area where the liquid flow through. Velocity of the flow
increases as the area is reduced. The vena contracta contraction causes acceleration in
flow and eventually causes a pressure depression in the throat of the nozzle. Cavitation
happens once the pressure inside the throat decreases beyond vapor pressure of liquid.
Cavitation bubbles start to build around the nozzle walls.
2.4 EFFECT OF TRIP WIRE ON CAVITATION BEHAVIOUR IN
NOZZLE
Attached cavity and shedding cavity are the two type of cavity vortices found
in a cavitation flow inside a nozzle. The attached cavity begins at the throat of the
nozzle. According to Sato & Saito (2001), the presence of the attached cavity and re-
entrant jet shed a cloud-like cavity in the direction of flow. This cloud-like cavity is
termed as shedding cavity. The fixed cavity type (attached cavity) generates the
shedding type of vortex cavity (shedding cavity).
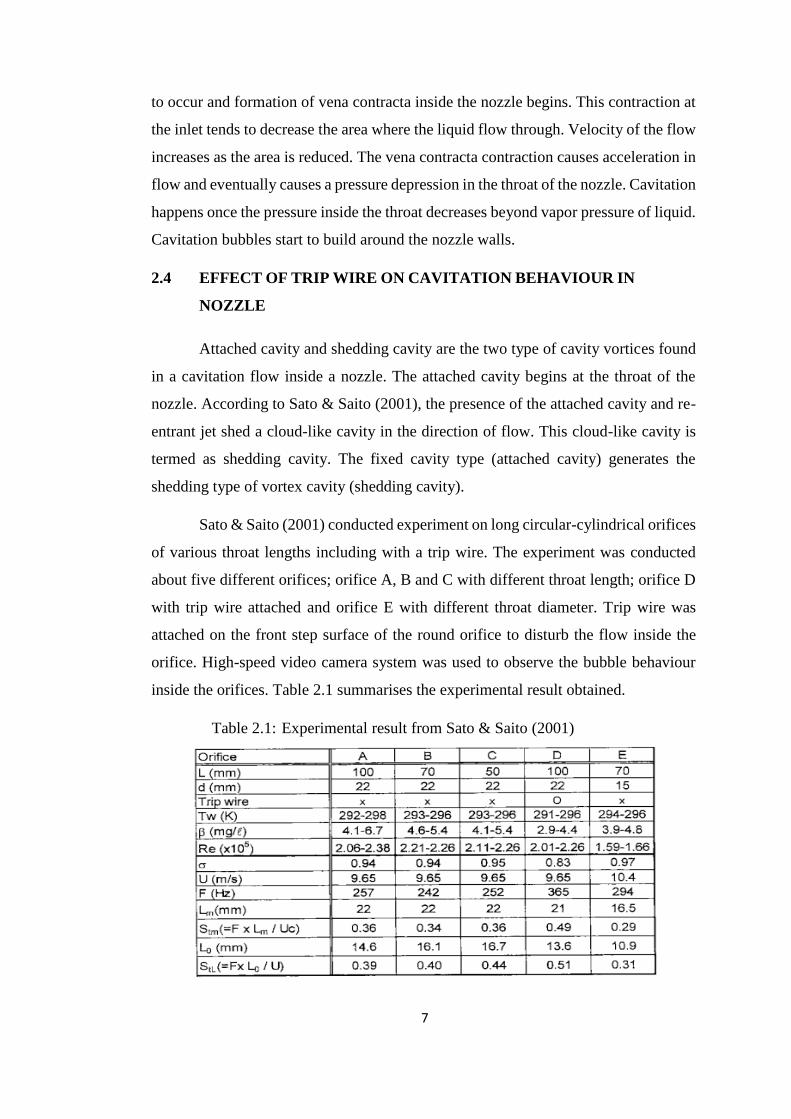
Sato & Saito (2001) conducted experiment on long circular-cylindrical orifices
of various throat lengths including with a trip wire. The experiment was conducted
about five different orifices; orifice A, B and C with different throat length; orifice D
with trip wire attached and orifice E with different throat diameter. Trip wire was
attached on the front step surface of the round orifice to disturb the flow inside the
orifice. High-speed video camera system was used to observe the bubble behaviour
inside the orifices. Table 2.1 summarises the experimental result obtained.
Table 2.1: Experimental result from Sato & Saito (2001)

8
For this particular project, result of orifice A and D was compared to study the
effect of trip wire on the behaviour of flow inside the orifice. Orifice D has trip wire
attached just in-front the throat inlet. The length of throat (L), diameter of throat (d),
and inlet velocity (U) is the same for both orifice A and D. The only manipulated
variable for the study was presence of trip wire inside the orifice. Table 2.2 gives a
clear picture of the variables associated with the study.
Table 2.2: Variables associated with the study of effect of trip wire inside a long
circular-cylindrical orifice (Sato & Saito, 2001)
Orifice A D
L (mm) 100 100
d (mm) 22 22
U (m/s) 9.65 9.65
Trip Wire X /
The orifice A and D was tested using same inlet velocity and the experimental
result as in Table 2.3 was obtained.
Table 2.3: Experimental result with and without trip wire attachment
Orifice A D
Re (10^5) 2.06-2.38 2.01-2.26
Cavitation Number 0.94 0.83
F (Hz) 257 365
Lm 22 21
Lo 14.6 13.6
Stm 0.36 0.49
Stl 0.39 0.51
F= Shedding frequency of cloud like cavity
Lm= Time average cavity length (floating bubble)
Lo= Length of attached cavity (bubble attached to wall)
Stl= Strouhal number based on cavity length, Lo and average throat velocity, U
Stm= Strouhal number based on Lm
From Table 2.3, due to the attachment of trip wire, shedding frequency of cloud
like cavity increases significantly. Unsteadiness of the flow increases and cause the

9
length of the attached cavity to reduce. As conclusion, the periodic shedding process
dependent on the formation and coalescence of micro-vortex cavity at separated shear
layer and reentrance motion. Trip wire alter the characteristic of separated shear layer
by changing the periodic behavior of the shedding process. The periodic shedding
frequency becomes higher due to attachment of trip wire. Lastly, higher frequency of
shedding relates to shorter length of cavitation area.

10
CHAPTER 3:
METHODOLOGY/PROJECT WORK
3.1 PROJECT ACTIVITIES
Figure 3.1 shows the flow of this project. There are three main steps.
The first step is preliminary research work. The second step is project
execution and lastly result analysis and documentation.
Start
Data gathering on hydraulic flip
Simulate & validate design
Simulate to find results of modification
Review and analysis of the findings
Modify the design
End
Problem identification
Design the model in Solidworks 14
Preliminary
Research Work
Project
Execution
Result
Analysis and
Documentation
Figure 3.1: Workflow of project.

11
3.1.1 PROBLEM IDENTIFICATION AND DATA GATHERING
Prior research which covers on cavitation and hydraulic flip is necessary to get
a clearer view of the problem. The data for this project was carried out on various
previous studies initially. Once the problem has been identified, focus was on
Martynov (2005) to frame the scope of study. This paper is the main reference for this
project.
3.1.2 DESIGN OF MODEL
Reference measurement was taken from Martynov (2005) and figure 3.2 shows
design data provided. The diesel is supplied to the nozzle at the inlet and goes through
the larger section of supply tube first before reaching the nozzle inlet. Diesel then exits
the nozzle at the outlet as spray.
The nozzle has a length L=1mm, width W=0.2 mm, and height, H=0.2 mm
and the radius of inlet corner Rin=0.028 mm. The flow from inlet to outlet is in the
positive Z-direction.
Figure 3.2: Design of diesel injector nozzle (Martynov, 2005)

12
Figure 3.3 is the diesel injector nozzle model designed in the SOLIDWORKS
2014 according to Martynov (2005). Figure 3.4 shows the sketch of quarter of the
diesel injector nozzle which is then extruded to 0.2 mm. The width of the diesel
injector nozzle is 0.2 mm.
Figure 3.5 shows the quarter section of the diesel injector nozzle. Due to the
symmetrical characteristic of the diesel injector nozzle only quarter section of the
nozzle was used to perform simulation. Figure 3.6 illustrate the technical drawing of
quarter section of diesel injector nozzle.
Figure 3.3: Full diesel injector nozzle designed in SOLIDWORKS 2014
Figure 3.4: Sketch of diesel injector nozzle.

13
Figure 3.5: Quarter section of Diesel injector nozzle.
Figure 3.6: Technical drawing of Diesel injector nozzle
14
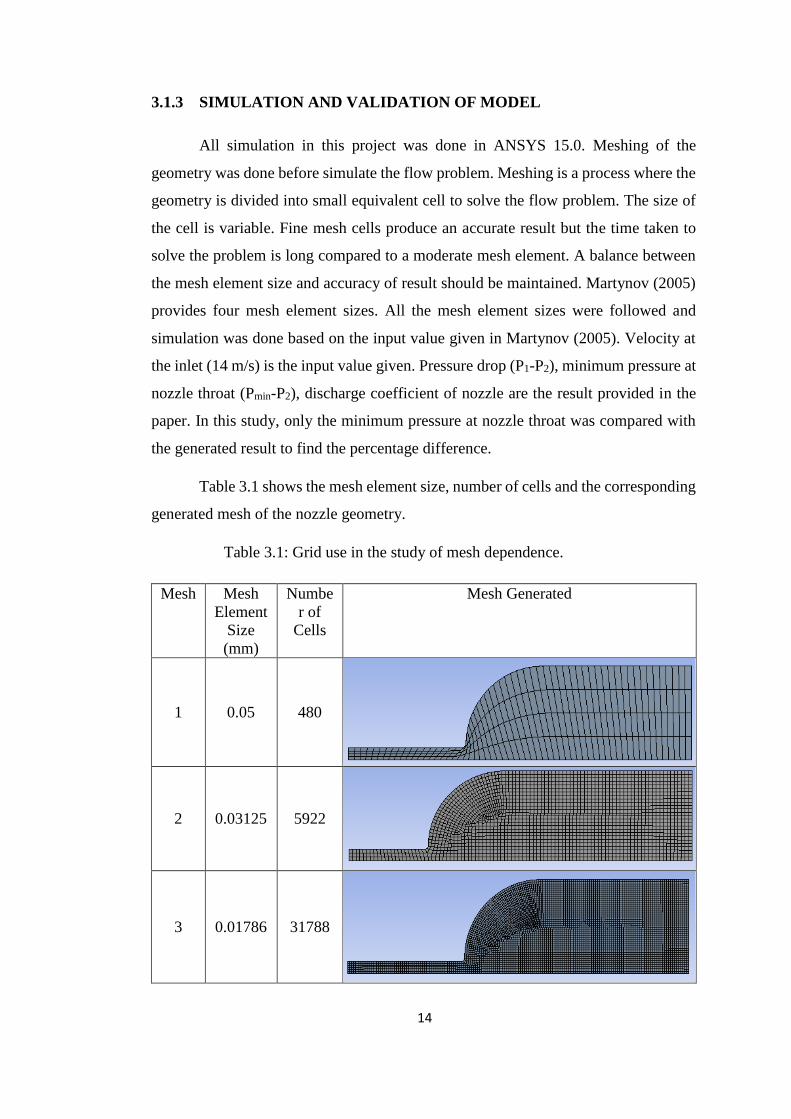
3.1.3 SIMULATION AND VALIDATION OF MODEL
All simulation in this project was done in ANSYS 15.0. Meshing of the
geometry was done before simulate the flow problem. Meshing is a process where the
geometry is divided into small equivalent cell to solve the flow problem. The size of
the cell is variable. Fine mesh cells produce an accurate result but the time taken to
solve the problem is long compared to a moderate mesh element. A balance between
the mesh element size and accuracy of result should be maintained. Martynov (2005)
provides four mesh element sizes. All the mesh element sizes were followed and
simulation was done based on the input value given in Martynov (2005). Velocity at
the inlet (14 m/s) is the input value given. Pressure drop (P1-P2), minimum pressure at
nozzle throat (Pmin-P2), discharge coefficient of nozzle are the result provided in the
paper. In this study, only the minimum pressure at nozzle throat was compared with
the generated result to find the percentage difference.
Table 3.1 shows the mesh element size, number of cells and the corresponding
generated mesh of the nozzle geometry.
Table 3.1: Grid use in the study of mesh dependence.
Mesh Mesh
Element
Size
(mm)
Numbe
r of
Cells
Mesh Generated
1 0.05 480
2 0.03125 5922
3 0.01786 31788

15
4 0.01042 155050
Simulation was performed for all the meshes with an input velocity of 14 m/s
at inlet. All the four meshes have skewness, but the skewness metric is less than 0.3.
According to Ansys, optimum skewness is below 0.9. Detailed explanation of
skewness is presented in Appendix A. Table 3.2 shows the minimum pressure at
nozzle throat obtained from the meshing (actual), minimum pressure at nozzle throat
taken from Martynov (2005) (theoretical), percentage error and CPU time spent for
computation using different meshes.
Table 3.2: Actual, theoretical value, percentage error and time taken by CPU for
computation using different meshes
Mesh Actual Value
(MPa)
Theoretical
Value (MPa)
Percentage
Error (%)
CPU time,
seconds
1 -3.46 -3.24 6.64 6.549
2 -4.98 -5.19 4.05 7.578
3 -6.08 -5.90 3.02 25.372
4 -6.17 -6.06 1.78 57.482
16
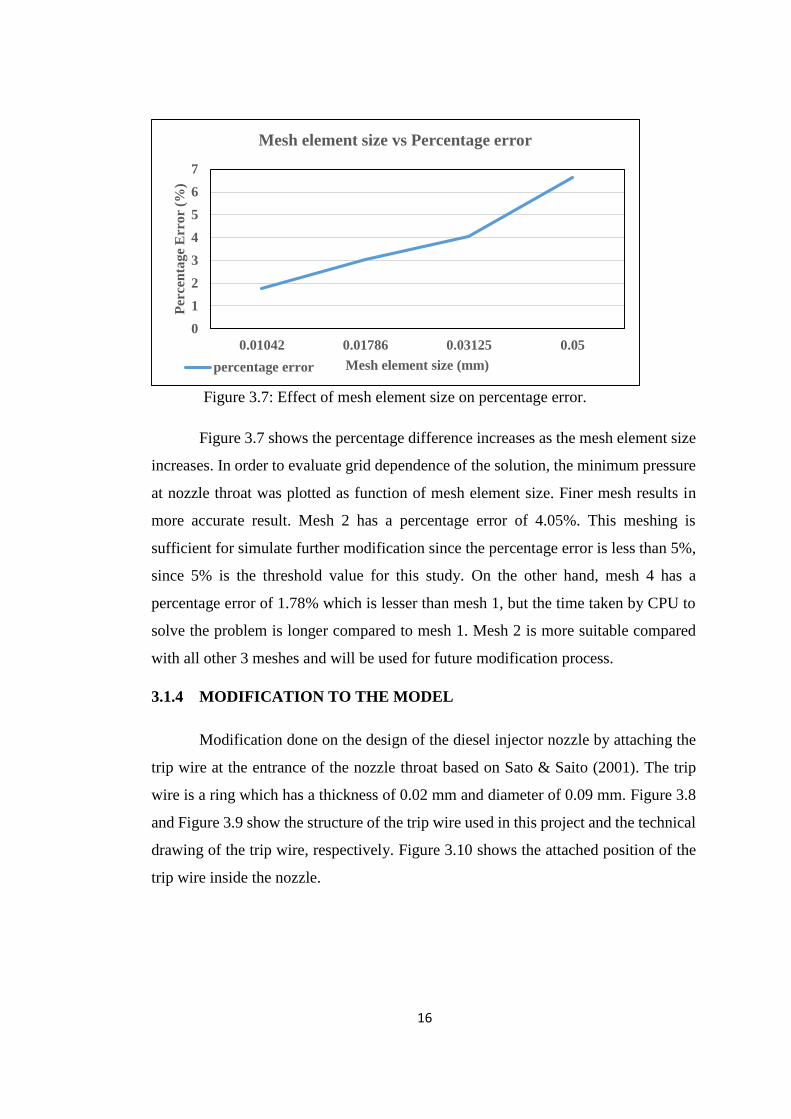
Figure 3.7 shows the percentage difference increases as the mesh element size
increases. In order to evaluate grid dependence of the solution, the minimum pressure
at nozzle throat was plotted as function of mesh element size. Finer mesh results in
more accurate result. Mesh 2 has a percentage error of 4.05%. This meshing is
sufficient for simulate further modification since the percentage error is less than 5%,
since 5% is the threshold value for this study. On the other hand, mesh 4 has a
percentage error of 1.78% which is lesser than mesh 1, but the time taken by CPU to
solve the problem is longer compared to mesh 1. Mesh 2 is more suitable compared
with all other 3 meshes and will be used for future modification process.
3.1.4 MODIFICATION TO THE MODEL
Modification done on the design of the diesel injector nozzle by attaching the
trip wire at the entrance of the nozzle throat based on Sato & Saito (2001). The trip
wire is a ring which has a thickness of 0.02 mm and diameter of 0.09 mm. Figure 3.8
and Figure 3.9 show the structure of the trip wire used in this project and the technical
drawing of the trip wire, respectively. Figure 3.10 shows the attached position of the
trip wire inside the nozzle.
0
1
2
3
4
5
6
7
0.01042 0.01786 0.03125 0.05
Per
cen
tag
e E
rro
r (%
)
Mesh element size (mm)
Mesh element size vs Percentage error
percentage error
Figure 3.7: Effect of mesh element size on percentage error.

17
Figure 3.9: Technical drawing of trip wire
Figure 3.8 Trip wire model designed in SOLIDWORKS 2015

18
3.1.5 SIMULATION SETUP
Simulation of Diesel injector nozzle model was performed first. Simulation for
the modified Diesel injector nozzle model was done using the same simulation setup
as for the unmodified Diesel injector nozzle model. For both model, two simulation
were performed. The first is for simulating the inlet cavitation flow and second for
simulating super-cavitation flow. For both flow, the injection pressure, P1, and inlet
velocity were same. The only varying parameter was the outlet pressure, P2. The
boundary conditions for the simulation for unmodified Diesel injector nozzle model
and modified Diesel injector nozzle are presented in Table 3.3.
Table 3.3: Boundary conditions for simulation of Diesel injector nozzle
Boundary Condition Inlet Cavitation Super Cavitation
Inlet
Normal Speed 14 m/s 14 m/s
Water Volume Fraction 1 1
Water vapour Volume
Fraction 0
0
Outlet Static Pressure 21 bar 11 bar
Symmetry Right and bottom Right and bottom
Wall No slip No slip
Few input parameters were inserted for the cavitation flow. The mean diameter
of the bubble (average diameter of cavitation bubble in a flow) was set to default value
(2.0e-6 m). The saturation pressure of water at 25 degree Celsius was set to 2340 Pa
and the cavitation condensation coefficient was set to 0.01.
Figure 3.10: Trip wire attached at the entrance of the nozzle throat
Trip wire z = 0mm from
throat nozzle.

19
3.1.6 REVIEW AND ANALYSIS OF THE RESULT
There are several comparison steps to analyse the result obtained from the
simulation. Figure 3.11 summarises comparison steps.
Compare the simulation result of the origanal design with the modified design
* Trip wire was attached in at the nozzle entry. The modified design is then simulated using the same simulation setup used for the normal design
*The result obtained from both simulation is then compared to study the effect of trip wire inside the nozzle
Compare result of Martynov (Simulation data) with simulation done for this project (normal design)
* The design of Diesel injector nozzle used in both simulation is based on Roosen (1996) Diesel injector nozzle
* Validation of the simulation setup used for this project
Compare result of Roosen (Experiment data) with Martynov (Simulation data)
* The simulation done by Martynov was based on Roosen (1996) Diesel injector nozzle
Figure 3.11: Steps of analyzing data
20
3.2 KEY MILESTONE
3.3 GANTT CHART
Table 3.1: Gantt chart.
No Details Weeks
1 2 3 4 5 6 7 8 9 10 11 12 13 14 1 Title and Supervisor Allocation
2 Preliminary Research Work
3 Preparing Extended Proposal
4 Submission of Extended
Proposal
5 Proposal Defense
6 Project Work Continues
7 Submission of Interim Draft
Report
8 Submission of Final Interim
Report
Design, Validation and Modification
• Meshing and mesh dependence test were conducted in ANSYS 15.0
• To validate the drawn design, the data obtained from ANSYS 15.0 was compared with Martynov's result.
• Modification done by attaching trip wire at the nozzle throat entrance.
Figure 3.12: Key Milestone.

21
CHAPTER 4:
RESULT AND DISCUSSION
4.1 OVERALL RESULT SUMMARY
4.1.1 RESULT FOR UNMODIFIED DIESEL INJECTOR NOZZLE MODEL
The working fluids for the simulation were water at 25 degree Celsius and
water vapour at 25 degree Celsius. Boundary conditions as mentioned in methodology
part were used for the simulation. Figure 4.1, Figure 4.2 and Figure 4.3 show the result
obtained from the simulation for inlet cavitation flow for the unmodified Diesel
injector nozzle model.
Figure 4.1: Total pressure for inlet cavitation flow (unmodified)
Figure 4.2: Water velocity for inlet cavitation flow (unmodified)
Figure 4.3: Water vapour volume fraction for inlet cavitation flow (unmodified)

22
The same simulation setup was used for the super-cavitation flow. The only varying
parameter for the super-cavitation flow is the outlet pressure, P2. Figure 4.4, Figure
4.5 and Figure 4.6 show the result obtained for the super-cavitation flow of the
unmodified Diesel injector nozzle model.
4.1.2 RESULT FOR MODIFIED DIESEL INJECTOR NOZZLE MODEL
The working fluid for the modified Diesel injector nozzle model were water at
25 degree Celsius and water vapour at 25 degree Celsius. The same simulation setup
as previous model was used to simulate the modified model. Figure 4.7, Figure 4.8
and Figure 4.9 show the result obtained from simulation of modified Diesel injector
nozzle model for the inlet cavitation flow.
Figure 4.5: Water velocity for super-cavitation flow (unmodified)
(unmodified)
Figure 4.6: Water vapour volume fraction for super-cavitation flow (unmodified)
(normal)
Figure 4.4: Total pressure for super-cavitation flow (unmodified)
(normal)
23
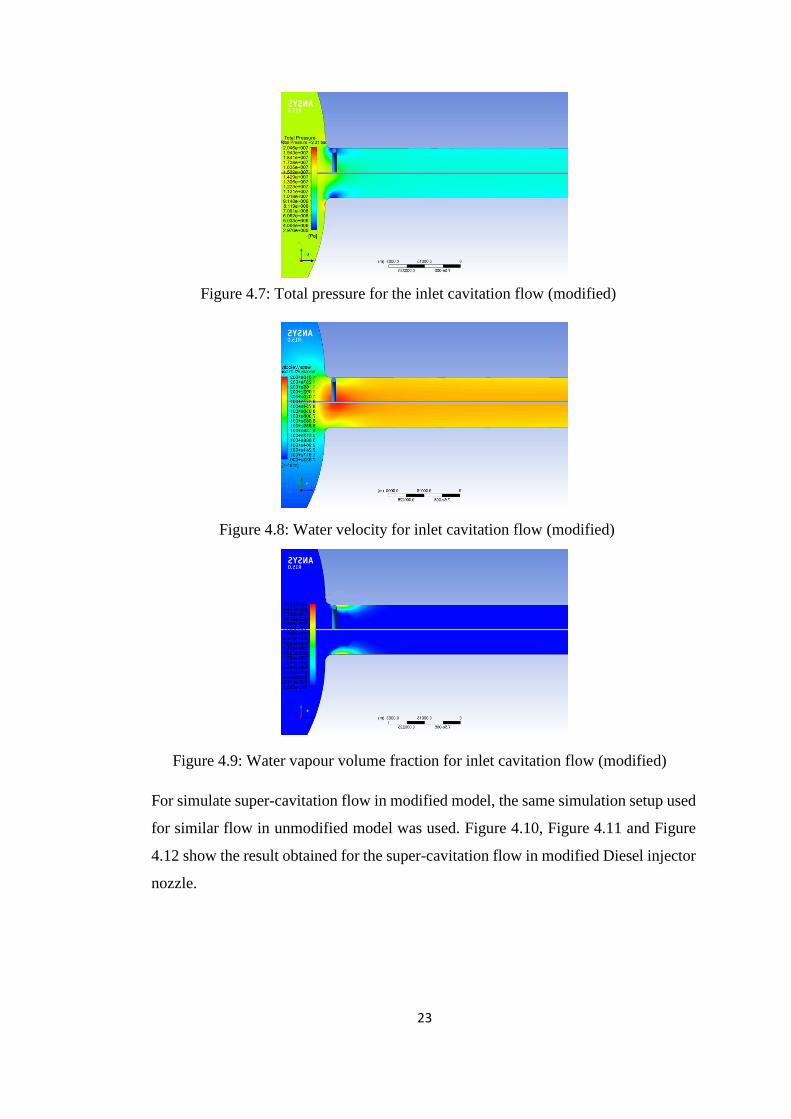
For simulate super-cavitation flow in modified model, the same simulation setup used
for similar flow in unmodified model was used. Figure 4.10, Figure 4.11 and Figure
4.12 show the result obtained for the super-cavitation flow in modified Diesel injector
nozzle.
Figure 4.7: Total pressure for the inlet cavitation flow (modified)
Figure 4.8: Water velocity for inlet cavitation flow (modified)
Figure 4.9: Water vapour volume fraction for inlet cavitation flow (modified)

24
Figure 4.10: Total pressure for super-cavitation flow (modified)
Figure 4.11: Water velocity for super-cavitation flow (modified)
Figure 4.12: Water vapour volume fraction for super-cavitation flow (modified)

25
4.2 COMPARISON BETWEEN DIFFENT DIESEL INJECTOR MODEL
RESULT (ROOSEN (1996) EXPERIMENTAL RESULT, MARTYNOV
(2005) SIMULATION RESULT AND SIMULATION RESULT
OBTAINED FOR THIS STUDY
Roosen (1996) performed experiment on rectangular model of Diesel injector
nozzle. The working liquid for the experiment was tap water. Roosen (1996) observed
vapour pocket at the nozzle entry (inlet cavitation) at injection pressure, P1, of 80 bar
and the outlet pressure, P2, of 21 bar. According to Roosen (1996), at injection
pressure, P1, of 80 bar and the outlet pressure, P2, of 11 bar, he observed super
cavitation flow begins. The velocity of the flow for the both condition is 14 m/s.
Martynov (2005) modeled Roosen’s (1996) diesel injector nozzle. He follows
exactly the same condition as Roosen (1996) for the simulation of both flow.
Specification of number density of critical cavitation nuclei was required for the model
developed by Martynov (1996). Number density of cavitation bubble is number of
bubble present in a cubic meter. This number specify the concentration of bubble in a
flow. Several iterations were done by the author to determine the number density of
cavitation bubble which could match the measured pattern of cavitation flow by
varying the parameter n* = liquid quality. He observed vapour pocket at the throat of
the nozzle with the number density range from n=1.6(1013) (m-3) to n=2.0(1015) (m-3).
For super-cavitation flow, he found out that number density range from n=1.3(1015)
(m-3) to n=2.0(1015) (m-3).
The vapour structures predicted by the model (Figure 4.13, b, c, d and Figure
4.14, b, c) are thinner than the vapour pocket observed by Roosen (1996) (Figure 4.13,
a and Figure 4.14, a). According to Martynov (1996), this can be explained by the
accuracy of prediction of flow separation, which may result from specification nozzle
geometry, model of turbulence and interaction between vapour and liquid phase in
cavitation flow. Figure 4.13 (d) gives the best match with the length of photographed
vapour pocket in Figure 4.13 (a). For the super cavitation flow, Figure 4.14 (c) gives
the best match with the photographed vapour length in Figure 4.14 (a).
For this study, the similar simulation as to Martynov (2005) was carried out.
The result for simulations match quite well to the both previous study results
mentioned above. For the inlet cavitation, the photographed result of Roosen (1996)

26
and both simulation results were not match quite well. This is because the number
density of the nuclei bubble in Roosen (1996) flow was unknown and the number
density in the simulation need to be varied to match the flow pattern of Roosen (1996).
But for the super cavitation flow, simulation result obtained for this study matched
well with Roosen (1996) flow pattern compared with simulation result obtained by
Martynov (2005).
27
(e)
Figure 4.13: Pattern of inlet cavitation flow (photograph by Roosen (1996) (a) in
comparison with the results of numerical predictions of vapour field; (b) - n=1.3(1014)
(m-3); (c) - n=4.4(1014) (m-3); (d) - n=2.0(1015) (m-3); (e) water vapour volume fraction
obtained for this study.

28
(d)
Figure 4.14: Pattern of super-cavitation flow (photograph by Roosen (1996) (a) in
comparison with the results of numerical predictions cavitation pockets using
n=1.3(1014) (m-3) (b), n=4.4(1014) (m-3) (c), water vapour volume fraction obtained for
this study (d).

29
4.4 COMPARISON BETWEEEN UNMODIFIED DIESEL INJECTOR
NOZZLE MODEL AND MODIFIED DIESEL INJECTOR NOZZLE
MODEL.
In this chapter, the modified model’s simulation result was compared with the
unmodified model’s simulation result to study the effects of the modification. Table
4.1 shows the comparison between those two models.
Table 4.1: Water vapour volume fraction contour of unmodified and modified Diesel
injector nozzle
Flow Unmodified Modified
Inlet
Cavitation
Super-
Cavitation
From the Table 4.1, the water vapour length during the inlet cavitation flow
was reduced in the modified model, same goes to the water vapour length during
super-cavitation flow in modified model.
According to Sato & Saito (2001), the trip wire attached at the throat of the
circular orifice, disturbed the flow by increasing the unsteadiness of the flow. Thus,
the frequency of the cloud-like cavity shedding increases. This phenomena was caused
by the shortening of vortex formation interval on the separated shear layer.
Furthermore, the increased frequency cause the shortening of separation bubble
length.
For rectangular model of Diesel injector nozzle, the same phenomena
observed. The attached cavity length reduces, due to the high frequency of cloud-like
cavity shedding process caused by the trip wire attachment. The turbulence intensity
at the outlet is the same as the unmodified model. Only the frequency of shedding
affected, but the amount of bubble coalesced and burst at the outlet still the same for
Trip wire z = 0mm from
throat nozzle.

30
modified model. Since the length of attached cavity in the modified model reduced for
both flow, the hydraulic flip can be prevented.
Contour produced by Mesh 4 has a little difference from the contour of mesh
2. The mesh 4 has a more accurate result compared to mesh 2. But the time taken to
complete the simulation was nearly 10 hours.
(a) (b)
Figure 4.15: Water vapour volume fraction contour for the super cavitating flow
using different mesh element sizes; (a) mesh 4; (b) mesh 2.
Trip wire z = 0mm from
throat nozzle.

31
CHAPTER 5:
CONCLUSION & RECOMMENDATION
5.1 CONCLUSIONS
As a conclusion, this project deals with the production of cavitation
inside the diesel injector nozzle which increases the efficiency of the
atomization process. The atomization process is very important in diesel
engine. The condition and parameters that contribute to hydraulic flip is
studied. To prevent hydraulic flip in the rectangular model of Diesel injector
nozzle, attachment of trip wire introduced in the nozzle. The trip wire alter
the characteristic of the separated shear layer by changing periodic behavior
of shedding process. The shedding frequency of cloud-like cavity from the
attached cavity increased by the attachment of trip wire. Higher frequency
relates to shorter length of cavitation area. This study is within capability of
a final year student to be executed with help and guidance from the
supervisor and the coordinator.
5.2 RECOMMENDATION
Recommendation for this study will be vary the diameter and thickness of the
trip wire attached in the nozzle. For the future study, the location of the trip wire
attached at nozzle can be varied within the nozzle throat length. Last recommendation
to carry this study in future is to conduct experimental study on effect of trip wire
inside the rectangular model of diesel injector nozzle to verify the simulation result.

32
6.0 REFERENCES
Arcoumanis, C. F. (1999). Investigation of cavitation in a vertical multi-hole diesel
injector. SAE Paper.
Ashley, S. (1997). Diesel cars come clean. Mechanical Engineering, vol. 8, p. 1.
B., B., G., C., G., H., J., A. R., & R., S. S. (2009). Cavitation and Hydraulic Flip in
the Outward-Opening GDi Injector Valve-Group . SAE International, 1-9.
Bergwerk, W. (1959). Flow pattern in diesel nozzle spray holes. Proc. Inst. Mech.
Engrs, 173.
Brennen, C. (1995). Cavitation and Bubble Dynamics. Oxford University Press.
Karasawa, T. (1992). Effect of nozzle configuration on the atomization of steady
spray. Atomization and Sprays, 411-426.
Lecoffre, Y. (1999). Cavitation: bubble trackers. Rotterdam, 399.
Martynov. (2005). Numerical Simulation of the Cavitation Process in Diesel Injector
Nozzle. The University of Brighton.
Nurick, W. H. (1976). Orifice cavitation and its effects on spray mixing. J. Fluids
Engng, 98.
P., S. D., & L., C. M. (2001). The internal flow of diesel fuel injector nozzles: A
review. International Journal of Engine Research, 1-20.
Ranz, W. (1958). Some experiments on orifice sprays. Can. J. Chem. Engng, 175.
Roosen, e. a. (1996). Untersuchung und Modeleirung des transienten Verhaltens von
Kavitationserscheinungen bei ein- und mehrkomponentigen Kraftstoffen in
schnell durchstromten Dusen. Report of the Institute for Technical
Thermodynamics.
Sato, K., & Saito, Y. (2001). Unstable cavitation behaviour in circular-cylindrical
oriffice flow. CAV2001.
Soteriou, C. A. (1999). Further studies of cavitation and atomization in diesel
injection. SAE Paper.
Sou, A. H. (2007). Effects of Cavitation in a Nozzle on Liquid Jet. Intl. J. Heat Mass
Trans, 17-18.

33
7.0 APPENDIX
Skewness is defined as the difference between the shape of the
cell and the shape of an equilateral cell of equivalent volume. Highly
skewed cells can decrease accuracy and destabilize the solution. For
example, optimal quadrilateral meshes will have vertex angles close to
90 degrees, while triangular meshes should preferably have angles of
close to 60 degrees and have all angles less than 90 degrees. A general
rule is that the maximum skewness for a triangular/tetrahedral mesh in
most flows should be kept below 0.95, with an average value that is
significantly lower. A maximum value above 0.95 may lead to
convergence difficulties and may require changing the solver controls,
such as reducing under-relaxation factors and/or switching to the
pressure-based coupled solver.


![Visualization of Unsteady Behavior of Cavitation in ... · cavitation state, transition-cavitation state, and super-cavitation state in the orifice throat [5]. Under relative high](https://img.dokumen.tips/doc/110x75/5b4f673e7f8b9a166e8c4c74/visualization-of-unsteady-behavior-of-cavitation-in-cavitation-state-transition-cavitation.jpg)