Embed Size (px)
Citation preview

- 0 -
EXECUTIVE MBA PROGRAMME IN AGRIBUSINESS AND COMMERCE
FACULTY OF AGRICULTURE, UNIVERSITY OF ZAGREB
FINAL THESIS PAPER
UTILIZATION OF IPA-RD PROGRAMME IN THE REPUBLIC OF CROATIA
STUDENT: JOSIP VRBANEK mag.ing.agr.
MENTOR: JOSIP JURAČAK, doc.dr.sc.
Zagreb, March 2016
Revision January 2017

- 1 -
LIST OF ABBREVIATIONS
A
ARPA - Agency for the Audit of European Union Programme Implementation System
ASS - Agricultural Advisory Service
AS - Advisory Service
C
CAACP - Croatian Agricultural Acquis Cohesion Project
CAA - Croatian Agricultural Agency
CAO - Competent Accrediting Officer
CASME - Croatian Agency for SME
CAA - Croatian Agriculture Agency
CBRD - Croatian Bank for Reconstruction and Development
CCA - Croatian Chamber of Agriculture
CCE - Croatian Chamber of Economy
CCTC - Croatian Chamber of Trades and Crafts
CFCA - Central Finance and Contracting Agency
D
DG AGRI - European Commission's Directorate-General for Agriculture and Rural
Development
E
EC - European Commission
ENRD - European Network for Rural Development
EU - European Union
I
IPA - Instrument for Pre-accession Assistance
IPARD - Instrument for Pre-accession Assistance - Rural Development
L
LAG - Local Action Group
LEADER - Liaison Entre Actions de Développement de l’Economie Rurale

- 2 -
M
MoA - Ministry of Agriculture
MA - Managing Authority
MC - Monitoring Committee
MCPP - Ministry of construction and physical planning
MENP - Ministry of Environmental and Nature Protection
MFIN - Ministry of Finance
MRDEUF - Ministry of Regional Development and EU Funds
MIFF - Multi-Annual Indicative Financial Framework
MIPD - Multi Annual Indicative Planning Document
N
NAO - National Authorizing Officer
NF - National Fund
O
OG - Official Gazette
P
PAAFRD - Paying Agency for Agriculture, Fisheries and Rural Development
PRAG - Practical Guide to EC External Aid Contract Procedure
R
RC - Republic of Croatia
RDP – Rural Development Programme

- 3 -
SUMMARY
IPA-RD is the 5th component of the Instrument for Pre-Accession Assistance which is a pre-
accession program of the European Union established in 2007. The Agriculture and Rural
Development Plan - IPARD Programme 2007-2013 defines the following three priorities for
utilization of the component funds:
1. Improving market efficiency and implementation of Community standards
2. Preparatory actions for implementation of the agri-environmental measures and local
rural development strategies
3. Development of rural economy
The implementation of IPARD Programme started in 2010 and in-depth analyses of its
utilisation are missing. Official annual reports on the implementation are available at the
managing authority web site, but for better insight additional research is needed.
Main goal of this research is to assess the level of success in the IPAR Programme
implementation for the period 2010-2013 taking into consideration available measures,
geographical distribution, size and type of beneficiaries.
In addition, available data was used to determine the most important obstacles in the programme
implementation.
This research is based mainly on the Annual Report on Implementation of the IPARD
Programme in the Republic of Croatia from 2010 to 2014 as approved by the IPARD
Monitoring Committee and EC. Other sources of information are from the Paying Agency for
Agriculture, Fisheries and Rural Development (PAAFRD), and from available published
materials. In addition, the author’s private information base and experience in project
management consulting work gathered since 2011 is used.
We consider that this thesis is contributing to knowledge base about IPARD Programme and
about EU funds available in Croatia and candidate countries in general. The results can also
help to improve implementation of similar programmes in future since it indicates main
problems affecting the absorption of the programme funds. This work can be also used in
connection with utilisation of the EAFRD which started in Croatia in 2015.
Keywords: IPARD, PAAFRD, Croatia, support, EU funds, Rural Development

- 4 -
CONTENT:
1. INTRODUCTION ......................................................................................................... - 7 -
2. OBJECTIVE .................................................................................................................. - 9 -
3. MATERIAL AND METHODS OF RESEARCH ..................................................... - 11 -
4. LITERATURE REVIEW ............................................................................................ - 12 -
5. RESEARCH AND RESULTS .................................................................................... - 13 -
5.1. GENERAL SOCIO-ECONOMIC SITUATION IN CROATIA .......................... - 13 -
5.1.1. Agricultural sector ......................................................................................... - 13 -
5.1.2. Differences in EU and Croatian economy ..................................................... - 15 -
5.2. THE HISTORY OF EU FUNDS IN CROATIA .................................................. - 17 -
5.3. IPARD PROGRAM ............................................................................................. - 18 -
5.4. IPARD MEASURES ............................................................................................ - 19 -
5.4.1. Measure 101. ................................................................................................. - 19 -
5.4.2. Measure 103 .................................................................................................. - 21 -
5.4.3. Measure 202 .................................................................................................. - 22 -
5.4.5. Measure 302 .................................................................................................. - 25 -
5.4.6. Measure 501 .................................................................................................. - 26 -
5.4.7. Amendments and modifications of IPARD Programme ............................... - 27 -
5.5. THE DATA SOURCES ....................................................................................... - 30 -
5.5.1. Total IPARD allocation for period 2007-2014 ............................................. - 31 -
5.5.2. Progress in implementation of IPARD measures 101 and 103 ..................... - 32 -
5.5.3. Progress in implementation of IPARD Measures 201 and 202 .................... - 46 -
5.5.4. Progress in implementation of IPARD measures 301 and 302 ..................... - 48 -
5.5.5. Progress in implementation of IPARD program Measure 501 ..................... - 54 -
5.5.6. Results of all IPARD measures in Croatia .................................................... - 56 -
5.5.7. Average, maximum and minimum paid support ........................................... - 58 -
5.5.8. Geographical distribution of IPARD program .............................................. - 62 -
5.5.9. Type and size of beneficiary ......................................................................... - 68 -
6. PROBLEMS IN IMPLEMENTATION OF IPARD ................................................... - 69 -
7. EX-POST EVALUATION IPARD PROGRAMME .................................................. - 72 -
8. COCLUSIONS ............................................................................................................ - 74 -
9. REFERENCES ............................................................................................................ - 76 -

- 5 -
LIST OF TABLES:
Table 1 - Prorities, objectives and measures of the IPARD programme in the RC .............. - 8 -
Table 2 - Difference between Croatian and EU economy .................................................. - 16 -
Table 3 Total IPARD allocation for Croatia for period 2007-2014 in EUR ....................... - 31 -
Table 4 – First Call for IPARD measures 101 and 103 ...................................................... - 32 -
Table 5 – Second Call for IPARD measure 101 and 103 .................................................... - 33 -
Table 6 – Third Call for IPARD measure 101 and 103....................................................... - 34 -
Table 7 – Fourth Call for IPARD measure 101 and 103 ..................................................... - 35 -
Table 8 – Fifth Call for IPARD measure 101 and 103 ........................................................ - 36 -
Table 9 – Sixth Call for IPARD measure 101 and 103 ....................................................... - 37 -
Table 10 – Seventh Call for IPARD measure 101 and 103 ................................................ - 38 -
Table 11 – Eight Call for IPARD measure 101 and 103 ..................................................... - 39 -
Table 12 – Ninth Call for IPARD measure 101 and 103 .................................................... - 40 -
Table 13 – Tenth Call for IPARD measure 101 and 103 .................................................... - 41 -
Table 14 - All IPARD calls for measure 101 and 103 ........................................................ - 42 -
Table 15 - First call for IPARD measures 202 .................................................................... - 46 -
Table 16 - Second call for IPARD measure 202 ................................................................. - 47 -
Table 17 - First call for IPARD measure 301 ..................................................................... - 48 -
Table 18 - Second call for IPARD measure 301 ................................................................. - 49 -
Table 19 - Third Call for IPARD measure 301 ................................................................... - 49 -
Table 20 - Results of all calls for IPARD measure 301 ...................................................... - 50 -
-Table 21 - First Call for IPARD measure 302 ................................................................... - 51 -
Table 22 - Second Call for IPARD measure 302 ................................................................ - 51 -
Table 23 - Third Call for IPARD measure 302 ................................................................... - 52 -
Table 24 - Fourth Call for IPARD measure 302 ................................................................. - 53 -
Table 25 - All Calls for IPARD measure 302 ..................................................................... - 53 -
Table 26 - Result of IPARD measure 501 ........................................................................... - 55 -
Table 27 - Total results of all IPARD measures in Croatia till 02/02/2016 ........................ - 56 -
Table 28 - Paid support per year ......................................................................................... - 57 -
Table 29 - All contracted and paid support throughout Croatian Counties ....................... - 62 -
Table 30 - All beneficiaries of IPARD regarding private/public sector.............................. - 68 -
Table 31 - Financing IPARD projects - example ................................................................ - 70 -

- 6 -
LIST OF GRAPHS:
Graph 1 - Applied, contracted and realized projects for measures 101 and 103 ................. - 43 -
Graph 2 - Percentage of contracted and realized projects ................................................... - 43 -
Graph 3 - Number of contracted projects per measure ....................................................... - 44 -
Graph 4 - Applied, contacted and realized support ............................................................. - 44 -
Graph 5 - Measure 101 - representation share per sector and year ..................................... - 45 -
Graph 6 - Measure 103 - representation share per sector and year ..................................... - 45 -
Graph 7 - Paid support for Measure 202 ............................................................................. - 47 -
Graph 8 - Measure 301 - state of applications per sector .................................................... - 50 -
Graph 9 - Measure 302 - state of applications per sector .................................................... - 54 -
Graph 10 – Percentage of total paid support versus total available IPARD funds ............. - 57 -
Graph 11 - Contracted projects through all IPARD measures ............................................ - 58 -
Graph 12 - Number of applications and contracted support ............................................... - 59 -
Graph 13 - Average support per project in HRK ................................................................ - 60 -
Graph 14 - Percentage of realized project in number and value ......................................... - 61 -
Graph 15 - Realized projects through the measures ............................................................ - 61 -
Graph 16 - Number of contracted projects per county ........................................................ - 63 -
Graph 17 - Contracted investment per county .................................................................... - 64 -
Graph 18 - Contracted support per county .......................................................................... - 64 -
Graph 19 - Number of realized projects per county ............................................................ - 65 -
Graph 20 - Paid support per county .................................................................................... - 65 -
Graph 21 - Average paid support per project ...................................................................... - 66 -
Graph 22 - Regional statistic of IPARD projects ................................................................ - 67 -

- 7 -
1. INTRODUCTION
IPARD is a pre-accession program of the European Union for the period 2007 – 2013. It is an
integral part of IPA (Instrument for Pre-Accession Assistance), i.e. - its 5th component - the
Rural Development. The main goal of IPARD program is to improve the agricultural sector
through competitiveness of agricultural products. The IPARD program has three priority axes:
Priority Axis 1 - Improving market efficiency and implementing Community
standards
Priority Axis 2 - Preparatory actions for implementation of the agri-
environmental measures and LEADER (a program that enables creation and co-
financing of projects that include various motives/subjects of interest to the people
living in certain regions or micro-regions, regardless of the existing administrative
boundaries)
Priority Axis 3 - Development of rural economy
Those three priorities present the backbone of the Croatian European future since the measures
are implemented almost identically through the EAFRD (European Agricultural Fund for Rural
Development)1. This was a unique opportunity for the Republic of Croatia to prepare itself of
a specific approach to financing of agriculture and rural development. The beneficiaries of
IPARD program are (depending of a measure) farmers/ family farms within the payers of VAT
system, craftsmen, small businesses or companies – no limitations in that sense exist.
IPARD Programme2 had been prepared by the Committee for Preparation of the Agriculture
and Rural Development Plan 2007-2013. The Committee had been established on 7 April 2006.
Committee consisted of the members of the MAFRD, employees of the other ministries and
representatives of all relevant economic, social and ecological partners. After preparation of
sector analyses, specific needs of respective sectors have been established and measures of
IPARD Programme had been selected accordingly.
1 Rural Development Programme of the Republic of Croatia for the Period 2014-2020, (Ministry of Agriculture,
2016) 2 IPARD Programme 2007 - 2013 Agriculture and Rural Development Plan (Republic of Croatia, Ministry of
Agriculture Zagreb, September 2013.)

- 8 -
Table 1 - Prorities, objectives and measures of the IPARD programme in the RC
Source: Croatian Ministry of Agriculture, IPARD programme, 2014
IPARD Programme is implemented within the whole territory of the Republic of Croatia, unless
the prescribed criteria of respective measures do not limit its implementation.
Legal basis
IPARD Programme had been given a positive opinion on 19 December 2007 from the
Committee for Rural Development in Brussels and EC adopted IPARD Programme on 25
February 2008.
Pursuant to the Multi-Annual Indicative Financial Framework (MIFF) 2012-20133, funds for
all beneficiary countries were allocated, and that for the RC as well for all IPA components,
within the period 2007 - 2013 on the annual level.
The purpose of the Multi-Annual Indicative Planning Document (MIPD) 2011-2013 is to
establish EU's priorities in assisting the RC within the programme period 2011-2013.
The Government of the Republic of Croatia, on behalf of the RC, has concluded agreements
with the EC on behalf of the EU, which are required for the implementation of the IPARD
Programme, as follows:
3 1. Instrument for Pre-Accession Assistance (IPA) Multi-annual Indicative Planning Document (MIPD)
2011-2013, Croatia (2015)
PRIORITY AXIS SPECIFIC OBJECTIVE MEASURE
101 Investments in agricultural
holdings to restructure and to
upgrade to Community standards
103 Investments in the processing
and marketing of agriculture and
fishery products to restructure
those activities and to upgrade
them to Community standards
201 Actions to improve the
environment and the countryside
202 Preparation and
implementation of local rural
development strategies
301 Improvement and
development of rural infrastructure
302 Diversification and
development of rural economic
activities
3. Development of the rural
economy
Creating better living conditions in
rural areas by improving rural
infrastructures and promoting
business activities.
2. Preparatory actions for
implementation of the Agri-
environmental measures and local
rural development strategies
Strengthening and improvement of
the capacity for implementation of
obligatory pilot projects in Agri
–environment and the LEADER
based approach
1. Improving market efficiency and
implementation of Community
standards
Strengthening and improvement of
the agricultural production and
market capacity

- 9 -
The Framework Agreement between the Government of the RC and the Commission of
the European Communities on the Rules of Co-operation concerning EC Financial
Assistance to the RC in the Framework of the Implementation of Assistance under the
Instrument for Pre-accession Assistance (IPA) was signed on 27 August 2007.
The Agreement between the Government of the RC and the Commission of the
European Communities on the Rules of Co-operation Concerning EC Financial
Assistance to the RC and the Implementation of Assistance under Component V
(IPARD) of the Instrument for Pre-accession Assistance (IPA), i.e. Sectoral Agreement,
was concluded on 13 October 2008. The Sectoral agreement was amended in 2011.
The Multi-Annual Financing Agreement 2007 – 2010 between the Commission of
European Communities on behalf of the European Community and the Government of
the RC was signed on 24 July 2009 and it allocated funds for 2007, 2008, 2009 and
2010.
The Agreement between the European Commission and the Government of the
Republic of Croatia amending the Multi-Annual Financing Agreement 2007 – 2010 was
signed on 10 October 2011 and it allocated funds for 2011, and entered into force on 31
July 2012.
The IPARD Programme allows for creating of commitments to the date of implementation of
the new Programme for Rural Development which the RC will use once it becomes a member
of the EU.
National legal frameworks for the implementation of the IPARD Programme in the RC are
Ordinances on the implementation of respective measures.
The Republic of Croatia signed the accession treaty with EU members in Brussels on 9
December 2011 and had an accession status.
The Managing Authority of the IPARD Programme in RC is Directorate for Rural
Development, EU and International Cooperation, Ministry of Agriculture according the
“Regulation on the scope and contents of responsibilities and the authority of bodies responsible
for managing the instrument for pre-accession assistance” (OG 29/12).
2. OBJECTIVE
The implementation of IPARD Programme started in 2010 and in-depth analyses of its
utilization are missing. Official annual4 reports on the implementation are available at the
Managing Authority web site, but for better insight additional research is needed.
Main objectives of the research are to give clear and up to date information of actual usage of
IPARD funds presented in absolute and percentage. Also objective is to give insight of
utilization of IPARD through its 7 measures, geographical distribution, size and type of
beneficiaries. The goal is to find out what was maximum, minimum and average paid subside,
4 Annual Report on Implementation of the IPARD Programme in the Republic of Croatia 2010, Zagreb, 2011
Annual Report on Implementation of the IPARD Programme in the Republic of Croatia 2011, Zagreb, 2012
Annual Report on Implementation of the IPARD Programme in the Republic of Croatia 2012, Zagreb, 2013
Annual Report on Implementation of the IPARD Programme in the Republic of Croatia 2013, Zagreb, 2014
Annual Report on Implementation of the IPARD Programme in the Republic of Croatia 2014, Zagreb, 2015

- 10 -
which measure was most popular, what is percentage of successful realization of IPARD
projects and who were most frequent users of IPARD program.
In addition, available data will be used to determine the most important obstacles in the
programme implementation as well as perceived impacts of the programme on beneficiaries’
business.
This research will be based mainly on the Annual Report on Implementation of the IPARD
Programme in the Republic of Croatia from 2010 to 2013 as approved by the IPARD
Monitoring Committee and EC. Other sources of information will be from the Paying Agency
for Agriculture, Fisheries and Rural Development, and from available published materials. In
addition, the author’s private information base and experience in project management
consulting work gathered since 2011 will be used.
It is expected that this thesis will contribute to knowledge base about IPARD Programme and
about EU funds available in Croatia and candidate countries in general. The results will also
help to improve implementation of similar programmes in future since it will indicate main
problems affecting the absorption of the programme funds. This work can be also used in
connection with utilization of the EAFRD which will start in Croatia in 2015.

- 11 -
3. MATERIAL AND METHODS OF RESEARCH
Materials for this research is divided in two sections:
1. Primary source that was created gathering secondary sources. Main key of this source
is to find what are real results of implementation of IPARD measures in Croatia. In
specific what is overall number of contracted projects, total investment of applied and
contracted projects and what is contracted and payed support through the measures. In
addition in this project will be used own experience and information collected during
author’s professional work, and research studies of other authors such as “Utilization of
pre-accession funds European Union in Croatia” (P.Jakovac and B. Maljković 2009.),
“IPARD yesterday/today/tomorrow (HMRR, 2013), and official reports from Croatian
chamber of commerce.
2. Secondary source are publications on official internet pages of Ministry of Agriculture
(www.mps.hr) and Croatian paying agency (www.PAAFRD.hr). These internet pages
have basic information about IPARD program and main materials will be Official
annual reports on the implementation of IPARD program and view of IPARD users
(contracted projects and paid support). This is also basics for all annual reports for
national and EU official bodies.
Methods of research are:
1. Gathering all official record on implementation of IPARD support mainly from
publication and annual report on IPARD program
2. Extrication of all important information about applied projects. Main focus is on number
of applied projects through measures, number of realized projects and not realized
projects, total investment per segment and finally approved and paid support per project.
Second phase is to present this result regionally trough Croatian counties.
3. Organization of all gathered important information in tabular form
4. Calculating percentage of applied, approved and realized projects with calculation of
total investment and support.
5. Analysis of calculated data and creation of graphical and tabular presentation of data
6. Comparison of paid support with total available support and making conclusion on
IPARD program in Croatia.

- 12 -
4. LITERATURE REVIEW
There is many information about IPARD program in Croatia, especially presentations and
official data regarding IPARD measures (rules for call and opportunities for investor’s) and
contracted and realized projects. There was also many workshops on IPARD topic from
Ministry of Agriculture, Paying agency and other association’s (Croatian chamber of
commerce, Croatian chamber of agriculture and Agricultural advisory services).
Best information about IPARD one can get from official IPARD web pages:
http://www.PAAFRD.hr/ipard-31.aspx
http://www.mps.hr/ipard/
From this web pages one can get all information about IPARD users review (all contracted
projects, paid support, regional dispersion of users), about all IPARD call’s and tender
documentation. These information are very detailed but not structured and consistent. There is
no overview of all IPARD users and statistic reports such as average support per project, total
paid support and finally utilized IPARD support.
Other information on this topic one can get from other research that are usually financed by EU
organization or were obligatory for Croatian government as evaluation process of IPARD
measures. Such documents are:
Annual report on the implementation of the IPARD programme in the republic of
Croatia 2014, June 2015.
European Court of Auditors, Special Report No 14/2011, Has EU assistance
improved Croatia's capacity to manage post-accession-funding?, 2011
Slaven Aljinović, Ex-post Evaluation of the SAPARD, Programme in the Republic of
Croatia (2006 – 2009), 2011
Instrument for Pre-Accession Assistance (IPA) Multi-annual Indicative Planning
Document (MIPD) 2011-2013,
Rural Development in the EU, Statistical and Economic Information, Report 20135
5 1. Rural Development in the EU, Statistical and Economic Information, Report 2013 (European
Commission, Directorate-General for Agriculture and Rural Development, December 2013)

- 13 -
5. RESEARCH AND RESULTS
5.1. GENERAL SOCIO-ECONOMIC SITUATION IN CROATIA
According to the population census from the year 2011, 4,284,889 inhabitants live in the
Republic of Croatia out of which 15.2% is younger than 14 years, 67.1% between 15 and 64
years and 17.7% is older than 65 years. The average age is 41.7 years; 43.4 years in woman
population, 39.9 years in case of man.
According to data’s from 2011, active population in the Republic of Croatia makes 45.6% from
the total number of working-age population. 1,411,000 persons were employed out of which
651,000, i.e. 46% woman.
In the year 2011, drop of employed of 1.5 % in relation to previous year was recorded while
there was 31,000 employed insured farmers. The average monthly net salary per employee in
the Republic of Croatia in 2011 was HRK 5,441.
Croatian economy has recorded slowdown of economic activity and negative rate of change of
gross domestic product (GDP). GDP in 2010 was billion HRK 326.98 (market prices-current)
and was lower in comparison to the year 2009 for 1.4%. GDP was billion HRK 333.95 in 2011
(market prices-current) and was no increase in comparison to the year 2010, i.e. the zero growth
rate. Gross domestic product per inhabitant was EUR 10,158 in 2010, i.e. EUR 10,205 in 2011.
According to data’s from the year 2011, recession left trace also in foreign trade balance. Value
of import in total commodity exchange of the Republic of Croatia is billion EUR 16.28 while
value of export is billion EUR 9.58 in total commodity exchange. Higher value of export then
import resulted with a deficit of billion EUR 6.7. Coverage of import with export was 58.9%.
In the sector of agriculture, forestry and fishery, growth of import in 2011, in comparison to
2010, is recorded with billion EUR 435.67 in 2010 to billion EUR 467,84 in 2011. At the same
time, export is also increased from billion EUR 315.38 in 2010 to billion EUR 362.85 in 2011.
In 2011 in relation to the 2010 in sector of agriculture, forestry and fishery the value of import
was increased for 7%, while the value of export was increased for 13%.
5.1.1. Agricultural sector
Croatia is a land of rich and high quality resources - parcels of land of high fertility, climate
advantages and plenty of water resources. Basic advantages of Croatian agriculture are three
different geographic and climate regions: plains region in the north under the influence of the
continental climate, coastal region in the south under the influence of the Mediterranean climate
and the mountain region in the central part of Croatia. Various types of climate, relief and soil
allows production of a wide range of agricultural products, from farm and industrial crops to
grapes, as well as continental and Mediterranean fruits and vegetables.

- 14 -
By the end of 2012 there were 192.428 agricultural holdings entered into the Register of
Agricultural Holdings which owned 1,064,740 ha of agricultural land. Pursuant to the data from
the Register, the average size of all holdings amounted to 5.53 ha.
The greatest number of holdings, i.e. 94,775 holdings (representing 49.25% of the total number
of holdings from the Register), own less than 3 ha of agricultural parcels of land, whereas
63,991 holdings (representing 33.25% of the total number of holdings from the Register) own
3 to 20 ha of agricultural parcels of land. Number of holdings which do not own any parcels of
land is significant, i.e. 26,102 of holdings do not own agricultural land (representing 13.56% of
the total number of holdings).
As far as utilisation of agricultural land according LPIS (Land Parcel Identification System),
arable land is the most represented with an area of 805,695 ha and representing 79.51%,
grasslands and pastures represent 139,256 ha, i.e. 13.74% of total areas in the LPIS, whereas
permanent plantations, vineyards, orchards and olive groves together represent 59,304 ha, i.e.
5.85% of the total areas in the LPIS.
Taking into consideration the average size of agricultural holdings as per land ownership, the
largest holdings are located in the counties of the Central and Eastern part of Croatia, where
most of only 4% of agricultural holdings owning parcels larger than 20 ha are located; at the
same time, this category of holdings owns almost 50% of total area. The other share of parcels
is comminute and owned by 158,766 other smaller holdings from the Register, whose size and
structure of the parcels represents a limitation for production intensification.
The areas of organic production have significantly increased and the number of hectares under
arable crops, orchards and olive groves has grown significantly. Until 31 December 2012, 1,757
producers were registered in the Register of Organic Producers which is 17.6% more than the
previous year.
The greatest share of total agricultural areas is located in Slavonia. The mountain region of
Central Croatia is greatly represented in the structure of the agricultural area with grasslands
and pastures, whereas vineyards, olive groves and orchards to some extent represent a
significantly larger share in the total surface of coastal area and islands than in other agricultural
regions.
In comparison with EU-27 countries, less agricultural area per holding is utilised in Croatia.
Dual structure of ownership is characteristic for agricultural parcels in the RC, which is as
follows: agricultural land owned by the state and agricultural land owned by private persons.
Croatia is relatively rich in agricultural areas, but high potentials of grasslands and pastures are
poorly utilised, even though they are a good basis for renewal and increase in livestock fund
and more productive utilisation of land in the direction of reducing of import of milk, cattle and
beef and especially of increased import of pigs and pork.
Due to war events, a significant destruction of production facilities and decrease in livestock
fund occurred in Croatia, as well as a significant decrease in livestock production.
At the end of 2011 there were 446,000 cows, 1,233,000 pigs, 19,000 horses, 639,000 sheep,
70,000 goats, billy goats and goatlings, as well as 9,523,000 poultry, 308,000 bee hives and the
present state has not yet reached the pre-war levels and is still way lower than the needs of the
population, especially below the available production resources.

- 15 -
As far as the organization form of business in 2012 is concerned, most holdings were operated
as family agricultural holdings, i.e. as much as 185,779 holdings (96.54%). 3,240 crafts (1.68%)
were entered into the Register as other organization forms, 2,442 companies (1.25% of
holdings), 657 cooperatives (0.34% of holdings) and 196 (0.1%) other organization forms of
agricultural holdings.
A rather large number of small family holdings points to a low level of organization of the
producers, which weakens their influence on the market. About one half of the total number of
agricultural holdings refers to commercial holdings, whereas the other half refers to agricultural
producers with lower production volumes, producing for their own needs and partially for sales
on the market.
Despite significant production capacities, the RC is still a net importer of most agricultural
products, the most important of which are livestock, meat and meat products, as well as fruits
and vegetables. Self-sufficiency or surplus has been reached in the case of wheat, which was
grown on 149,797 ha in 2011 and amounted to 782,499 tons, as well as in case of corn, grown
on 305,130 ha and production of 1,733,664 tons, and production of poultry meat, eggs, honey,
wine and mandarins.
Decrease and stagnation at small comminuted agricultural areas and very high level of food
import is a sign that investments are required for further restructuring within the Croatian
agricultural sector.
Aligning of the national agricultural policy with that of the EU aims at an increase of production
and improvement of economic results within the agricultural sector. Furthermore, an increase
in activities and orientation toward profitable production and high-quality products under a
higher level of diversification and organization can contribute to a preservation of production,
tradition and culture, as well as survival of small holdings as keepers of rural space.
5.1.2. Differences in EU and Croatian economy
On 1 July 2013, Croatia joined the European Union but, unfortunately lot of statistic studies
indicate that Croatia is far from EU standards. The GDP per capita in Croatia is among the
lowest of the EU. With EUR 10,300 in 2012, it comes to only 40% of the EU-27 average (EUR
25,600); only Bulgaria, Romania, Hungary and Poland arrive at lower values. In purchasing
power standards, Croatia reaches 61% of the EU-27 average. As for the EU as a whole, both
GDP per capita and purchasing power standards are particularly low in the rural regions of
Croatia. Only half of the population was employed in 2012; this is significantly less than for
the EU as a whole (64%). Consequently, the unemployment rate in Croatia (15.9%) was higher
than in the EU-27 (10.5%) and particularly the youth unemployment rate (15- 24 years) was
the third highest in the EU (43.1%), only exceeded by Greece (55.3%) and Spain (53.2%). In
Croatia, employment rates in thinly populated, intermediate and densely populated areas are
very similar, with differences of only 2 percentage points (higher in densely populated areas).
The rate of self-employment is slightly higher in Croatia (14.6%) than in the EU-27 (14.5%).
The total poverty rate in Croatia (32.7%) is higher than in the EU-27 (24.2%), and is indeed the
fifth-highest among EU Member States. Here, the difference between thinly populated (~ rural)

- 16 -
and densely-populated (~ urban) areas is particularly high with 11.6 percentage points (5.9
percentage points in the EU-27).
The primary sector (agriculture, forestry and fishing) plays a more important role in Croatia
than in most other parts of the EU. With 5% of total GVA it is clearly less important than the
secondary (industry and construction; 26%) or tertiary (services; 69%) sector, but only Bulgaria
and Romania reach higher values (6.4% and 6%, respectively). In terms of employment,
however, the picture is slightly different: Here, Croatia's primary sector only offers 4.7% of all
jobs15, while the EU-27 average stands at 5.2%. Nine EU countries have a higher share of
primary sector employment, led by Romania with 30.6%.
Consequently, labour productivity in Croatia's primary sector is higher than in many other EU
countries. With EUR 26 500 per employed person it is right in the middle of the group. Contrary
to most other EU countries16, labour productivity in Croatia's primary sector is higher than in
its secondary sector, and very close to that of its tertiary sector.
Table 2 - Difference between Croatian and EU economy
Source: MA
Croatia EU-27
Primary sector (agriculture, forestry, fishing) 5% 1.7%
Secondary sector (industry and construction) 26% 25.3%
Tertiary sector (services) 69% 73.0%
Rural 44.2% 13.5%
Intermediate 22.5% 26.1%
Urban 33.3% 47.3%
Primary 4.7% 5.2%
Secondary 31.3% 22.6%
Tertiary 64.0% 72.2%
Rural 48.3% 20.4%
Intermediate 23.0% 33.8%
Urban 28.7% 45.1%
Primary EUR 26 497/person EUR 17 308/person
Secondary EUR 20 770/person EUR 57 775/person
Tertiary EUR 26 642/person EUR 52 233/person
Rural EUR 24 399/person EUR 32 712/person
Intermediate EUR 26 045/person EUR 38 088/person
Urban EUR 30 925/person EUR 51 652/person
GVA by sector
GVA by type of region
Employment by sector
Employment by type of region
Labour productivity by sector
Labour productivity by type of region

- 17 -
5.2. THE HISTORY OF EU FUNDS IN CROATIA
The European Union provides assistance programs for Croatia since 1991, when in the middle
of war there was need for humanitarian and reconstruction assistance for social and public
infrastructure, as well as the revitalization of the economy. After these difficult years that were
marked by programs aimed for recovery of the Croatian war suffering (OBNOVA), assistance
continued through other programs. The Republic of Croatia, as a potential EU member, has
used the program Reconstruction in the period from 1996 until 2000 (financing primarily the
war-torn regions). From the year 2001 until 2004, the Republic of Croatia used the CARDS
(Community Assistance for Reconstruction, Development and Stabilization) program funds,
intended for technical and financial aid to the EU countries of SE Europe in the Stabilization
and Association Process. The CARDS Program constituted of two components: national and
regional. The national component was intended for the CARDS program recipient countries
individually, whereas the regional component financed activities implemented by several
program recipient countries in the regions in which their joint action lead to more efficient
results. The implementation of projects from the CARDS Program lasted until 31 December
2009.
The Republic of Croatia gained the status of a candidate country in the year 2004, and thus the
first generation of pre-accession programs became available: PHARE (Pologne Hongrie Aide
a la reconstruction économique). Croatia has used it since 2005. The program aimed at
preparing the candidate countries to implement the EU Community acquis, and using the
structural and the cohesion funds after accession. The program implementation ended on 30
October 2010.
The ISPA financed infrastructural projects concerning transport infrastructure and environment
protection. The program implementation ended on 31 December 2011.
SAPARD (Special Pre-accession Assistance for Agriculture and Rural Development) aid for
financing projects concerning agriculture and rural development, for implementing the
Community acquis with respect to the Common Agricultural Policy (CAP)6, and preparing the
candidate countries for use of the agricultural and fisheries funds after becoming a European
Union member country. The SAPARD implementation ended on 31 December 2009.
Since the year 2007, Croatia has been using the IPA funds. IPA includes five components:
IPA I - strengthening capacity and institutions. The target is to meet economic, political
and other criteria for EU accession, and maintenance of the criteria even after joining
the EU.
IPA II - cross-border co-operation. Provides support to programmes that refer to cross-
border co-operation of the border regions of the RCro and the neighbouring countries.
IPA III - regional development - supports infrastructural projects in the segments of
environment protection and traffic, and programmes of stimulating competitiveness and
regional development.
IPA IV - human potential development, targeting employment, education, professional
training and social integration.
6 The Common Agricultural Policy Explained, European Commission of the European Union (DG AGRI, 2004)

- 18 -
IPA V - rural development - IPARD- promotion of agricultural sector and strengthening
the competitiveness of agricultural products, improving market efficacy and EU
standards implementation, and development of rural economy.
IPARD
The IPARD funds are allocated to the candidate countries and the potential EU membership
candidates. The programme priorities include advanced market efficiency, rural economy
development and support to preparations for implementing rural development measures and
strategies. The IPARD is conducted in the form of a Calls for Proposal (announced by the
Paying Agency for Agriculture, Fisheries and Rural Development - PAAFRD). The Calls for
Proposal can be found on the web sites of the PAAFRD and the Ministry of Agriculture.7
5.3. IPARD PROGRAM
The IPARD Programme 2007 – 20138 constitutes a strategy which aims to tackle specific
drawbacks in the rural areas in Croatia which were identified in the analysis of strengths,
weaknesses, opportunities and threats (SWOT) of the agricultural and rural sector in Croatia9.
In accordance with the IPA Regulation and the conditions lay down in the framework of the
Accession Partnership, Community support is provided for sustainable agriculture and
sustainable rural development measures for the pre-accession period within priority areas.
Taking into account the results of the SWOT analysis and the shortcuts in the implementation
of the above described National Agricultural and Fishery Strategy of the Republic of Croatia,
the identified development priority areas of the IPARD Programme are as follows:
PRIORITY AXIS 1: Improving market efficiency and implementation of Community
standards
PRIORITY AXIS 2: Preparatory actions for implementation of the agri-environmental
measures and local rural development strategies
PRIORITY AXIS 3: Development of rural economy
The three priority axes focus on the economic development of specific sub sectors or following
a territorial approach. General objectives of IPARD programme are to certain extent linked to
Lisbon and Gőteborg declarations, concerning support to diversification of economic activities,
development of small and middle entrepreneurship and special care for environment protection.
Due to limited financial volume it was indispensable to make clear-cut choices on the specific
aims, which are to be achieved in each priority field and which meet an urgent need for
intervention. Therefore, the specific objectives of the IPARD Programme will only partly cover
the difficulties illustrated in the SWOT analysis of the agricultural sector and the rural areas in
Croatia. The IPARD measures will complement the implementation of the National
7 Agriculture, Fisheries and Rural Development, 2010
Agriculture, Fisheries and Rural Development, 2012 8 Agriculture and Rural Development Plan 2007 – 2013 (directorate for rural development, June 2009) 9 Agriculture and Rural Development Plan - IPARD Programme 2007-2013 - 6th amendments (directorate of rural
development, eu and international cooperation, September 2013.)

- 19 -
Agricultural and Fishery Strategy. Based on Act of State Aid for Agriculture, Fishery and
Forestry, Croatian Government supports development of agricultural sector and rural areas
through national support schemes. National support is focused on wide range of beneficiaries
(farmers, noncommercial producers, local self-government, associations and cooperatives, etc.)
and wide range of investments.
On the other hand, IPARD founds are targeted to limited number of sectors, eligible investments
and final beneficiaries. They are focused at viable producers, with clear priority objective to
support them in upgrading to Community standards and facilitate their competitiveness.
National schemes and IPARD funds in that way complement each other by providing necessary
support to different beneficiaries with division of objectives.
The IPARD assistance can also contribute to a sustainable and social coherent rural
development process consistent with international environmental practices by developing the
rural economy, enhancing income and providing and securing employment opportunities in the
rural areas to counterbalance disparities between regions and compared to urban areas, as well
as to develop and rehabilitee basic rural infrastructure, also in war effected areas.
5.4. IPARD MEASURES
5.4.1. Measure 101.
Measure 101: Investments in agricultural holdings to restructure and to upgrade to Community
standards. Beneficiaries of this measure are private owned entrepreneurs.
Cross sector objectives:
This measure aims at contributing to the implementation of CAP and other related policies
within the scope of investments in agricultural holdings, in particular to the:
Contribution to the preparation of the Candidate Country for its accession to the EU
Upgrading to the Community Standards as regards environmental protection, public
health (food safety and quality), animal and plant health, animal welfare and
occupational safety
Modernisation of production systems aimed at decreasing the pollution of the
environment through agricultural production
Improvement of the overall performance in the production of primary agricultural
products
Improvement of the products’ quality
Reduction of production costs and, thus, increasing the sustainability and
competitiveness of the farmers especially towards accession and future open EU market
Facilitating the competition in the internal market opening new market opportunities for
agricultural products.

- 20 -
Sectors:
Milk sector
Beef sector
Pig sector
Poultry sector
Egg sector
Fruits and vegetables sector
Cereals and oil crops
Aid level:
Amounts in HRK presented below are only for indicative purposes. Beneficiary can claim the
support per one application for the eligible expenditure not less than EUR 13.5 thousand
(100.000 HRK).
Within the timeframe of IPARD and measure 101:
1. Beneficiary can claim the support, irrespective of the total value of investment for the eligible
expenditures not higher than EUR 900 thousand (HRK 6,570,000).
2. Exceptionally, beneficiary can claim the support, irrespective of the total value of investment,
for the eligible expenditures not higher than EUR 2.0 million (14,600,000 HRK), if they relate
exclusively:
to the implementation of the Directive 91/676/EEC (protection of waters against
pollution caused by nitrates from agricultural sources) - construction and/or
reconstruction of manure storage capacities and/or specific equipment of facilities for
handling and usage of animal manure
to the implementation of Directive 99/74/EEC (minimum standards for the protection
of laying hens) in eggs sector - reconstruction and/or equipment facilities (cages)
Aid intensity, expressed as the share of public support in the eligible expenditures of the
investment, amounts up to:
50% or
55% if the investment is made by young farmer (under 40 years of age at the time when
the decision to grant support is taken, possessing adequate occupational skills and
competence) or
60%, if the investment is made in mountain area
65%, if the investment is made by young farmer in mountain area or

- 21 -
75%, if the investment relates exclusively to the implementation of Council Directive
91/676/EEC subject to the existence of a national strategy for its implementation
5.4.2. Measure 103
Measure 103: “Investments in the processing and marketing of agriculture and fishery products
to restructure those activities and to upgrade them to Community standards”. Beneficiaries of
this measure are private owned entrepreneurs.
Cross sector objectives
This measure aims at contributing to the implementation of CAP and other related
policies within the scope of investments in agricultural holdings, in particular to the:
Contribution to the preparation of the Candidate Country for its accession to the EU.
Adjustment of agricultural and fisheries processing plants to meet EU minimum
standards related to hygiene, public health, animal welfare, occupational safety and
environmental conditions
Improvement of the animal waste management situation through investment in
collecting centers for animal waste
Improvement of marketing channels for the primary producers in the agricultural and
fisheries sector by improved access to processing facilities
Improvement of overall performance in the processing and marketing of primary
agricultural and fishery products
Facilitation the competition in the internal market by the introduction of new
technologies and innovation
Opening new market opportunities for agricultural products, putting emphasis on the
alignment to the Community standards.
Sectors:
Milk and dairy sector
Meat sector
Fisheries
Fruit and vegetables processing industry
Wine sector
Olive oil sector
- 22 -
Aid level:
Amounts in HRK presented below are only for indicative purposes. Beneficiary can claim the
support per one application (investment/project) for the eligible expenditure not less than EUR
33.8 thousand (HRK 250,000) or not less than EUR 13.5 thousand (HRK 100,000) for the wine
and olive oil sector.
Within the timeframe of IPARD and measure 103, beneficiary can claim the support,
irrespective of the total value of investment for the eligible expenditures not higher than:
EUR 3.0 million (HRK 21,900,000), except in the olive sector
EUR 500 thousand (HRK 3,650,000), in the olive sector
Aid intensity, expressed as the share of public support in the eligible expenditures of the
investment amounts up to 50%.A maximum of five eligible investments per beneficiary are
allowed. The application for the next investment can be brought in only after finalization (final
payment) of the previous investment. The payments for the investments shall be received in
one instalment subject to the details fixed in the contract signed between the beneficiary and
the Paying Agency.
5.4.3. Measure 202
Measure 202: Preparation and implementation of local rural development strategies.
Beneficiaries’ of this measure is public sector.
Cross sector objectives
LEADER approach is aiming at the promotion of rural development through local initiatives
and partnerships. The general objectives of the LEADER approach under IPARD are:
to improve rural living and working conditions, including welfare,
to create new, sustainable income earning opportunities,
to preserve and create jobs,
to diversify economic activities
More specifically the objectives are:
to encourage and develop capacities of rural population to act together also through
cooperation projects,
to develop integrated local development strategies and to prepare the implementation of
those,
to promote local initiatives and partnership through involvement of local communities
as well as representatives of business and local government,

- 23 -
to transfer achievements, experiences and expertise and to make available information
and conclusions
The operational objectives are as follows:
to enhance capacity among rural inhabitants and LAG members through training and
education,
to develop, organize and run LAGs,
to prepare and begin implementation of the LDS through local projects.
Sectors:
LEADER approach in Croatia was supported through:
Measure Technical Assistance, for capacity building of potential LAGs (TA activity"
Acquisition of skills and animating the inhabitants of rural territories")
Measure 202, Sub-measure 1, for capacity building of selected LAGs (Sub-measure
"Acquisition of skills, animating the inhabitants of LAG territories")
Measure 202, Sub-measure 2, for running the selected LAGs (Sub-measure
"Implementation of local development strategies")
Aid level:
The eligible expenditures for this Sub-measure are:
Salaries for the LAG manager and/or other LAG employees,
Office rent and overheads
Office materials (stationery ect)
Purchase of equipment, including IT equipment, furnishings
Services (IT specialists, accountants, etc.).
Aid intensity, expressed as the share of public support in the eligible expenditures amounts to
up to 100%, where the EU contribution is 80%.

- 24 -
5.4.4. Measure 301
Measure 301: Improvement and development of rural infrastructure. Beneficiaries’ of this
measure is public sector (small cities, municipalities, counties, etc.)
Cross sector objectives
This measure aims at contributing to the implementation of CAP and other related policies
within the scope of the development and improvement of the basic rural infrastructure, in
particular to:
Development and improvement of the basic infrastructure to foster economic and social
activities for a balanced growth
Improvement of the rural living and working conditions
Improvement of the rural depopulation situation, mainly to give incentives for the active
population to retain in and / or return to the rural areas.
Sectors:
Sewerage system and wastewater treatment
Local unclassified roads
Heating plants
Fire prevention passage with elements of forest road as defined by ordinance on
protection of forest from fire
Aid level:
Aid intensity, expressed as the share of public support in the eligible expenditures of the
investment amounts
up to 100% (75% EU, 25% national funds) per investments not of a nature to generate
substantial net revenue; Aid intensity, expressed as the share of public support in the
eligible expenditures of the investment amounts
up to 100% (75% EU, 25% national funds) per investments not of a nature to generate
substantial net revenue;
Maximum eligible expenditures per investment (project) are:
EUR 405.000 (HRK 3 million) for investments in local unclassified roads or fire
prevention roads
EUR 958.000 (HRK 7 million) for investments in sewerage system and wastewater
treatment plants or heating plants
Within the timeframe of IPARD and measure 301, beneficiary can claim the support,
irrespective of the total value of investment for the eligible expenditures not higher than EUR
1,363,000 (HRK 10.000.000)

- 25 -
5.4.5. Measure 302
Measure 302: Diversification and development of rural economic activities Beneficiaries of this
measure are private owned entrepreneurs.
Cross sector objectives
This measure aims at contributing to the implementation of CAP and other related policies
within the scope of investments in rural areas, in particular to:
Increased income of the beneficiary rural population through the development and
diversification of on-farm and/or off-farm rural activities
Creation of new employment opportunities through the development and diversification
of on-farm and/or off-farm rural activities
Preservation of existing working places
Increased the volume of services for rural inhabitants and improve the quality of the
services provided
Improvement of social structure in the rural areas
Sectors:
Rural tourism
Traditional crafts
Direct marketing
Services
On-farm processing plants
Freshwater aquaculture
Renewable energy
Aid level:
Aid intensity, expressed as the share of public support in the eligible expenditures of the
investment amounts up to 50%.Maximum eligible expenditure per investment (project) is EUR
150,000 (HRK 1,095,000), except in renewable energy resources where maximum eligible
expenditure per investment is EUR 675,000 (HRK 5,000,000).Maximum three eligible
investments per beneficiary within the timeframe of IPARD are allowed, out of which only one
can be in renewable energy resources. The application for the next investment can be brought
in only after finalisation (final payment) of the previous investment.

- 26 -
Within the timeframe of IPARD and measure 302, beneficiary can claim the support,
irrespective of the total value of investment for the eligible expenditures not higher than:
EUR 975,000, if one of the investments relates to renewable energy resources or
EUR 450,000, in all other cases.
The payments for the investments shall be received in one instalment according to the details
fixed in the contract signed with the Paying Agency.
5.4.6. Measure 501
Measure 501: technical assistance. Beneficiaries’ of this measure is public sector (Ministry of
Agriculture).
Cross sector objectives
The objectives of this measure are to assist in particular in implementation and monitoring of
the programme and its possible subsequent modification. In support of these aims, the
objectives include:
• To provide support for the monitoring of the programme
• To ensure an adequate flow of information and publicity
• To support studies, visits and seminars
• To provide support for external expertise
• To provide support for the evaluation of the programme
• To provide support for the future implementation of a national rural development
network
Final beneficiary
The beneficiary of activities under the measure for Technical Assistance is the Ministry of
Agriculture, Fisheries and Rural Development, Managing Authority of the Programme.
Aid level:
The Community contribution to the eligible expenditure shall be limited to 80% of total public
expenditure. It is expected that approximately 30% of the Technical Assistance measure
annually will be allocated for sub – measure 1 within Measure 202 "Preparation and
implementation of local rural development strategies".

- 27 -
5.4.7. Amendments and modifications of IPARD Programme
On 25 February 2008, the European Commission adopted the IPARD Programme for the
Republic of Croatia within the framework of the IPA Programme - Component V - Rural
development. Since then, seven amendments to the IPARD Programme were proposed and
adopted. The first amendments to the Programme were approved by Commission Decision
C(2008) 6123 of 27 October 2008, the second were approved on 10 September 2009 by
Decision C(2009) 6770, the third by Decision C(2010) 8462 of 26 November 2010, the fourth
by Decision C(2012) 374 of 25 January 2012, the fifth by Decision C(2012)7820 of 06
November 2012, the sixth by Decision C(2013)6856 of 18 October 201310 and seventh by
Decision C(2014)9619 of 10 December 201411.
The first amendments pertain to amendments for adopting a new MIPD, amendments of a
technical nature, amendments to criteria including changes to the numbers of food business
establishments that handle food of animal origin.
The second amendments are also related to the adoption of a new MIPD, to the correction of
errors of technical nature, as well as amendments to criteria (the most significant being the
amendment of criteria that pertain to slaughterhouse capacities).
The third and most comprehensive amendments to the IPARD Programme are a result of
proposals submitted by the PAAFRD, various agricultural producers and processing
companies, producer associations, the Croatian Chamber of Economy, the Croatian Employers'
Association, and other economic interest associations. The amendments mainly pertain to
Measures 101 and 103.
The most important changes to Measure 101 were changes in upper quantitative thresholds of
eligible investments, expanded sectors, new types of investments were enabled, especially in
milk production (sheep and goat), cow-calf system production, planting orchards and table
grapes plantations, reconstruction of vineyards and olive groves, open field irrigation, ULO
cold stores. Investments in the poultry sector were also added, i.e. the existing eligible
investments were expanded to include poultry breeding farms, waste management, wastewater
treatment and prevention of air pollution as well as biogas plants. Legal persons with integrated
production were included as beneficiaries on the levels of micro, small and medium-sized
enterprises, or if they are outside of those levels, but are obliged to comply with the IPPC
Directive.
In regard to Measure 103, investments in the fruit and vegetable processing sector were made
eligible, since the criterion pertaining to the establishment of producer organisations was
repealed, sectors were expanded, enabling new types of investments into processing medicinal,
culinary and aromatic herbs, meat processing, investments in waste management, wastewater
treatment and prevention of air pollution, quantitative minimum and maximum criteria for milk
producers included on the non-compliance list were repealed. The entities obliged to comply
10 Commission Implementing Decision C(2013) 6856 of October 2013 amending Commission Decision
C(2008)690 of 25 February 2008 approving the Programme for Agriculture and Rural Development of the
Republic of Croatia under the instrument for pre-accession assistance (IPA, 15/09/2015) 11 Commission Implementing Decision C(2014) 9619 of December 2014 amending Commission Decision
C(2008)690 of 25 February 2008 approving the Programme for Agriculture and Rural Development of the
Republic of Croatia under the instrument for pre-accession assistance (IPA, 15/09/2015)

- 28 -
with the IPPC Directive were introduced as new beneficiaries, provided that they do not
increase production capacities, and investments pertaining to compliance with EU
environmental protection standards were made eligible for beneficiaries.
The fourth amendments to the IPARD Programme, in addition to amendments of a technical
nature and more precise wording, also introduced the change whereby the capacity of a facility
is taken into account in regard to the number of enclosures, while previously only the minimum
or the maximum number of animals was stated. Investments in construction and/or
reconstruction and/or equipment of mushroom production facilities were made eligible in the
fruit and vegetables sector, which was transferred from Measure 302. A minimum value of
eligible investments amounting to EUR 13.5 thousand was introduced for the olive oil sector
within Measure 103. In Measure 302, in the rural tourism sector, investments were made
eligible not only in category D settlements and other non-classified settlements, but also in
those classified under category C. The maximum capacity for freshwater fisheries was
amended. In the sector of processing on agricultural holdings, eligible investments in fish
processing, the processing of culinary, medicinal and aromatic herbs, and mushroom processing
were added. In Measure 301, local unclassified roads sector, the conditions for road dedication
were amended and it was explicitly stated that a beneficiary can be granted support for eligible
expenditures in the amount no higher than EUR 1,363,000 during the Programme. Moreover,
during the fourth amendments to the Programme, Measure 202 was fully reorganized. The
Measure consists of two sub-measures "Acquisition of skills and animating the inhabitants of
LAG territories" and "Implementing Local Development Strategies" whose beneficiaries are
selected LAGs, who sign a Contract with the PAAFRD on the allocation of IPARD Programme
funds for the co-financing of LAGs.
The fifth amendments to the IPARD Programme were adopted by the Monitoring Committee
on 28 June 2012, and approved by the EC on 06 November 2012.
Amendments to Measure 101:
- a new type of investment was introduced in all sectors – investments in agricultural machinery
and equipment (for basic and additional processing, fertilisation, sowing, planting, plant
protection, harvesting and transport), including tractors;
- the maximum tractor power is 100 kW, and a beneficiary can be awarded support for the
procurement of one tractor in the course of IPARD duration;
- with the basic objective of preserving the environment, eligible investments were expanded
to include renewable energy sources on farms with the possibility of utilising all renewable
energy sources.
The amendments to Measure 103 pertained to the wine and olive oil sector:
- existing eligible investments were expanded;
- a new type of investment was introduced (investment in equipment for processing pomace
into pellets);
- alignment with other sectors with regard to wastewater treatment, air filtration and cooling
systems.

- 29 -
The amendments to Measure 302 added eligible investments in the services sector, namely
investments in hairdresser's shops and nursing homes. Furthermore, with regard to indicators,
the number of received applications and the number of contracted applications were added as
output indicators. The allocation for 2012 was added to the financial tables, and the allocation
for 2008 was reduced due to de-commitment.
The sixth amendments to the IPARD Programme were adopted by the Monitoring Committee
on 12 June 2013, and approved by the EC on 18 October 2013. The Programme amendments
pertain to the reallocation of financial resources. The allocation for 2013 was added in the
amount of EUR 27,700,000, and the allocation for 2009 was reduced due to de-commitment of
a portion of the funds. The funds earmarked for Measure 201 were fully reallocated. The funds
for Measure 501 were reduced, and the funds for Measures 101 and 301 were increased. The
sixth amendments will not have a substantial impact on further Programme implementation.
The seventh amendments to the IPARD Programme were adopted by the Monitoring
Committee on 12 June 2014, and approved by the EC on 10 December 2014. The Programme
amendments pertain to the reallocation of financial resources. The allocation for 2010 was
reduced due to de-commitment of a portion of the funds. Funds were transferred from M301 to
M101, so the lacks of funds for M101 are covered, while M301 has sufficient funds to pay all
the projects that have signed memorandums of understanding. Overall, it increased the total
funding for M101, accordingly for Priority 1, and relatively reduced funding for M301 and
Priority 3. These amendments ensured sufficient funds for all IPARD projects while a further
correction (following de-commitment for 2011 and the needs of the contract in force, taking
into account the possibility of financing measures 101 and 103 from the RDP 2014-2020) will
be made in the next amendments.

- 30 -
5.5. THE DATA SOURCES
The study included desk-top analysis from information available on official IPARD pages,
www.PAAFRD.hr (Agencija za plaćanja u poljoprivredi, ribarstvu i ruralnom razvoju, eng.
Paying Agency for Agriculture, Fisheries and Rural Development), other available sources
from Ministry of Agriculture12 and other evaluation reports and studies on this topic13.
The analysis is based on different IPARD measures:
Measure 101 Investments in agricultural holdings to restructure and to upgrade to
Community standards
Measure 103 “Investments in the processing and marketing of agriculture and fishery
products to restructure those activities and to upgrade them to Community standards”
Measure 201.: Actions to improve the environment and the countryside
Measure 202.: Preparation and implementation of local rural development strategies
Measure 301.: Improvement and development of rural infrastructure
Measure 302.: Diversification and development of rural economic activities
Measure 501: Technical assistance
Only Measure 201 weren’t available for application because the content was never opened.
Main information was taken from two documents available on www.PAAFRD.hr;
Registered user of IPARD founds – Contracted Projects till 03. December 2014.
Registered users of IPARD founds – Paid Projects till 03. December 2014.
In the period from 04 January 2010 to 03 December 2014, a total of 20 calls were implemented
for measures of IPARD program. In the year 2010, 3 calls for the Measure 101 and 103. In the
year 2011, 7 calls were implemented, 3 of them for the Measures 101 and 103, 2 calls for the
Measure 301 and 2 calls for the Measure 302. During the year 2012, 5 calls were implemented,
2 of them for the Measures 101 and 103, 1 for the Measure 301 and 2 calls for the Measure 302.
In the year 2013 there were 4 calls implemented, 1 of them for Measures 101 and 103, 2 for
Measure 202 and 1 for measure 501. In year 2014 there was only one call for Measures 101 and
103.
12 Source: www.mps.hr (15/09/2015) 13 Cornuelois consulting SARL, IPARD On-going evaluation report, March 2012
(Annual report on the implementation of the IPARD programme in the Republic of Croatia, December 2013)

- 31 -
5.5.1. Total IPARD allocation for period 2007-2014
Table 3 Total IPARD allocation for Croatia for period 2007-2014 in EUR
Source: Self-made according to information available on official web pages of PAAFRD (www.apprrr.hr)
We can see that total allocation for IPARD 2007-2013 was EUR 184,370,000. Allocation was from EUR 25.5 million to 27.7 million EUR per
year. Most funds was allocated to Axis 1, measure 101 and 103. Axis 3 with measures 301 and 302 was second largest, with measure 301 much
larger than measure 302. Measure 202 and 501 were smallest in funds with little more than 6 % of all funds. Measure 201 was never opened.
YEAR 2007 2008 2009 2010 2011 2012 2013 2007-2013 % 2014 2007-2014
Priority 1 (Axis 1) 17.595.000 16.896.000 16.770.000 16.380.000 16.430.000 15.271.200 15.512.000 114.854.200 62,30% 50.000.000 164.854.200
Measure 101 8.797.500 8.448.000 8.385.000 8.190.000 8.215.000 7.635.600 7.756.000 57.427.100 31,15% 35.000.000 92.427.100
Measure 103 8.797.500 8.448.000 8.385.000 8.190.000 8.215.000 7.635.600 7.756.000 57.427.100 31,15% 15.000.000 72.427.100
Priority 2 (Axis 2) 0 0 0 1.300.000 1.590.000 1.608.930 1.634.300 6.133.230 3,33% 0 6.133.230
Measure 201 0 0 0 0 0 0 0 0 0,00% 0 0
Measure 202 0 0 0 1.300.000 1.590.000 1.608.930 1.634.300 6.133.230 3,33% 0 6.133.230
Priority 3 (Axis 3) 7.140.000 7.680.000 7.998.000 7.800.000 7.950.000 9.844.470 9.999.700 58.412.170 31,68% 0 58.412.170
Measure 301 5.355.000 5.760.000 5.998.500 5.850.000 5.962.500 7.384.716 7.501.160 43.811.876 23,76% 0 43.811.876
Measure 302 1.785.000 1.920.000 1.999.500 1.950.000 1.987.500 2.459.754 2.498.540 14.600.294 7,92% 0 14.600.294
Measure 501 (TA) 765.000 1.024.000 1.032.000 520.000 530.000 545.400 554.000 4.970.400 2,70% 0 4.970.400
TOTAL 25.500.000 25.600.000 25.800.000 26.000.000 26.500.000 27.270.000 27.700.000 184.370.000 100,00% 50.000.000 234.370.000

- 32 -
5.5.2. Progress in implementation of IPARD measures 101 and 103
The first call for the Measures 101 and 103 lasted from 04/01/2010 to 04/03/2010. The results of implementation of this call are shown in the table
below.
Table 4 – First Call for IPARD measures 101 and 103
Source: PAAFRD
There was total 37 applications with total investment over HRK 153 million, and requested support over 78 million HRK. Only 13 contracts were
realized with investment over HRK 61 million, and paid support of over 31 million HRK. This call is absolutely finished because all approved
projects are realized and for all of them support is paid.
STATUSNO. OF
APPLICATIONSPERCENTAGE TOTAL INVESTMENT PERCENTAGE APROVED SUPPORT (HRK) PERCENTAGE
REQUESTED /
CONTRACTED
SUPPORT
(HRK/1.000.000)
AVERAGE SUPPORT
PER PROJECT
Applied projects 37 100,00% 153.010.541,83 100,00% 78.053.524,71 100,00% 78,05 2.109.554,72
Measure 101 26 70,27% 74.380.940,58 48,61% 38.786.261,40 49,69% 38,79 1.491.779,28
Measure 103 11 29,73% 78.629.601,25 51,39% 39.267.263,31 50,31% 39,27 3.569.751,21
Refused 17 45,95% 55.765.722,08 36,45% 28.241.219,85 36,18% 28,24 1.661.248,23
Withdrawed applications 2 5,41% 24.881.236,87 16,26% 12.440.618,32 15,94% 12,44 6.220.309,16
Terminated contracts 5 13,51% 7.145.116,21 4,67% 3.987.169,11 5,11% 3,99 797.433,82
Measure 101 contracted 11 42,31% 38.564.821,71 51,85% 19.981.219,84 51,52% 19,98 1.816.474,53
Measure 103 contracted 2 18,18% 25.410.477,78 32,32% 12.705.238,89 32,36% 12,71 6.352.619,45
Total contracted project's 13 35,14% 63.975.299,49 41,81% 32.686.458,73 41,88% 32,69 2.514.342,98
Realized projects and paid support 13 35,14% 61.738.436,27 96,50% 31.550.791,89 96,53% 31,55 2.426.983,99

- 33 -
The second call for the Measures 101 and 103 lasted from 17/05/2010 to 07/06/2010. The results of implementation of this call are shown in the
table below.
Table 5 – Second Call for IPARD measure 101 and 103
Source: PAAFRD
There was total 13 applications with total investment over HRK 59 million, and requested support over HRK 30 million. Only 8 contracts were
realized with investment over HRK 29 million, and paid support of over HRK 14 million.
STATUSNO. OF
APPLICATIONSPERCENTAGE TOTAL INVESTMENT PERCENTAGE APROVED SUPPORT (HRK) PERCENTAGE
REQUESTED /
CONTRACTED
SUPPORT
(HRK/1.000.000)
AVERAGE SUPPORT
PER PROJECT
Applied projects 13 100,00% 59.512.796,17 100,00% 30.262.146,48 100,00% 30,26 2.327.857,42
Measure 101 8 61,54% 24.344.857,29 40,91% 12.678.177,04 41,89% 12,68 1.584.772,13
Measure 103 5 38,46% 35.167.938,88 59,09% 17.583.969,44 58,11% 17,58 3.516.793,89
Refused 3 23,08% 13.895.514,09 23,35% 7.350.500,42 24,29% 7,35 2.450.166,81
Withdrawed applications 0 0,00% 0,00 0,00% 0,00 0,00% 0,00 0,00
Terminated contracts 1 7,69% 1.254.193,32 2,11% 627.096,66 2,07% 0,63 627.096,66
Measure 101 contracted 4 50,00% 9.148.589,67 37,58% 4.625.586,10 36,48% 4,63 1.156.396,53
Measure 103 contracted 5 100,00% 32.199.567,97 91,56% 16.099.783,99 91,56% 16,10 3.219.956,80
Total contracted project's 9 69,23% 41.348.157,64 69,48% 20.725.370,09 68,49% 20,73 2.302.818,90
Realized projects and paid support 8 61,54% 29.886.708,08 72,28% 14.994.505,80 72,35% 14,99 1.874.313,23

- 34 -
The third call for the Measures 101 and 103 lasted from 01/07/2010 to 05/11/2010. The results of implementation of this call are shown in the table
below.
Table 6 – Third Call for IPARD measure 101 and 103
Source: PAAFRD
There was total 26 applications with total investment over HRK 104 million, and requested support over HRK 51 million. 15 contracts were realized
with investment over HRK 68 million, and paid support of over HRK 36 million.
STATUSNO. OF
APPLICATIONSPERCENTAGE TOTAL INVESTMENT PERCENTAGE APROVED SUPPORT (HRK) PERCENTAGE
REQUESTED /
CONTRACTED
SUPPORT
(HRK/1.000.000)
AVERAGE SUPPORT
PER PROJECT
Applied projects 26 100,00% 104.273.699,94 100,00% 51.099.557,75 100,00% 51,10 1.965.367,61
Measure 101 21 80,77% 64.266.396,76 61,63% 32.807.700,86 64,20% 32,81 1.562.271,47
Measure 103 5 19,23% 40.007.303,18 38,37% 18.291.856,89 35,80% 18,29 3.658.371,38
Refused 9 34,62% 15.170.460,82 14,55% 7.971.596,96 15,60% 7,97 885.733,00
Withdrawed applications 1 3,85% 2.452.140,73 2,35% 1.226.070,37 2,40% 1,23 1.226.070,37
Terminated contracts 0 0,00% 0,00 0,00% 23.922.954,73 46,82% 23,92 #DIV/0!
Measure 101 contracted 12 57,14% 44.328.143,54 68,98% 23.922.954,73 72,92% 23,92 1.993.579,56
Measure 103 contracted 4 80,00% 34.451.657,16 86,11% 17.225.828,57 94,17% 17,23 4.306.457,14
Total contracted project's 16 61,54% 78.779.800,70 75,55% 41.148.783,30 80,53% 41,15 2.571.798,96
Realized projects and paid support 15 57,69% 68.810.145,80 87,34% 36.126.664,52 87,80% 36,13 2.408.444,30

- 35 -
The fourth call for the Measures 101 and 103 lasted from 01/02/2011 to 14/03/2011. The results of implementation of this call are shown in the
table below.
Table 7 – Fourth Call for IPARD measure 101 and 103
Source: PAAFRD
There was total 44 applications with total investment over 197 million HRK, and requested support over 88 million HRK. 32 contracts were realized
with investment over 118 million HRK, and paid support of over 59 million HRK.
STATUSNO. OF
APPLICATIONSPERCENTAGE TOTAL INVESTMENT PERCENTAGE APROVED SUPPORT (HRK) PERCENTAGE
REQUESTED /
CONTRACTED
SUPPORT
(HRK/1.000.000)
AVERAGE SUPPORT
PER PROJECT
Applied projects 44 100,00% 197.588.153,45 100,00% 88.902.564,82 100,00% 88,90 2.020.512,84
Measure 101 27 61,36% 85.706.666,21 43,38% 33.197.821,57 37,34% 33,20 1.229.548,95
Measure 103 17 38,64% 111.881.487,24 56,62% 55.704.743,25 62,66% 55,70 3.276.749,60
Refused 7 15,91% 32.220.567,19 16,31% 5.412.183,12 6,09% 5,41 773.169,02
Withdrawed applications 1 2,27% 1.432.506,04 0,72% 716.253,02 0,81% 0,72 716.253,02
Terminated contracts 4 9,09% 13.248.025,04 6,70% 7.364.095,44 8,28% 7,36 1.841.023,86
Measure 101 contracted 21 77,78% 45.017.195,39 52,52% 22.789.302,14 68,65% 22,79 1.085.204,86
Measure 103 contracted 11 64,71% 102.065.892,92 91,23% 51.032.288,09 91,61% 51,03 4.639.298,92
Total contracted project's 32 72,73% 147.083.088,31 74,44% 73.821.590,23 83,04% 73,82 2.306.924,69
Realized projects and paid support 30 68,18% 118.514.613,40 80,58% 59.531.400,61 80,64% 59,53 1.984.380,02

- 36 -
The fifth call for the Measures 101 and 103 lasted from 30/05/2011 to 11/07/2011. The results of implementation of this call are shown in the table
below.
Table 8 – Fifth Call for IPARD measure 101 and 103
Source: PAAFRD
There was total 40 applications with total investment over HRK 192 million, and requested support over HRK 99 million. 19 contracts were realized
with investment over HRK 86 million, and paid grant of support HRK 43 million.
STATUSNO. OF
APPLICATIONSPERCENTAGE TOTAL INVESTMENT PERCENTAGE APROVED SUPPORT (HRK) PERCENTAGE
REQUESTED /
CONTRACTED
SUPPORT
(HRK/1.000.000)
AVERAGE SUPPORT
PER PROJECT
Applied projects 40 100,00% 192.633.763,43 100,00% 99.095.897,74 100,00% 99,10 2.477.397,44
Measure 101 30 75,00% 81.632.144,12 42,38% 43.595.092,07 43,99% 43,60 1.453.169,74
Measure 103 10 25,00% 111.001.619,31 57,62% 55.500.805,67 56,01% 55,50 5.550.080,57
Refused 15 37,50% 55.813.376,36 28,97% 29.510.419,44 29,78% 29,51 1.967.361,30
Withdrawed applications 1 2,50% 1.111.089,10 0,58% 611.099,01 0,62% 0,61 611.099,01
Terminated contracts 2 5,00% 22.352.976,48 11,60% 11.176.488,24 11,28% 11,18 5.588.244,12
Measure 101 contracted 17 56,67% 45.286.857,97 55,48% 23.744.201,92 54,47% 23,74 1.396.717,76
Measure 103 contracted 5 50,00% 67.241.382,54 60,58% 33.620.691,26 60,58% 33,62 6.724.138,25
Total contracted project's 22 55,00% 112.528.240,51 58,42% 57.364.893,18 57,89% 57,36 2.607.495,14
Realized projects and paid support 19 47,50% 86.553.538,88 76,92% 43.801.969,78 76,36% 43,80 2.305.366,83

- 37 -
The sixth call for the Measures 101 and 103 lasted from 17/10/2011 to 28/11/2011. The results of implementation of this call are shown in the table
below.
Table 9 – Sixth Call for IPARD measure 101 and 103
Source: PAAFRD
There was total 61 applications with total investment over HRK 336 million, and requested support over HRK 165 million. 30 contracts realized
with investment support HRK 158 million, and paid support of over HRK 81 million.
STATUSNO. OF
APPLICATIONSPERCENTAGE TOTAL INVESTMENT PERCENTAGE APROVED SUPPORT (HRK) PERCENTAGE
REQUESTED /
CONTRACTED
SUPPORT
(HRK/1.000.000)
AVERAGE SUPPORT
PER PROJECT
Applied projects 61 100,00% 336.100.781,18 100,00% 165.966.289,50 100,00% 165,97 2.720.758,84
Measure 101 44 72,13% 155.909.291,77 46,39% 79.260.567,05 47,76% 79,26 1.801.376,52
Measure 103 17 27,87% 180.191.489,41 53,61% 86.705.722,45 52,24% 86,71 5.100.336,61
Refused 15 24,59% 45.294.985,24 13,48% 23.834.310,28 14,36% 23,83 1.588.954,02
Withdrawed applications 7 11,48% 23.056.941,76 6,86% 11.462.866,54 6,91% 11,46 1.637.552,36
Terminated contracts 7 11,48% 61.751.046,65 18,37% 30.875.523,31 18,60% 30,88 4.410.789,04
Measure 101 contracted 23 52,27% 70.036.400,70 44,92% 37.525.946,21 47,35% 37,53 1.631.562,88
Measure 103 contracted 9 52,94% 119.493.663,48 66,31% 59.746.831,74 68,91% 59,75 6.638.536,86
Total contracted project's 32 52,46% 189.530.064,18 56,39% 97.272.777,95 58,61% 97,27 3.039.774,31
Realized projects and paid support 30 49,18% 158.548.496,98 83,65% 81.113.607,65 83,39% 81,11 2.703.786,92

- 38 -
The seventh call for the Measures 101 and 103 lasted from 02/01/2012 to 29/02/2012. The results of implementation of this call are shown in the
table below.
Table 10 – Seventh Call for IPARD measure 101 and 103
Source: PAAFRD
There was total 40 applications with total investment over HRK 140 million, and requested support over HRK 73 million. 25 contracts were
realized with investment over HRK 89 million, and paid support of over HRK 46 million.
STATUSNO. OF
APPLICATIONSPERCENTAGE TOTAL INVESTMENT PERCENTAGE APROVED SUPPORT (HRK) PERCENTAGE
REQUESTED /
CONTRACTED
SUPPORT
(HRK/1.000.000)
AVERAGE SUPPORT
PER PROJECT
Applied projects 40 100,00% 140.893.061,69 100,00% 73.341.207,88 100,00% 73,34 1.833.530,20
Measure 101 32 80,00% 94.955.003,74 67,40% 50.312.357,23 68,60% 50,31 1.572.261,16
Measure 103 8 20,00% 45.938.057,95 32,60% 23.028.850,65 31,40% 23,03 2.878.606,33
Refused 5 12,50% 8.502.922,45 6,04% 4.318.399,80 5,89% 4,32 863.679,96
Withdrawed applications 3 7,50% 8.953.682,91 6,35% 4.824.851,66 6,58% 4,82 1.608.283,89
Terminated contracts 3 7,50% 9.312.708,13 6,61% 5.067.898,71 6,91% 5,07 1.689.299,57
Measure 101 contracted 23 71,88% 68.213.165,65 71,84% 36.046.113,38 71,64% 36,05 1.567.222,32
Measure 103 contracted 6 75,00% 43.906.179,54 95,58% 21.953.089,75 95,33% 21,95 3.658.848,29
Total contracted project's 29 72,50% 112.119.345,19 79,58% 57.999.203,13 79,08% 58,00 1.999.972,52
Realized projects and paid support 25 62,50% 89.684.211,59 79,99% 46.170.077,24 79,60% 46,17 1.846.803,09

- 39 -
The eight call for the Measures 101 and 103 lasted from 14/05/2012 to 13/07/2012. The results of implementation of this call are shown in the
table below.
Table 11 – Eight Call for IPARD measure 101 and 103
Source: PAAFRD
There was total 56 applications with total investment over HRK 265 million, and requested support over HRK 135 million. 30 contracts were
realized with investment over HRK 132 million, and paid support of over HRK 67 million.
STATUSNO. OF
APPLICATIONSPERCENTAGE TOTAL INVESTMENT PERCENTAGE APROVED SUPPORT (HRK) PERCENTAGE
REQUESTED /
CONTRACTED
SUPPORT
(HRK/1.000.000)
AVERAGE SUPPORT
PER PROJECT
Applied projects 56 100,00% 265.407.398,89 100,00% 135.270.708,28 100,00% 135,27 2.415.548,36
Measure 101 45 80,36% 173.704.929,00 65,45% 89.419.473,31 66,10% 89,42 1.987.099,41
Measure 103 11 19,64% 91.702.469,89 34,55% 45.851.234,97 33,90% 45,85 4.168.294,09
Refused 2 3,57% 22.100.000,00 8,33% 11.050.000,00 8,17% 11,05 5.525.000,00
Withdrawed applications 8 14,29% 32.039.061,30 12,07% 16.414.979,53 12,13% 16,41 2.051.872,44
Terminated contracts 9 16,07% 59.391.223,72 22,38% 30.033.876,84 22,20% 30,03 3.337.097,43
Measure 101 contracted 32 71,11% 108.014.435,37 62,18% 55.787.351,24 62,39% 55,79 1.743.354,73
Measure 103 contracted 5 45,45% 37.243.436,64 40,61% 18.621.718,31 40,61% 18,62 3.724.343,66
Total contracted project's 37 66,07% 145.257.872,01 54,73% 74.409.069,55 55,01% 74,41 2.011.055,93
Realized projects and paid support 30 53,57% 132.022.307,62 90,89% 67.708.727,25 91,00% 67,71 2.256.957,58
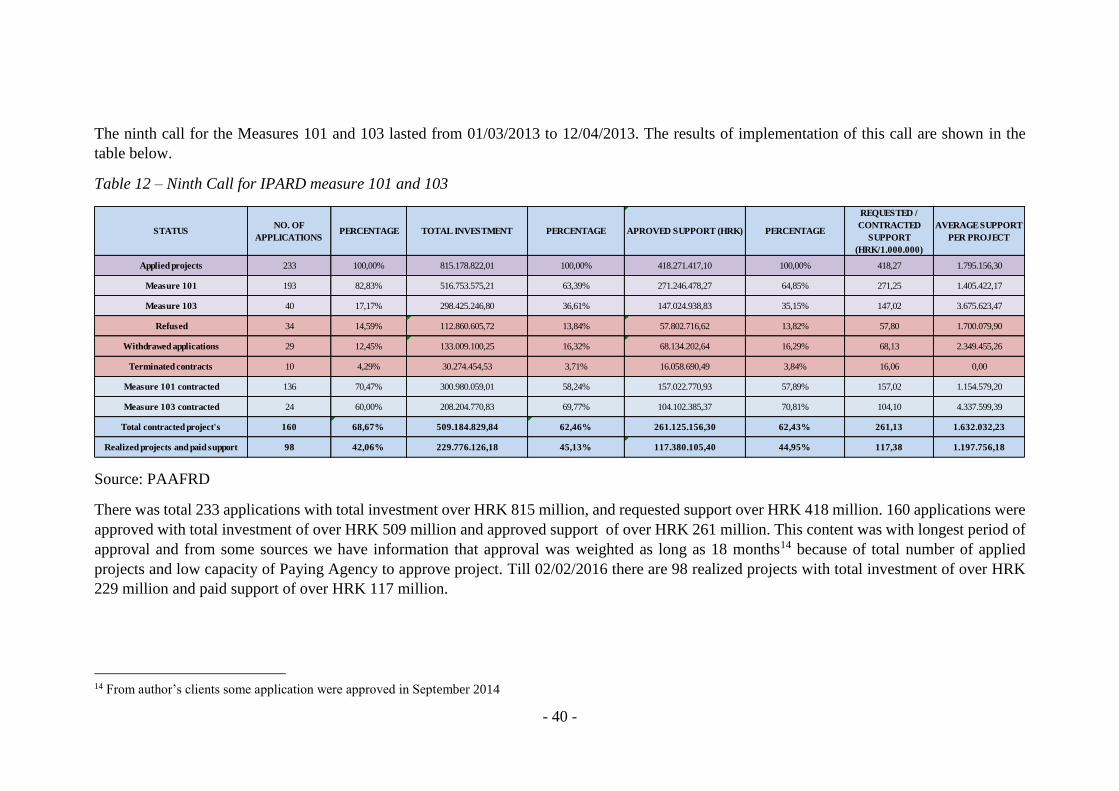
- 40 -
The ninth call for the Measures 101 and 103 lasted from 01/03/2013 to 12/04/2013. The results of implementation of this call are shown in the
table below.
Table 12 – Ninth Call for IPARD measure 101 and 103
Source: PAAFRD
There was total 233 applications with total investment over HRK 815 million, and requested support over HRK 418 million. 160 applications were
approved with total investment of over HRK 509 million and approved support of over HRK 261 million. This content was with longest period of
approval and from some sources we have information that approval was weighted as long as 18 months14 because of total number of applied
projects and low capacity of Paying Agency to approve project. Till 02/02/2016 there are 98 realized projects with total investment of over HRK
229 million and paid support of over HRK 117 million.
14 From author’s clients some application were approved in September 2014
STATUSNO. OF
APPLICATIONSPERCENTAGE TOTAL INVESTMENT PERCENTAGE APROVED SUPPORT (HRK) PERCENTAGE
REQUESTED /
CONTRACTED
SUPPORT
(HRK/1.000.000)
AVERAGE SUPPORT
PER PROJECT
Applied projects 233 100,00% 815.178.822,01 100,00% 418.271.417,10 100,00% 418,27 1.795.156,30
Measure 101 193 82,83% 516.753.575,21 63,39% 271.246.478,27 64,85% 271,25 1.405.422,17
Measure 103 40 17,17% 298.425.246,80 36,61% 147.024.938,83 35,15% 147,02 3.675.623,47
Refused 34 14,59% 112.860.605,72 13,84% 57.802.716,62 13,82% 57,80 1.700.079,90
Withdrawed applications 29 12,45% 133.009.100,25 16,32% 68.134.202,64 16,29% 68,13 2.349.455,26
Terminated contracts 10 4,29% 30.274.454,53 3,71% 16.058.690,49 3,84% 16,06 0,00
Measure 101 contracted 136 70,47% 300.980.059,01 58,24% 157.022.770,93 57,89% 157,02 1.154.579,20
Measure 103 contracted 24 60,00% 208.204.770,83 69,77% 104.102.385,37 70,81% 104,10 4.337.599,39
Total contracted project's 160 68,67% 509.184.829,84 62,46% 261.125.156,30 62,43% 261,13 1.632.032,23
Realized projects and paid support 98 42,06% 229.776.126,18 45,13% 117.380.105,40 44,95% 117,38 1.197.756,18

- 41 -
The tenth call for the Measures 101 and 103 lasted from 04/04/2014 to 18/04/2014. The results of implementation of this call are shown in the
table below.
Table 13 – Tenth Call for IPARD measure 101 and 103
Source: PAAFRD
There was total 106 applications with total investment over HRK 417 million, and requested support over HRK 217 million. Only 47 applications
were approved with total investment of over HRK 121 million and approved support of over HRK 62 million. Till 02/02/2016 there was 21 realized
projects with total investment over HRK 21 million and paid support over HRK 11 million.
STATUSNO. OF
APPLICATIONSPERCENTAGE TOTAL INVESTMENT PERCENTAGE APROVED SUPPORT (HRK) PERCENTAGE
REQUESTED /
CONTRACTED
SUPPORT
(HRK/1.000.000)
AVERAGE SUPPORT
PER PROJECT
Applied projects 106 100,00% 417.406.965,32 100,00% 217.776.031,81 100,00% 217,78 2.054.490,87
Measure 101 94 88,68% 265.393.021,31 63,58% 141.769.059,79 65,10% 141,77 1.508.181,49
Measure 103 12 11,32% 152.013.944,01 36,42% 76.006.972,02 34,90% 76,01 6.333.914,34
Refused 25 23,58% 165.638.810,62 39,68% 87.219.426,34 40,05% 87,22 3.488.777,05
Withdrawed applications 32 30,19% 116.245.686,40 27,85% 61.445.044,61 28,21% 61,45 1.920.157,64
Terminated contracts 2 1,89% 8.143.676,98 1,95% 4.071.838,49 1,87% 4,07 0,00
Measure 101 contracted 41 43,62% 66.746.502,49 25,15% 34.637.694,53 24,43% 34,64 844.821,82
Measure 103 contracted 6 50,00% 54.765.069,13 36,03% 27.382.534,56 36,03% 27,38 4.563.755,76
Total contracted project's 47 44,34% 121.511.571,62 29,11% 62.020.229,09 28,48% 62,02 1.319.579,34
Realized projects and paid support 21 19,81% 21.526.105,51 17,72% 11.366.740,75 18,33% 11,37 0,00

- 42 -
In next table is shown all results for IPARD measures 101 and 103 that are most important for real sector. They also have biggest allocation (over
60% of all IPARD allocation).
Table 14 - All IPARD calls for measure 101 and 103
Source: PAAFRD
We can see that there was 656 application for grant with over HRK 2.682 million investment and requested support of over HRK 1.358 million.
There was 520 applications (79,27%) for measure 101 with total investment of over HRK 1.537 million (57,31%) and 136 applications in measure
103 with total investment of over HRK 1.444 million. We also see that average requested support is around HRK 2 million and it is larger in
measure 103 (HRK 4,1 million) than in measure 101 (HRK 1,5 million).
In total there is 397 approved (contracted) projects with over HRK 1.521 million investment (56,72%) and over HRK 778 million of approved
support. For now there is HRK 997 million realized projects (65,54% of contracted projects) and over HRK 509 million of paid support (65,47 %
of contracted support).
STATUSNO. OF
APPLICATIONSPERCENTAGE TOTAL INVESTMENT PERCENTAGE APROVED SUPPORT (HRK) PERCENTAGE
REQUESTED /
CONTRACTED
SUPPORT
(HRK/1.000.000)
AVERAGE SUPPORT
PER PROJECT
Applied projects 656 100,00% 2.682.005.983,91 100,00% 1.358.039.346,07 100,00% 1.358,04 2.070.181,93
Measure 101 520 79,27% 1.537.046.825,99 57,31% 793.072.988,59 58,40% 793,07 1.525.140,36
Measure 103 136 20,73% 1.144.959.157,92 42,69% 564.966.357,48 41,60% 564,97 4.154.164,39
Refused 132 20,12% 527.262.964,57 19,66% 262.710.772,83 19,34% 262,71 1.990.233,13
Withdrawed applications 84 12,80% 343.181.445,36 12,80% 177.275.985,70 13,05% 177,28 2.110.428,40
Terminated contracts 43 6,55% 212.873.421,06 7,94% 133.185.632,02 9,81% 133,19 3.097.340,28
Measure 101 contracted 320 61,54% 796.336.171,50 51,81% 416.083.141,02 52,46% 416,08 1.300.259,82
Measure 103 contracted 77 56,62% 724.982.097,99 63,32% 362.490.390,53 64,16% 362,49 4.707.667,41
Total contracted project's 397 60,52% 1.521.318.269,49 56,72% 778.573.531,55 57,33% 778,57 1.961.142,40
Realized projects and paid support 289 72,80% 997.060.690,31 65,54% 509.744.590,89 65,47% 509,74 1.763.822,11

- 43 -
Graph 1 - Applied, contracted and realized projects for measures 101 and 103
Source: PAAFRD
We can see that number of applications has risen over the years and that ninth call was with
largest number of applied and contracted projects. In graph below we can see that trend line for
successful contracting and it is slightly positive. Trend line for realized project is negative but
IPARD program is still not over and there is time for realization till September 2016. Because
of this we can expect that there will be more realized projects especially from 9 and 10 call.
Graph 2 - Percentage of contracted and realized projects
Source: PAAFRD, 2016

- 44 -
Graph 3 - Number of contracted projects per measure
Source: PAAFRD, 2016
Graph 4 - Applied, contacted and realized support
Source: PAAFRD, 2016

- 45 -
Graph 5 - Measure 101 - representation share per sector and year
Source: MA, 2015
Graph 6 - Measure 103 - representation share per sector and year
Source: MA, 2015

- 46 -
5.5.3. Progress in implementation of IPARD Measures 201 and 202
At the end of the year 2010, NF withdrew national accreditation of sub-measure 202/1, Measure 202 „Preparation and implementation of local
strategies of rural development” due to understatement of the IPARD program. During the year 2011, a permanent communication with the
representatives of European Commission was held in order to facilitate the implementation of this measure through modifications of the Program
– the Measure 202 was changed by the fourth modifications of the IPARD program. In parallel, the Republic of Croatia includes stakeholders in
the process of making new Ordinance of Implementation of the Measure 202. After approval of the fourth modifications of IPARD programme,
Ordinance on Implementation of the Measure 202 (OG 53/12; 73/12) was published. After receiving conferral of management for the Measure
202, signing the first contracts with selected LAG-s was possible.
This is the reason why there was no call for measure 201, and there was only two calls for measure 202. One was 01/03/2013-02/04/2013 and
second one 16/09/2013-18/10/2013. The results of implementation of this call are shown in the tables below.
Table 15 - First call for IPARD measures 202
Source: PAAFRD, 2016
STATUSNO. OF
APPLICATIONSPERCENTAGE TOTAL INVESTMENT PERCENTAGE APROVED SUPPORT (HRK) PERCENTAGE
REQUESTED /
CONTRACTED
SUPPORT
(HRK/1.000.000)
AVERAGE SUPPORT
PER PROJECT
Applied projects 49 100,00% 28.800.000,00 100,00% 28.800.000,00 100,00% 28,80 587.755,10
Refused 17 34,69% 0,00 0,00% 0,00 0,00% 0,00 0,00
Withdrawed applications 0 0,00% 0,00 0,00% 0,00 0,00% 0,00 0,00
Terminated contracts 2 4,08% 1.800.000,00 6,25% 1.800.000,00 6,25% 1,80 900.000,00
Total contracted project's 30 61,22% 27.000.000,00 93,75% 27.000.000,00 93,75% 27,00 900.000,00
Realized projects and paid support 29 96,67% 18.724.450,19 69,35% 18.724.450,19 69,35% 18,72 645.670,70

- 47 -
Table 16 - Second call for IPARD measure 202
Source: PAAFRD, 2016
There was total 80 applications with total investment over HRK 39 million, with equal requested support (grand is up to 100 % of investment). 42
contracts were signed (projects approved) and 41 were realized with investment and paid grant of over HRK 25 million.
Graph 7 - Paid support for Measure 202
Source: MA, 2015
STATUSNO. OF
APPLICATIONSPERCENTAGE TOTAL INVESTMENT PERCENTAGE APROVED SUPPORT (HRK) PERCENTAGE
REQUESTED /
CONTRACTED
SUPPORT
(HRK/1.000.000)
AVERAGE SUPPORT
PER PROJECT
Applied projects 31 100,00% 10.800.000,00 100,00% 10.800.000,00 100,00% 10,80 348.387,10
Refused 17 54,84% 0,00 0,00% 0,00 0,00% 0,00 0,00
Withdrawed applications 2 6,45% 0,00 0,00% 0,00 0,00% 0,00 0,00
Terminated contracts 1 3,23% 900.000,00 8,33% 900.000,00 8,33% 0,90 0,00
Total contracted project's 12 38,71% 9.900.000,00 91,67% 9.900.000,00 91,67% 9,90 825.000,00
Realized projects and paid support 12 100,00% 6.395.321,10 64,60% 6.395.321,10 64,60% 6,40 532.943,43

- 48 -
5.5.4. Progress in implementation of IPARD measures 301 and 302
During the IPARD program implementation (from 04/01/2010 to 03/12/2014) three calls were announced for the Measure 301 and four for measure
302. The first call for the Measure 301 lasted from 06/12/2010 to 31/01/2011. The results of implementation of this call are shown in the table
below.
Table 17 - First call for IPARD measure 301
Source: PAAFRD, 2016
There was total 67 applications with total investment over HRK 282 million, and requested support over HRK 258 million (grant is up to 100%).
Only 12 contracts were signed (projects approved) and 9 are realized with investment over HRK 24 million, with same paid support.
STATUSNO. OF
APPLICATIONSPERCENTAGE TOTAL INVESTMENT PERCENTAGE APROVED SUPPORT (HRK) PERCENTAGE
REQUESTED /
CONTRACTED
SUPPORT
(HRK/1.000.000)
AVERAGE SUPPORT
PER PROJECT
Applied projects 67 100,00% 282.203.695,26 100,00% 258.584.282,86 100,00% 258,58 3.859.466,91
Refused 53 79,10% 215.794.153,01 76,47% 198.040.371,02 76,59% 198,04 3.736.610,77
Withdrawed applications 1 1,49% 1.526.020,00 0,54% 1.526.020,00 0,59% 1,53 1.526.020,00
Terminated contracts 1 1,49% 4.778.347,62 1,69% 4.778.347,62 1,85% 4,78 4.778.347,62
Total contracted project's 12 17,91% 48.442.847,27 17,17% 48.442.847,27 18,73% 48,44 4.036.903,94
Realized projects and paid support 9 75,00% 24.613.677,25 50,81% 24.613.677,25 50,81% 24,61 2.734.853,03

- 49 -
The second call for the Measure 301 lasted from 16/05/2011 to 13/06/2011. The results of implementation of this call are shown in the table below.
Table 18 - Second call for IPARD measure 301
Source: PAAFRD, 2016
There was total 46 applications with total investment over HRK 188 million, and requested support over HRK 182 million (support is up to 100%).
25 contracts were signed (projects approved) and 20 are realized with investment over HRK 54 million, with same paid support.
The third call for the Measure 301 lasted from 19/03/2012 to 30/05/2012. The results of implementation of this call are shown in the table below.
Table 19 - Third Call for IPARD measure 301
Source: PAAFRD, 2016
STATUSNO. OF
APPLICATIONSPERCENTAGE TOTAL INVESTMENT PERCENTAGE APROVED SUPPORT (HRK) PERCENTAGE
REQUESTED /
CONTRACTED
SUPPORT
(HRK/1.000.000)
AVERAGE SUPPORT
PER PROJECT
Applied projects 46 100,00% 188.654.861,14 100,00% 182.160.408,02 100,00% 182,16 3.960.008,87
Refused 16 34,78% 67.904.313,72 35,99% 62.990.347,13 34,58% 62,99 3.936.896,70
Withdrawed applications 5 10,87% 10.460.613,33 5,54% 10.460.613,33 5,74% 10,46 2.092.122,67
Terminated contracts 0 0,00% 0,00 0,00% 0,00 0,00% 0,00 #DIV/0!
Total contracted project's 25 54,35% 85.140.931,08 45,13% 85.140.931,08 46,74% 85,14 3.405.637,24
Realized projects and paid support 20 80,00% 54.665.815,37 64,21% 54.665.815,37 64,21% 54,67 2.733.290,77
STATUSNO. OF
APPLICATIONSPERCENTAGE TOTAL INVESTMENT PERCENTAGE APROVED SUPPORT (HRK) PERCENTAGE
REQUESTED /
CONTRACTED
SUPPORT
(HRK/1.000.000)
AVERAGE SUPPORT
PER PROJECT
Applied projects 97 100,00% 314.888.644,28 100,00% 314.888.644,28 100,00% 314,89 3.246.274,68
Refused 12 12,37% 43.200.665,95 13,72% 43.200.665,95 13,72% 43,20 3.600.055,50
Withdrawed applications 16 16,49% 62.980.980,02 20,00% 62.980.980,02 20,00% 62,98 3.936.311,25
Terminated contracts 0 0,00% 0,00 0,00% 0,00 0,00% 0,00 #DIV/0!
Total contracted project's 69 71,13% 167.100.088,94 53,07% 167.100.088,94 53,07% 167,10 2.421.740,42
Realized projects and paid support 37 53,62% 62.434.980,35 37,36% 62.434.980,35 37,36% 62,43 1.687.431,90

- 50 -
In the third call for measure 301 there were 97 applications with total investment over HRK 314 million, and requested support over HRK 314
million (support is up to 100%). 69 contracts were signed (projects approved) and 37 are realized with investment over HRK 62 million, with same
paid support. There are still projects that are in process of realization so we can expect new realized projects from this call in 2016 (cut off day for
IPARD is September 2016).
Table 20 - Results of all calls for IPARD measure 301
Source: PAAFRD, 2016
Graph 8 - Measure 301 - state of applications per sector
Source: MA, 2015
STATUSNO. OF
APPLICATIONSPERCENTAGE TOTAL INVESTMENT PERCENTAGE APROVED SUPPORT (HRK) PERCENTAGE
REQUESTED /
CONTRACTED
SUPPORT
(HRK/1.000.000)
AVERAGE SUPPORT
PER PROJECT
Applied projects 210 100,00% 785.747.200,68 100,00% 755.633.335,16 100,00% 755,63 3.598.253,98
Refused 81 38,57% 326.899.132,68 41,60% 304.231.384,10 40,26% 304,23 3.755.943,01
Withdrawed applications 22 10,48% 74.967.613,35 9,54% 74.967.613,35 9,92% 74,97 3.407.618,79
Terminated contracts 1 0,48% 4.778.347,62 0,61% 4.778.347,62 0,63% 4,78 4.778.347,62
Total contracted project's 106 50,48% 300.683.867,29 38,27% 300.683.867,29 39,79% 300,68 2.836.640,26
Realized projects and paid support 66 62,26% 141.714.472,97 47,13% 141.714.472,97 47,13% 141,71 2.147.188,98

- 51 -
First call for measure 302 lasted from 03/01/2011 to 31/03/2011. The results of implementation of this call are shown in the table below.
-Table 21 - First Call for IPARD measure 302
Source: PAAFRD, 2016
In first call for measure 302 there was total 28 applications with total investment over HRK 24 million, and requested support over HRK 12
million. 15 contracts were signed (projects approved) and realized with investment over HRK 12 million, paid support of HRK 6 million.
Second call lasted from 12/09/2011 to 31/10/2011. The results of implementation of this call are shown in the table below.
Table 22 - Second Call for IPARD measure 302
Source: PAAFRD, 2016
STATUSNO. OF
APPLICATIONSPERCENTAGE TOTAL INVESTMENT PERCENTAGE APROVED SUPPORT (HRK) PERCENTAGE
REQUESTED /
CONTRACTED
SUPPORT
(HRK/1.000.000)
AVERAGE SUPPORT
PER PROJECT
Applied projects 28 100,00% 24.542.065,80 100,00% 12.299.896,13 100,00% 12,30 439.282,00
Refused 10 35,71% 6.534.377,31 26,63% 3.334.243,66 27,11% 3,33 333.424,37
Withdrawed applications 0 0,00% 0,00 0,00% 0,00 0,00% 0,00 #DIV/0!
Terminated contracts 3 10,71% 3.264.992,41 13,30% 1.632.496,20 13,27% 1,63 544.165,40
Total contracted project's 15 53,57% 14.297.509,41 58,26% 7.148.691,69 58,12% 7,15 476.579,45
Realized projects and paid support 15 100,00% 12.630.895,29 88,34% 6.315.447,63 88,34% 6,32 421.029,84
STATUSNO. OF
APPLICATIONSPERCENTAGE TOTAL INVESTMENT PERCENTAGE APROVED SUPPORT (HRK) PERCENTAGE
REQUESTED /
CONTRACTED
SUPPORT
(HRK/1.000.000)
AVERAGE SUPPORT
PER PROJECT
Applied projects 28 100,00% 29.326.635,35 100,00% 14.841.456,39 100,00% 14,84 530.052,01
Refused 7 25,00% 6.558.326,71 22,36% 3.824.458,16 25,77% 3,82 546.351,17
Withdrawed applications 1 3,57% 1.123.950,00 3,83% 561.975,00 3,79% 0,56 561.975,00
Terminated contracts 1 3,57% 1.008.733,11 3,44% 504.366,55 3,40% 0,50 504.366,55
Total contracted project's 19 67,86% 19.721.792,58 67,25% 9.860.896,27 66,44% 9,86 518.994,54
Realized projects and paid support 14 73,68% 13.177.705,01 66,82% 6.588.852,49 66,82% 6,59 470.632,32

- 52 -
In second call for measure 302 there was total 28 applications with total investment over HRK 29 million, and requested support over HRK 14
million (grant is up to 50%, and no more than EUR 75.000, except for renewable energy projects). 19 contracts were signed (projects approved)
and 14 realized with investment over HRK 13 million, and paid support of HRK 6.5 million.
Third call lasted from 02/01/2012 to 29/02/2012. The results of implementation of this call are shown in the table below.
Table 23 - Third Call for IPARD measure 302
Source: PAAFRD, 2016
In third call for measure 302 there was total 35 applications with total investment over HRK 44 million, and requested support over HRK 20
million. 15 contracts were signed (projects approved) and 10 realized with investment over HRK 10 million, and paid support of HRK 5 million.
STATUSNO. OF
APPLICATIONSPERCENTAGE TOTAL INVESTMENT PERCENTAGE APROVED SUPPORT (HRK) PERCENTAGE
REQUESTED /
CONTRACTED
SUPPORT
(HRK/1.000.000)
AVERAGE SUPPORT
PER PROJECT
Applied projects 35 100,00% 44.089.130,74 100,00% 20.373.758,27 100,00% 20,37 582.107,38
Refused 9 25,71% 8.985.852,34 20,38% 4.240.504,67 20,81% 4,24 471.167,19
Withdrawed applications 10 28,57% 11.785.569,83 26,73% 5.364.122,67 26,33% 5,36 536.412,27
Terminated contracts 1 2,86% 1.137.270,00 2,58% 568.635,00 2,79% 0,57 568.635,00
Total contracted project's 15 42,86% 20.274.015,25 45,98% 10.137.007,62 49,76% 10,14 675.800,51
Realized projects and paid support 10 66,67% 10.013.460,37 49,39% 5.006.730,18 49,39% 5,01 500.673,02

- 53 -
Fourth call lasted from 20/08/2012 to 31/12/2012. The results of implementation of this call are shown in the table below.
Table 24 - Fourth Call for IPARD measure 302
Source: PAAFRD, 2016
In fourth call for measure 302 there was total 238 applications with total investment over HRK 414 million, and requested support over HRK 192
million. Reason for this large number of application is long period of open call (over four months) and big interest in projects for rural tourism.
118 contracts were signed (projects approved) with total investment of HRK 154 million and total support of HRK 77 million. 28 projects are
realized with investment over HRK 37 million, and paid support of HRK 18 million. Projects from this call are mainly still in process of realization
so we can expect more realized and paid support.
Table 25 - All Calls for IPARD measure 302
Source: PAAFRD, 2016
STATUSNO. OF
APPLICATIONSPERCENTAGE TOTAL INVESTMENT PERCENTAGE APROVED SUPPORT (HRK) PERCENTAGE
REQUESTED /
CONTRACTED
SUPPORT
(HRK/1.000.000)
AVERAGE SUPPORT
PER PROJECT
Applied projects 238 100,00% 414.158.251,82 100,00% 192.248.345,55 100,00% 192,25 807.766,16
Refused 72 30,25% 147.858.268,44 35,70% 73.512.327,24 38,24% 73,51 1.021.004,55
Withdrawed applications 44 18,49% 72.371.115,55 17,47% 35.106.198,37 18,26% 35,11 797.868,14
Terminated contracts 4 1,68% 3.488.514,62 0,84% 1.744.257,30 0,91% 1,74 436.064,33
Total contacted project's 118 49,58% 154.297.162,73 37,26% 77.126.329,83 40,12% 77,13 653.612,96
Realized projects and paid support 28 23,73% 37.335.196,98 24,20% 18.667.151,25 24,20% 18,67 666.683,97
STATUSNO. OF
APPLICATIONSPERCENTAGE TOTAL INVESTMENT PERCENTAGE APROVED SUPPORT (HRK) PERCENTAGE
REQUESTED /
CONTRACTED
SUPPORT
(HRK/1.000.000)
AVERAGE SUPPORT
PER PROJECT
Applied projects 329 100,00% 512.116.083,71 100,00% 239.763.456,34 100,00% 239,76 728.764,30
Refused 98 29,79% 169.936.824,80 33,18% 84.911.533,73 35,41% 84,91 866.444,22
Withdrawed applications 55 16,72% 85.280.635,38 16,65% 41.032.296,04 17,11% 41,03 746.041,75
Terminated contracts 9 2,74% 8.899.510,14 1,74% 4.449.755,05 1,86% 4,45 494.417,23
Total contracted project's 167 50,76% 208.590.479,97 40,73% 104.272.925,41 43,49% 104,27 624.388,77
Realized projects and paid support 67 40,12% 73.157.257,65 35,07% 36.578.181,55 35,08% 36,58 545.943,01

- 54 -
Graph 9 - Measure 302 - state of applications per sector
Source: MA, 2015
5.5.5. Progress in implementation of IPARD program Measure 501
Managing Authority signed the Agreement on cooperation in implementation of the Measure 501 „Technical Assistance“ within IPARD Program
with PAAFRD on 4 April 2012. That Agreement defined all mutual rights and obligations between Managing Authority and the Paying Agency
regarding the measure implementation. After defined deficiencies, the new Agreement was signed in October 2012. As defined by the Agreement,
MA had submitted the Action Plan of the implementation of the Measure „Technical Assistance“ for 2013 to the Paying Agency. Planned activities
as defined by the Action Plan for „Technical Assistance” were partly implemented and financed by the State budget of the Republic of Croatia in
2012.
ARPA did the audit of the system for measures 202 and 501 during June, 2012 and the Operating structure received the national accreditation from
the National authorizing officer on 27 June 2012. The result for measure 501 is shown on table below.

- 55 -
Table 26 - Result of IPARD measure 501
Source: PAAFRD, 2016
For measure 501 there was total 63 applications with total investment over HRK 4 million, and equal requested support (support is up to 100%).
60 contracts were signed (projects approved) and realized with total investment and total support of HRK 2.7 million.
STATUSNO. OF
APPLICATIONSPERCENTAGE TOTAL INVESTMENT PERCENTAGE APROVED SUPPORT (HRK) PERCENTAGE
REQUESTED /
CONTRACTED
SUPPORT
(HRK/1.000.000)
AVERAGE SUPPORT
PER PROJECT
Applied projects 63 100,00% 4.238.112,86 100,00% 4.238.112,86 100,00% 4,24 67.271,63
Refused 0 0,00% 0,00 0,00% 0,00 0,00% 0,00 0,00
Withdrawed applications 2 3,17% 990.937,03 23,38% 990.937,03 23,38% 0,99 495.468,52
Terminated contracts 1 1,59% 2.848,76 0,07% 2.848,76 0,07% 0,00 2.848,76
Total contracted project's 60 95,24% 3.091.393,53 72,94% 3.091.393,53 72,94% 3,09 51.523,23
Realized projects and paid subsidy 60 100,00% 2.749.693,14 88,95% 2.749.693,14 88,95% 2,75 45.828,22

- 56 -
5.5.6. Results of all IPARD measures in Croatia
Table 27 – Overall results of all IPARD measures in Croatia till 02/02/2016 Source: PAAFRD, 2016
STATUSNO. OF
APPLICATIONSPERCENTAGE TOTAL INVESTMENT PERCENTAGE APROVED SUPPORT (HRK) PERCENTAGE
REQUESTED /
CONTRACTED
SUPPORT
(HRK/1.000.000)
AVERAGE SUPPORT
PER PROJECT
All applied projects 1338 100,00% 4.023.707.381,16 100,00% 2.397.274.250,43 100,00% 2.397,27 1.791.684,79
101 applayed 520 38,86% 1.537.046.825,99 38,20% 793.072.988,59 33,08% 793,07 1.525.140,36
103 applayed 136 10,16% 1.144.959.157,92 28,46% 564.966.357,48 23,57% 564,97 4.154.164,39
301 applayed 210 15,70% 785.747.200,68 19,53% 755.633.335,16 31,52% 755,63 3.598.253,98
302 applayed 329 24,59% 512.116.083,71 12,73% 239.763.456,34 10,00% 239,76 728.764,30
202 applayed 80 5,98% 39.600.000,00 0,98% 39.600.000,00 1,65% 39,60 495.000,00
501 applayed 63 4,71% 4.238.112,86 0,11% 4.238.112,86 0,18% 4,24 67.271,63
101 contracted 320 61,54% 796.336.171,50 51,81% 416.083.141,02 52,46% 416,08 1.300.259,82
103 contracted 77 56,62% 724.982.097,99 63,32% 362.490.390,53 64,16% 362,49 4.707.667,41
301 contacted 106 50,48% 300.683.867,29 38,27% 300.683.867,29 39,79% 300,68 2.836.640,26
302 contracted 167 50,76% 208.590.479,97 40,73% 104.272.925,41 43,49% 104,27 624.388,77
202 contracted 42 52,50% 36.900.000,00 100,00% 36.900.000,00 100,00% 36,90 878.571,43
501 contacted 60 95,24% 3.091.393,53 72,94% 3.091.393,53 72,94% 3,09 51.523,23
Total contracted project's 772 57,70% 2.070.584.010,28 51,46% 1.223.521.717,78 51,04% 1.223,52 1.584.872,69
101/103 realized 289 72,80% 997.060.690,31 65,54% 509.744.590,89 65,47% 509,74 1.763.822,11
301 realized 66 62,26% 141.714.472,97 47,13% 141.714.472,97 47,13% 141,71 2.147.188,98
302 realized 67 40,12% 73.157.257,65 35,07% 36.578.181,55 35,08% 36,58 545.943,01
202 realized 41 97,62% 25.119.771,29 68,08% 25.119.771,29 68,08% 25,12 612.677,35
501 realized 60 100,00% 2.749.693,14 88,95% 2.749.693,14 88,95% 2,75 45.828,22
Realized projects with paid subsidy 523 67,75% 1.239.801.885,36 59,88% 715.906.709,84 58,51% 715,91 1.368.846,48
1.401.212.000,00 51,09%Estimated value of avaliable founds in IPARD program and utilization of found

- 57 -
Table 28 - Paid support per year
Source: PAAFRD, 2016
Graph 10 – Percentage of total paid support versus total available IPARD funds
Source: Presentation from PAAFRD, Ante Pezo, 02/2016 (estimate for 2016.)
YEAR
NUMBER OF
RECEIVED
APPLICATIONS
NUMBER OF
CONTRACTED
APPLICATIONS
CONTRACTED
SUPPORT
NUMBER OF
PAID
APPLICATIONS
PAID SUPPORT
PAID SUPPORT
VERSUS TOTAL
AVAILABLE
IPARD FUNDS
NUMBER OF
EMPLOYEES
PAID SUPPORT
PER EMPLOYEE
2010 76 22 56.086.613,81 1 424.571,95 0,03% 464 915,03
2011 314 75 134.859.557,82 12 22.772.176,63 1,66% 475 47.941,42
2012 466 143 344.597.288,43 58 126.674.917,43 10,70% 552 229.483,55
2013 332 110 193.484.599,38 113 188.297.741,03 24,13% 635 296.531,88
2014 150 422 494.493.658,34 148 145.602.668,03 34,53% 658 221.280,65
2015 0 0 0,00 191 232.134.634,77 51,09% 679 341.877,22
TOTAL 1338 772 1.223.521.717,78 523 715.906.709,84

- 58 -
5.5.7. Average, maximum and minimum paid support
In total there was 1338 applications on IPARD on all 20 calls in 6 different measures. There
was 10 calls in measure 101/103, 3 calls for measure 301, 4 calls for measure 302, 2 calls for
measure 202 and one call for measure 501. Most popular measure was 101 with 520
applications. If we know that there is more than 100,000 farmers in Croatia the number of 520
applications is rather low, and it indicates that about 0.5% of all farmers competed for this
support. The results are even more worrying if we know that only 320 projects were contracted
after all calls were completed.
Total investment for all applied projects is HRK 4,023,707,381 with measure 101 as leading
(HRK 1,537,046,825). Total requested support was HRK 2,397,274,250 and measure with
biggest requested support was also 101 (HRK 793,072,988). Second measure with biggest
requested support is measure 301. This is not unusual because in measure 301 maximum
support is 100% per investment and in all other measures it is usually 50 % (up to 75 % in rare
cases in measure 101). Average requested support is HRK 1,791,684 per project and biggest is
in measure 103 (HRK 4,154,164). This is also not unusual because measure 103 is for
processing primary agricultural products and investment in this sector are usually very high.
Graph 11 - Contracted projects through all IPARD measures
Source: PAAFRD, 2016
There were 772 contracted projects till cut off day for processing IPARD applications (October
2014) and till 02/02/2016 there is 523 realized projects with paid support. Investment of total
contracted projects is HRK 2,070,584,010 with measure 101 as leading (HRK 796,336,171).
Total contracted support is HRK 1,223,521,717 and also measure 101 is leading (HRK
416,083,141). We can conclude that measure 101 is leading one in contracting support because
it has over 52 % of contracted support from required one. Average success in contracting

- 59 -
support is 51.04 % which is rather low percentage. Average contracted support per project is
HRK 1,584,872 with measure 103 as leading one (average contracted support in this measure
is HRK 4,707,667).
Graph 12 - Number of applications and contracted support
Source: PAAFRD, 2016
Biggest contracted project was in measure 103, from investor OSTREA d.o.o. from Stankovci.
Project was for investment in new building and equipment for processing plan for fishery sector.
Total investment of this project was HRK 22,962,000.00 with requested support of HRK
11,481,000.00. Smallest project was from Ministry of agriculture in measure 501 with
investment and requested support (100 % support) of only HRK 493.00. In measure 101 and
103 smallest project was “obrt NADA” from Vivodina15 (investment in mechanization for grape
production) with investment of HRK 149,023.00 and requested support of HRK 74,511.50.
Smallest contracted project in measure 301 was for county Sveti Lovreč with total investment
and requested support of HRK 356,160.32. This project was for unclassified roads. Biggest
project in measure 301 was for city Grubišno Polje with total investment and requested support
of HRK 7,295,457.40 for investment in construction of waste water treatment plant. Smallest
investment in measure 302 was for “obrt Barić” from Babna Greda with investment of HRK
124,423.86 and requested support of HRK 62,211.93. This project was for renewable energy
plant. Biggest project in measure 302 was from investor Bioplin Rovišće d.o.o. with total
investment of HRK 5,117,715.00 and requested support of HRK 2,558,857.50. This project is
in biogas plant.
15 „Obrt Nada” is authors family business owned by authors mom

- 60 -
Graph 13 - Average support per project in HRK
Source: PAAFRD, 2016
Of all contracted projects till 02/02/2016 there is 523 (67.75 %) realized projects with 58.51 %
paid support. Average paid support per project is HRK 1,368,846 and biggest average paid
support is for measure 301 (HRK 2,147,188.98). Biggest paid support is in measure 103 for
project of PPK Karlovačka mesna industrija d.d. from Karlovac with total investment of project
of HRK 22,551,000.00 and paid support of HRK 11,275,500. Investment was in equipment for
slaughterhouse and meat processing plant. Smallest paid support is equal to smallest contracted
support. It is project from Ministry of agriculture in measure 501 with investment and requested
support (100 % support) of only HRK 493.00. Smallest project in measure 101 and 103 with
paid support is from investor “obrt ABC” from Stanica Đakovačka. It is total investment of
HRK 192,060.84 in measure 101 with paid support of HRK 96,030.42. Investment is in
mechanization for farming. Biggest paid support in measure 301 was for project city of Kastav,
investment in sewerage system, with total investment and paid support of HRK 6,372,544.68.
Smallest project in measure 301 was for county Sveti Lovreč. It is the same project as mentioned
before, as smallest contracted project for measure 301. Biggest paid support for project in
measure 302 is for Moslavina Proizvodi d.o.o. from Čazma, for project in renewable energy
with total investment of HRK 5,088,892.50, and paid support of HRK 2,544,446.25. Smallest
project in measure 302 with paid support is for “obrt Barić” from Babna Greda with investment
of HRK 123,616.90 and paid support of HRK 61,808.45.

- 61 -
Graph 14 - Percentage of realized project in number and value
Source: PAAFRD, 2016
Total investment for all 523 realized projects within IPARD is HRK 1,239,801,885 with paid
support of HRK 715,906,709. Total approved financial budget for IPARD is over EUR 184
million (period 2007-2013) that is over HRK 1,400 million so we can conclude that total
acquisition of available IPARD found is 51.09 %.
Graph 15 - Realized projects through the measures
Source: PAAFRD, 2016

- 62 -
5.5.8. Geographical distribution of IPARD program
Croatian Paying Agency on day 15/09/2015 published IPARD summary with data of all
contracted and paid support throughout 21 Croatian counties16.
Table 29 - All contracted and paid support throughout Croatian Counties
Source: PAAFRD (on date 15/09/2015)
From geographical distribution we can see that county with biggest number of contracts is
Istrian County (Istarska županija) with 136 contracts, second best is Osijek-Baranja County
(Osječko-baranjska županija) with 105 contracts. Least contracts, 5 were made in Šibenik-Knin
16 Source: http://www.PAAFRD.hr/ipard-31.aspx (15/09/2015)
NUMBER OF
CONTRACTED
PROJECTS
CONTRACTED
INVESTMENT
(HRK)
CONTRACTED SUBSIDY
(HRK)
NUMBER OF
REALIZED
PROJECTS
PAID SUBSIDY
(HRK)
AVERAGE
PAID SUBSIDY
PER PROJECT
(HRK)
Zagrebačka županija (01)
43 124.768.676,90 71.837.436,10 22 33.084.437,60 1.503.838,07
Krapinsko-zagorska (02)
12 43.514.104,79 24.534.832,44 3 2.972.664,85 990.888,28
Sisačko-moslavačka županija (03)
35 141.931.240,04 80.915.279,34 13 15.668.858,63 1.205.296,82
Karlovačka županija (04)
31 80.273.985,70 47.687.667,12 15 22.659.192,06 1.510.612,80
Varaždinska županija (05)
46 129.896.214,70 77.818.393,95 21 27.378.644,60 1.303.744,98
Koprivničko-križevačka županija (06)
34 62367299,49 34758468,55 12 10.830.939,99 902.578,33
Bjelovarsko-bilogorska županija (07)
25 111.061.488,60 64.106.639,76 10 28.619.881,70 2.861.988,17
Primorsko-goranska županija (08)
30 41.577.117,25 30.863.968,70 7 9.205.306,19 1.315.043,74
Ličko-senjska županija (09)
6 13.509.649,13 10.560.502,91 3 6.830.501,11 2.276.833,70
Virovitičko-podravska županija (10)
32 112.344.989,19 59.992.647,89 13 23.249.904,79 1.788.454,21
Požeško-slavonska županija (11)
18 66.215.840,40 42.948.668,76 6 6.678.021,45 1.113.003,58
Brodsko-posavska županija (12)
27 87.298.577,14 48.306.420,55 14 27.753.475,52 1.982.391,11
Zadarska županija (13)
26 178.597.521,39 104.451.142,37 13 23.323.402,81 1.794.107,91
Osječko-baranjska županija (14)
105 313.062.151,60 176.560.281,85 44 66.339.944,63 1.507.726,01
Šibensko-kninska županija (15)
5 5.086.979,97 3.443.489,98 3 474.193,42 158.064,47
Vukovarsko-srijemska županija (16)
41 114.468.207,70 65.209.865,90 15 24.055.216,36 1.603.681,09
Splitsko-dalmatinska županija (17)
25 136.846.489,08 76.596.581,64 13 46.347.286,49 3.565.175,88
Istarska županija (18)
136 290.850.227,18 180.445.627,01 32 63.274.748,55 1.977.335,89
Dubrovačko-neretvanska županija (19)
13 36.905.822,21 30.951.604,61 8 8.888.448,69 1.111.056,09
Međimurska županija (20)
47 92.968.720,75 48.283.373,14 22 23.558.705,86 1.070.850,27
Grad Zagreb (21)
63 23.496.924,85 13.297.159,19 43 11.088.980,88 257.883,28
800 2.207.042.228,06 1.293.570.051,76 332 482.282.756,18 1.452.658,90TOTAL ALL COUNTIES
NAME OF COUNTY
TOTAL
TOTAL
TOTAL
TOTAL
TOTAL
TOTAL
TOTAL
TOTAL
TOTAL
TOTAL
TOTAL
TOTAL
TOTAL
TOTAL
TOTAL
TOTAL
TOTAL
TOTAL
TOTAL
TOTAL
TOTAL

- 63 -
County (Šibensko-kninska županija), 6 in Lika-Senj County (Ličko-senjska županija) and 12 in
Krapina-Zagorje County (Krapinsko zagorska županija).
Biggest contracted support is also in Istrian County (Istarska županija) with HRK 180 million
of, second best is Osijek-Baranja County (Osječko-baranjska županija) with HRK 176 million.
Least contracted support was made in Šibenik-Knin County, (Šibensko-kninska županija) with
HRK 3.4 million, second worst was Lika-Senj County (Ličko-senjska županija) with HRK 10.6
million and third worst was Krapina-Zagorje County (Krapinsko zagorska županija) with HRK
24.5 million.
These trends are followed in number of paid projects, and total amount of paid support. In
average paid support Split-Dalmatia County (Splitsko-dalmatinska županija) has biggest
average paid support per project (HRK 3,565,175.88). Second one is Bjelovar-Bilogora County
(Bjelovarsko-bilogorska županija) with 2,861,988.17 average paid support. Counties with
smallest average paid support are Šibenik-Knin County, (Šibensko-kninska županija) with
HRK 158.064,47 per project and City of Zagreb with HRK 257,883.28.
Graph 16 - Number of contracted projects per county
Source: PAAFRD, 2016

- 64 -
Graph 17 - Contracted investment per county
Source: PAAFRD, 2016
Graph 18 - Contracted support per county
Source: PAAFRD, 2016

- 65 -
Graph 19 - Number of realized projects per county
Source: PAAFRD, 2016
Graph 20 - Paid support per county
Source: PAAFRD, 2016

- 66 -
Graph 21 - Average paid support per project
Source: PAAFRD, 2016

- 67 -
Source: PAAFRD, 2016
0 200 400 600 800
NUMBER OF CONTRACTED…
CONTRACTED INVESTMENT…
CONTRACTED SUPPORT…
NUMBER OF REALIZED…
PAID SUPPORT (MIL HRK)
Istočno panonska
0 200 400 600 800
NUMBER OF CONTRACTEDPROJECTS
CONTRACTED INVESTMENT(MIL HRK)
CONTRACTED SUPPORT(MIL HRK)
NUMBER OF REALIZEDPROJECTS
PAID SUPPORT (MIL HRK)
Zapadno panonska
0 100 200 300 400
NUMBER OF CONTRACTEDPROJECTS
CONTRACTED INVESTMENT(MIL HRK)
CONTRACTED SUPPORT(MIL HRK)
NUMBER OF REALIZEDPROJECTS
PAID SUPPORT (MIL HRK)
Primorsko istarska
0 50 100
NUMBER OF CONTRACTED…
CONTRACTED INVESTMENT…
CONTRACTED SUPPORT…
NUMBER OF REALIZED…
PAID SUPPORT (MIL HRK)
Gorska
0 100 200 300 400
NUMBER OF CONTRACTEDPROJECTS
CONTRACTED INVESTMENT(MIL HRK)
CONTRACTED SUPPORT(MIL HRK)
NUMBER OF REALIZEDPROJECTS
PAID SUPPORT (MIL HRK)
Sjeverno i južno dalmatinska
0 500 1000 1500 2000 2500
NUMBER OF CONTRACTED PROJECTS
CONTRACTED INVESTMENT(MIL HRK)
CONTRACTED SUPPORT(MIL HRK)
NUMBER OF REALIZED PROJECTS
PAID SUPPORT (MIL HRK)
UKUPNO
Graph 22 - Regional statistic of IPARD projects

- 68 -
5.5.9. Type and size of beneficiary
If we know who are beneficiaries of IPARD measures 17 we can conclude that for private sector
are measures 101, 103 and 302. For public sector are measures 202, 301 and 501. If we know
all contracted and paid support throughout all measure we can conclude who were main
beneficiaries of IPARD program.
Table 30 - All beneficiaries of IPARD regarding private/public sector
Table 30 - continued
From the above table we can see that primary beneficiaries was Private sector with more than
73 % contracted projects (72 % contracted support) and over 68 % projects with paid support
of all contracted and realized projects. Also paid support for private sector is more than 76 %
of all paid support. This is expected because when see what was allocation of IPARD funds we
can conclude that it is mainly for private sector. As measure 103 is with biggest percentage of
paid support (39 %) we can conclude that biggest beneficiaries are privately owned producers
in sector of processing of agriculture and fishery products (milk and dairy sector, meat sector,
fisheries, fruit and vegetables processing industry, wine sector and olive oil sector). After that
biggest benefit had privately owned producers that are involved in producing primary
agriculture and fishery products with 31 % of totally paid support. We can expect that in
following years (till end of 2016) this sector will increase their percentage in totally paid support
because they had biggest contracted support (34 %) of all contracted support. Main reason is
17 See chapter; 4.4.IMPLEMENTATION OF IPARD MEASURES
MEASURE
NUMBER OF
CONTRACTED
PROJECTS
%
CONTRACTED
INVESTMENT
(HRK)
CONTRACTED
SUPPORT
(HRK)
%
NUMBER OF
REALIZED
PROJECTS
%PAID SUPPORT
(HRK)%
101 320 41,45% 796.336.171,50 416.083.141,02 34,01% 129 24,62% 227.095.896,78 31,72%
103 77 9,97% 724.982.097,99 362.490.390,53 29,63% 160 30,64% 282.648.694,11 39,48%
302 167 21,63% 208.590.479,97 104.272.925,41 8,52% 67 12,81% 36.578.181,55 5,11%
Private sector
total564 73,06% 1.729.908.749 882.846.457 72,16% 356 68,07% 546.322.772 76,31%
301 106 13,73% 300.683.867,29 300.683.867,29 24,58% 66 12,62% 141.714.472,97 19,80%
202 42 5,44% 36.900.000,00 36.900.000,00 3,02% 41 7,84% 25.119.771,29 3,51%
501 60 7,77% 3.091.393,53 3.091.393,53 0,25% 60 11,47% 2.749.693,14 0,38%
Public sector
total208 26,94% 340.675.261 340.675.261 27,84% 167 31,93% 169.583.937 23,69%
TOTAL 772 100% 2.070.584.010 1.223.521.718 100% 523 100% 715.906.710 100%
MEASURE 2007-2013 %
101 57.427.100 31,15%
103 57.427.100 31,15%
302 14600294 7,92%
Private sector 129.454.494 70,21%
201 0 0,00%
202 6133230 3,33%
301 43811876 23,76%
501 4970400 2,70%
Public sector 54.915.506 29,79%
TOTAL 184.370.000 100%

- 69 -
that in final two call (9 and 10) for measure 101 there was possibility to invest in primary
agricultural mechanization and tractors.
Real public beneficiaries of IPARD were in measure 301 (small rural cities and municipalities)
with almost 20 % of total contracted support.
6. PROBLEMS IN IMPLEMENTATION OF IPARD
Although the level of support usage is on the rise, the impact of certain negative factors on the
absorption level was also observed, as follows:
1. Poor investment potential of potential beneficiaries (over-indebtedness);
2. Inability to satisfy the conditions for obtaining loans through CBRD;
3. Long period from applying to tender to approving project from PFARD (in some calls it
took over 18 month), and obtaining fund and guarantee for financing projects because of
complicated and long-lasting process in CBRD and Croatian Agency for SME (issues
guarantee for projects with IPARD contract)
4. Unresolved status of potential beneficiaries concerning location and building permits for
existing facilities;
5. The delay request for payment;
6. The problem with beneficiaries in pre-bankruptcy settlement: in such a case, the request for
payment comes to changes to the project which is also a complex and time-consuming
process;
7. Bad weather conditions slowed down the completion of projects, especially projects with
construction;
8. A promotion of a new programming period (EAFRD 2014-2020) influenced the
abandonment of beneficiaries of IPARD.
Regarding first three problems mentioned above here are some examples of real situations from
authors experience.
Problem with poor investment potential is due to over indebtedness of most producers in
agricultural sector. This problem was very visible in projects applied in measure 101 and 103.
Most producers have high depth ratio, over ½ of capital, and in some cases depth is higher than
¾ of capital. Also the problem was gathering enough money to start project, regarding expenses
on project documentation (building projects and permits, consultants, environmental studies
etc.). This problem was in some cases overcame in application of projects but was impossible
to solve in realization of project. This was frequent in cases of applicants with very high
investment and low current capital and income.
First problem is directly related with second problem, inability to satisfy the conditions for
obtaining loans through CBRD. Even thou interest rate in CBRD are very desirable (1-2%)
there is problem to satisfy condition. One should prove that he can cover 15-25% of investment,

- 70 -
that he has free resources for tax payment (usually 25% of net investment price) and that he can
guarantee loan with ratio of 1:1,2 - 1:1,5. Covering own participation of 15-25 % was usually
satisfied because preparation of project (building projects and permits, consultants,
environmental studies etc.) usually is 10-15 % of all project. Problem of tax payment can also
be overcame with short-loan, because government pays back tax on investment in 4-8 months.
Biggest problem in most cases was gathering enough guarantee for loan. This can be partially
solved with Croatian Agency for SME (issues guarantee for projects with IPARD contract) that
gives up to 50% of guarantee of loan for IPARD projects, but there is still 70-100% (staring
ratio is 1:1.2 - 1:1.5, or 120-150% guarantee on loan) of guarantee uncovered and must be
acquired from investor. This guarantee was requested even though investor had IPARD contract
that stated that he can get 50% support on project. Guarantee represents investor’s capital or
assets (land and building) that are not already mortgage in other loans. In negotiation with most
banks it was obvious that banks were suspicious on support payment because of two reasons.
One is what if something goes wrong in realization of project and second is problem of support
payment on investor’s account, where bank wasn’t secure that investor will transfer support to
bank and reduce loan principal. All these request are very hard to satisfy and most investors
were disappointed with bank requests. If we take one example of investment of 100 units, the
tax on this investment is 25% so total investment for investor is 125 units. To prepare project
usually cost 20 units but not all expenses are acceptable for support (cost of land, building
permits etc.) so we can say that for support only 10 units will be acceptable. In most cases in
measure 101 and 103 support was 50% of net investment, in our case 40 units on investment
and 5 units for preparation cost (building papers, consultants, environmental studies etc.). For
loan investor needs 80 units but he will reduce depth by 40 units when he successfully finish
the project. Total depth will be 40 units. He also need guarantee of 125% of loan, so that means
100 units (80 units is loan). In eyes of investor if we calculate whole investment (preparation,
realization and tax) investor has to cover 40 units (32%), support is 45 units (36%) and banks
will be exposed by 40 units (32%). Banks wants 100 units of guarantee that represents 80% of
total investment or 2.5 times (250%) more than loan after support payment. Croatian Agency
for SME can approve guarantee up to 50% of loan (40 units) but that is only 40% of required
guarantee, and it takes even more time to get approval.
Table 31 - Financing IPARD projects - example
Source: Self made
Third problem for investors is long period from applying to tender to approving project from
PFARD (in some calls it took over 18 month), and obtaining fund and guarantee for financing
projects because of complicated and long-lasting process in CBRD and Croatian Agency for
SME (issues guarantee for projects with IPARD contract). Long process in approving loan is
due to gathering all evidence that investor can satisfy all requests made by bank and Croatian
Agency for SME for additional guarantee. Author had participated in over 50 realized projects
INVESTMENT INVESTOR SUPPORT BANK GUARANTEE
PREPARATION OF PROJECT 20 15 5 0 0
PRICE OF PROJECT 80 0 40 40 100
TAX 25 25 0 0 0
TOTAL 125 40 45 40 100
PERCENTAGE 100% 32% 36% 32% 80%
250%PERCENTAGE OF GURANTEE AFTER SUPPORT PAYMENT

- 71 -
in IPARD and 15 are still in process of realization. In those projects average time for approval
from PFARD takes around 6-8 months. Approval from CBRD takes 2-6 months and approval
from Croatian Agency for SME takes 2-4 months. Even though some actions can overlap, this
means that investor from applying project waits 10-18 months to solve project financing. There
is also problem of getting building permit that usually takes 3-6 months, and preparation of
other tender documentation (environmental studies, business plan etc.) that usually takes up to
2 months. We can conclude that preparation of project (with building construction) takes around
6 months, and approval of support and financing takes at least 10 month. Realization of projects
with construction takes at least 6 months. That means over one year from first idea to starting
construction and over year and half for realization of idea. In some cases all this process took
even more time, over 3 years. This is too long for today’s economy that is rapidly changing and
investors need quick realization of their idea.
This is certainly problem that must be solved in future support programs (EAFRD) in a way
that all agencies involved in this process must be more efficient and procedure must be easier
for investors.

- 72 -
7. EX-POST EVALUATION IPARD PROGRAMME
Ex-post evaluation18 was made by KPMG Croatia d.o.o., with final date 30. June 2016.
Evaluation was based on the data on which the Ministry of Agriculture delivered (analysis of
program documents, literature, analysis of monitoring data, financial and administrative data;
an overview of findings from the literature review of the list of projects and project
documentation; descriptive statistics based on FADN data, an overview of the different
information and publicity material) and semi-structured interviews with stakeholders
(conducted 10 interviews) and case study users with in-depth interviews (7 case studies).
KPMG had 8 weeks to carry out an evaluation. Presentation of results was held on 30th
November 2016 in Zagreb.
The conclusion is that the activation of IPARD delayed because of the transfer of authority and
activation of measures was performed in 2010, and Measure 501 was issued in 2014. On the
website of the European Commission, there are no data on Croatia and the statistics were
unavailable to the evaluators. Insufficient capacity within the operating structure IPARD
influenced the management of administrative procedures, so, for example, needed an average
of 355 days from submission of the application to a decision on the financing according to 30
June 2016. There is a lack of previous experience and the lack of model of cooperation between
banks and customers and the lack of established strategic planning process that preceded
publication of the call for proposals. The number of rejected project applications was the largest
in the initial call for proposals and that these figures show downward trend towards the end of
the program period. This trend can be linked with the process of learning that took place at the
user level, which indicates that the activities within the IPARD managed to some extent to
strengthen the awareness and capacity of the target groups.
The volume contracted IPARD funds in relation to the total available funds (% EU contracted
funds in relation to the foreseen in the program) is 92.32%, while the total amount paid in
relation to the total available funds (EU paid / EU foreseen in the Programme) is 65,54%
(according to data from the monitoring system on June 30, 2016).
The evaluators IPARD the Croatian 2007 - 2013 assessed moderately successful in achieving
their full potential, in terms of withdrawal of available EU funds and the achievement of
objectives set and displayed in the program document.
Evaluator recommendations
To increase the quality of the existing system of monitoring data by including indicators that
link the operational implementation of the program and the use of funds from the agricultural
18 http://www.hmrr.hr/hr/novosti/iz-hmrr-a/izvjestaj-s-prezentacije-rezultata-izvrsitelja-ex-post-izvjesca-ipard-
programa-rh/ - 06/01/2017

- 73 -
sector in Croatia as a whole, to enable more informed program management and decision-
making.
To strengthen the institutional capacity and better use of technical assistance in order to
eliminate administrative bottlenecks, avoid duplication and improve overall management
processes.
Increase promotional activities to raise awareness about funding opportunities and to offer
training to potential customers in order to strengthen the capacity of them, which will lead to
increase in the number of applicants, and ultimately the withdrawal of funds.
When allocating resources and defining eligibility criteria, national measures should strive to
implement sharper regional approach that will enable the use of available resources by reducing
existing regional disparities in the country and therefore better overall absorption.

- 74 -
8. COCLUSIONS
The implementation of the IPARD Programme in the Republic of Croatia started in 2010,
although it was approved in 2008. By the end of the sixth implementation year, the IPARD Plan
had undergone seven amendments which provided for a broader range of beneficiaries and
eligible investments, and which contributed to a greater absorption of funds.
A total of 21 calls for the IPARD Programme were implemented by 31 December 2014. A total
of 3 calls were implemented in 2010, specifically for Measure 101 "Investments in agricultural
holdings to restructure and to upgrade to Community standards" and Measure 103 "Investments
in the processing and marketing of agriculture and fishery products to restructure those
activities and to upgrade them to Community standards". In 2011, a total of 7 calls were
implemented, 3 for Measures 101 and 103, 2 for Measure 301 "Improvement and development
of rural infrastructure" and 2 for Measure 302 "Diversification and development of rural
economic activities". In 2012, a total of 5 calls were implemented, 2 calls for Measures 101 and
103, 2 calls for Measure 302 and 1 call for Measure 301. In 2013, a total of 4 calls were
implemented, 1 call for Measures 101 and 103, 2 calls for Measure 202 "Preparation and
implementation of local rural development strategies", and a call for applications for Measure
501 "Technical assistance" was published. During 2014, one call was conducted each for
Measures 101 and 103 and a call for applications for Measure 501 "Technical assistance" was
published.
Total allocated funds for 2007-2013 were EUR 183,370,000 or around HRK 1,401,212,000.
There were 1338 applications with requested support of HRK 2,397,274,250.
772 Projects (57.7%) were approved and contracted with requested support of HRK
1,223,521,717 (87 % of available funds). Till 02/02/2016 there were 523 realized projects with
HRK 715,906,709 paid support. We can conclude that utilization of IPARD funds on date
02/02/2016 is 51.09 % that is rather low, but cut-off day for IPARD in RC is 31/12/2016 so we
can expect realization of more projects, and utilization of around 75 % of total allocated funds.
The number of projects that were paid out has been growing from year to year, which is to be
expected, since payments are carried out for projects contracted in previous years.
With regard to the total paid (and contracted) support amount, most support funds were paid
out for Measure 101 and Measure 103 (80.4%), followed by Measure 301 (11.4%), then in
descending order, for Measure 302 (5.9%), for Measure 202 (2.0%) and for Measure 501
(0.2%). Considering that Measure 101, 103 and 302 are intended for private sector we can
conclude that over 86 % of paid support was for private sector.
Istra and Osijek-Baranja counties are at the forefront with regard to the number of received,
contracted and paid out projects. Counties with the lowest number of applications are Šibensko-
kninska and Ličko-senjska. We can conclude that northern part of RC was more successful in
application and realization of projects with IPARD support.
Although the level of fund utilisation increased over the years the impact of certain negative
factors on the absorption level was also observed. Promotional activities were enhanced and
meetings/workshops with consultants were held with the aim of improving the preparation of
the project documentation required to bid for call and submit a Payment Request. The
promotion of the new programming period has affected the withdrawal by users of IPARD.

- 75 -
Three biggest problems for application and realization of projects with IPARD funds were:
1. Poor investment potential of potential beneficiaries (over-indebtedness);
2. Inability to satisfy the conditions for obtaining loans through CBRD;
3. Long period from applying to tender to approving project from PFARD (in some
calls it took over 18 month), and obtaining fund and guarantee for financing projects
because of complicated and long-lasting process in CBRD and Croatian Agency for
SME (issues guarantee for projects with IPARD contract)
During 2014, Croatia worked intensively on the preparation of the Rural Development
Programme 2014 - 2020, its promotion and publication of the first call for applications. First
calls were in 2015 and it showed that some problems that were obvious in IPARD procedure
were solved, but some are still here. Biggest problem is certainly capacity of PAAFRD and
long period for approving applied project. For EAFRD operation 4.1.1 that is similar to most
important IPARD measure 101, period of approval is now lasting more than one year. Beside
this as new problem emerged insufficient allocation of EAFRD funds, especially in some
operations as 4.1.1. This is mainly because of high percentage of support (up to 90%) and high
maximum support per project (up to EUR 5.000.000). This conditions weren’t possible in
IPARD and maybe it was better for program to have smaller percentage of support and
maximum amount because in this cases support will be better distributed among applicants and
their investments would be more realistic and according to producers real needs.

- 76 -
9. REFERENCES
1. IPARD PROGRAMME – Agriculture and Rural Development Plan 2007 - 2013
2. Instrument for Pre-Accession Assistance (IPA) Multi-annual Indicative Planning
Document (MIPD) 2011-2013, Croatia
3. Rural Development in the EU, Statistical and Economic Information, Report 2013,
European Commission, Directorate-General for Agriculture and Rural Development,
December 2013
4. Annual Report on Implementation of the IPARD Programme in the Republic of Croatia
2010, Zagreb, 2011
5. Annual Report on Implementation of the IPARD Programme in the Republic of Croatia
2011, Zagreb, 2012
6. Annual Report on Implementation of the IPARD Programme in the Republic of Croatia
2012, Zagreb, 2013
7. Annual Report on Implementation of the IPARD Programme in the Republic of Croatia
2013, Zagreb, 2014
8. Annual Report on Implementation of the IPARD Programme in the Republic of Croatia
2014, Zagreb, 2015
9. IPARD Programme 2007 - 2013 Agriculture and Rural Development Plan, Republic of
Croatia, Ministry of Agriculture
10. Rural Development Programme of the Republic of Croatia for the Period 2014-2020,
(Ministry of Agriculture, 2016)
11. The Common Agricultural Policy Explained, European Commission of the European
Union (DG AGRI, 2004)
12. “Utilization of pre-accession funds European Union in Croatia”, P.Jakovac and B.
Maljković, 2009.
13. IPARD yesterday/today/tomorrow, (HMRR, 2013)
14. http://www.PAAFRD.hr/ipard-31.aspx
15. http://www.mps.hr/ipard/default.aspx?id=28
16. http://www.mps.hr/ipard/default.aspx?id=7
17. https://www.hgk.hr/wp-content/files_mf/ipard42.pdf
18. https://www.hgk.hr/alokacije-i-iskoristenost-eu-fondova
19. http://www.hmrr.hr/hr/novosti/iz-hmrr-a/izvjestaj-s-prezentacije-rezultata-izvrsitelja-
ex-post-izvjesca-ipard-programa-rh/