Embed Size (px)
Citation preview
7/26/2019 Final Research Work.docx
http://slidepdf.com/reader/full/final-research-workdocx 1/74
1
A THESIS
Submitted to the Superior University, Lahore
As partial fulfillment of the Requirements
For
The Degree of
Bachelors of Business Administration
Submitted by:
Supervised by:

7/26/2019 Final Research Work.docx
http://slidepdf.com/reader/full/final-research-workdocx 2/74
2
“An integrated model for the effect of perceived product,
perceived service quality, and perceived price fairness on
consumer satisfaction and customer loyalty: Evidence from
Fast Food industry of Pakistan”
7/26/2019 Final Research Work.docx
http://slidepdf.com/reader/full/final-research-workdocx 3/74
3
Declaration of Originality
I pronounce that this thesis is my own work and I properly give the citation of the quotations of
authors and researchers.
I also pronounce that I have given the complete end references of the data which I have taken
from internet source to complete my research work and I know the fact that plagiarism can
influence my research work and even due to this my research work can be rejected.
Signed…………………………………………
Date…………………………………………….
Name of Supervisor………………………………
7/26/2019 Final Research Work.docx
http://slidepdf.com/reader/full/final-research-workdocx 4/74
4
ACKNOWLEGEMENTS
I would like to thank the following persons without whose guidance this dissertation could not
have been completed.
First of all I would like to express my sincere appreciation and gratitude to my supervisor
Khansa Irem for her guidance and insight throughout in making my dissertation and especially,
her invaluable suggestions and comments that really guided my research and also helped me to
structure my dissertation.
Secondly, I am also very indebted to my best friends, my father and mother for their continuous
support. I owe a lot of their unconditional love and understanding. Well, their suggestions
allowed me to think in many different ways. Most importantly, they continually helped me
improve my confidence. There were certain times, when I used to say that I just did not think I
could go on with my studies, but they always knew just what to say to get me back in the race.
They really very special entities of my life…. What a journey! I will never stop admiring them.

7/26/2019 Final Research Work.docx
http://slidepdf.com/reader/full/final-research-workdocx 5/74
5
DEDICATION
“I dedicated this research work to my parents, teachers, and friends who guide, assist and prayed
for me throughout my study life”.
7/26/2019 Final Research Work.docx
http://slidepdf.com/reader/full/final-research-workdocx 6/74
6
Abstract
The objective of the present study was to find the different factors affecting customer loyalty in
the context of fast food industry of Lahore, Pakistan. Macdonald’s, KFC, and Fri Chicks were
selected to complete the study. The data was collec ted from the 150 customers of Macdonald’s,
KFC, and Fri Chicks using self administered questionnaires. The response rate was 100%. SPSS
16.0 was used for the analysis of the data. Statistical analysis included histograms, scatter Plots,
correlation, t-test and regression analysis to analyze the data.
The study finds that all variables of the study are significantly and positively correlated with
each other. The results of regression analysis shows that perceived product quality, perceived
service quality, perceived price fairness has significant and positive correlation with the
customer satisfaction and customer loyalty. The results also show that customer satisfaction has
positive correlation with the customer loyalty. Finally the regression analysis shows that
perceived product quality, perceived service quality, perceived price fairness has significant and
positive linkage with the customer loyalty and customer satisfaction has positive and significant
relationship with the customer loyalty. After that the benefits and limitation of the study are
discussed. End list of references is also provided.
Keywords: Perceived product quality, Perceived service quality, Perceived price fairness,
Customer satisfaction, Customer loyalty, fast food industry, Lahore, Pakistan etc.
7/26/2019 Final Research Work.docx
http://slidepdf.com/reader/full/final-research-workdocx 7/74
7
Table of Contents
Declaration of Originality.................................................................................. I
Acknowledgement............................................................................................... II
Dedication............................................................................................................ III
Abstract.....…………................................................................................…… IV
Chapter 1: Introduction………………………………………………………. 7
1.0 Introduction………………………………………………………. 7
1.1 Purpose statement ……………………………………………….. 9
1.2 O bjectives ………………………………………………………... 9
1.3 Significance ……………………………………………………… 10
1.4 R esearch questions ………………………………………………. 11
Chapter 2: Literature Review……………………………………………...…. 13
2.0 Theoretical Model ……..………………………………………… 35
Chapter 3: Data/ Methodology.......................................................................... 40
4.0 Tools of data collection ………………………………………….. 40
4.1 Sampling technique and sample ……………………………….… 41
4.2 Measure ………………………………………………………….. 42
7/26/2019 Final Research Work.docx
http://slidepdf.com/reader/full/final-research-workdocx 8/74
8
4.3 Data analysis …………………………………………………….. 43
Chapter 5: Analysis………….....…..…..…………………………………...…. 45
5.0 Data screening..………………………………………………….. 45
5.2 R esults …………………………………………………………… 45
5.2.1 Descriptive summary ……………………………………… 46
5.2.2 Histogram..…………………………………………………. 47
5.2.3 Scatter plot ………………………………………………… 51
5.2.4 Correlation ………………………………………………… 55
5.2.5 Regression …………………………………………………. 57
Chapter 6: Discussion/ conclusion..…..…………………………………...….. 60
6.0 Discussion ……………………………………………………….. 60
6.1 Conclusion ………………………………………………………. 63
References ………………………………………………………………….….. 64
7/26/2019 Final Research Work.docx
http://slidepdf.com/reader/full/final-research-workdocx 9/74
9
CHAPTER No. 1
INTRODUCTION
1.0 Introduction
Fast food industry has become of great important in the recent years in Pakistan. Fast food is the
term given to food that can be prepared and served very quickly. While any meal with low
preparation time can be considered to be fast food, typically the term refers to food sold in a
restaurant or store with low quality preparation and served to the customer in a packaged form
for take-out/take-away. The term "fast food" was recognized in a dictionary by Merriam –
Webster in 1951.Franchise operations which are part of restaurant chains have standardized food
stuffs shipped to each restaurant from central locations for example like KFC, McDonald, Pizza
Hut, and Burger King and so on. The capital requirements involved in opening up a fast food
restaurant are relatively low. Smaller, individually-owned fast food restaurants are becoming
much more common throughout the world. After getting much response in the world, the fast
food industry is also grooming in Pakistan. There are many fast food chains in Pakistan such as
Macdonald, KFC, Hardees, Pizza Hut, and Subway. There are also local fast food companies in
Pakistan such as Fri Chicks etc. which are attracting huge number of customers. Thousands of
people visit fast food hotels daily. This growth has not only been fuelled by consumer
demand, but also through the expansion of the supply base. Fast-food menus have been limited
in breadth and depth of product mix, as the market has matured. Numbers of chains are able to
offer a new experience to their existing customers and possibly appeal to a new customer base.
By seeing the tremendous response of customers towards the fast food industry, this study is an
attempt to find what factors of fast food industry creates the loyalty among customers. In other
7/26/2019 Final Research Work.docx
http://slidepdf.com/reader/full/final-research-workdocx 10/74
10
words this study finds the reasons due to which customers visit the fast food store again and
again. There are many previous studies which find the factors of customer loyalty such as the
study of Ti Bei and Chiao (2001) found that perceived service quality, perceived product quality,
perceived price fairness, and customer satisfaction creates the customer loyalty. The studies of
Cronin, Bradly, and Hult, (2000); Lee, (1998); Mcdougall, and Levesque, (2000), Sumaedil,
Bakti, and Metasari (2011) find the impact of perceived service quality, perceived price, and
customer satisfaction on customer loyalty. Keeping in view the empirical evidences of previous
studies this study is an attempt to find the indirect impact of perceived service quality, perceived
product quality, perceived price fairness, through customer satisfaction on the customer loyalty
in the fast food industry of Pakistan.
1.1 Purpose Statement
In the ever growing market for fast food industry it becomes very crucial for the fast food
companies to achieve customer loyalty by satisfying its customers. Previous researches pointed
out that various factors serve as the determinants of customer loyalty mediating by the customer
satisfaction. So based on the precious researches the current study purposes to develop the
questionnaires on factors of loyalty to check their relationship with satisfaction and loyalty in the
context of fast food industry of Pakistan. In the present study service quality, perceived product
quality, perceived price fairness are used as independent variables of the study while customer
satisfaction is mediating variable and customer loyalty is the dependent variable of the study.
7/26/2019 Final Research Work.docx
http://slidepdf.com/reader/full/final-research-workdocx 11/74
11
1.2 Research Objectives
To examine the impact of perceived product quality on the customer satisfaction in the
context of fast food industry of Pakistan.
To examine the impact of perceived service quality on the customer satisfaction in the
context of fast food industry of Pakistan.
To examine the impact of perceived price fairness on the customer satisfaction in the context
of fast food industry of Pakistan.
To examine the impact of customer satisfaction on the customer loyalty in the context of fast
food industry of Pakistan.
To examine the impact of customer satisfaction on the customer loyalty in the context of fast
food industry of Pakistan.
To examine the impact of perceived product quality on the customer loyalty in the context of
fast food industry of Pakistan.
To examine the impact of perceived service quality on the customer loyalty in the context of
fast food industry of Pakistan.
To examine the impact of perceived price fairness on the customer loyalty in the context of
fast food industry of Pakistan.
7/26/2019 Final Research Work.docx
http://slidepdf.com/reader/full/final-research-workdocx 12/74
12
1.3 Significance of the study
The present study finds out the different factors affecting customer loyalty in the fast food
industry of Pakistan. the study also determine the impact of customer satisfaction on
customer loyalty in the context of fast food industry of Pakistan
The current study enhances the knowledge on achieving customer loyalty by maintain certain
factors. It means it contribute to the body of knowledge on the relationship among perceived
product quality, perceived service quality, perceived price fairness, and customer loyalty.
This study also enhances the knowledge on the mediating effect of customer satisfaction in
such relationship. Since most of the research on this topic was done in the context of
developed countries so this research is an attempt to find such linkage in the developing
countries context like Pakistan.
The present study also provide the help to the marketing managers of the fast food companies
to maintain the factors which involve in creating the customer loyalty through satisfying the
customers.
Lastly, the current study is significant in a way that it provides the theoretical understanding
of the association among perceived service quality, perceived product quality, perceived
price fairness, customer satisfaction and customer loyalty in the context of Pakistan.
1.4 Research question and Hypothesis
1.4.1 Main research question
What are the factors which contribute to the creation of customer loyalty in the fast food
industry of Pakistan?
7/26/2019 Final Research Work.docx
http://slidepdf.com/reader/full/final-research-workdocx 13/74
13
1.4.2 Hypothesis
H1: A relationship exists between perceived product quality and customer satisfaction.
H2: A relationship exists between perceived service quality and customer satisfaction.
H3: A relationship exists between perceived price fairness and customer satisfaction.
H4: A relationship exists between customer satisfaction and customer loyalty.
H5: A relationship exists between perceived product quality and customer loyalty.
H6: A relationship exists between perceived service quality and customer loyalty.
H7: A relationship exists between perceived price fairness and customer loyalty.
7/26/2019 Final Research Work.docx
http://slidepdf.com/reader/full/final-research-workdocx 14/74
14
CHAPTER No. 2
LITERATURE REVIEW
Relationship between Perceived Product Quality and Customer Satisfaction
A research study was conducted by the Tsiotsou (2005) to find out the linkage among perceived
product quality, satisfaction, and purchase intensions. The purpose of the study was to determine
the influential effects of perceive product quality and satisfaction on the consumers purchase
intensions. The study also proposed to check the effect of involvement and value on the purchase
intensions of buyers. The data of the study was collected by conducting questionnaire survey
from the consumers of sports shoes. The population of the study was the students out of which
197 were selected to response the questionnaire. The collected data was then analyzed by using
SPSS. The results of the study showed that perceived product quality influence the customer
satisfaction which in then affects the purchase intensions of buyers. Moreover the study found
that customer satisfaction strongly and directly influences the purchase intension. Lastly the
study revealed that involvement has strong but indirect impact o the purchase intensions of the
buyers.
Another research work was done by the Abdullah et al, Rozario (2009) to determine the effect of
service quality and product quality on the satisfaction of customers in the context of Malaysian
hotel industry. The purpose of the study was to identify the determinants of customer
satisfaction. The independent variables of the study were service quality, and food quality. The
term customer satisfaction was used as the dependent variable of the study. The data of the study
was collected by using questionnaire survey from 149 customers of hotels of Kuala Lumpur,
Malaysia. SPSS method was used to analyze the collected data. The results of the study showed
7/26/2019 Final Research Work.docx
http://slidepdf.com/reader/full/final-research-workdocx 15/74
15
that service quality positively and strongly effect the customer satisfaction as the significance
value of their relationship was (r=0.544, p=0.000). The results also showed that food quality
strongly and negatively affect the customer satisfaction as the significance value of their
relationship was (r=-0.268, p=0.001).
A research study was also conducted by the Andaleeb and Conway (2006) to verify the factors
affecting customer satisfaction in the context of restaurant industry of USA. The objective of the
research work was to determine that what factors contribute to satisfy the customer in the service
industry mainly in restaurant industry. The data of the research was collected by using structure
questionnaires from the restaurant users selected from telephone book by using random sampling
technique. Qualitative interviews were also conducted to collect the data from the respondents
selected by using judgment sampling. The collected data was then analyzed by using factor
analysis and multiple regression analysis. The results of the study revealed that responsiveness
was the most influential factor of customer satisfaction. Food quality and price also found to
have significant influence on customer satisfaction. Lastly it was found that physical design and
appearance of the restaurant does not affect the satisfaction of the customers.
A research work was conducted by the Tsiotsou (2005) to check the impact of perceived product
quality on satisfaction, involvement, and purchase intensions of the customers in Greek
university perspective. The study considered various quality determinants to check their relation
with the product involvement, overall satisfaction and purchase intentions. The data of the
research work was collected by conducting questionnaire survey. 204 students of the university
were selected to collect the data. After the analysis of collected data the study revealed that
perceived quality strongly affect the customer satisfaction while have moderate relation with the
product involvement and purchase intensions.
7/26/2019 Final Research Work.docx
http://slidepdf.com/reader/full/final-research-workdocx 16/74
16
Relationship between Perceive Service Quality and Customer Satisfaction
Abedniya, Zaeim, and Hakimi (2011) conducted the study to check the impact of Customers’
Perceived Service Quality on customer Satisfaction in the Islamic banking perspective of
Malaysia. Customer satisfaction was used as the dependent variable of the study which depends
on the perceived service quality (Independent variable). The study used a cross-sectional
research design which is a study based on accumulated data analysis to provide insights to
answering our research questions. This design of research was used to conduct our study in all
Islamic banks in Kuala Lumpur, the capital of Malaysia. The questionnaire was filled by 102
respondents. The collected data was then analyzed by using SPSS 15. Factor analysis,
Correlation, and regression analysis were applied to the collected data to analyze the findings of
the study. The results of the study showed that perceived service quality positively and strongly
affect the customer satisfaction.
Lee and Yoo (2000) conducted the study to identify the factors of perceived service quality and
to check their linkage with the customer satisfaction. Determinants of service quality like
tangibles, and responsiveness were taken as the independent variable. Customer satisfaction was
taken as the dependent variable of the study. The research was done in the people based and
equipment based industries context. After the analysis of the collected data the results of the
study showed that tangibles appeared to be a more important factor in the facility/equipment-
based industries, whereas responsiveness is a more important factor in the people-based
industries.
Kuo, Wub, and Deng (N.D.) conducted the study to check the relationship among service
quality, perceive value, customer satisfaction, and post purchase intension in the context of
Taiwan. The main objective of the study was to develop a tool to asses’ service quality of mobile
7/26/2019 Final Research Work.docx
http://slidepdf.com/reader/full/final-research-workdocx 17/74
17
value-added services and have a further discussion of the relationships among service quality,
perceived value, customer satisfaction, and post-purchase intention. The data of the study was
collected from college and graduate students of fifteen major universities in Taiwan. The
collected data was then analyzed by using SEM and regression analysis. The study revealed that
service quality strongly affects the customer satisfaction and perceived value. The study also
revealed that perceived value has positive and significant relation with the satisfaction and
purchase intension. Further the study revealed that customer satisfaction has direct and strong
linkage with the purchase intensions. Lastly, the study revealed that service quality has strong
but indirect relationship with the purchase intensions.
A research work was conducted by the Chaipakdee, and Wetprasit (N.D.) to determine the
linkage among service quality, customer satisfaction, perceived value, and behavioral intentions
in the context of Thailand. The main objective of the study was to identify the perceptions of
customers about service quality provided by sea-kayaking operations based in Phuket and Phang-
Nga Province. Another objective of the study was to determine the influential affect of service
quality on satisfaction, value, and behavioral intensions. The data of the study was collected by
using self administrated questionnaire survey. The collected data was then analyzed by using
regression analysis. The findings of the study suggested that all the determinants of service
quality were significantly and positively linked with the satisfaction. The results also suggested
that the price variable was the most important contributor to tourist satisfaction, whereas
“company provides service quality worth the money paid” was the most important contributor to
behavioral intention.
Wei (2010) conducted a study to find the factors affecting customer satisfaction in the banking
sector of New Zealand. The purpose of the study was to determine the determinants of perceived
7/26/2019 Final Research Work.docx
http://slidepdf.com/reader/full/final-research-workdocx 18/74
18
service quality and its relationship with the customer satisfaction, corporate image, and perceived
value in the banking sector. The dimensions of service quality were taken as the independent
variables of the study. Corporate image and perceived value were taken as the moderating
variables and customer satisfaction was the dependent variable of the study. The data of the
study was collected from the customers of local commercial banks of New Zealand. The sample
of the study was selected by using convenience sampling technique. The collected data was then
analyzed by using SPSS. The findings of the study showed that service quality has most
significant and strong relationship with customer satisfaction as compared to the perceived value
and corporate image. Further the study also provided the evidence of mediating effect of value
and image in the relationship between service quality and satisfaction.
Clemes, Gan, Kao, and Choong (2008) conducted the empirical study to analyze customer
satisfaction in the context of international air travel industry. The objective of the research was to
find the factors which affect customer satisfaction and behaviors in the air travel industry.
Another objective of the study was to determine the most important and least important
dimensions of service quality. Timeliness, assurance, convenience, helpfulness, comfort, meals,
and safety and security were taken as the dimensions of service quality which was the
independent variable of the study. The data of the study was collected from the sample of 428
passengers of international air travel. After the analysis of the study the findings of the study
showed that all the dimensions of service quality positively affect the customer satisfaction.
Moreover the study showed that safety and security was considered as the most important
dimension of service quality.
7/26/2019 Final Research Work.docx
http://slidepdf.com/reader/full/final-research-workdocx 19/74
19
Relationship between Perceived Price Fairness and Customer satisfaction
Bei, and Chiao (2001) conducted the study to check the impact of the perceived service quality,
perceived product quality and perceived price fairness on the customer satisfaction and customer
loyalty in the automobile industry. The purpose of the study was to balance service quality, and
product quality into an integrated model. Another objective of the study was to determine the
impact of perceived product quality, perceived service quality, and perceived price fairness on
customer loyalty through customer satisfaction. A questionnaire method was used to collect the
data on the variables of data from the respondents of the study. A survey of 495 customers of
three automobile companies (Mitsubishi, Nissan, and Toyota) was conducted. The collected then
analyzed through SPSS. The results of the study revealed that 1). Service quality has positive
relationship with the satisfaction as the significance value was 0.01 and value of t= 3.09. 2).
Service quality has positive relationship with the Loyalty as the value of t = 2.63, P < 0.001. 3).
Product quality has positive relationship with the satisfaction as the significance value was 0.01
and value of t= 5.65. 4). Product quality has positive relationship with the Loyalty as the value of
t = 4.42, P < 0.001. 5). Perceived price fairness has positive relationship with the satisfaction as
the significance value was 0.01 and value of t= 7.91.6). Perceived price fairness has positive
relationship with the Loyalty as the value of t = 9.23, P < 0.001. 7). Satisfaction has positive
relationship with the Loyalty as the value of F = 227.857 and the significance level were 0.001.
Sumaedil, Bakti, and Metasari (2011) conducted the study to check the impact of perceive
service quality and perceived price on the satisfaction of students in the context of Indonesia.
Perceived service quality and perceived price were the independent variables of the study while
the satisfaction was used as the dependent variable of the study. The research study was
quantitative in nature which used survey method for data collection. The data of the study was
7/26/2019 Final Research Work.docx
http://slidepdf.com/reader/full/final-research-workdocx 20/74
20
collected from the sample size of 155 students of two Indonesia public universities. The data of
the study was analyzed by using regression analysis. The results of the study showed that the
perceived service quality and perceived price strongly and positively affect the student’s
satisfaction as the F statistic value of their relationship was 52.884 and the significance value of
the relationship was 0.000.
A research work was conducted by the Dai (2010) to determine the mediating effect of customer
loyalty in the relationship among perceived price fairness, customer satisfaction, and behavioral
intensions. The objective of the study was to verify the relationship of price fairness with
customer satisfaction and behavioral intension. The study also proposed to verify the mediating
effect of customer loyalty. Perceived price fairness was the independent variable of the study.
Loyalty was the mediating variable of the study while customer satisfaction and behavioral
intensions were used as the dependent variable of the study. The data of the study was collected
from the students of Auburn University and Sam Houston State University. The sample of the
study was selected by using convenience sampling technique. SEM was used to analyze the
findings of the study. The study revealed that customer loyalty plays a mediating role in the
relationship of perceived price fairness and satisfaction. The study also revealed that perceived
price fairness has strong and positive relationship with the satisfaction. Moreover the study found
that perceived price fairness also influence the repurchase intensions of buyers.
Herrmann, Xia, Monroe, and Huber (2007) conducted the study to check the impact of the
perceived price fairness on customer satisfaction in German automobile industry context. The
objective of the study was to clarify the linkage between perceived price fairness and satisfaction
empirically. Further, it seeks to examine specific factors that influence fairness perceptions
including price perception and consumer vulnerability. Perceived price fairness was the
7/26/2019 Final Research Work.docx
http://slidepdf.com/reader/full/final-research-workdocx 21/74
21
independent variable of the study while satisfaction was the dependent variable of the study. The
data of the study was collected by the sample of 246 car users in German. The results of the
study revealed that the perceptions about price strongly and positively affect the satisfaction. The
study also revealed that consumers vulnerability negatively influence the perceived price
fairness.
Hanif, Hafeez, and Riaz (2010) completed a research study with a purpose to determine the
factors of customer satisfaction. The study was done in the telecom sector of Pakistan. Price
fairness and customer services were the independent variable of the study while customer
satisfaction was the dependent variable of the study. Users of Telenor, Mobilink, and Ufone were
selected as the population of the study. The data of the study was collected by conducting
questionnaire survey from the sample of the study. The collected data was then analyzed by
using correlation and regression analysis. The findings of the study confirmed that price fairness
and customer services strongly and positively influence the customer satisfaction. The results of
correlation analysis showed that price fairness and customer satisfaction were strongly correlated
with each other as the value of their relation was 0.51. Similarly the value of correlation between
satisfaction and customer services was 0.50 which indicated the strong correlation between these
variables. The results of the regression analysis showed that price fairness and customer services
have linkage with the satisfaction as the values of their coefficients were 0.507 and 0.447.
Ahmat, Radzi, Zahari, Muhammad, Aziz, and Ahmad (2011) conducted the research study to
find the determinants of price fairness which affect consumer response behaviors in the hotel
industry of Malaysia. Four variables were analyzed in this study which was a) treatment
experience, b) price knowledge, c) price expectation, and d) price information to check their
relationship with the response behaviors of the tourists of Langkawi Island, Malaysia. The data
7/26/2019 Final Research Work.docx
http://slidepdf.com/reader/full/final-research-workdocx 22/74
22
of the study was collected by using self administered questionnaire survey from the tourists stay
at four and five star resort restaurants in Langkawi Island, Malaysia. A total of 330
questionnaires were distributed among the respondents having 100% response rate. The collected
data was then analyzed by using SPSS16. The results of the study treatment experience (β =
.150, p < 0.05), price expectation (β = .078, p > 0.05) has direct and positive relationship with the
response behaviors of the customers. The study also confirmed that price information (β = -.050,
p > 0.05), and price knowledge (β = -.220, p < 0.05) has negative relationship with the response
behavior.
Relationship between Customer Satisfaction and Customer Loyalty
Yang, and Peterson (2004) conducted the study to check the role of switching costs in the
relationship among perceive value, satisfaction and loyalty. The study proposed to find the
mediating effect of switching cost in the relationship among perceived value, satisfaction, and
loyalty. The study took consumer value and perceives satisfaction as independent variables. The
switching cost was the mediating variable of the study. The dependent variable of the study was
loyalty. The data was collected through web based online survey from the users of online users.
The data of the study was collected by using questionnaires. The collected data was then
analyzed by using statistical package for social sciences. After the analysis of data the study
revealed that perceived value and satisfaction are the strong predictors of customer loyalty. The
study also revealed that switching cost strong mediates the relation of satisfaction, value, and
loyalty.
Hallowell (1996) conducted the empirical study to investigate the relationship among the
satisfaction of customers, customer loyalty, and profitability. The purpose of the research was to
7/26/2019 Final Research Work.docx
http://slidepdf.com/reader/full/final-research-workdocx 23/74
23
determine the factors which contribute to the profitability of the firm. The study used customer
satisfaction as independent variable, customer loyalty as mediating variable and profitability as
dependent variable. The study was quantitative in nature which used questionnaires for the
collection of the data from the sample of the study. The data was then analyzed by using SPSS.
The study revealed that customer satisfaction, and customer loyalty positively and strongly
affects the profitability of the firm. The results of the study were consistent with the findings of
Heskett et al., and Storbacka et al., (1994).
A research study was conducted by the Mohsan, Nawaz, Khan, Shaukat, Aslam, (2011) to check
the relationship among customer satisfaction, loyalty and intensions to switch in the context of
banking industry of Pakistan. The purpose of the research was to determine the linkage among
customer satisfaction, customer loyalty and intentions to switch. Customer satisfaction was taken
as the independent variable. Customer loyalty and intensions to switch were taken as the
dependent variables which depend on customer satisfaction. The data of the research was
collected by using questionnaire survey. The data of the research was collected from the sample
size of 120 customers of banks of Pakistan. The analysis of the data was done by using Microsoft
Excel and SPSS 16. The results of the study confirmed that customer satisfaction has positive
and significant relationship with the customer loyalty as the significance value of their
relationship was (0.001). The study also suggested that customer satisfaction has negative
relationship with the intensions to switch as the significance value indicated which was (-0.003).
Chumpitaz, and Swaen (2003) conducted the study to check the mediating effect of customer
satisfaction in the relationship between service quality and brand loyalty in the context of airline
company. The independent variable of the study was Service quality which was measured by
7/26/2019 Final Research Work.docx
http://slidepdf.com/reader/full/final-research-workdocx 24/74
24
(Check-in boarding, Service on board, Food service, and Aircraft comfort). Customer
satisfaction was taken as the mediating variable while the dependent variable of the study was
Brand Loyalty. The data of the study was gathered by using questionnaires. The data was
collected from the sample of 4006 clients of an airline company. The collected data was then
analyzed by the LISREL. The study revealed that service quality creates the customer
satisfaction among customers. The study also revealed that customer satisfaction strongly
influences the purchase intensions. Lastly, the study revealed that customer satisfaction mediates
the relationship between service quality and brand loyalty.
Yeung (N.D.) conducted the study to check the relationships among service quality, image,
customer satisfaction and loyalty in a Hong Kong franchised bus company. The purpose of the
study was to investigate how service quality, image, satisfaction and loyalty are related to gain
insight on the decreasing market share problem based on data collected from passengers of a
franchised bus company in Hong Kong in 2004. Service quality was taken as the independent
variable of the study. Corporate image and Satisfaction were taken as the mediating variables
while customer loyalty was taken as the dependent variable. The target population of the study
was purely KMB passengers. Stratified sampling was employed to select the bus routes within
each type of stratum: urban Kowloon, New Territories, and cross-harbour. Passengers over 16
years old waiting at the bus stops or stations to ride the selected bus routes and had ridden a
KMB bus in the previous month were invited for interview. A total of 855 passengers were
randomly selected to complete the questionnaire; only 636 samples were valid and included in
the analysis. Successful response rate was 74.4%. Structural equation modeling (SEM) technique
was employed to analyze the collected data. The results of the study showed that, 1). Service
quality affects satisfaction and image directly, 2). Image affects overall satisfaction and loyalty
7/26/2019 Final Research Work.docx
http://slidepdf.com/reader/full/final-research-workdocx 25/74
25
directly, and 3). Overall satisfaction affects loyalty directly. The study also resulted that service
quality does not affects loyalty directly. Service quality has only indirect effect on loyalty
through image and overall satisfaction.
Hu, Cheng, Chiu, and Hong (2011) conducted the study to check the relationship among quality
attributes, customer satisfaction, and customer in the context of medical service industry of
Taiwan. The objective of the study was to investigate the impact of service quality attributes on
customer satisfaction and customer loyalty by using Kano’s integrated model and the Customer
Satisfaction Index Model. The independent variables of the study were customer expectation and
perceive quality. The mediating variables of the perceive value and customer satisfaction.
Complaint behavior and customer loyalty were taken as the dependent variables in the study.
The data for analysis was collected by using questionnaire survey which was sent to 1,100 clients
of 15 hospitals of Taiwan. The sample size of the study was 1100 clients which were selected by
using convenience sampling technique. Out of 1100 questionnaires, the total of 923 was used for
analysis showing the response rate of 89.3 percent. The study revealed that customer satisfaction
was influenced by the one-dimensional and attractive attributes, and negatively affected by
customer complaints. Surprisingly, the must-be attributes could not predict customer satisfaction,
which suggests that competitive convergence played a role within the Taiwan context. As well,
customer loyalty proved to be independent of customer satisfaction and customer complaints.
Bloemer, Ruyter, and Peeters (1998) conducted the study to determine the factors affecting
customer loyalty in the banking sector of Netherland. The objective of the study was to clarify
the factors which strongly affect the customer loyalty. The study took image, service quality, and
customer satisfaction as the strong predictors of customer loyalty. Image was taken as the
independent variable of the study. Perceive quality and satisfaction was taken as the mediating
7/26/2019 Final Research Work.docx
http://slidepdf.com/reader/full/final-research-workdocx 26/74
26
variable while loyalty was taken as the dependent variable of the study. The data of the study
was collected by interviewing 2500 customer of Netherland’s major banks. The sample of the
study was taken from the bank’s customer database. The sample size of the study was selected
by using random sampling technique.
The results of the study revealed that image has strong and positive linkage with the perceived
service quality (r = 0.59). The study also resulted that image has strong and positive linkage with
the customer satisfaction (r = 0.44), and customer loyalty (r = 0.53). Furthermore, the study
revealed that perceived service quality has significant and positive linkage with satisfaction (r =
0.55), and loyalty (r = 0.66). The study also revealed that customer satisfaction has strong
relationship with the customer loyalty (r = 0.59). The study also revealed that perceived service
quality and customer satisfaction has positive and significant relationship with the customer
loyalty as the values of their relationship were (beta = 0.38 and beta = 0.42) respectively.
Relationship between Perceived Product Quality and Customer Loyalty
Yee (2008) conducted the study to check the relationship between customer’s perceived quality
and business loyalty in B2B organizations context. The purpose of the study was to check the
influential effect of perceived quality on customer loyalty in the context of wooden product
manufacturers of Malaysia. Perceived quality (service and product quality) was the independent
variable of the study while loyalty was selected as the dependent variable of the study. Customer
satisfaction was the mediating variable of the study. The data of the study was collected by using
questionnaires. The questionnaires were filled by 36 respondents which were used for analysis.
After the analysis of the data the study revealed that perceived service quality and perceived
7/26/2019 Final Research Work.docx
http://slidepdf.com/reader/full/final-research-workdocx 27/74
27
product quality significantly affect the customer satisfaction. The study also revealed that
customer satisfaction significantly influences the customer loyalty and relationship quality.
Chang and Fong (2010) conducted the study to verify the relationship among Green product
quality, green corporate image, green customer satisfaction, and green customer loyalty. The
purpose of the study was to explore the relationships among green product quality, green
corporate image, green customer satisfaction, and green customer loyalty. The study used the
green product quality and green corporate image as independent variables while study employed
green customer satisfaction and green customer loyalty as the dependent variables. The data of
the study was collected by using questionnaire survey. The authenticity of the questionnaires was
ensured by mailing it to 10 scholars and experts for refine purpose. The data of the study was
collected from the users of green products. The questionnaires were filled by 600 respondents
out of which just 196 were used for the analysis purpose showing the response rate of 32.67
percent. AMOS was used to run the confirmatory factor analysis. The study revealed that green
product quality strongly and positively affects the green customer satisfaction and green
customer loyalty. The study also revealed that green corporate image has positive and
significant relationship with the green customer satisfaction and loyalty. Further the study
revealed that green customer satisfaction has strong and positive relationship with the green
customer loyalty.
Jahangir, Parvez, Bhattacharjee, Ahamed (2009) conducted the study to check the linkage among
brand affect, brand quality, and customer’s brand extension attitude mediating by the customer
loyalty. The research intended to propose a conceptual framework that will investigated the
effects of brand affect and brand quality on customers’ brand extension attitude mediated
through customer loyalty. Brand trust, brand affect, and brand quality was taken as the
7/26/2019 Final Research Work.docx
http://slidepdf.com/reader/full/final-research-workdocx 28/74
28
independent variable while mediating variable of the study was customer loyalty. Consumer
brand extension attitude was taken as the dependent variable of the study. Structured
Questionnaire survey was used to collect the data of the study from the sample size of 100
customer of fruit juice. All 100 questionnaires were returned which were used for analysis
purpose having response rate of 100 percent. The collected data was then analyzed by using
Pearson correlation and regression analysis. The results of the correlation analysis revealed that
brand quality and brand affect strongly influence the brand loyalty as the values showed (r = .45,
p < .01; r = .40, p < .01 respectively). The results also revealed that brand extension attitude has
strong and significant relation with the brand affect (r = .33, p < .01), brand quality (r = .27, p <
.01), and brand loyalty (r = .58, p < .01). The results of the regression analysis revealed that
brand affect and quality has strong and positive linkage with the brand loyalty as confirmed by
the values (β = 0.342, p < .01; β = 0.414, p < .001 respectively). Lastly, the results of regression
analysis revealed that customer loyalty has significant and positive linkage with the brand
extension attitude as the value suggested (β = 0.552, p < .001).
Relationship between Perceived Service Quality and Customer Loyalty
Kiran, and Diljit (2011) conducted the research work on Antecedents of customer loyalty in the
context of academic library setting. In this study service quality was taken as independent
variable. Service value and customer satisfaction was taken as the mediating variables while
customer loyalty was taken as the dependent variable. The target population of the study were
consisted of postgraduate students and teaching staff at four research intensive universities in
Malaysia. The sample of the study was selected on the basis of convenience sampling as it was
difficult to obtain the contact of all postgraduates. Data was collected by assistants over two
7/26/2019 Final Research Work.docx
http://slidepdf.com/reader/full/final-research-workdocx 29/74
29
months, April 2009-May 2009. A total of 2000 questionnaires were distributed and the return
rate was 22% (441), of which 231 cases were used for analysis after data cleaning and
eliminating non web-based library service users. Structural equation modeling (SEM) was used
to analyze the collected data. The results of the study showed that perceived service quality has a
positive effect on customer satisfaction (β= 0.54, p<.01) and service value (β= 0.82, p<.01).
However, the relationship between perceived service quality and customer loyalty was negative
and not statistically significant (β= -0.11). Although service quality does not have a significant
direct effect on customer loyalty, it has an indirect positive effect on customer loyalty (.91).
Customer Value too does not have a significant direct effect on Customer Loyalty, but is has an
indirect positive effect on customer loyalty via customer satisfaction (.35). The total effect of
service quality on customer loyalty is (.80). The results also indicated that customer satisfaction
mediated the relationship between service quality and customer loyalty.
Al-Rousan, Ramzi, and Mohamed (2010) conducted the study to check the relationship between
customer loyalty and service quality loyalty in the context of five star hotels in Jordan. The
purpose of the research was to empirically investigate the dimensions of service quality and its
impact on customer loyalty in hotel industry of Jordan. The dimensions of service quality
(empathy, reliability, responsiveness and tangibility) were taken as the independent variables of
the study while customer loyalty was the dependent variable of the study. The data of the study
was collected by using self administered questionnaire from the sample size of 322 customers of
three branches of Marriott hotel in Jordan. The data of the study was analysis by using SPSS 16.
The study revealed that dimensions of service quality such as empathy, reliability,
responsiveness and tangibility have strong and positive relationship with the customer loyalty.
7/26/2019 Final Research Work.docx
http://slidepdf.com/reader/full/final-research-workdocx 30/74
30
The study also revealed that tangibility was found be most strong influential factor of customer
loyalty.
Ismail, Haron, Ibrahim, and Isa (2006) conducted the study to check that what factors could lead
to the customer loyalty in the audit firms of Malaysia. The purpose of the study was to find the
factors which could possibly be the reason of customer loyalty. The dimensions of service
quality (reliability, assurance, tangibility, empathy and responsiveness), and customer
satisfaction were taken as the antecedents of customer loyalty. 500 questionnaires were sent to
the respondents out of which 115 questionnaires were returned showing the response rate of
23%. The study revealed that out of all dimensions of service quality, tangible has strong and
positive relationship with customer loyalty as other did not find to be the strong predictors of the
loyalty. The study also revealed that empathy has the weakest relation with the loyalty. Lastly
the study revealed that satisfaction does play the mediating role in the relationship between
reliability and loyalty.
Rauyruen, Miller, and Barrett (n.d.) conducted a research study on quality and loyalty
relationship. The objective of the study was to check the linkage between relationship quality
and loyalty in Australian courier service industry context. Trust, commitment, satisfaction and
service quality were used as the dimensions of relationship quality which was the independent
variable of the study. Customer loyalty was selected as the dependent variable of the study. The
data of the study was collected by using two approaches i.e. online survey and mail survey. The
data of the study was collected from 306 respondents. A two step approach (Anderson and
Gerbing 1988) was selected for measurement model and structural model. The study revealed
that all the dimensions of relationship quality (trust, commitment, satisfaction and service
quality) significantly and positively influence the customer loyalty. The study also revealed that
7/26/2019 Final Research Work.docx
http://slidepdf.com/reader/full/final-research-workdocx 31/74
31
customer satisfaction strongly influences the purchase intensions through loyalty. Lastly the
study revealed that service quality has significant relationship with the purchase intension and
attitudinal loyalty.
Relationship between Perceived Price Fairness and Customer Loyalty
Ailawadi, Luan, Neslin, and Taylor (2011) conducted the study to check the relationship of CSR
with perceived price fairness and customer loyalty in the context of United State of America. The
purpose of the study was to check the direct and indirect of CSR on the loyalty. The study also
proposed to check the mediating effect of perceived price fairness in linkage between CSR and
loyalty. CSR was the independent variable of the study while loyalty was selected as the
dependent variable of the study. The mediating variable of the study was perceived price
fairness. The data of the study was collected by conducting self administered questionnaire. The
study revealed that two dimensions of CSR have significant effect on the loyalty. The study also
revealed that CSR doesn’t have direct impact on the loyalty as perceived price fairness mediate
the relationship between CSR and loyalty.
Dai (2010) conducted the study to determine the mediating effect of customer loyalty in the
relationship among perceived price fairness, customer satisfaction, and behavioral intensions.
The objective of the study was to verify the relationship of price fairness with customer
satisfaction and behavioral intension. The study also proposed to verify the mediating effect of
customer loyalty. Perceived price fairness was the independent variable of the study. Loyalty
was the mediating variable of the study while customer satisfaction and behavioral intensions
were used as the dependent variable of the study. The data of the study was collected from the
students of Auburn University and Sam Houston State University. The sample of the study was
selected by using convenience sampling technique. SEM was used to analyze the findings of the

7/26/2019 Final Research Work.docx
http://slidepdf.com/reader/full/final-research-workdocx 32/74
32
study. The study revealed that customer loyalty plays a mediating role in the relationship of
perceived price fairness and satisfaction. The study also revealed that perceived price fairness
has strong and positive relationship with the satisfaction. Moreover the study found that
perceived price fairness also influence the repurchase intensions of buyers.
Mendez, Parraga, Kara, and Urrutia (2009) conducted the study to verify the factors affecting
student’s loyalty in the context of Latin American higher education. The purpose of the study
was to find the factors which strongly affect the student’s loyalty among perceived service
quality, perceived price, satisfaction, trust, and commitment. Factors of loyalty (perceived
service quality, perceived price, satisfaction, trust, and commitment) were the independent
variables of the study while loyalty was selected as the dependent variable of the study. The data
o the study was collected from the freshman, sophomore, junior, and senior students attending
classes at multiple sections of a public Chilean university in two years, 2002 and 2004. A
combined 752 questionnaires were sent to the students out of which all were used for analysis
showing response rate of 100%. After the analysis the study revealed that among all the factors
of loyalty, commitment has significant and direct relationship with the student’s loyalty. The
study also revealed that all other factors have strong but indirect relationship with the loyalty.
7/26/2019 Final Research Work.docx
http://slidepdf.com/reader/full/final-research-workdocx 33/74
33
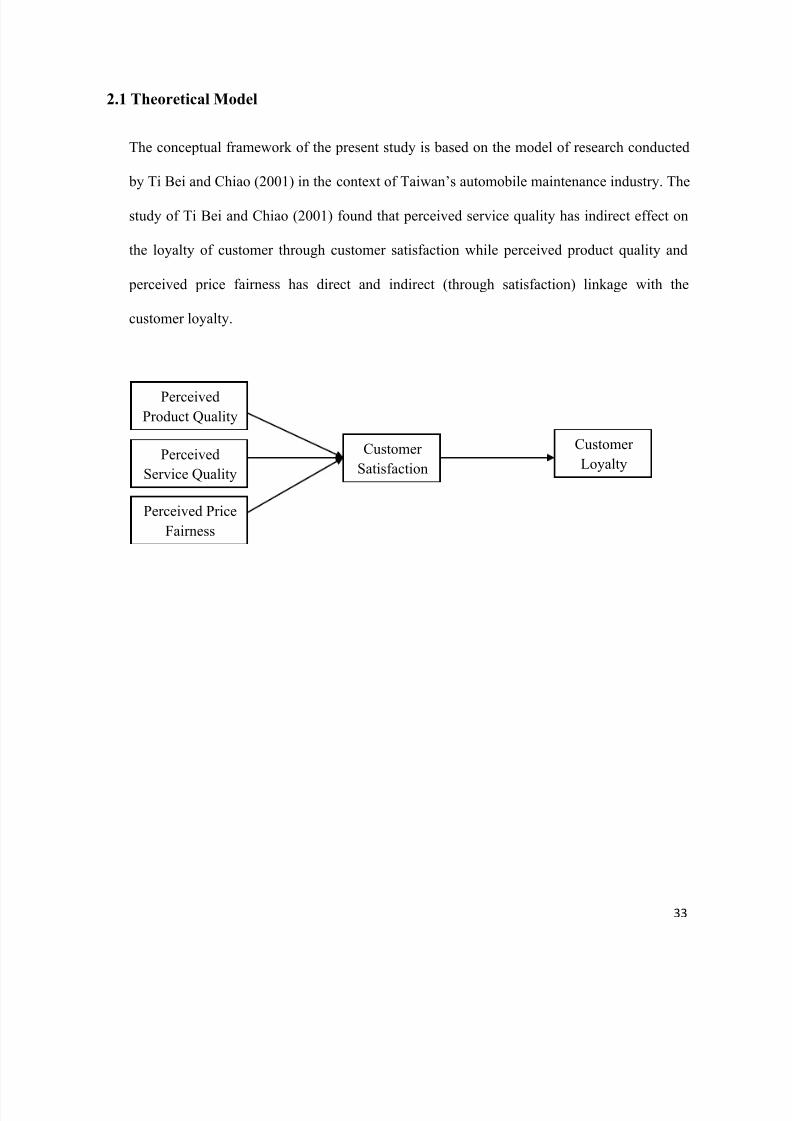
2.1 Theoretical Model
The conceptual framework of the present study is based on the model of research conducted
by Ti Bei and Chiao (2001) in the context of Taiwan’s automobile maintenance industry. The
study of Ti Bei and Chiao (2001) found that perceived service quality has indirect effect on
the loyalty of customer through customer satisfaction while perceived product quality and
perceived price fairness has direct and indirect (through satisfaction) linkage with the
customer loyalty.
Perceived
Product Quality
Perceived
Service Quality
Perceived Price
Fairness
Customer
Satisfaction
Customer
Loyalty
7/26/2019 Final Research Work.docx
http://slidepdf.com/reader/full/final-research-workdocx 34/74
34
CHAPTER No. 3
DATA & METHODOLOGY
3.1 Introduction
The purpose of this chapter is to discuss and explain the research methodology to be used in the
collection of data and after collection, analyzing the data to check and test the research model of
proposed study that is the factors affecting customer loyalty in the fast food industry of Pakistan.
Data collection technique and method, population, sampling techniques, validity and reliability
of data, and data analysis technique is to be discussed in this chapter.
3.2 Research Paradigm
Three types of research paradigms are exist in research. First one is the positivism in which
quantitative research approach is used. In positivism hypothesis are made based on existing
theory which was then verified through empirical evidences. In positivism the data is collected
through questionnaires. The collected data is analyzed through statistical packages for social
sciences.
The second paradigm is interpretivism which is a qualitative research approach. In interpretivism
a new theory is generated. The data is collected through observations and interviews are used to
collect the data. The collected data is analyzed through images and words in interpretivism
approach.
The third approach is pragmatism approach in which both (quantitative and qualitative)
approaches are used to collect and analyzed the data.
7/26/2019 Final Research Work.docx
http://slidepdf.com/reader/full/final-research-workdocx 35/74
35
So the present study uses the positivism research approach because present study employs the
quantitative research method to verify the existing theory of Ti Bei and Chiao (2001). Another
reason for selecting positivism is that the present collects the data through questionnaires and
analyze it through statistical package for social sciences 16.0.
3.3 Sample and Sampling Technique
3.3.1 Population
The population of the study was the customers of fast food restaurants like Macdonald, KFC, and
Fri Chicks situated in Lahore.
3.3.2 Sample size
In order to collect the data a sample size of 150 customers of fast food restaurants in Lahore were
selected.
3.3.3 Sampling Technique
The present employs the convenient sampling technique in which the researcher collect data from the
sources which is most conveniently available to the researcher.
3.4 Tool of data Collection
The data of the study is collected by using questionnaires developed with the help of existing
literature. A questionnaire survey is conducted in the 3 fast food restaurants i.e. Macdonalds,
KFC, and Fri Chicks to collect the data.
The close ended questionnaires for the collection of the data are developed by using 5 point likert
scale from “strongly agree” to “strongly disagree” on all the variables of the study with the help
of existing literature on these variables.
7/26/2019 Final Research Work.docx
http://slidepdf.com/reader/full/final-research-workdocx 36/74
36
Questionnaires Interviews
Questionnaires are very cost effective Interviews are costly
Questionnaires are less intrusive Respondents hesitate to give generalised
answer
Questionnaires reduce bias Interviews increases biasness
Questionnaires are easy to analyze Interviews take time to analyze
3.5 Measures
In order to measure the variables of the present study filled questionnaires were used. The data
was collected from the participants through survey using five point likert scales only and ask few
questions from participants. The each variable was measured by asking some question by using 5
point likert scale.
Perceived product qual ity
The variable perceived product quality was measured by using 5 point likert scale ranging from 1
for strongly disagree to 5 for strongly agree.
Perceived service quali ty
The variable perceived service quality was measured by using 5 point likert scale ranging from 1
for strongly disagree to 5 for strongly agree.
Perceived price fair ness
The variable perceived price fairness was measured by using 5 point likert scale ranging from 1
for strongly disagree to 5 for strongly agree.
Customer satisfaction
7/26/2019 Final Research Work.docx
http://slidepdf.com/reader/full/final-research-workdocx 37/74
37
The variable customer satisfaction was measured by using 5 point likert scale ranging from 1 for
strongly disagree to 5 for strongly agree.
Customer loyalty
The variable customer loyalty was measured by using 5 point likert scale ranging from 1 for
strongly disagree to 5 for strongly agree.
3.6 Reliability and Validity
3.6.1 Reliabi l ity
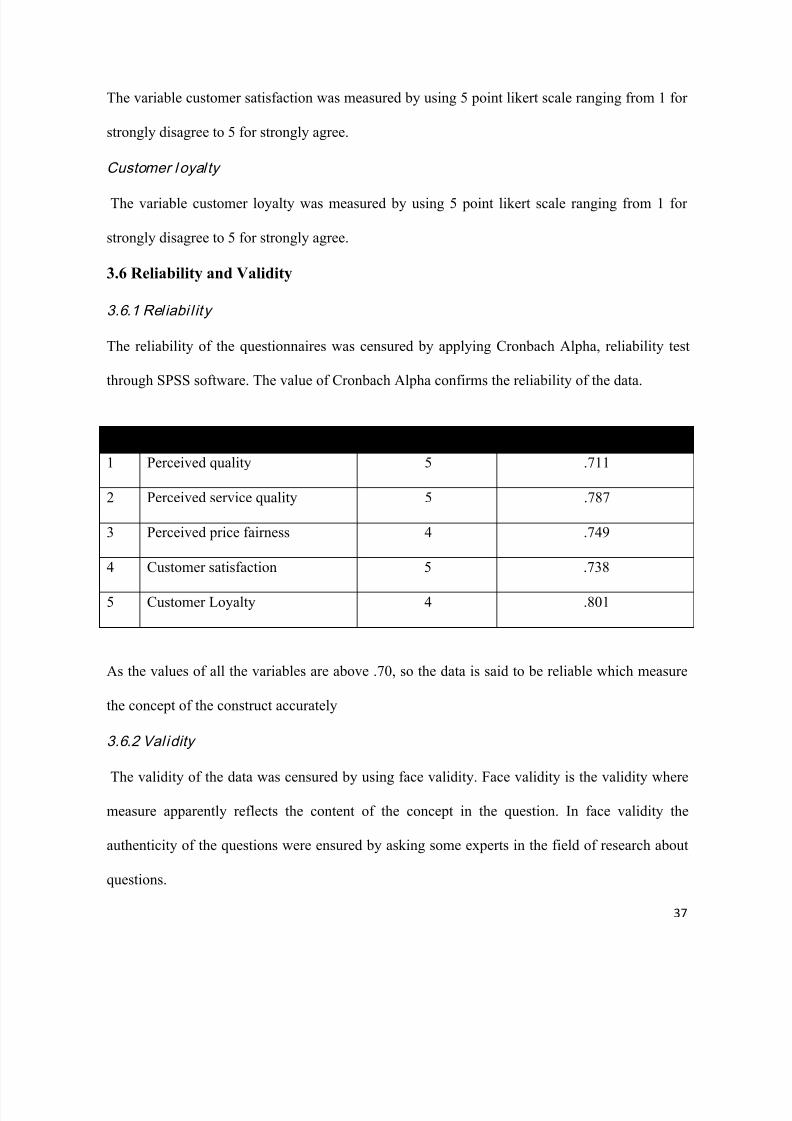
The reliability of the questionnaires was censured by applying Cronbach Alpha, reliability test
through SPSS software. The value of Cronbach Alpha confirms the reliability of the data.
As the values of all the variables are above .70, so the data is said to be reliable which measure
the concept of the construct accurately
3.6.2 Validity
The validity of the data was censured by using face validity. Face validity is the validity where
measure apparently reflects the content of the concept in the question. In face validity the
authenticity of the questions were ensured by asking some experts in the field of research about
questions.
SR# Variable Items Cronbachalpha
1 Perceived quality 5 .711
2 Perceived service quality 5 .787
3 Perceived price fairness 4 .749
4 Customer satisfaction 5 .738
5 Customer Loyalty 4 .801
7/26/2019 Final Research Work.docx
http://slidepdf.com/reader/full/final-research-workdocx 38/74
38
3.7 Data Analysis
The collected data of the study is analyzed by using SPSS 16.0 software. The data is analyzed by
using descriptive statistics, correlation, and regression analysis.
3.7.1 Descriptive Statistics
The purpose of applying descriptive statistics is to find the frequency of the data. Descriptive
statistics is also helpful to find the minimum and maximum range of the data.
3.7.2 H istograms
Histograms are applied to check the graphical representation of all the variables with the curve to
check the normality of the response rate. The bell curved shapes of the data in histogram verify
that the data is normally distributed.
3.7.3 Scatter Plots
Scatter plots were applied to the data to check the relationship between variables. It also
confirms that whether the relationship between two variables is linear or non linear. Scatter plots
are also applied to check the assumption of Pearson correlation.
3.7.4 Corr elation
Correlation is used to check the mutual relationship among variables. For checking the
relationship we will make two hypotheses: null (H0) and alternative (H1). We interpret the
findings on the acceptance or rejection of the hypothesis. We used correlation matrix to check
the mutual relationship of different variables
3.7.5 Regression Analysis
Regression analysis is a statistic technique used to investigate the relationships between a
dependent variable and one or more independent variables. Regression analysis is used to check
the strength of relationship among variables. In regression analysis t-test is used to find the level
7/26/2019 Final Research Work.docx
http://slidepdf.com/reader/full/final-research-workdocx 39/74
39
of significance and r-square test is used. R-square test tells that how much dependent variable is
affected by the independent variable. At the last the present study employed the f-test to check
the overall relationship of the independent variable with dependent variable. The regression
equation will take the foolowing form:
Customer loyalty = a + b PPQ + c PSQ + d PPF + e
In the above equation customer loyalty is the dependent variable, PPQ, PSQ, and PPF are the
independent variables, and e is the random error term. The b, c and d are the regression
coefficients.
7/26/2019 Final Research Work.docx
http://slidepdf.com/reader/full/final-research-workdocx 40/74
40
CHAPTER No. 4
ANALYSIS & RESULTS
4.1 Descriptive statistics
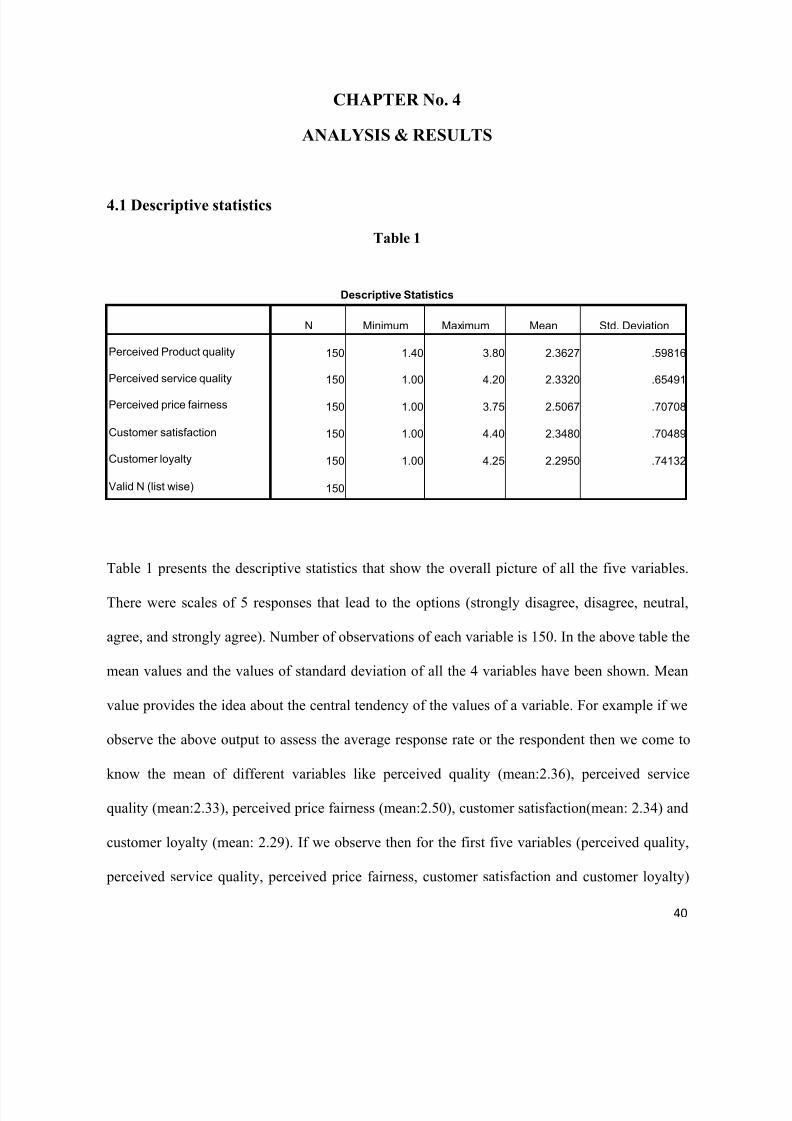
Table 1
Descriptive Statistics
N Minimum Maximum Mean Std. Deviation
Perceived Product quality 150 1.40 3.80 2.3627 .59816
Perceived service quality 150 1.00 4.20 2.3320 .65491
Perceived price fairness 150 1.00 3.75 2.5067 .70708
Customer satisfaction 150 1.00 4.40 2.3480 .70489
Customer loyalty 150 1.00 4.25 2.2950 .74132
Valid N (list wise) 150
Table 1 presents the descriptive statistics that show the overall picture of all the five variables.
There were scales of 5 responses that lead to the options (strongly disagree, disagree, neutral,
agree, and strongly agree). Number of observations of each variable is 150. In the above table the
mean values and the values of standard deviation of all the 4 variables have been shown. Mean
value provides the idea about the central tendency of the values of a variable. For example if we
observe the above output to assess the average response rate or the respondent then we come to
know the mean of different variables like perceived quality (mean:2.36), perceived service
quality (mean:2.33), perceived price fairness (mean:2.50), customer satisfaction(mean: 2.34) and
customer loyalty (mean: 2.29). If we observe then for the first five variables (perceived quality,
perceived service quality, perceived price fairness, customer satisfaction and customer loyalty)
7/26/2019 Final Research Work.docx
http://slidepdf.com/reader/full/final-research-workdocx 41/74
41
the average response rate of responded is lie within the option 2-3 (2 is for disagree and 3 is for
neutral). The minimum option that is ticked by responded is 1 and the maximum option that is
ticked by responded is 4.40.
Standard deviation gives the idea about the dispersion of the values of a variable from its mean
value. So, if we observe then in the response rate for the variable of perceived quality is value of
standard deviation is (S.D.598) which is the lowest value as compare to other variable values.
Which shows that most of the respondent answers were same for the variable of perceived
quality and have consistency in their response rate but if we observe then for customer loyalty
the value of standard deviation is (S.D .74) which is quite high as compare to other variables
which clearly shows that the response regarding perceived price fairness of mostly respondents
were not the same and they don’t have consistency in their answers.
7/26/2019 Final Research Work.docx
http://slidepdf.com/reader/full/final-research-workdocx 42/74
42
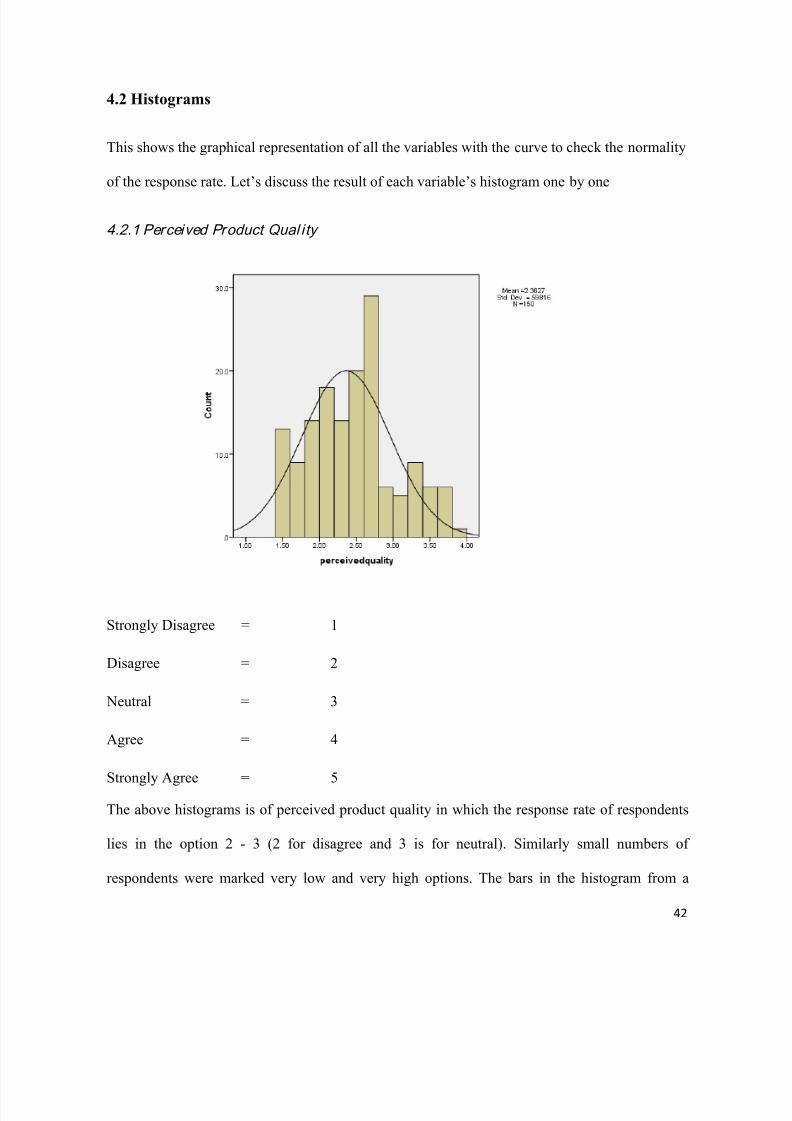
4.2 Histograms
This shows the graphical representation of all the variables with the curve to check the normality
of the response rate. Let’s discuss the result of each variable’s histogram one by one
4.2.1 Perceived Product Qual ity
Strongly Disagree = 1
Disagree = 2
Neutral = 3
Agree = 4
Strongly Agree = 5
The above histograms is of perceived product quality in which the response rate of respondents
lies in the option 2 - 3 (2 for disagree and 3 is for neutral). Similarly small numbers of
respondents were marked very low and very high options. The bars in the histogram from a
7/26/2019 Final Research Work.docx
http://slidepdf.com/reader/full/final-research-workdocx 43/74
43
distribution (pattern or curve) that is similar to the normal, bell shaped curve. Thus, frequency
distribution of the perceived product quality is normal.
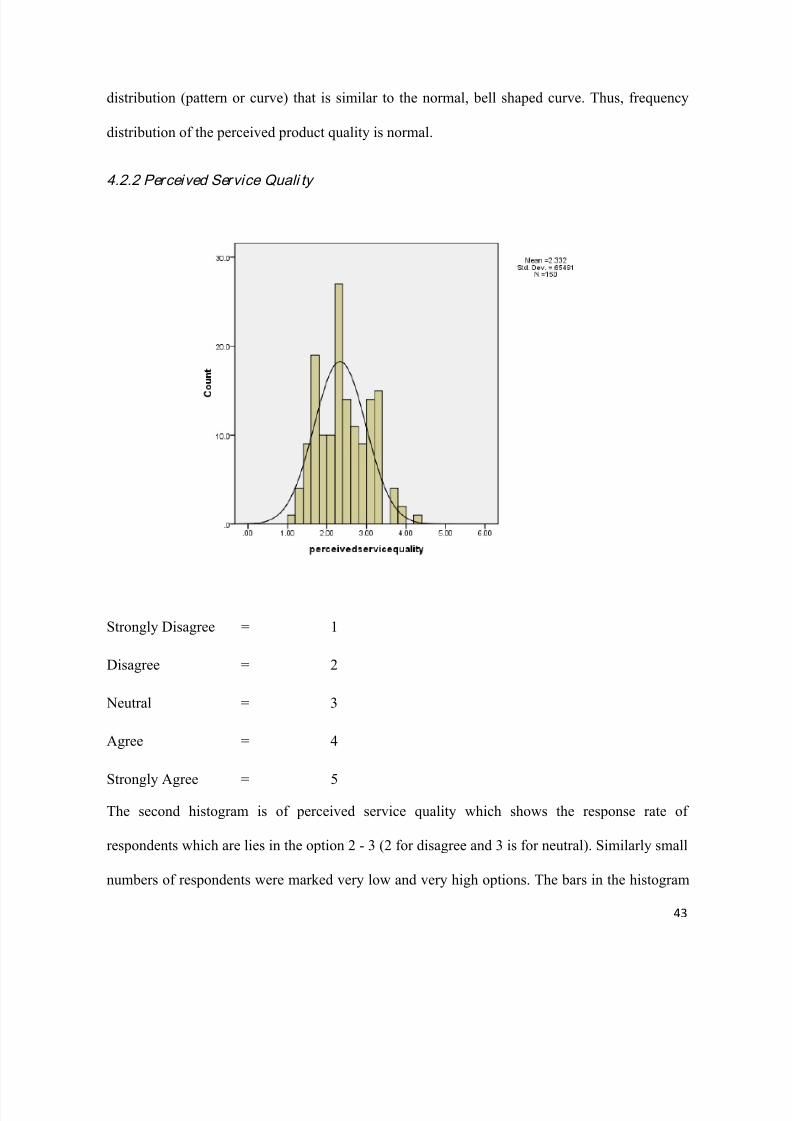
4.2.2 Perceived Service Quali ty
Strongly Disagree = 1
Disagree = 2
Neutral = 3
Agree = 4
Strongly Agree = 5
The second histogram is of perceived service quality which shows the response rate of
respondents which are lies in the option 2 - 3 (2 for disagree and 3 is for neutral). Similarly small
numbers of respondents were marked very low and very high options. The bars in the histogram
7/26/2019 Final Research Work.docx
http://slidepdf.com/reader/full/final-research-workdocx 44/74
44
from a distribution (pattern or curve) that is similar to the normal, bell shaped curve. Thus,
frequency distribution of the perceive service quality is normal.
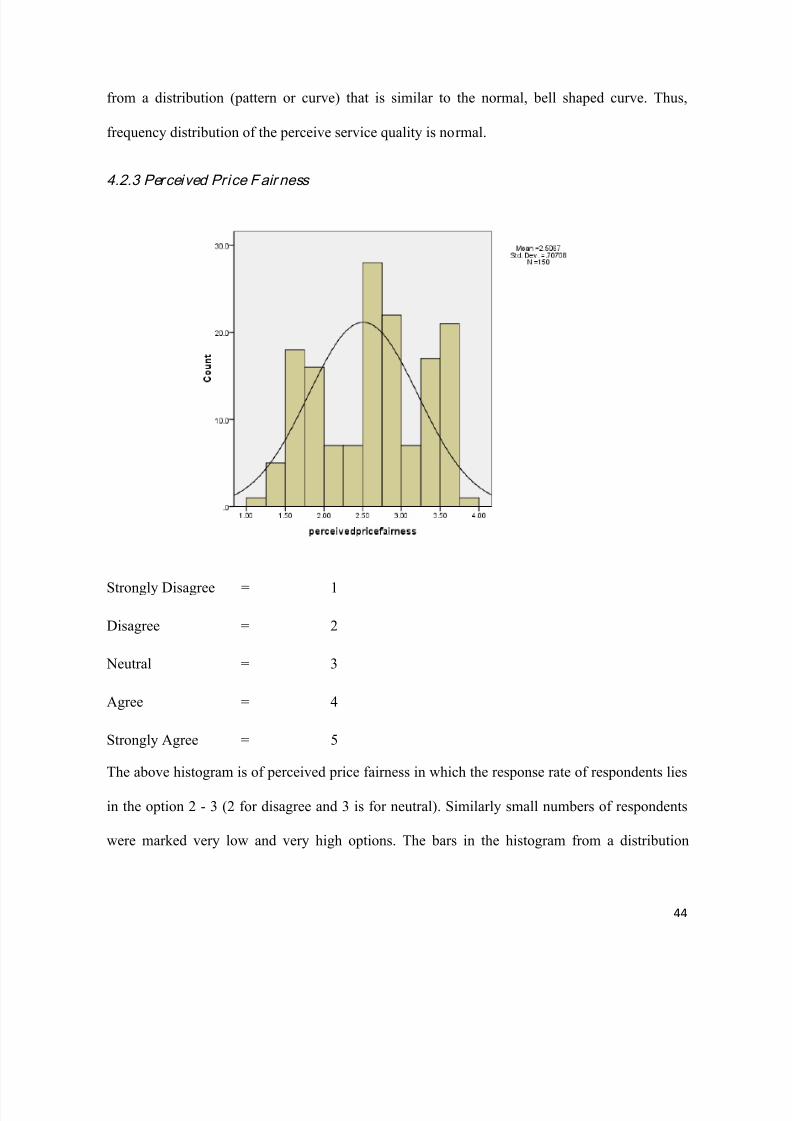
4.2.3 Perceived Price Fair ness
Strongly Disagree = 1
Disagree = 2
Neutral = 3
Agree = 4
Strongly Agree = 5
The above histogram is of perceived price fairness in which the response rate of respondents lies
in the option 2 - 3 (2 for disagree and 3 is for neutral). Similarly small numbers of respondents
were marked very low and very high options. The bars in the histogram from a distribution
7/26/2019 Final Research Work.docx
http://slidepdf.com/reader/full/final-research-workdocx 45/74
45
(pattern or curve) that is similar to the normal, bell shaped curve. Thus, frequency distribution of
the perceive price fairness is normal.
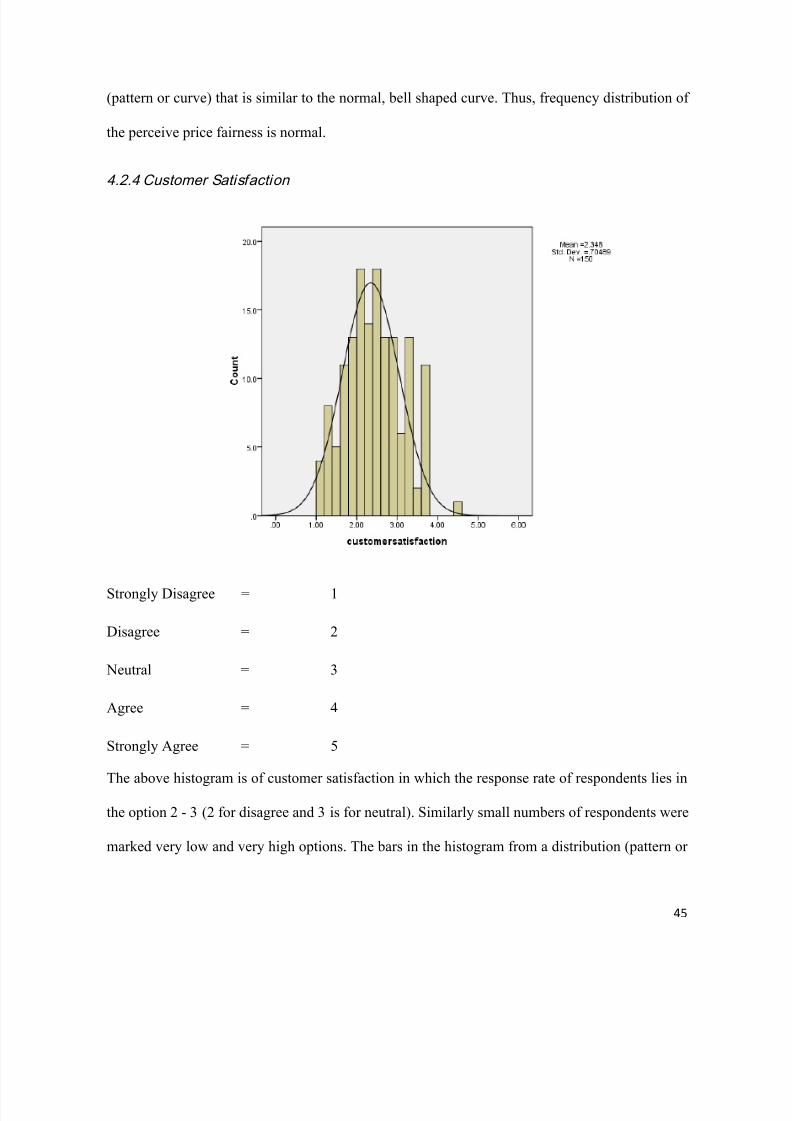
4.2.4 Customer Satisfaction
Strongly Disagree = 1
Disagree = 2
Neutral = 3
Agree = 4
Strongly Agree = 5
The above histogram is of customer satisfaction in which the response rate of respondents lies in
the option 2 - 3 (2 for disagree and 3 is for neutral). Similarly small numbers of respondents were
marked very low and very high options. The bars in the histogram from a distribution (pattern or
7/26/2019 Final Research Work.docx
http://slidepdf.com/reader/full/final-research-workdocx 46/74
46
curve) that is similar to the normal, bell shaped curve. Thus, frequency distribution of the
customer satisfaction is normal.
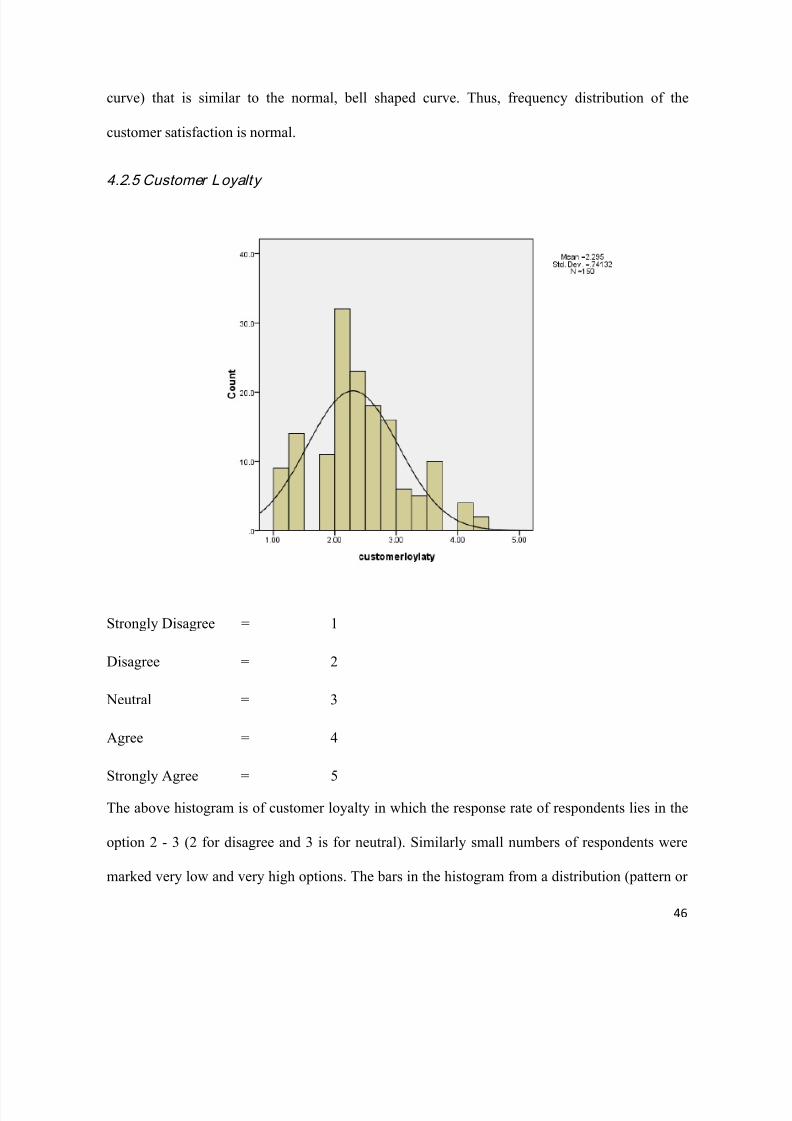
4.2.5 Customer Loyalty
Strongly Disagree = 1
Disagree = 2
Neutral = 3
Agree = 4
Strongly Agree = 5
The above histogram is of customer loyalty in which the response rate of respondents lies in the
option 2 - 3 (2 for disagree and 3 is for neutral). Similarly small numbers of respondents were
marked very low and very high options. The bars in the histogram from a distribution (pattern or
7/26/2019 Final Research Work.docx
http://slidepdf.com/reader/full/final-research-workdocx 47/74
47
curve) that is similar to the normal, bell shaped curve. Thus, frequency distribution of the
customer loyalty is normal.
4.3 Scatter Plots
4.3.1 Perceive Product Quali ty and Customer satisfaction
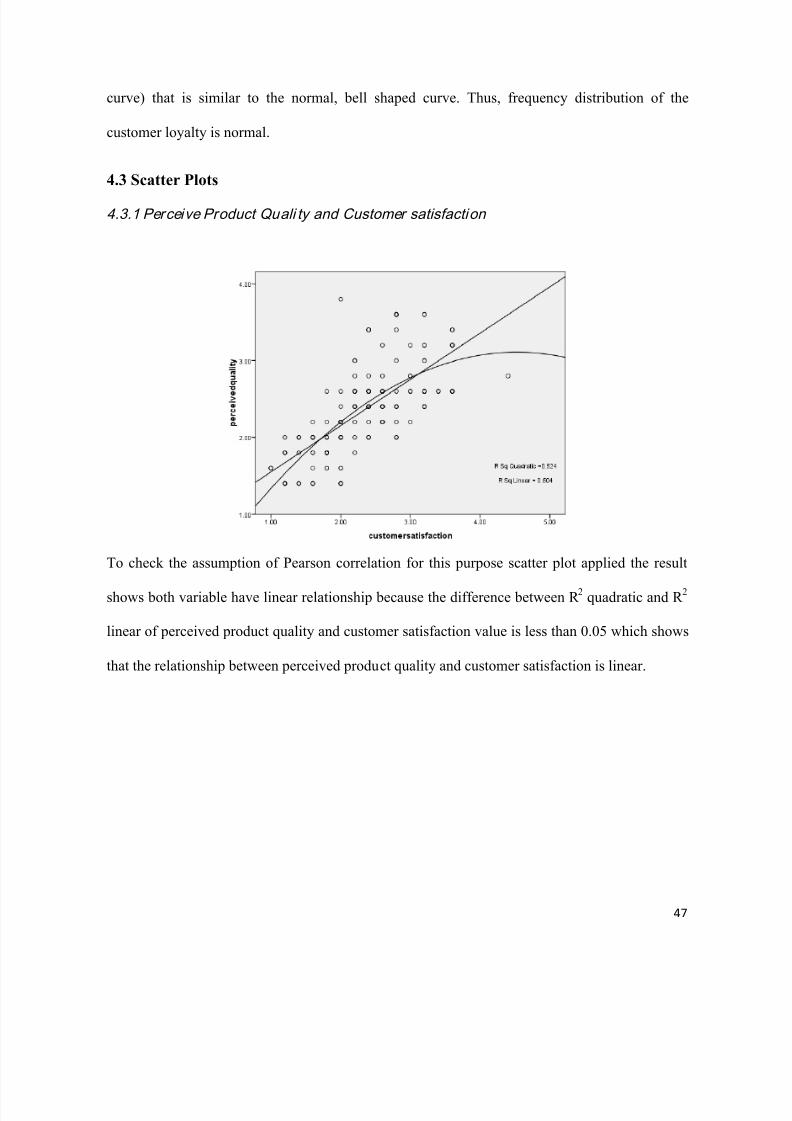
To check the assumption of Pearson correlation for this purpose scatter plot applied the result
shows both variable have linear relationship because the difference between R 2 quadratic and R
2
linear of perceived product quality and customer satisfaction value is less than 0.05 which shows
that the relationship between perceived product quality and customer satisfaction is linear.
7/26/2019 Final Research Work.docx
http://slidepdf.com/reader/full/final-research-workdocx 48/74
48
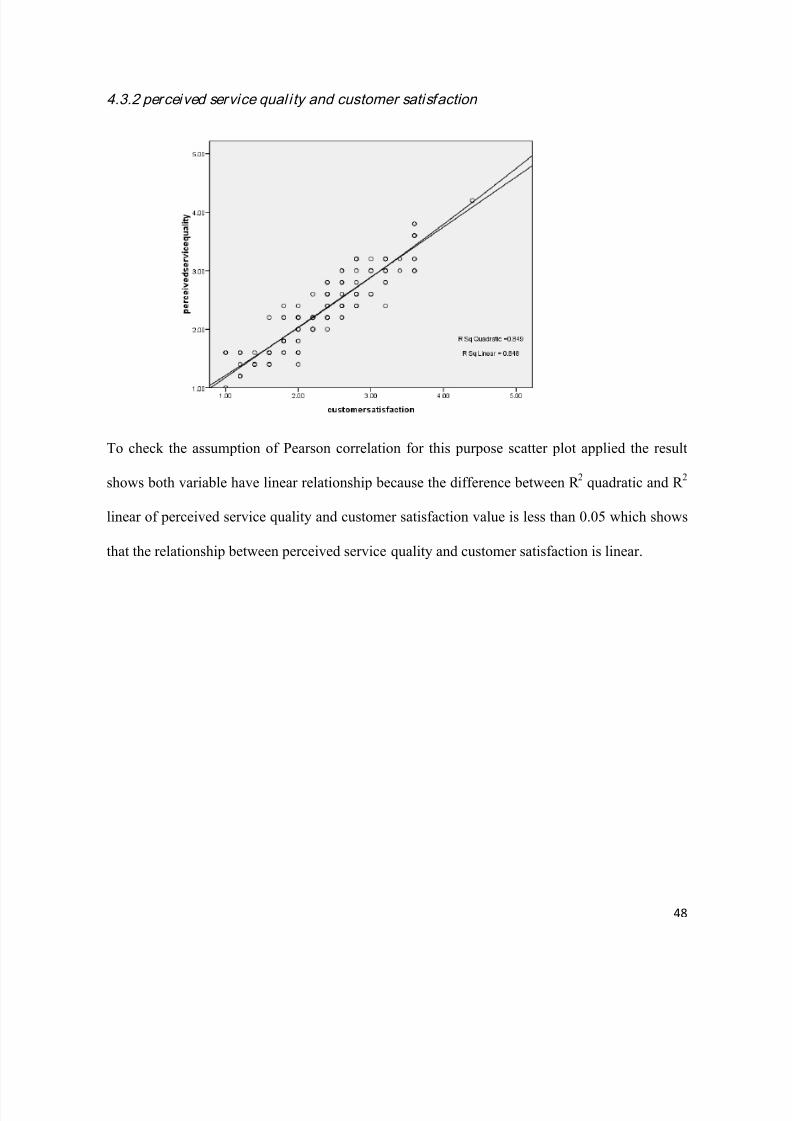
4.3.2 perceived service qual i ty and customer satisfaction
To check the assumption of Pearson correlation for this purpose scatter plot applied the result
shows both variable have linear relationship because the difference between R 2 quadratic and R
2
linear of perceived service quality and customer satisfaction value is less than 0.05 which shows
that the relationship between perceived service quality and customer satisfaction is linear.
7/26/2019 Final Research Work.docx
http://slidepdf.com/reader/full/final-research-workdocx 49/74
49
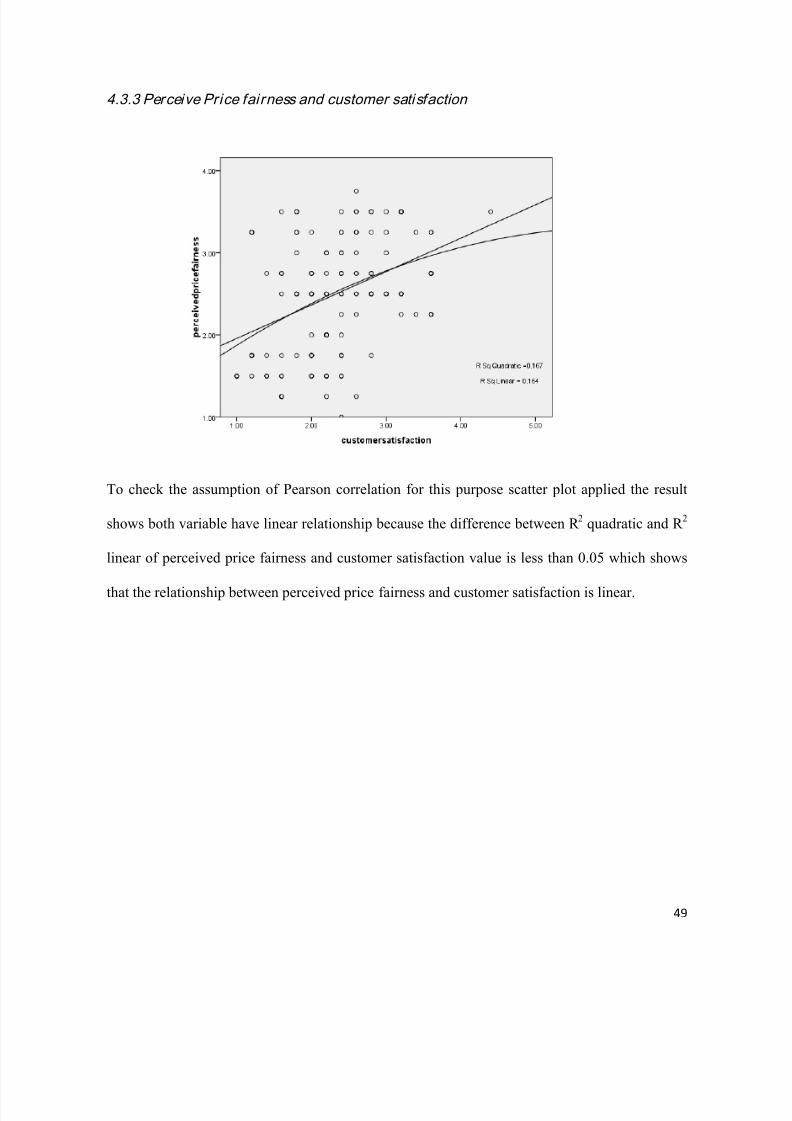
4.3.3 Perceive Price fairness and customer satisfaction
To check the assumption of Pearson correlation for this purpose scatter plot applied the result
shows both variable have linear relationship because the difference between R 2 quadratic and R
2
linear of perceived price fairness and customer satisfaction value is less than 0.05 which shows
that the relationship between perceived price fairness and customer satisfaction is linear.
7/26/2019 Final Research Work.docx
http://slidepdf.com/reader/full/final-research-workdocx 50/74
50
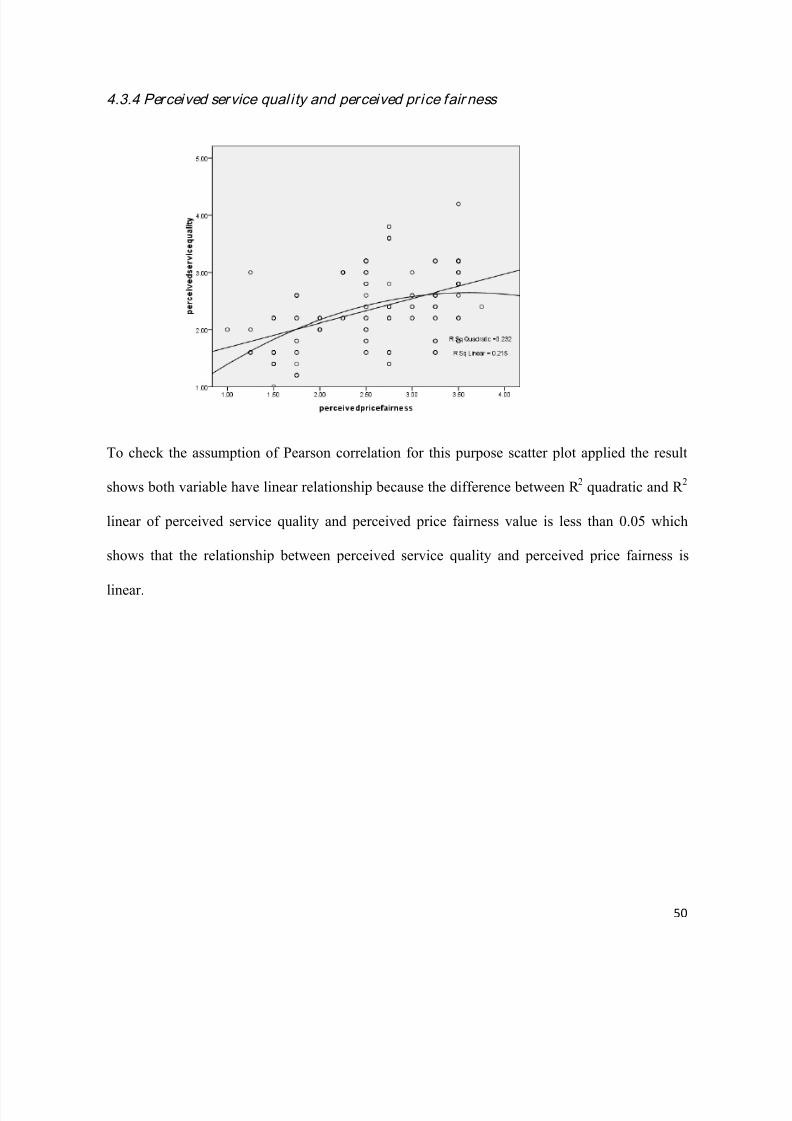
4.3.4 Perceived service qual i ty and perceived price fair ness
To check the assumption of Pearson correlation for this purpose scatter plot applied the result
shows both variable have linear relationship because the difference between R 2 quadratic and R
2
linear of perceived service quality and perceived price fairness value is less than 0.05 which
shows that the relationship between perceived service quality and perceived price fairness is
linear.
7/26/2019 Final Research Work.docx
http://slidepdf.com/reader/full/final-research-workdocx 51/74
51
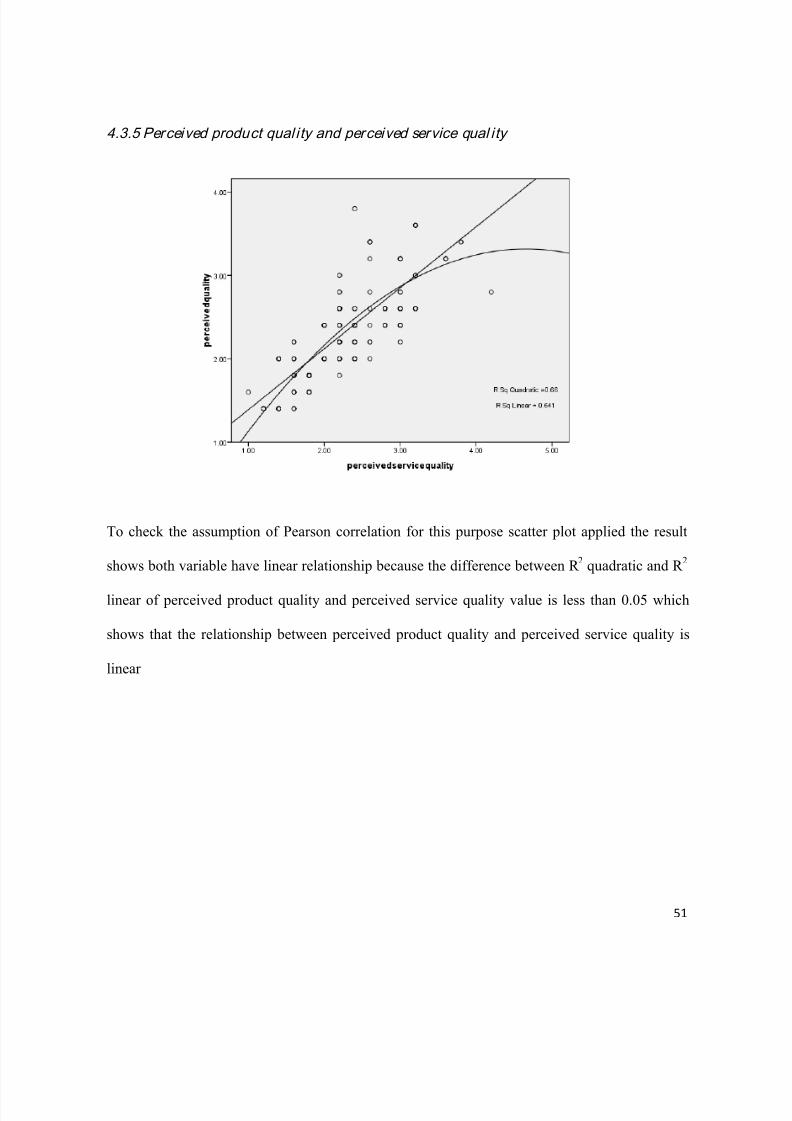
4.3.5 Perceived product qual ity and perceived service qual ity
To check the assumption of Pearson correlation for this purpose scatter plot applied the result
shows both variable have linear relationship because the difference between R 2
quadratic and R 2
linear of perceived product quality and perceived service quality value is less than 0.05 which
shows that the relationship between perceived product quality and perceived service quality is
linear
7/26/2019 Final Research Work.docx
http://slidepdf.com/reader/full/final-research-workdocx 52/74
52
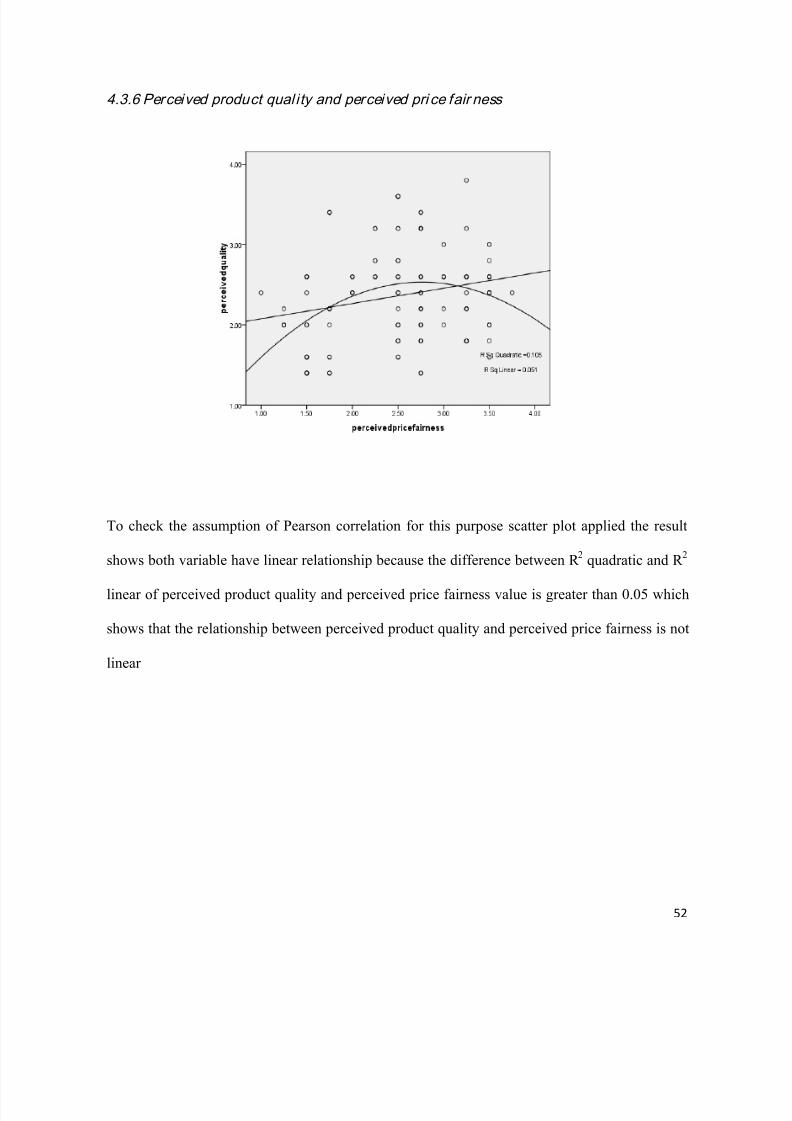
4.3.6 Perceived product qual ity and perceived pri ce fair ness
To check the assumption of Pearson correlation for this purpose scatter plot applied the result
shows both variable have linear relationship because the difference between R 2 quadratic and R
2
linear of perceived product quality and perceived price fairness value is greater than 0.05 which
shows that the relationship between perceived product quality and perceived price fairness is not
linear
7/26/2019 Final Research Work.docx
http://slidepdf.com/reader/full/final-research-workdocx 53/74
53
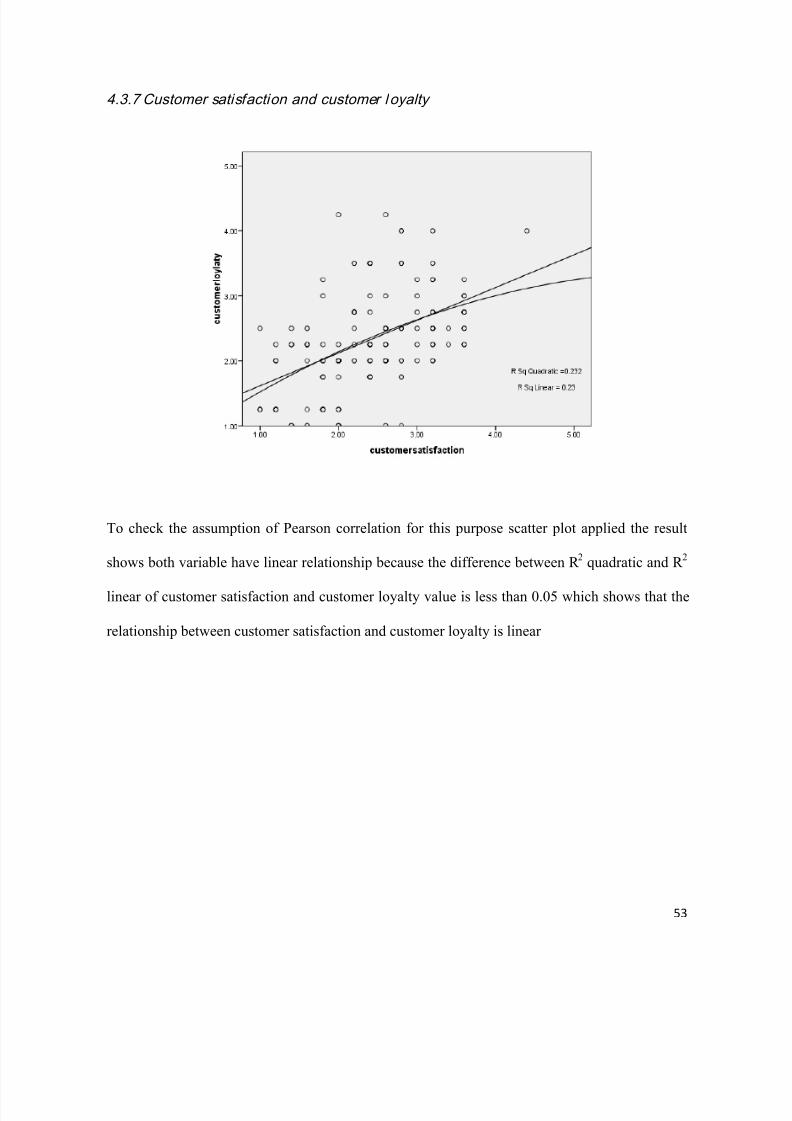
4.3.7 Customer satisfaction and customer loyalty
To check the assumption of Pearson correlation for this purpose scatter plot applied the result
shows both variable have linear relationship because the difference between R
2
quadratic and R
2
linear of customer satisfaction and customer loyalty value is less than 0.05 which shows that the
relationship between customer satisfaction and customer loyalty is linear
7/26/2019 Final Research Work.docx
http://slidepdf.com/reader/full/final-research-workdocx 54/74
54
4.4 Correlation
Correlation is used to check the mutual relationship among variables. For checking the
relationship we will make two hypotheses: null (H0) and alternative (H1). We interpret the
findings on the acceptance or rejection of the hypothesis. We used correlation matrix to check
the mutual relationship of different variables. The hypothesis which we developed are given
below
Hypothesis 1
H1: There is relationship between customer satisfaction and perceived quality
H0: There is no relationship between customer satisfaction and perceived quality
Hypothesis 2
H1: There is relationship customer satisfaction and perceived service quality
H0: There is no relationship between customer satisfaction and perceived service quality
Hypothesis 3
H1: There is relationship between customer satisfaction and perceived price fairness
H0: There is no relationship between customer satisfaction and perceived price fairness
Hypothesis 4
H1: There is relationship between perceived quality and perceived service quality
H0: There is no relationship between perceived quality and perceived service quality
Hypothesis 5
H1: There is relationship between perceived service quality and perceived price fairness.
H0: There is no relationship between perceived service quality and perceived price fairness.

7/26/2019 Final Research Work.docx
http://slidepdf.com/reader/full/final-research-workdocx 55/74
55
Hypothesis 6
H1: There is relationship between perceived quality and perceived price fairness
H0: There is no relationship between perceived quality and perceived price fairness
Hypothesis 7
H1: There is relationship between customer satisfaction and customer loyalty
H0: There is no relationship between customer satisfaction and customer loyalty
7/26/2019 Final Research Work.docx
http://slidepdf.com/reader/full/final-research-workdocx 56/74
56
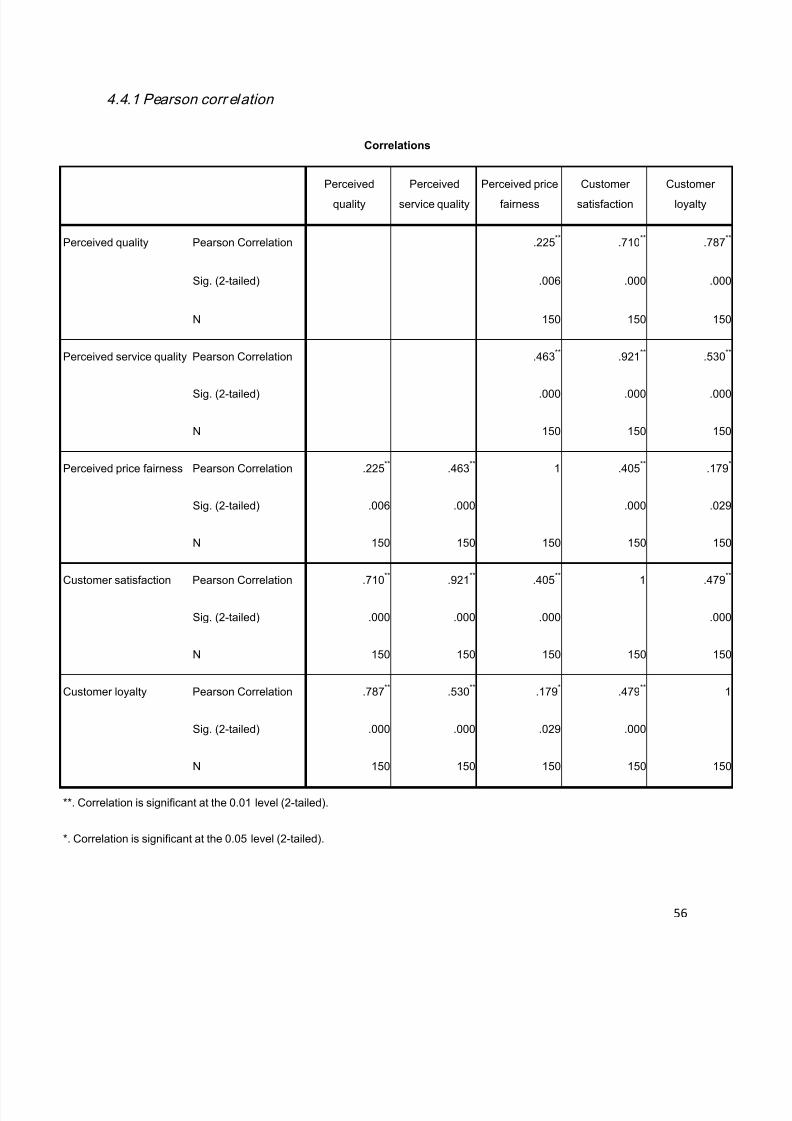
4.4.1 Pearson corr elation
Correlations
Perceivedquality
Perceivedservice quality
Perceived pricefairness
Customersatisfaction
Customerloyalty
Perceived quality Pearson Correlation .225** .710
** .787
*
Sig. (2-tailed) .006 .000 .000
N 150 150 150
Perceived service quality Pearson Correlation .463** .921
** .530
*
Sig. (2-tailed) .000 .000 .000
N 150 150 150
Perceived price fairness Pearson Correlation .225** .463
** 1 .405
** .179
Sig. (2-tailed) .006 .000 .000 .029
N 150 150 150 150 150
Customer satisfaction Pearson Correlation .710** .921
** .405
** 1 .479
*
Sig. (2-tailed) .000 .000 .000 .000
N 150 150 150 150 150
Customer loyalty Pearson Correlation .787** .530
** .179
* .479
** 1
Sig. (2-tailed) .000 .000 .029 .000
N 150 150 150 150 150
**. Correlation is significant at the 0.01 level (2-tailed).
*. Correlation is significant at the 0.05 level (2-tailed).
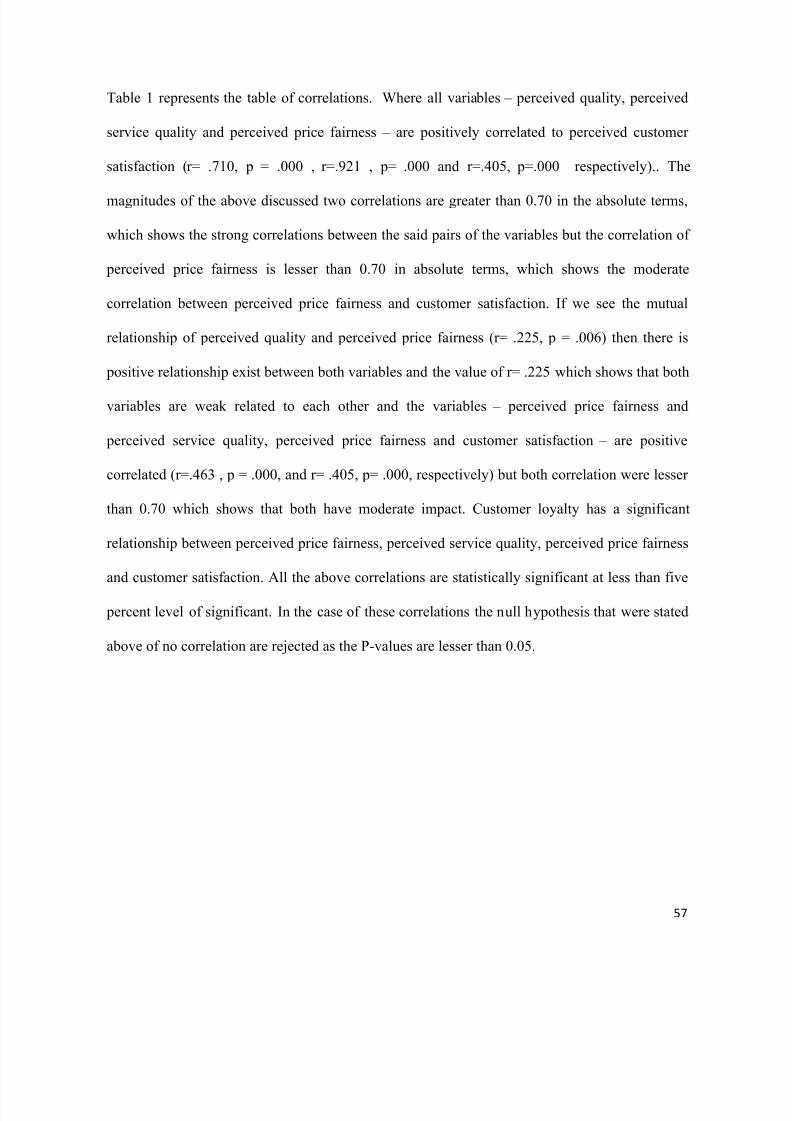
7/26/2019 Final Research Work.docx
http://slidepdf.com/reader/full/final-research-workdocx 57/74
57
Table 1 represents the table of correlations. Where all variables – perceived quality, perceived
service quality and perceived price fairness – are positively correlated to perceived customer
satisfaction (r= .710, p = .000 , r=.921 , p= .000 and r=.405, p=.000 respectively).. The
magnitudes of the above discussed two correlations are greater than 0.70 in the absolute terms,
which shows the strong correlations between the said pairs of the variables but the correlation of
perceived price fairness is lesser than 0.70 in absolute terms, which shows the moderate
correlation between perceived price fairness and customer satisfaction. If we see the mutual
relationship of perceived quality and perceived price fairness (r= .225, p = .006) then there is
positive relationship exist between both variables and the value of r= .225 which shows that both
variables are weak related to each other and the variables – perceived price fairness and
perceived service quality, perceived price fairness and customer satisfaction – are positive
correlated (r=.463 , p = .000, and r= .405, p= .000, respectively) but both correlation were lesser
than 0.70 which shows that both have moderate impact. Customer loyalty has a significant
relationship between perceived price fairness, perceived service quality, perceived price fairness
and customer satisfaction. All the above correlations are statistically significant at less than five
percent level of significant. In the case of these correlations the null hypothesis that were stated
above of no correlation are rejected as the P-values are lesser than 0.05.
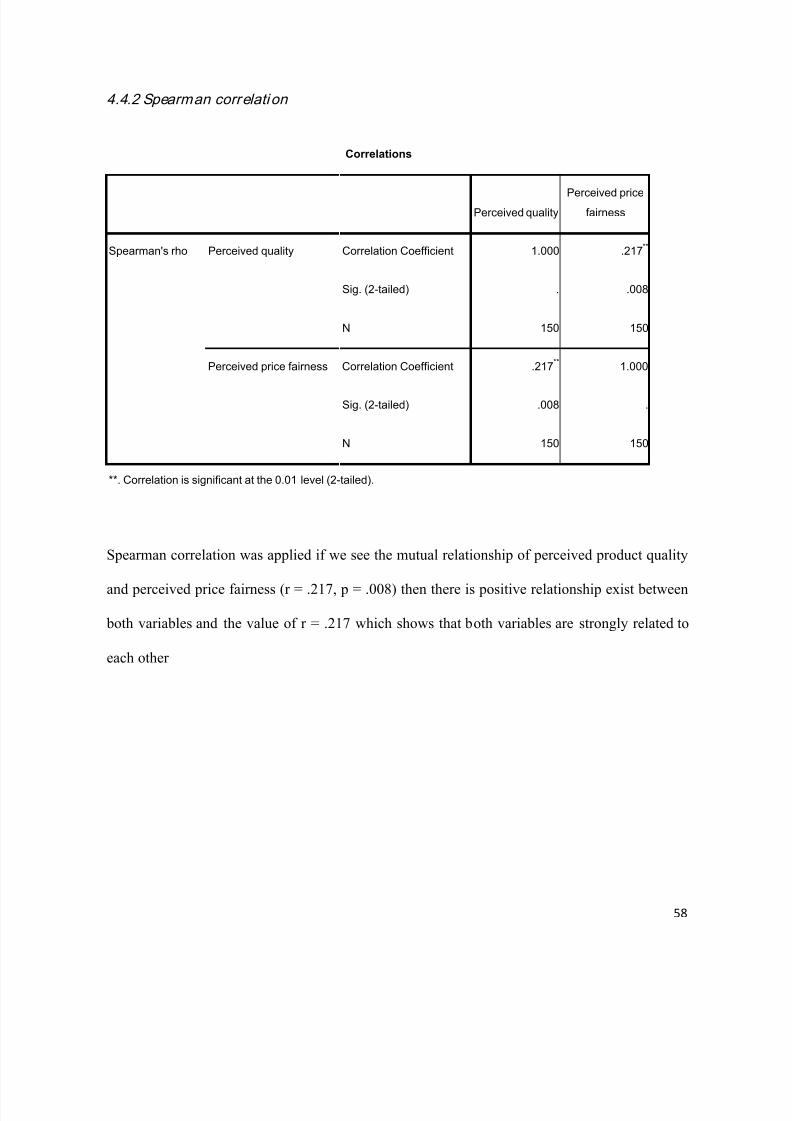
7/26/2019 Final Research Work.docx
http://slidepdf.com/reader/full/final-research-workdocx 58/74
58
4.4.2 Spearman correlation
Correlations
Perceived quality
Perceived price
fairness
Spearman's rho Perceived quality Correlation Coefficient 1.000 .217**
Sig. (2-tailed) . .008
N 150 150
Perceived price fairness Correlation Coefficient .217** 1.000
Sig. (2-tailed) .008 .
N 150 150
**. Correlation is significant at the 0.01 level (2-tailed).
Spearman correlation was applied if we see the mutual relationship of perceived product quality
and perceived price fairness (r = .217, p = .008) then there is positive relationship exist between
both variables and the value of r = .217 which shows that both variables are strongly related to
each other
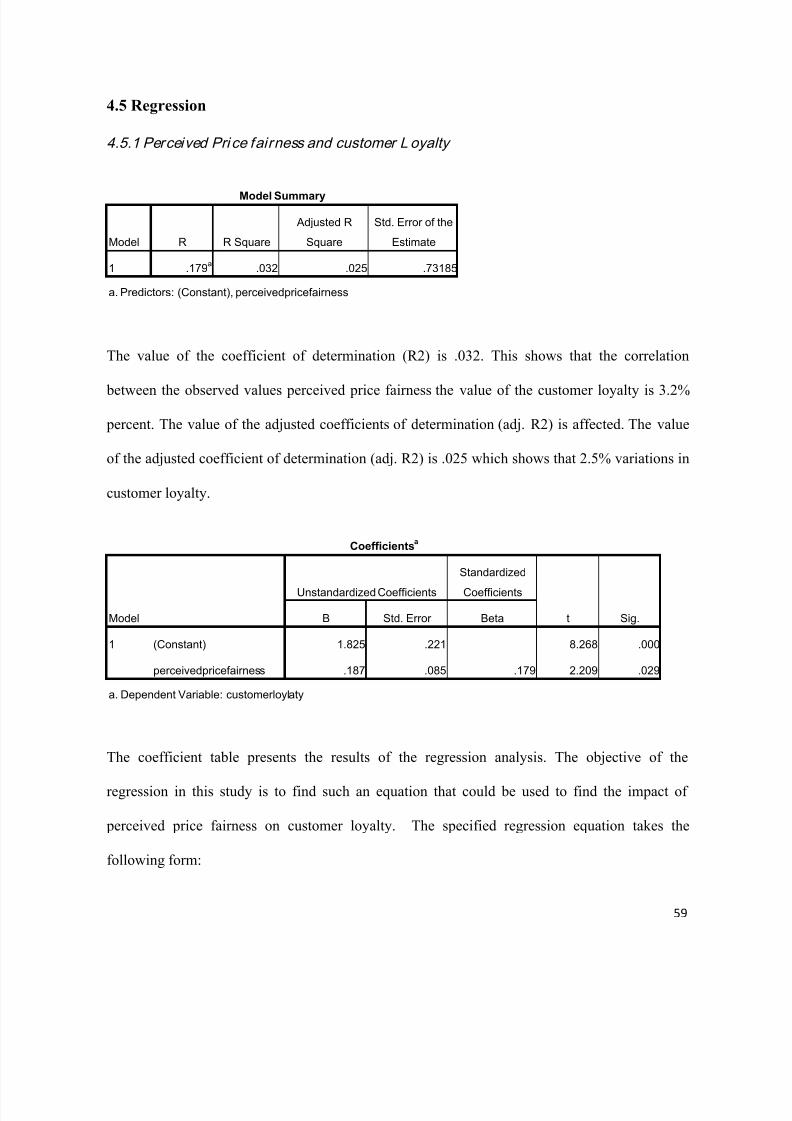
7/26/2019 Final Research Work.docx
http://slidepdf.com/reader/full/final-research-workdocx 59/74
59
4.5 Regression
4.5.1 Perceived Pri ce fairness and customer L oyalty
Model Summary
Model R R Square
Adjusted R
Square
Std. Error of the
Estimate
1 .179a .032 .025 .73185
a. Predictors: (Constant), perceivedpricefairness
The value of the coefficient of determination (R2) is .032. This shows that the correlation
between the observed values perceived price fairness the value of the customer loyalty is 3.2%
percent. The value of the adjusted coefficients of determination (adj. R2) is affected. The value
of the adjusted coefficient of determination (adj. R2) is .025 which shows that 2.5% variations in
customer loyalty.
Coefficientsa
Model
Unstandardized Coefficients
Standardized
Coefficients
t Sig.B Std. Error Beta
1 (Constant) 1.825 .221 8.268 .000
perceivedpricefairness .187 .085 .179 2.209 .029
a. Dependent Variable: customerloylaty
The coefficient table presents the results of the regression analysis. The objective of the
regression in this study is to find such an equation that could be used to find the impact of
perceived price fairness on customer loyalty. The specified regression equation takes the
following form:
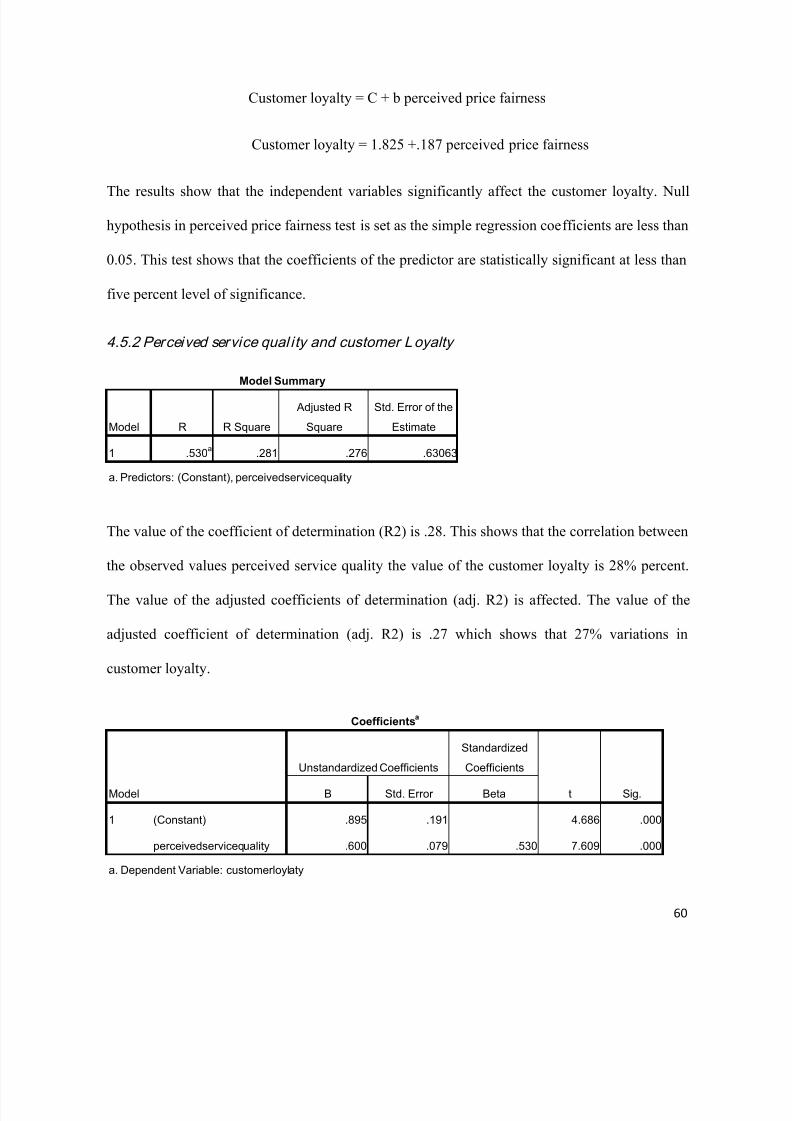
7/26/2019 Final Research Work.docx
http://slidepdf.com/reader/full/final-research-workdocx 60/74
60
Customer loyalty = C + b perceived price fairness
Customer loyalty = 1.825 +.187 perceived price fairness
The results show that the independent variables significantly affect the customer loyalty. Null
hypothesis in perceived price fairness test is set as the simple regression coefficients are less than
0.05. This test shows that the coefficients of the predictor are statistically significant at less than
five percent level of significance.
4.5.2 Perceived service qual ity and customer Loyalty
Model Summary
Model R R Square
Adjusted R
Square
Std. Error of the
Estimate
1 .530a .281 .276 .63063
a. Predictors: (Constant), perceivedservicequality
The value of the coefficient of determination (R2) is .28. This shows that the correlation between
the observed values perceived service quality the value of the customer loyalty is 28% percent.
The value of the adjusted coefficients of determination (adj. R2) is affected. The value of the
adjusted coefficient of determination (adj. R2) is .27 which shows that 27% variations in
customer loyalty.
Coefficientsa
Model
Unstandardized Coefficients
Standardized
Coefficients
t Sig.B Std. Error Beta
1 (Constant) .895 .191 4.686 .000
perceivedservicequality .600 .079 .530 7.609 .000
a. Dependent Variable: customerloylaty
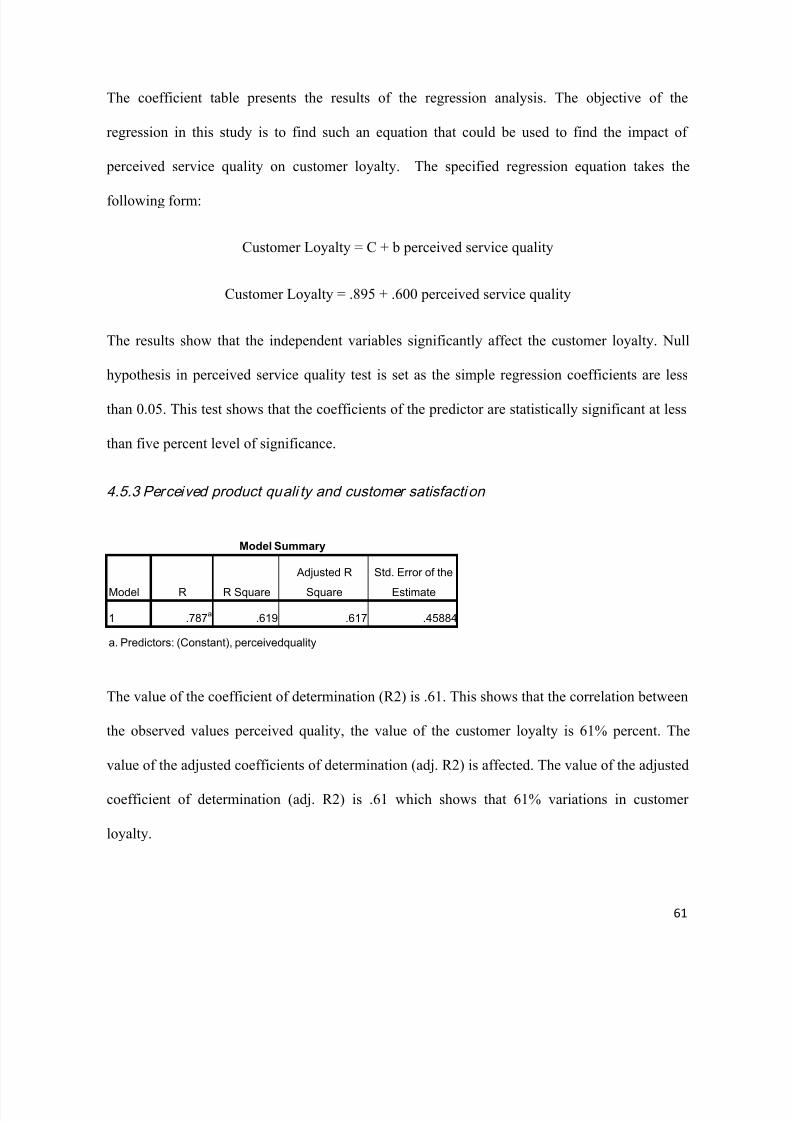
7/26/2019 Final Research Work.docx
http://slidepdf.com/reader/full/final-research-workdocx 61/74
61
The coefficient table presents the results of the regression analysis. The objective of the
regression in this study is to find such an equation that could be used to find the impact of
perceived service quality on customer loyalty. The specified regression equation takes the
following form:
Customer Loyalty = C + b perceived service quality
Customer Loyalty = .895 + .600 perceived service quality
The results show that the independent variables significantly affect the customer loyalty. Null
hypothesis in perceived service quality test is set as the simple regression coefficients are less
than 0.05. This test shows that the coefficients of the predictor are statistically significant at less
than five percent level of significance.
4.5.3 Perceived product quali ty and customer satisfaction
Model Summary
Model R R Square
Adjusted R
Square
Std. Error of the
Estimate
1 .787a .619 .617 .45884
a. Predictors: (Constant), perceivedquality
The value of the coefficient of determination (R2) is .61. This shows that the correlation between
the observed values perceived quality, the value of the customer loyalty is 61% percent. The
value of the adjusted coefficients of determination (adj. R2) is affected. The value of the adjusted
coefficient of determination (adj. R2) is .61 which shows that 61% variations in customer
loyalty.
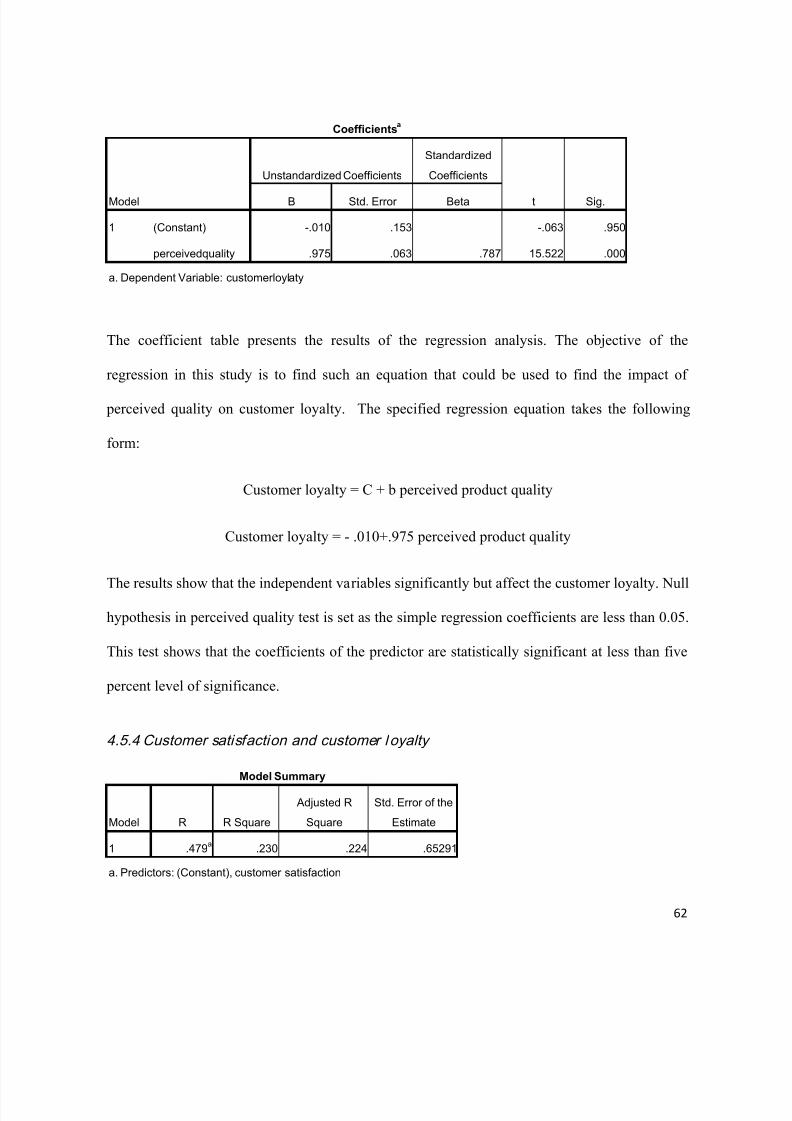
7/26/2019 Final Research Work.docx
http://slidepdf.com/reader/full/final-research-workdocx 62/74
62
Coefficientsa
Model
Unstandardized Coefficients
Standardized
Coefficients
t Sig.B Std. Error Beta
1 (Constant) -.010 .153 -.063 .950
perceivedquality .975 .063 .787 15.522 .000
a. Dependent Variable: customerloylaty
The coefficient table presents the results of the regression analysis. The objective of the
regression in this study is to find such an equation that could be used to find the impact of
perceived quality on customer loyalty. The specified regression equation takes the following
form:
Customer loyalty = C + b perceived product quality
Customer loyalty = - .010+.975 perceived product quality
The results show that the independent variables significantly but affect the customer loyalty. Null
hypothesis in perceived quality test is set as the simple regression coefficients are less than 0.05.
This test shows that the coefficients of the predictor are statistically significant at less than five
percent level of significance.
4.5.4 Customer satisfaction and customer loyalty
Model Summary
Model R R Square
Adjusted R
Square
Std. Error of the
Estimate
1 .479a .230 .224 .65291
a. Predictors: (Constant), customer satisfaction
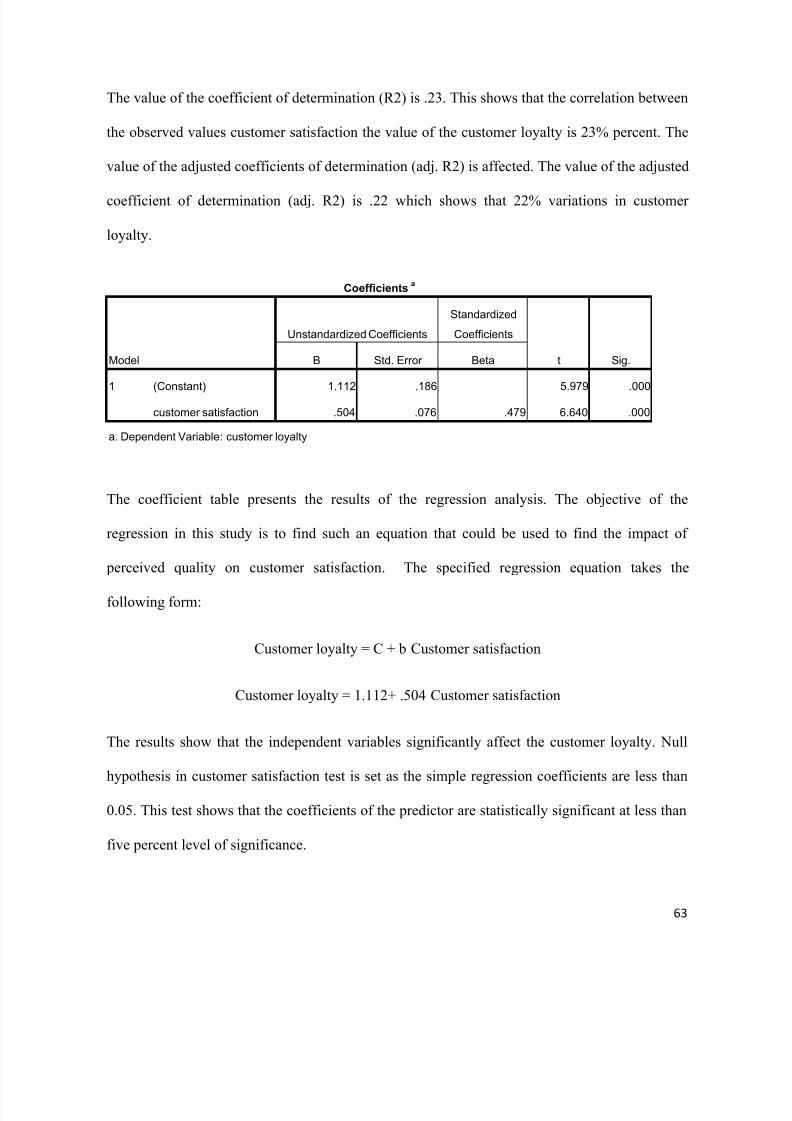
7/26/2019 Final Research Work.docx
http://slidepdf.com/reader/full/final-research-workdocx 63/74
63
The value of the coefficient of determination (R2) is .23. This shows that the correlation between
the observed values customer satisfaction the value of the customer loyalty is 23% percent. The
value of the adjusted coefficients of determination (adj. R2) is affected. The value of the adjusted
coefficient of determination (adj. R2) is .22 which shows that 22% variations in customer
loyalty.
Coefficientsa
Model
Unstandardized Coefficients
Standardized
Coefficients
t Sig.B Std. Error Beta
1 (Constant) 1.112 .186 5.979 .000
customer satisfaction .504 .076 .479 6.640 .000
a. Dependent Variable: customer loyalty
The coefficient table presents the results of the regression analysis. The objective of the
regression in this study is to find such an equation that could be used to find the impact of
perceived quality on customer satisfaction. The specified regression equation takes the
following form:
Customer loyalty = C + b Customer satisfaction
Customer loyalty = 1.112+ .504 Customer satisfaction
The results show that the independent variables significantly affect the customer loyalty. Null
hypothesis in customer satisfaction test is set as the simple regression coefficients are less than
0.05. This test shows that the coefficients of the predictor are statistically significant at less than
five percent level of significance.
7/26/2019 Final Research Work.docx
http://slidepdf.com/reader/full/final-research-workdocx 64/74
64
CHAPTER No. 5
DISACUSSION & CONCLUSION
5.1 Discussion
The present study is carried out to identify the factors affecting the customer loyalty in the
context of the fast food industry of Pakistan. For this purpose the present study uses quantitative
research method to check the proposed model in the context of Pakistan and the present study
uses the customers of fast food industry as the population of the study. The customers of
Macdonald’s, KFC, and Fri Chicks, Lahore are taken as the sample of the study. The sample size
of the study is 150 customers of Macdonald’s, KFC, and Fri Chicks, Lahore, Pakistan. The study
selects the perceived product quality, perceived service quality, perceived price fairness, and
customer satisfaction as the factors affecting customer loyalty by concerning the past literature
on these variables.
The literature review of the present study has reported the theoretical evidence from past studies
which confirmed the perceived product quality, perceived service quality, perceived price
fairness, and customer satisfaction as the factors of customer loyalty. The study also finds the
mediating effect of customer satisfaction in the linkage among perceived product quality,
perceived service quality, perceived price fairness, and customer loyalty.
The present study selects the customer loyalty as the dependent variable of the study which
depends on the perceived product quality, perceived service quality, perceived price fairness.
The present study takes customer satisfaction as the mediating variable of the study. Many
studies have been done to check this relationship but in Pakistan, specifically, in fast food
industry this association still has a gap which is filled by the present study. So the present study
7/26/2019 Final Research Work.docx
http://slidepdf.com/reader/full/final-research-workdocx 65/74
65
is an attempt to enhance the literature on customer loyalty and its different factors in the context
of fast food industry of Pakistan.
In the present study the descriptive statistics uses to find the maximum and minimum range of
data and also to find the mean and standard deviation of data through frequency tables as well as
histogram to check normal distribution curve. To check the acceptance or rejection of hypothesis
and check the relationship between variables the present study used inferential analysis. In
inferential analysis the present study tested the relationship among perceived product quality,
perceived service quality, perceived price fairness, customer satisfaction, and customer loyalty.
After observing the descriptive statistics, histograms, scatter plot matrix, and the correlations, the
regression has been used for further analysis.
The empirical evidences shows that perceived product quality, perceived service quality,
perceived price fairness has significant correlation with the customer satisfaction (sig. = .000, p =
.710; sig. = .000, p = .921; and sig. = .000, p = .405 respectively) and Perceived product quality,
perceived service quality, perceived price fairness has significant and positive correlation with
the customer loyalty (sig. = .000, p = .787; sig. = .000, p = .530; and sig. = .000, p = .179
respectively). The study also finds that customer satisfaction has strong correlation with the
customer loyalty (sig. = .000, p = .479). The results of regression analysis shows that perceived
product quality, perceived service quality, perceived price fairness has significant and positive
relationship with the customer loyalty (sig. = .000, b = .787; sig. = .000, b = .530; and sig. =
.029, b = .179 respectively). The results also show that customer satisfaction has positive
relationship with the customer loyalty (sig. = .000, b = .504).
Thus this study is an attempt to find the different factors of customer loyalty mediated by
customer satisfaction in the fast food industry of Pakistan. Since Pakistan is a developing country
7/26/2019 Final Research Work.docx
http://slidepdf.com/reader/full/final-research-workdocx 66/74
66
and the topic of research has little evidence from developing countries so this study helps to
enhances the evidences from the developing countries context.
The present study helps decision makers related to fast food industry in Pakistan to influence the
loyalty of the customer so that they choose their products again and again. The other benefit of
the present study is that it also determines the impact of customer satisfaction on the loyalty of
the customers.
Despite of the many benefits of the study, there are several limitations of the study. First, the
study is only limited to the fast food industry of Pakistan because it collects data only from the
customers of fast food industry, thus the results may not be valid to the other organizations.
Secondly, this study is limited because it only checks the impact of only three variables on
customer loyalty as there could be some other factors which can be taken such as the Trust, Hotel
Environment, and Customer Experience etc. This study is also limited to the customer loyalty
which can be further enhanced to check the profitability of the industry. Lastly, the results of the
study could not be valid to service sector as the present study was carried out in the context of
manufacturing sector of the Pakistan.
5.2 Conclusion
The study concludes that perceived product quality, perceived service quality, perceived price fairness,
and customer satisfaction has strong effect on customer loyalty. Therefore the managers of fast
food industry should emphasis on product quality, service quality, and price to make the customer
satisfied due to which they will b able to gain the attention of the customer again and again. It
means if customers are satisfied then they will visit the restaurant again and again. Thus it is
clear form the study that managers of the fast food industry has to focus on their product quality
7/26/2019 Final Research Work.docx
http://slidepdf.com/reader/full/final-research-workdocx 67/74
67
and they have to maximize their concern on the improvement on the service quality if they want
satisfied and loyal customers. The managers should also consider the price as the important
factor which can influence the satisfaction and loyalty of customers. Most importantly the
managers have to pay most of their intension on the quality of their products which strongly
affect the loyalty of the customers according to the evidence of the present study. So quality of
the products should be the first and foremost concern of the managers of fast food industry if
they want to attain and retain their customers.
7/26/2019 Final Research Work.docx
http://slidepdf.com/reader/full/final-research-workdocx 68/74
68
REFERENCES
Abdullah; et, al., (2009), influence of service and product quality towards customer
satisfaction: a case study of the staff cafeteria in the hotel industry, world academy of
science, engineering, and technology, 53, 185-190.
Abedniya, A; et, al., (2011), investigating the relationship between customer perceived
service quality and satisfaction: Islamic bank in Malaysia, European journal of social
sciences, 21(4), 603-624
Ahmet; et, al., (2011), the effects of factors influencing the perception of price fairness
towards customer response behaviors, journal of global management, 2(1), 22-38.
Ailwadi, K.L; et, al., (2011), the impact of retailers corporate social responsibility on price
fairness perceptions and loyalty.
Al-Rousan; Ramzi, M; and Mohamed, B (2010), customer loyalty and impacts of service
quality: the case of five star hotels in Jordan, International journal of human and social
sciences, 5(13), 886-892.
Andalleb, S.S; and Conway, C (2006), customer satisfaction in the restaurant industry: an
examination of the transaction specific model, journal of service marketing, 20(1), 3-11.
Bei, L.T; and Chiao, Y.C (N.D.), an integrated model for the effects of perceived product
quality, perceived service quality, and perceived price fairness on customer satisfaction and
loyalty, journal of consumer satisfaction, dissatisfaction and complaining behavior, 125-140.
Bloemer, J; Ruyter, K.D; and peters, P (1998), investigating drivers of bank loyalty: the
complex relationship between image, service quality, and satisfaction, international journal
of banks marketing, 16(7), 276-286.
7/26/2019 Final Research Work.docx
http://slidepdf.com/reader/full/final-research-workdocx 69/74
69
Chaipakdee, S; and Wetprasit, P (N.D.), the relationship among service quality, customer
satisfaction, perceive value, and behavioral intensions in sea-kayaking operations: a case
study of Phuket and Phang-Nga province, Thailand.
Cheng, C.C, et, al., (2011), a study of customer satisfaction, customer loyalty, and quality
attr ibutes in Taiwan’s medical service industry, African journal of business management,
5(1), 187-195.
Chumpitaz, R; and Swaen, V (2003), service quality and brand loyalty relationship:
investigating the mediating effect of customer satisfaction, IESEG working paper, 2003-mar-
3.
Clemes, M.D; et, al., (2008), an empirical analysis of customer satisfaction in international
air travel, innovative marketing, 4(2), 49-62.
Dai, B (2010), the impact of perceived price fairness of dynamic pricing on consumer
satisfaction and behavioral intensions: the moderating role of customer loyalty, Auburn
University.
Hallowell, R (1995), the relationship of customer satisfaction, customer loyalty and
profitability: an empirical study, International journal of service industry management, 7(4),
27-42.
Hanif, M; Hafeez, S; and Riaz, A (2010), factors affecting customer satisfaction, industrial
research journal of finance and economics, 60, 44-52.
Herrmann, A; et, al., (2007), the influence of price fairness on customer satisfaction: an
empirical test in the context of automobile purchases, journal of product & brand
management, 16(1), 49-58.
7/26/2019 Final Research Work.docx
http://slidepdf.com/reader/full/final-research-workdocx 70/74
70
Ismail, I; et, al., (2006), service quality, client satisfaction and loyalty towards audit firms,
managerial auditing journal, 2(7), 738-756.
Jahangir, N; et, al., (2009), the relationship between brand affect, brand quality, and
customers brand extension attitude: exploring the mediating role of customer loyalty, the
Cambodian management journal, 1(1), 20-34.
Janshahi; et, al., (2011), study the effects of customer service and product quality on
customer satisfaction and loyalty, International journal of humanities and social sciences,
1(7), 253-260.
Kiran, K; and Diljit, S (2011), antecedents of customer loyalty: does service quality suffice?,
Malaysian journal of library and information sciences, 16(3), 95-113.
Lee, H; Lee, Y; and Yoo, D (2000), the determinants of perceived service quality and its
relationship with the satisfaction, journal of services marketing, 14(3), 217-231.
Mohsan, F; et, al., (2011), impact of customer satisfaction on customer loyalty and intensions
to switch: evidence from banking sector of Pakistan, International journal of business and
social sciences, 2(16), 263-270.
Rauyruen, P; Miller, K.E; and Barrett, N.J (N.D.), relationship quality as the predictor of b3b
customer loyalty.
Rojas-Mendez; et, al., (2009), determinants of student loyalty in higher education: a tested
relationship approach in Latin America, Latin American business review, 10, 21-39.
Sumaedi, S; Bakhti, I.G.M.Y; and Metasari, N (2011), the effects of student’s perceived
service quality and perceived price on student satisfaction, management science and
engineering, 5(1), 88-97.
7/26/2019 Final Research Work.docx
http://slidepdf.com/reader/full/final-research-workdocx 71/74
71
Tsiostu, R (2006), the role of perceived product quality and overall satisfaction in purchase
intension, international journal of consumer studies, 30(2), 207-217.
Tsiotsou, R (2005), Perceived quality levels and their relation to involvement, satisfaction,
and purchase intension, Market bulletin, 16, 1-10.
Wei, J (2010), an empirical analysis of New Zealand bank customer’s satisfaction, Lincoln
University, New Zealand.
Yang, I.M.H (N.D.), relationship among service quality, image, customer satisfaction and
loyalty in a Hong Kong franchised Bus Company.
Yang, Z; and Peterson, R.T (2004), customer perceived value, satisfaction, and loyalty: the
role of switching cost, psychology and marketing, 21(10), 799-822.
Yee, K.S (2008), customer perceived quality, relationship quality and business loyalty: an
example of b2b organizations, faculty of business & accountancy, University of Malaysia.
7/26/2019 Final Research Work.docx
http://slidepdf.com/reader/full/final-research-workdocx 72/74
72
APPENDIX
QUESTIONNAIRE
“An integrated model for the effect of perceived product, perceived service quality, and
perceived pr ice fair ness on consumer satisfaction and customer loyalty: Evidence from
Fast Food industry of Pakistan”
Dear Sir / Madam;
I am the student of superior university and I am going to conduct a survey for the purpose of
evaluation the data from your side on the topic of ““An integrated model for the effect of
perceived product, perceived service quality, and perceived price fairness on consumer
satisfaction and customer loyalty: Evidence from Fast Food industry of Pakistan””. So for this
purpose I need your help. Please give me actual response. I promise you that the information will
be only use for the purpose of research and also we will be kept confidential and it will be only
use for the purpose of study.
Name: __________________________
Age: ___________________________
Gender: Male Female
Which fast food restaurant you visit?
Macdonald KFC Fri Chicks
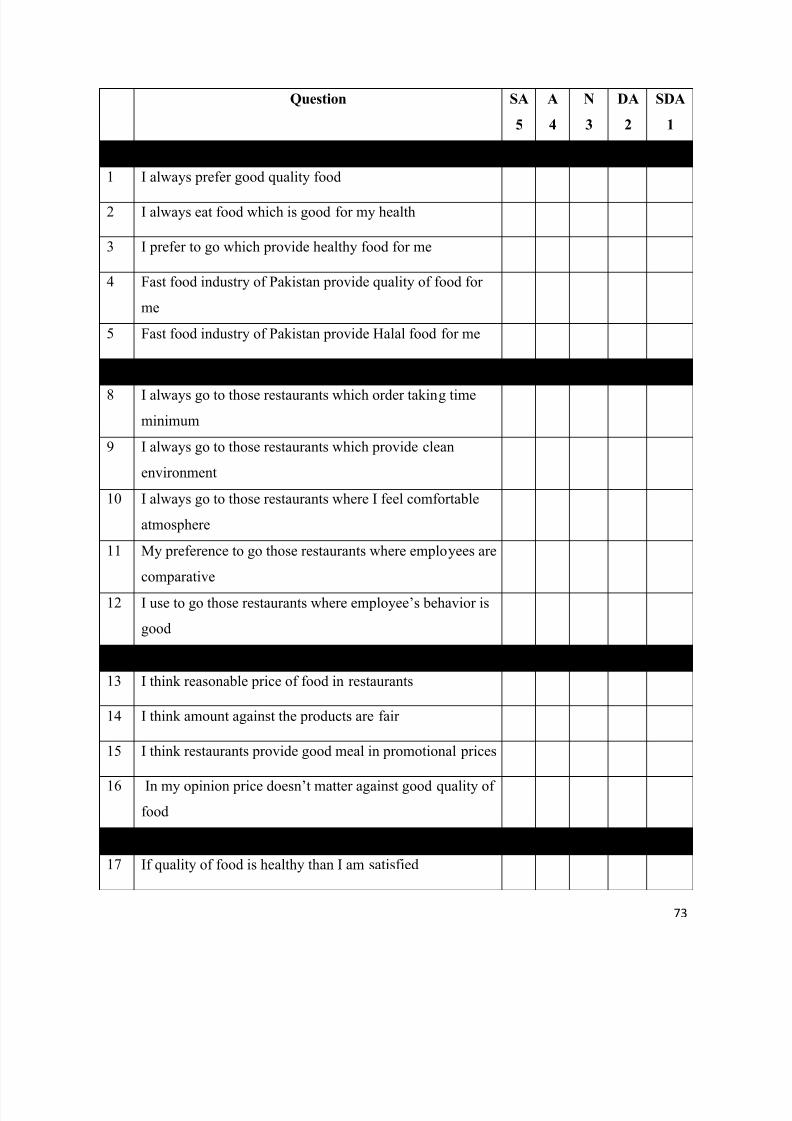
7/26/2019 Final Research Work.docx
http://slidepdf.com/reader/full/final-research-workdocx 73/74
73
Question SA
5
A
4
N
3
DA
2
SDA
1
Perceived quality
1 I always prefer good quality food
2 I always eat food which is good for my health
3 I prefer to go which provide healthy food for me
4 Fast food industry of Pakistan provide quality of food for
me
5 Fast food industry of Pakistan provide Halal food for me
Perceived service quality
8 I always go to those restaurants which order taking time
minimum
9 I always go to those restaurants which provide clean
environment
10 I always go to those restaurants where I feel comfortable
atmosphere
11 My preference to go those restaurants where employees are
comparative
12 I use to go those restaurants where employee’s behavior is
good
Perceived price fairness
13 I think reasonable price of food in restaurants
14 I think amount against the products are fair
15 I think restaurants provide good meal in promotional prices
16 In my opinion price doesn’t matter against good quality of
food
Customer satisfaction
17 If quality of food is healthy than I am satisfied
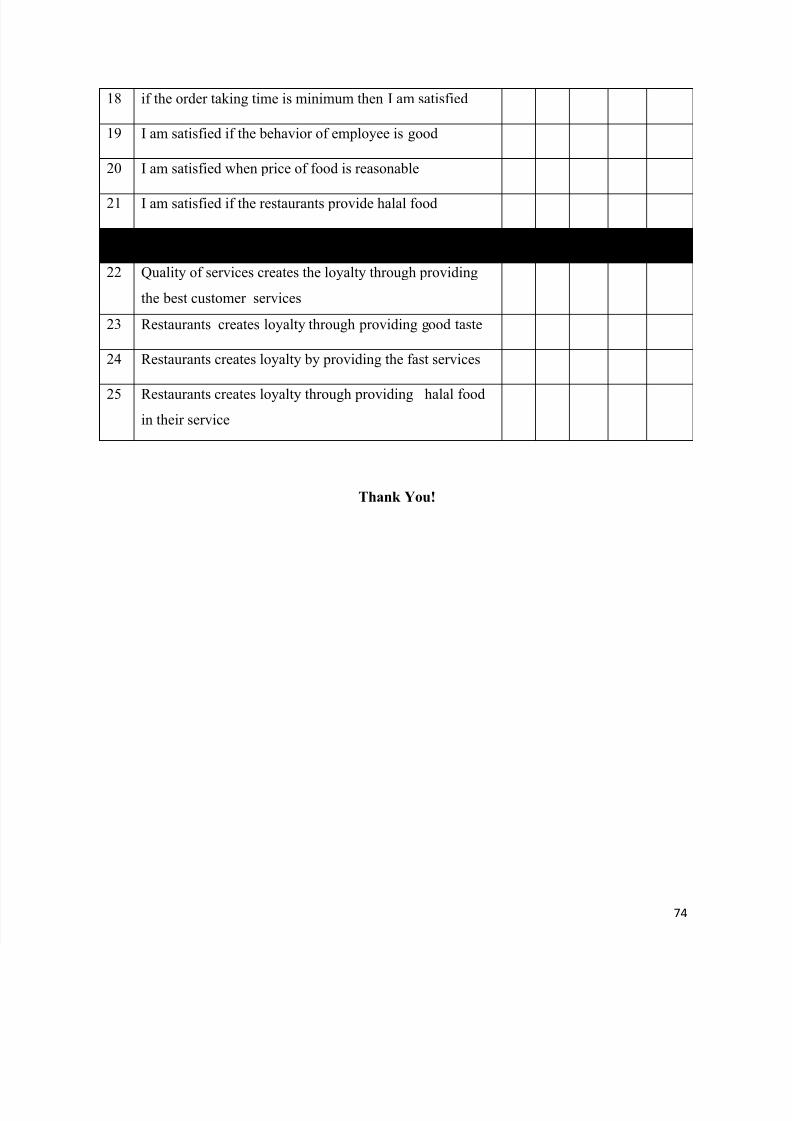
7/26/2019 Final Research Work.docx
http://slidepdf.com/reader/full/final-research-workdocx 74/74
18 if the order taking time is minimum then I am satisfied
19 I am satisfied if the behavior of employee is good
20 I am satisfied when price of food is reasonable
21 I am satisfied if the restaurants provide halal food
Customer Loyalty
22 Quality of services creates the loyalty through providing
the best customer services
23 Restaurants creates loyalty through providing good taste
24 Restaurants creates loyalty by providing the fast services
25 Restaurants creates loyalty through providing halal food
in their service
Thank You!