Embed Size (px)
Citation preview

BRIDGE DECK CORNER CRACKING
ON SKEWED STRUCTURES
Final Report to
Michigan Department of Transportation
Gongkang Fu, Jihang Feng, Jason Dimaria, and Yizhou Zhuang
Department of Civil and Environmental Engineering
Wayne State University
RC-1490
September 2007

2
Technical Report Documentation Page
1. Report No.
Research Report RC-1490
2. Government Accession No. 3. MDOT Project Manager
Roger Till
4. Title and Subtitle Bridge Deck Corner Cracking on Skewed Structures
5. Report Date June 13, 2007
7. Author(s) Gongkang Fu, Jihang Feng, Jason Dimaria, and Yizhou Zhuang
6. Performing Organization Code
9. Performing Organization Name and Address Wayne State University, Center for Advanced Bridge Engineering Department of Civil and Environmental Engineering 5050 Anthony Wayne Dr., Detroit, MI 48202
8. Performing Org Report No. CE-2007-05
10. Work Unit No. (TRAIS)
11. Contract Number: 2002-0546
12. Sponsoring Agency Name and Address Michigan Department of Transportation Construction and Technology Division P.O. Box 30049 Lansing, MI 48909
11(a). Authorization Number: 4
13. Type of Report & Period Covered Final report, July 2004 - August 2007
15. Supplementary Notes
14. Sponsoring Agency Code
16. Abstract This study had a focus on corner cracking in concrete decks of skew highway bridges. A survey of state transportation agencies in the U.S. was conducted on this subject. It found that deck corner cracking in skew bridges is commonly observed. Deck inspection for bridges in Michigan was also performed in this study. Cracking intensity in these decks was viewed as an effect of several possible causal factors, which was collected from 40 bridge decks, including 20 straight and 20 skewed structures. Analysis of the inspection results indicates no clearly agreeable causal relations. Two skew decks were instrumented using temperature and strain sensors for the concrete and the ambient environment. Concrete deck’s temperature and strain response was collected to thermal-, shrinkage,- and truck-wheel-loads. Test results and thereby calibrated finite element analysis results show that the main cause of skew deck corner cracking is cement concrete’s thermal and shrinkage load. Based on current Michigan practice of skew deck design and construction, additional reinforcement in the corner areas is therefore recommended to reduce concrete stresses. Further research is also recommended to develop solutions using optimal combinations of ingredients in concrete and to minimize the constraint between the deck and the supporting superstructure.
17. Key Words Skew bridge, concrete deck, corner cracking, causes, cures
18. Distribution Statement No restrictions. This document is available to the public through the Michigan Department of Transportation.
19. Security Classification (report) Unclassified
20. Security Classification (Page) Unclassified
21. No of Pages 22. Price

3
Table of Contents
I. Introduction ---- 5
I-1. Background ---- 5 I-2. Research Objectives ---- 7 I-3. Report Organization ---- 8
II. State of the Art and Practice ---- 11
II-1. Literature Review ---- 11 II-2. Survey of State Transportation Agencies ---- 18 II-3. Summary ---- 21
III. Performance of Skew Decks in Michigan ---- 29
III-1. Inspection Program ---- 29 III-2. Analysis of Inspection Results ---- 41
IV. Behavior of Typical Skew Decks Using Physical Measurement ---- 48
IV-1. Experiment Program ---- 48 IV-2. Instrumentation ---- 51 IV-3. Measurement Results ---- 53 IV-4. Discussions ---- 74
V. Behavior of Skew Decks Using Finite Element Analysis ---- 75
V-1. FEA Modeling and Validation ---- 75 V-2. Analysis of Typical Skew Decks in Michigan ---133 V-3. Discussions ---140
VI. Discussions and Recommendations ----142
VI-1. Recommended Cures for Skew Deck Corner Cracking ----142 VI-2. Recommended Future Research Work ----144 VI-3. Implementation Considerations ----144 VI-4. Cost- Benefit Analysis ----145
References ----146

4
Acknowledgements
The research work reported here was financially supported by the Michigan Department of
Transportation in cooperation with the U.S. Federal Highway Administration. This support is
gratefully appreciated. The direction of Mr. Roger Till and the Research Advisory Panel for the
project has been very important to the successful completion of this study. Many student
research assistants at Wayne State University have contributed to the this work, including Sarika
Butala, Lixiang Yang, Dinesh Devaraj, Tapan Bhatt, Kiran Chiniva, Jian Ye, and Shubhada
Gadkar. They assisted in various tasks reported therein.

5
CHAPTER I INTRODUCTION
I-1. Background
Reinforced concrete (RC) is a very common material for the highway bridge deck. It has a
number of advantages: 1) Easy to construct with respect to deck dimensions.
2) Relatively lower requirement for maintenance and thus longer service life without
maintenance, compared with other common construction materials, such as timber and steel. 3)
Acceptable cost-effectiveness. On the other hand, along with increasing experience with
concrete, there has been a growing concern with concrete for bridge decks. It is its longevity
adversely affected by cracking. Figure I-1 shows an example of such cracking in a concrete
bridge deck in Michigan, where cracks were marked using orange paint for a quantitative survey.
Historically, concrete structures have been primarily designed on the basis of strength only.
The widespread decay of concrete structures in the infrastructure system, however, has indicated
a need for design procedures that consider long-term durability.
Concrete is a composite material in which aggregate particles are bonded together using Portland
cement and water. The water in the concrete serves two purposes. When concrete is still in the
fluid state, it allows the composition to be workable. Water also participates in the chemical
reaction (hydration) responsible for forming the “glue” that bonds the aggregates together.
Typically, concrete is volumetrically stable if it remains in an environment of constant moisture
and temperature. However, changes in the moisture and temperature of the surrounding

6
environment cause moisture movement within concrete, which results in a volumetric change.
The amount of this volumetric change for a concrete mix is dependent on a variety of factors
including the mix proportion, environmental condition, concrete age, structure size, etc. When
this volumetric change is constrained by other necessary components (such as the supporting
beams) in contact with concrete, the concrete can develop stresses significant enough to cause
cracking.
In addition, thermal strains constrained by the supporting beams may also cause cracking due to
a similar mechanism. The thermal strains may be caused by concrete hydration, and
temperature variations due to climate change and/or daily cycling. Furthermore, there has also
been concern with truck wheel loading that may cause or worsen cracking in a concrete deck.
In bridges with skew, such cracking has been seen more severe in the corner areas. Figure I-2
shows such cracks of a concrete deck in a bridge with a skew of about 29 degrees. These cracks
typically start with a right angle to the deck edge that is along the direction of the supports (an
abutment and/or a pier). This research project has a focus on this phenomenon, in order to
increase the service life of the bridge deck and the entire structure the deck is supposed to
protect.

7
I-2. Research Objectives
The research project’s objective is to identify possible causes for corner cracking of skew
concrete bridge decks, and to recommend viable options that may eliminate or reduce such
cracking.
This research project was proposed to include the following tasks to reach the research objective.
Task 1: Review of state of the art and the practice including implementation efforts in addressing
the subject issue. Task 2: Gathering field performance data from skewed and non-skewed RC
decks to understand the severity of corner cracking in skew concrete decks in service in
Michigan. Task 3: Statistical analysis of the performance data obtained in Task 2 to attempt to
understand possible relations of deck cracking severity with a number of factors such as skew
angle magnitude, slab thickness, span type, etc. Task 4: Testing typical skewed concrete decks
to perform physical measurement for concrete strain response to thermal, shrinkage, and truck
wheel loads. These data were thought to be important to understand the behavior of skew
concrete decks and to provide a reference for calibrating the finite element analysis (FEA) model
to be used in the next task. Task 5: FEA of selected straight and skewed concrete decks using
the calibrated modeling method to analyze 12 cases of concrete decks with typical Michigan
skew angles, beam spacings, and beam types. The analysis was to provide understanding of the
effect of these parameters. Task 6: Determining possible causes of corner cracking in skewed
RC decks using the data and information resulting from Tasks 4 and 5. This result will lead to
the development of possible solutions to eliminate or reduce such cracking. Task 7: Prepare

8
quarterly reports and a final report. These reports were to record the progress to date in the
project, present the research process, and document the final results.
I-3. Report Organization
This report includes five more chapters. These chapters are organized following the concept of
project design presented above. Besides this chapter of introduction, Chapter II briefly presents
state of the art and practice related to corner cracking of skew concrete decks. Chapter III
summarizes the inspection program included in this research project for existing concrete decks
in service. It is to quantitatively understand the severity of such cracking in concrete decks in
Michigan. Chapter IV describes the experimental program for this research project, and
presents and discusses the measurement results. Chapter V presents the study program of the
finite element analysis and its results, which also exhibits possible causes of corner cracking in
skew concrete decks. Chapter VI analyzes and synthesizes all the information gathered in this
project, including the state agency survey results, the physical measurement results, and the finite
element analysis results, and then develops recommendations to eliminate or reduce corner
cracking. In addition, a process of implementation of the recommendations and a cost benefit
analysis are presented to facilitate implementation of the research results.

9
Figure I-1 Concrete Deck Cracking Highlighted Using Orange Paint
(S11 of 12033, Pearl Beach Road over I-96)

10
Figure I-2 Corner Cracking of Skewed Concrete Deck
(S10-4 of 77111, I-94 WB over Gratiot in St. Clair County)

11
CHAPTER II STATE OF THE ART AND PRACTICE
II-1. Literature Review
A larger number of studies have been conducted on concrete bridge deck cracking and its effect
on the deck durability. On the other hand, few reports, papers, or documented work have been
found in this study directly addressing the issue of corner cracking in skewed bridges in the
literature or with the surveyed state transportation agencies. Since deck cracking in general is
relevant to the research objective here, this literature review also covers that aspect. It should
also note that this review is not intended to be comprehensive but rather brief and covering the
major issues and / or factors relevant to concrete deck cracking.
Purvis et al.,(1995) studied premature cracking of concrete bridge decks using a three-phase
approach. The first phase included examination of existing bridge decks by visual inspection of
111 bridge decks in Pennsylvania. The inspected bridges were built within 5 years of the survey
and an in-depth examination was conducted on 12 of the 111 bridge decks. The in-depth
examination included the documentation of crack patterns, crack width, rebar location and depth,
and finally concrete coring. The results of this phase indicated that almost all transverse cracks
followed the line of the top transverse bars, regardless of the superstructure type. Coring of
concrete showed that transverse crack depth extended to the level of the top transverse bars and
beyond. It was also observed that transverse cracks often intersect coarse aggregate particles.
This indicated that the cracks occurred in the hardened concrete as opposed to the plastic
concrete. It was concluded that the cause of cracking was most likely drying shrinkage and

12
thermal shrinkage, rather than factors such as plastic shrinkage caused by surface evaporation
prior to curing or settlement of plastic concrete between the top transverse bars.
The second phase of this study involved the observation of the construction of eight bridge decks
to identify construction steps possibly contributing to shrinkage and cracking. The third phase
involved laboratory experiments that focused on examining the effects of aggregate, cement, and
fly ash on shrinkage. The result of this phase led to a conclusion that the main cause of
transverse cracking is the shrinkage of hardened concrete. Further, the type of aggregate used in
the concrete mix is a major factor associated with shrinkage cracking. Aggregate contributes to
drying shrinkage of concrete in two different ways. First, certain aggregates need more water in
the mix to produce the desired slump and workability, and the extra water increases shrinkage.
Secondly, certain aggregates yield to the pressure from the shrinking paste and do not provide
sufficient restraint against shrinkage. Therefore the study recommended using lower water
content in the concrete mix in order to reduce drying shrinkage. Another important factor is the
cement type. The study indicated that type II cement has lower heat of hydration and less drying
shrinkage than type I cement. It was indicated that the less cement used, the less heat generated,
the less water is required for hydration.
NCHRP Report 380 (Krauss and Rogalla 1996) is believed to have reported the most
comprehensive study performed to date on transverse bridge deck cracking. The study included
a survey of state departments of transportation in U.S. and several overseas transportation
agencies, analytical studies, laboratory research, and field measurements of a bridge deck during
and shortly after construction. However, the field measurement readings were not published.

13
Krauss and Rogalla (1996) also ranked the concrete material properties and material-related
mechanisms that lead to early-age bridge deck cracking as shown in Table II-1. Other factors
affecting cracking related to design and construction are also shown in the table. The study
indicated that concrete material factors that are important in reducing early-age cracking include
low shrinkage, low modulus of elasticity, high creep, low heat of hydration, and aggregates.
Other material factors that are helpful in reducing the risk of cracking include reduction of
cement content, use of shrinkage compensating cement and avoidance of silica fume admixtures
and other materials that produce very high early compressive strength and modulus of elasticity.
Concrete with these properties is prone to cracking because it creeps very little. It was also
recommended that use of other cementitious materials with less drying shrinkage should be
pursued. Air entrainment, water reducers, retarders, and accelerators were considered to have
minimal effects on cracking.
A restrained ring test was also utilized in Krauss and Rogalla (1996) to measure the tendency of
concrete to undergo drying shrinkage cracking, as well as to compare various concrete mixtures,
curing, and environmental factors. The major advantage of using the restrained ring test is that
it takes into consideration of all material factors that influence shrinkage cracking from the time
of casting. Furthermore, it does not require complex calculations. The ring test was used to
investigate the effects of many factors such as water to cement ratio, cement content, aggregate
size and type, silica fume, set accelerators and retarder, air entrainment, cyclic temperature,
evaporation rate, curing and shrinkage compensating cement. Rings cast with Type K
expansive cement cracked much later than the control mix. Moreover, the mixes containing

14
silica fume cracked 5 to 6 days earlier than the companion mixes without silica fume. The test
also showed that a mix with 28 percent of the Portland cement replaced with a Type F fly ash
cracked only slightly later (4.3 days) than the control specimens.

15
Table II-1 Factors Relevant to Concrete Deck Cracking (Krauss and Rogalla 1996)
Factors Effect
Major Moderate Minor None Design Restraint Continuous/simple span Deck thickness Girder Size Alignment of top and bottom reinforcement bars Form type Concrete cover Girder spacing Quantity of reinforcement Reinforcement bar sizes Dead-load deflections during casting Stud spacing Span length Bar type-epoxy coated Skew Traffic volume Frequency of traffic-induced vibrations
√
√ √ √ √ √
√ √ √ √ √ √ √ √ √ √ √
√ √
Materials Modulus of elasticity Creep Heat of hydration Aggregate type Cement content and type Coefficient of thermal expansion Paste volume---free shrinkage Water-cement ratio Shrinkage-compensating cement Silica fume admixtures Early compressive strength HRWRAs Accelerating admixtures Retarding admixtures Aggregate size Diffusivity Poisson’s ratio Fly ash Air content Slump Water content
√ √ √ √ √
√ √ √ √ √
√ √ √ √ √ √ √
√ √ √ √
Construction Weather Time of casting Curing period and method Finishing procedures Vibration of fresh concrete Pour length and sequence Reinforcement ties Construction loads Traffic-induced vibrations Revolutions in concrete truck
√ √
√ √
√ √
√ √ √ √

16
To control thermal shrinkage, Babaei and Fouladgar (1987) recommended the use of a mix
design with cement content as low as possible. When less cement content is used, less heat of
hydration is generated. Pozzolans and slag can be used as partial substitutes for Portland
cement. It was also recommended that Type II cement be used rather than Type I because Type
II generates lower heat of hydration. Furthermore, as a means of controlling thermal shrinkage,
use of retarders in the mix is recommended to delay the hydration process and reduce the rate of
heat generated. The effect of aggregate type on drying shrinkage was also studied. A soft
aggregate such as sandstone tends to result in increased drying shrinkage, while hard aggregates
such as quartz, dolomite, and high limestone tend to result in decreased drying shrinkage. Also,
use of less water in the mix resulted in decreased drying shrinkage.
Shah et al.(1998) observed that cracking has been shown to increase in higher strength concrete,
especially with the addition of silica fume. It was recommended in this work that randomly
distributed fiber reinforcement can be used to significantly reduce crack width. Different fiber
compositions can alter the degree to which this occurs. It was also found that with a two percent
addition of shrinkage reducing admixture (SRA) by weight of cement, drying shrinkage should
be reduced by nearly 50 percent.
Similarly, French et al. (1998) investigated 72 bridges in the Minneapolis/St. Paul metropolitan
area to address the issue of concrete cracking. In this study, the dominant material parameters
associated with transverse cracking in bridge deck were identified as cement content, aggregate
type and quantity, and air content. Data obtained from the material reports for 21 of the bridge
deck mixes (including 12 prestressed- and 9 steel-beam bridges) show that cement content is a

17
major factor contributing to premature deck cracking. Namely, higher cement content causes
more cracking. Increased aggregates and increased air content were also found respectively to
have reduced cracking.
The earliest experimental investigation on skewed RC decks compared with their straight
counterpart perhaps is Newmark et al (1946, 1947). The study used quarter–scaled RC deck
models with 0, 30, and 60 degrees of skew. Using load testing, the maximum strain in the main
(transverse) rebar was found to increase with the skew angle. For composite decks with
respectively 30 and 60 degree skew, this strain was 1.23 and 1.29 times of the straight deck’s
counterpart, and 1.36 and 1.65 times for noncomposite decks with only natural bonding to the
beams. This conclusion appears to be consistent with observations of corner cracking in skewed
decks in Michigan and other states (Fu et al 1994, Castaneda 1995). It should be also noted that
strains in concrete were not measured in this study.
It is relevant to note that the current AASHTO standard design code (2002) does not have
specific provisions for skewed RC decks. Except an allowance for the transverse main
reinforcement to follow the skew when the skew angle is smaller than 25 degrees, the AASHTO
LRFD design code (2004) also has no considerations to skew in deck analysis and design. Both
codes use a concept of isolating a “typical strip” of the deck for design. This approach,
however, ignores the influence of the beam system supporting the deck, resulting in a simplistic
model that possibly misses the governing stress/strain condition, depending on a number of
factors including the magnitude of skew angle.

18
II-2. Survey of State Transportation Agencies
A survey of state transportation agencies was conducted in this study to understand whether they
experience the problem of corner cracking in skewed concrete decks and to possibly learn their
experience and solution to the problem. The survey included the following focus areas: 1)
Observed severity of concrete deck corner cracking in skewed structures and its behavior (where
in the deck, when cracked, what percentage of decks experiencing cracking, orientation of
cracks, etc.) 2) Actions taken to address such cracking. 3) Special design requirements for
skewed decks. 4) Special design requirements for reinforcement in skewed decks.
Out of the 52 state level agencies, 36 returned the questionnaire, representing a 69% return rate.
The responses are summarized in Tables II-2 to II-5. Table II-2 focuses on the observed
cracking in skew concrete decks. It is seen that out of the 36 agencies that responded, 17 have
observed concrete deck corner cracking. In addition, two also reported transverse cracking, not
necessarily in the corner area. Six other agencies did not know whether corner cracking was
present in their bridge decks, and 13 said that there was no deck-corner cracking.
Out of the 17 agencies that indicated presence of corner cracking in their skew bridges, 5 said 0
to 25% of their decks have such cracking, 6 said 25 to 50%, 3 said 50 to 75%, and 3 said 75 to
100%. In other words, 12 out of 17 agencies said that more than 25% of their skew concrete
decks have corner cracking. A majority of the states (10 out of 17) said that such cracking was
observed within first 3 months of the deck life, 5 states said 3 to 12 months, and only 2 agencies
said more than12 months. A large number of the states (14 out of 17) indicated that the most

19
commonly seen cracking location is the acute angle area, with only one agency indicating the
obtuse angle area. Two agencies responded with “do not know” as to in what areas in the deck
cracking is more commonly seen. As far as the major direction of such corner cracking is
concerned, the most often observed direction is perpendicular to the radial direction (7 agencies),
followed by radial direction (5 agencies), transverse direction (3 agencies), longitudinal direction
(one agency), and random directions (one agency).
It is appropriate to conclude that corner cracking in skewed concrete bridge decks is not a local
issue. Such cracking is mostly observed in the early age of the deck (within 3 to 12 months), in
the acute angle area, and in directions perpendicular to the radial direction.
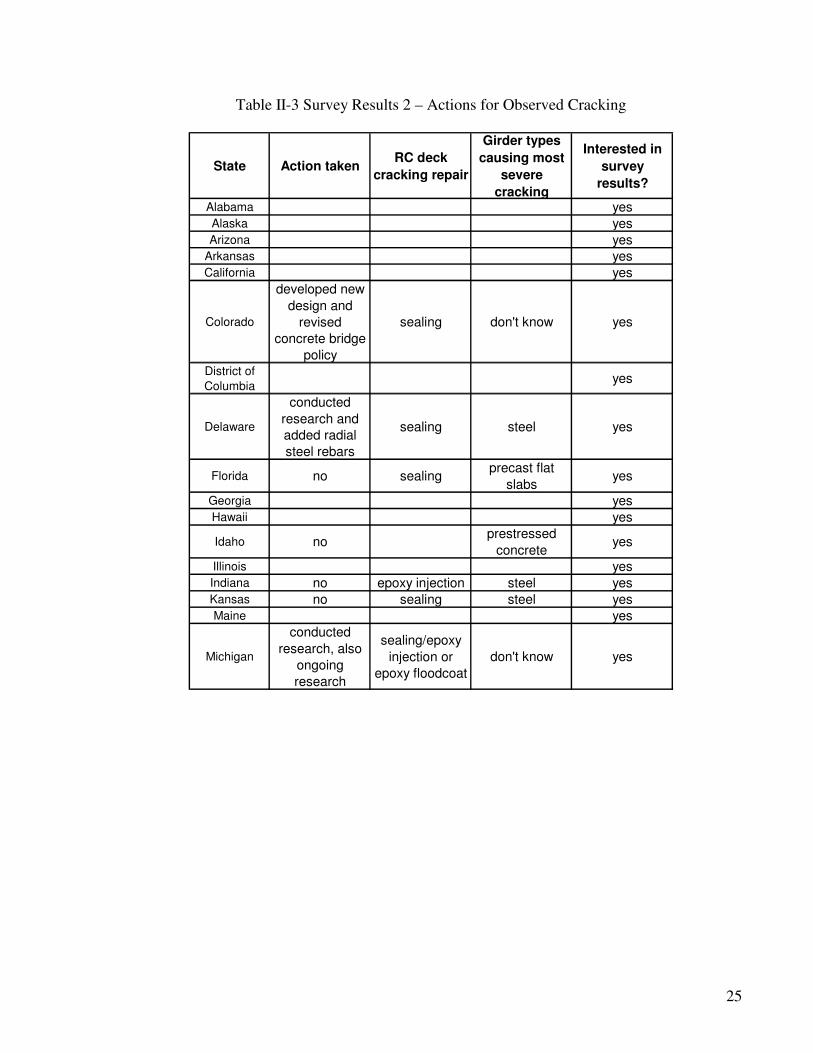
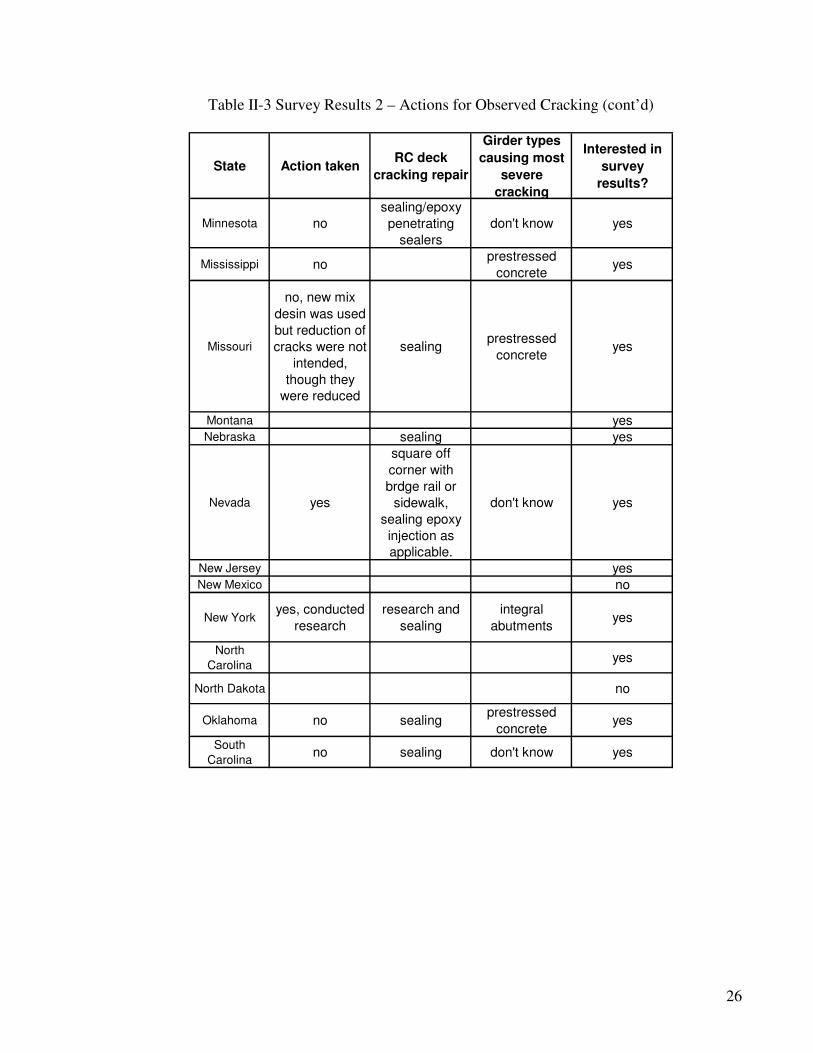
Table II-3 includes the responses to the questions regarding actions or understanding after
cracking is observed. Only a few agencies have taken action on corner cracking in skewed
concrete bridge decks. Among them, Colorado developed new design, Delaware conducted
research and added radial steel, New York conducted research, and Missouri used a new mix
design that turned out to have also reduced cracking. For repair such cracking, deck sealing is
seen in Table II-3 as the overwhelmingly common measure, if ever done. To the question on
what type(s) of beam as seen to cause most cracking, most responding agencies either said “don’t
know” or offered no comments. Others identified prestressed concrete beams (4 agencies) and
steel beams (3 agencies), integral abutment (one agency), and precast flat slabs (one agency).
All agencies except two indicated their interest in the result of this survey, showing a strong
nationwide interest in the issue.

20
The questionnaire has also asked the state agencies for any special requirements for the design of
concrete skew decks, which may be different from those for straight decks. The information
obtained was used as leads for gathering more details, such as the web sites provided, excerpts of
the specifications attached, follow-up phone conversations, etc. Tables II-4 and II-5 show
summaries for the special requirements used by the responding agencies, which are discussed
further next.
Four states have a specific requirement for the reinforcement orientation in skew decks. Table
II-4 focuses on the cutoff skew angle at which the reinforcement will not follow the skew angle.
It is seen that for the four states included, this cutoff angle ranges from 15 to 30 degrees. Note
that the LRFD design code’s counterpart is 25 degrees.
Table II-5 summarizes the findings from the survey and follow up investigations on the quantity
of reinforcement in skew decks. It is seen that seven states have specific design requirements
for additional reinforcement. Three of these states (Arizona, Arkansas, and Minnesota) did not
indicate a cutoff threshold, so their respective requirements for additional steel are applied to all
skew decks. The other four states have their requirements specified according to the cutoff
thresholds. In general, skew requires more steel and to be specially arranged. As seen, some
states require further more steel when the skew angle exceeds the threshold value.

21
II-3. Summary
The literature review and state survey can be summarized as follows.
1) Corner cracking in concrete skew bridge decks is not a local issue, and many other
states observe the same problem.
2) Despite the commonly observed problem, very little research result has been reported
or documented that directly addresses the issue of concrete deck corner cracking in
skewed bridges. On the other hand, a large amount of research results are available
regarding concrete deck cracking in general, which may be of interest to this research
project.
3) A number of states have some special requirements for the design of concrete skew
decks, including the reinforcement orientation and additional quantity. Nevertheless,
the basis for these requirements has not been documented.

22
Table II-2 Survey Results 1 – Corner Cracking in Skewed Concrete Decks
State
Cracking
detected in
corner of RC
decks?
Estimated
percentage
of decks
with
cracking
When is
cracking
observed
Where is
cracking
observed
What type of
cracking is most
profound
Alabama no
Alaska no
Arizona no
Arkansas don't know
California don't know
Colorado yes 50-75%3 months to
1 year
acute angle
arearadial, from the corner
District of
Columbiano
Delaware yes 0-25%0 to 3
months
acute angle
arearadial, from the corner
Florida don't know0 to 3
monthsdon't know transverse
Georgia no
Hawaii don't know
Idaho yes 25%-50%0 to 3
monthsdon't know
perpendicular to the
radial direction
Illinois no
Indiana yes 75%-100%0 to 3
months
acute angle
area
prependicular to the
radial direction
Kansas yes 0-25%3 months to
1 year
obtuse
angle arearadial from the corner
Maine no
Michigan yes 0 to 25%3 months to
1 year
acute angle
area
perpendicular to the
radial direction also
random difficlult ro
describe

23
Table II-2 Survey Results 1 – Corner Cracking in Skewed Concrete Decks (cont’d)
State
Cracking
detected in
corner of RC
decks?
Estimated
percentage
of decks
with
cracking
When is
cracking
observed
Where is
cracking
observed
What type of
cracking is most
profound
Minnesota yes 25%-50%0 to 3
months
acute angle
area
perpendicular to the
radial direction
Mississippi no 0 to 25%3 months to
1 year
acute angle
areatransverse
Missouri yes 75-100%0 to 3
months
acute angle
arearadial from the corner
Montana don't know
Nebraska no
Nevada yes 0%-25%more than 1
year
acute angle
area
random, difficult to
desctibe
New Jersey no
New Mexico no
New York yes 50%-75%0 to 3
months
acute angle
area
perpendicular to the
radial direction
North
Carolinano
North Dakota don't know
Oklahoma yes 50%-75%3 months to
1 year
no
comment
longitudinally and
transvers
South
Carolinayes 75%-100%
0 to 3
months
acute angle
areatransverse

24
Table II-2 Survey Results 1 – Corner Cracking in Skewed Concrete Decks (cont’d)
State
Cracking
detected in
corner of RC
decks?
Estimated
percentage
of decks
with
cracking
When is
cracking
observed
Where is
cracking
observed
What type of
cracking is most
profound
Tennessee yes 25%-50%0 to 3
months
acute angle
area
random, difficult to
describe
Texas no
Utah yes 25-50%3 months to
1 year
acute angle
areatransverse
Virginia yes 0 to 25%more than 1
year
acute angle
area
perpendicular to the
radial direction
Washington yes 25-50%0 to 3
months
acute angle
arearadial from the corner
Wyoming yes 25%-50%0 to 3
months
acute angle
area
perpendicular to the
radial direction
25
Table II-3 Survey Results 2 – Actions for Observed Cracking
State Action takenRC deck
cracking repair
Girder types
causing most
severe
cracking
Interested in
survey
results?
Alabama yes
Alaska yes
Arizona yesArkansas yes
California yes
Colorado
developed new
design and
revised
concrete bridge
policy
sealing don't know yes
District of
Columbiayes
Delaware
conducted
research and
added radial
steel rebars
sealing steel yes
Florida no sealingprecast flat
slabsyes
Georgia yes
Hawaii yes
Idaho noprestressed
concreteyes
Illinois yes
Indiana no epoxy injection steel yes
Kansas no sealing steel yes
Maine yes
Michigan
conducted
research, also
ongoing
research
sealing/epoxy
injection or
epoxy floodcoat
don't know yes
26
Table II-3 Survey Results 2 – Actions for Observed Cracking (cont’d)
State Action takenRC deck
cracking repair
Girder types
causing most
severe
cracking
Interested in
survey
results?
Minnesota no
sealing/epoxy
penetrating
sealers
don't know yes
Mississippi noprestressed
concreteyes
Missouri
no, new mix
desin was used
but reduction of
cracks were not
intended,
though they
were reduced
sealingprestressed
concreteyes
Montana yes
Nebraska sealing yes
Nevada yes
square off
corner with
brdge rail or
sidewalk,
sealing epoxy
injection as
applicable.
don't know yes
New Jersey yes
New Mexico no
New Yorkyes, conducted
research
research and
sealing
integral
abutmentsyes
North
Carolinayes
North Dakota no
Oklahoma no sealingprestressed
concreteyes
South
Carolinano sealing don't know yes
27
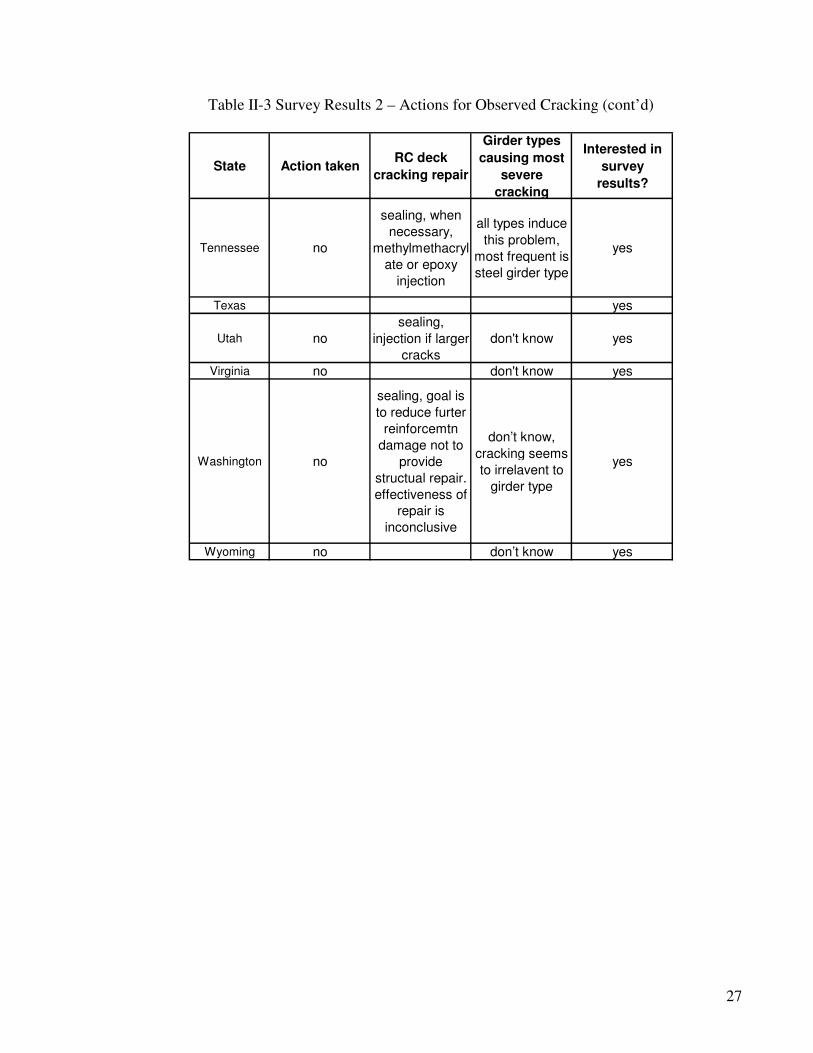
Table II-3 Survey Results 2 – Actions for Observed Cracking (cont’d)
State Action takenRC deck
cracking repair
Girder types
causing most
severe
cracking
Interested in
survey
results?
Tennessee no
sealing, when
necessary,
methylmethacryl
ate or epoxy
injection
all types induce
this problem,
most frequent is
steel girder type
yes
Texas yes
Utah no
sealing,
injection if larger
cracks
don't know yes
Virginia no don't know yes
Washington no
sealing, goal is
to reduce furter
reinforcemtn
damage not to
provide
structual repair.
effectiveness of
repair is
inconclusive
don’t know,
cracking seems
to irrelavent to
girder type
yes
Wyoming no don’t know yes

28
Table II-4 Threshold Skew Angles beyond Which Reinforcement Not To Follow Skew Direction
Table II-5 Additional Steel Reinforcement Requirements for Skew Decks
If skew angle
< threshold angle
If skew angle
> threshold angle
AR yes yes
AZ yes yes
FL*
3 No.5@6" along
skew plus doubled
longitudinal steel
MN
fanned steel in
acute angle area
fanned steel in acute
angle area
NC splayed splayed
NY*
#13 @ 100mm
along skew over
one-girder spacing
TX*
at 6" over 42" of
deck length plus
4 bars from facia
edge to facia beam
8 bars over
44"/cos(skew angle)
of deck length plus 4
bars from facia adge
to facia beam
* Threshold angle given in Table II-4
State
Threshold Skew
Angle
Dictating
Reinforcement
Direction* (degree) Remarks
CO 25 (to be approved)
transition from along-skew
to perpendicular-to-girder
is allowed for small skew
FL 15
NY 30
TX 15
* When skew angle is smaller than threshold, reinforcement
will be parallel to skew, otherwise perpendicular to girder.

29
CHAPTER III PERFORMANCE OF SKEW DECKS IN MICHIGAN
III-1. Inspection Program
In order to understand the performance of concrete skew bridge decks in Michigan, inspection of
decks was performed in this study for bridges in Michigan. The intention was to understand
how severe the situation is for these decks. It was also hoped that the inspection data might
provide some information on the possible causes of corner cracking in these decks.
A total of 24 decks were included in this inspection program, which were located around the
state. The intention was to compare 20 skewed structures with 20 straight ones, including 14
skewed and 10 straight decks inspected in this study and 6 skewed and 10 straight decks from a
recent previous study (Aktan et al 2003). This section presents the scope and details of the
inspection program. The next section will discuss the inspection data and the result of their
statistical analysis.
Tables III-1 and III-2 show the sample of decks for this inspection program. Also included are
the 10 straight decks shaded in Table III-1 taken from the previous project (Aktan et al 2003) to
maximize the use of available data. Besides the ID, a number of other characteristic factors are
also listed in the tables, including length of the span inspected (not the total bridge length),
aspect ratio as the ratio of bridge width to the inspected span length, span type (simple or
continuous), girder type, deck slab thickness, deck age at the time of inspection, and skew angle.
Girder types include steel, prestressed concrete I (PCI), concrete T (reinforced concrete T cross

30
section), and adjacent box (prestressed concrete boxes adjacent to on another) beams. Table III-
2 contains the same information for skew decks included in this study, for 6 shaded decks taken
from the earlier study plus the 14 inspected in this project.

31
Table III-1. Deck Crack Density of Inspected Straight Bridges and Their Parameters
Bridge ID Crack
Density (in/sqft)
Span Length
(ft)
Aspect Ratio
(Width/ Span
Length)
Span Type
Girder Type
Slab Thickness
(in)
Age (years)
Skew Angle (degree)
B01 of 06071 0.0106100 25.00 2.80 Continuous Adjacent
Box 6 4 0
B01 of 44012 0.0116893 64.99 0.70 Simple Steel 9 3 0
B02 of 06071 0.0125310 32.00 2.26 Continuous Steel 8 4 0
B03 of 64012 0.0008217 50.98 0.93 Simple Adjacent
Box 6 1 0
B03 of 73031 0.0102346 50.00 1.10 Simple PCI 8 2 0
S03 of 82192 0.0067657 38.00 1.47 Simple Steel 9 1 0
S06 of 82192 0.0045959 29.50 1.99 Simple Steel 9 1 0
S09 of 82252 0.1430590 24.75 2.84 Continuous Steel 9 5 0
S15 of 25032 0.0880100 32.81 2.83 Simple Adjacent
Box 6 3 0
S19 of 82023 0.1103213 28.08 2.91 Simple Steel 8 5 0
B01 of 29021 0.0372469 91.00 0.50 Simple PCI 9 4 0
B02 of 78061 0.0125686 88.91 0.58 Simple Adjacent
Box 6 5 0
B01 of 78061 0.0115066 60.00 0.98 Simple Adjacent
Box 6 4 0
S11 of 12033 0.0113491 108.00 0.30 Continuous Steel 7 5 0
B01 of 38021 0.0455776 45.91 1.03 Simple Adjacent
Box 6 4 0
B02 of 46062 0.0495825 28.00 1.22 Simple Steel 6 4 0
S03 of 82192 0.0023850 33.00 1.70 Continuous Steel 9 3 0
S03 of 63043 0.0209660 48.00 1.32 Simple Adjacent
Box 6 5 0
S30 of 82112 0.0690398 55.30 1.25 Simple Steel 9 4 0
S02 of 82195 0.0914714 33.00 2.71 Continuous Steel 9 5 0

32
Table III-2. Deck Crack Density of Inspected Skewed Bridges and Their Parameters
Bridge ID Crack Density
(in/sqft) Span Length
(ft)
Aspect Ratio
(Width/ Span
Length)
Span Type
Girder Type
Slab Thickness
(in)
Age (years)
Skew Angle
(degree)
S03 of 63022 0.0082966 112.50 0.40 Simple Adjacent
Box 6 3 24
S04 of 82062 0.0099710 62.50 1.00 Continuous Steel 8 4 28
S11 of 82025 0.0271360 39.00 1.79 Simple Steel 8 5 50
S17 of 82112 0.0091386 73.95 1.65 Continuous Steel 9 2 22
S27 of 41064 0.0004132 131.56 0.46 Simple PCI 9 4 19
S28 of 41064 0.0030582 131.56 0.46 Simple PCI 9 4 19
S44 of 25132 0.0247323 42.00 1.04 Simple Steel 9 5 49
B01 of 25051
0.0496383 40.00 2.37 Simple PCI 9 2 24
S02 of 18033 0.0355179 93.63 0.72 Simple Steel 9 3 40
S02 of 09101 0.0173882 105.00 0.90 Continuous Concrete
T 9 5 30
B03 of 11112
0.0092593 78.25 0.91 Simple PCI 9 4 45
S04 of 11016 0.0519442 104.00 0.81 Simple Adjacent
Box 6 4 24
S02 of 11112 0.0179297 45.80 1.03 Simple PCI 9 5 26
B01 of 58011
0.0496383 65.62 0.72 Simple Adjacent
Box 6 1 20
S07 of 47065 0.0370477 54.50 0.65 Simple Steel 9 4 48
S04 of 50015 0.0451475 68.00 0.71 Simple PCI 9 2 44
S03 0f 63022 0.0270707 122.60 0.37 Simple Adjacent
Box 6 5 23
B01 of 77041 0.0462953 116.70 0.40 Simple Adjacent
Box 6 5 22
S04 of 63022 0.0001943 122.10 0.38 Simple Adjacent
Box 6 1 23
S03 of 82195 0.0000000 33.00 0.74 Simple Steel 9 1 63

33
To minimize the influence to traffic during deck inspection, only the driving lane of the first span
was inspected for each of these bridges. The width of the inspected lane is typically 12 ft. The
columns of “Span Length” in Tables III-1 and III-2 give the length of the span inspected. The
focus here was on cracking of the concrete deck. Cracks were marked by spray paint next to
them to make them more visible for measurement and mapping. Crack lengths were measured
using a tape measure, and width using a crack width ruler. Figures III-1 to III-13 show the
cracks mapped for the skew decks inspected in this project, except S03 of 82195 that showed no
cracking. Note that the horizontal outlines in these crack maps are lane lines, indicating a 12 ft
wide lane. Also the lengths of these inspected lane sections are the same as the span lengths
recorded in Table III-2.
As seen in the crack maps, cracks extend in the longitudinal direction (along the traffic or beam
direction), transverse direction (perpendicular to the traffic or beam direction), diagonal
direction, and some other random directions. Note that diagonal cracking is seen mostly in the
deck end areas. The total length of the observed cracks for each deck is divided by the
inspected deck area to arrive at a crack density in in./sqft to quantify the severity of cracking.
This density is recorded in Tables III-1 and III-2 for each deck inspected.

34
Figure III-1 Cracking Map for S02 of 09101
Figure III-2 Cracking Map for S44 of 25132
Figure III-3 Cracking Map for S04 of 11016

35
.
Figure III-4 Cracking Map for B01 of 25051
Figure III-5 Cracking Map for S02 of 11112
Figure III-6 Cracking Map for B03 of 11112

36
Figure III-7 Cracking Map for S02 of 18033
Figure III-8 Cracking Map for B01 of 58011
Figure III-9 Cracking Map for S07 of 47065

37
Figure III-10 Cracking Map for S04 of 50015
Figure III-11 Cracking Map for S03 of 63022
Figure III-12 Cracking Map for B01 of 77041

38
Figure III-13 Cracking Map for S04 of 63022
Figures III-14 to III-23 show crack maps for the ten straight bridge decks inspected in this
research project. It is seen that these cracks all generally follow the longitudinal and transverse
directions. Almost no crack extended in a diagonal direction. In comparison, noticeably more
diagonal cracks are observed in the skew decks as shown in Figures III-1 to III-13, as well as in
Figure I-2 seen earlier. These are the very focus of this study.
Figure III-14 Cracking Map for B02 of 78061
Figure III-15 Cracking Map for B01 of 29021

39
Figure III-16 Cracking Map for S11 of 12033
Figure III-17 Cracking Map for B01 of 78061

40
Figure III-18 Cracking Map for B01 of 38021
Figure III-19 Cracking Map for B02 of 46062
Figure III-20 Cracking Map for S03 of 82192
Figure III-21 Cracking Map for S03 of 63043

41
Figure III-22 Cracking Map for S30 of 82112
Figure III-23 Cracking Map for S02 of 82195
III-2. Analysis of Inspection Results
To examine relationships between the crack density and other possible causal factors, Figures
III-24 to III-28 plot crack density versus a possible causal factor in each for the 20 skew
decks. These factors are deck age, span length, slab thickness, skew angle, and aspect ratio.
Inspection of these plots indicates, however, no noticeable statistical correlation between the
crack density and any of these parameters.

42
Age
5.004.003.002.001.00
Crac
k De
nsity
0.06
0.05
0.04
0.03
0.02
0.01
0.00
Figure III-24 Relation between Crack Density and Deck Age (yrs) for Skew Bridges
Slab Thickness
9.008.508.007.507.006.506.00
Cra
ck D
en
sit
y
0.06
0.05
0.04
0.03
0.02
0.01
0.00
Figure III-25 Relation between Crack Density and Deck Slab Thickness (in.) for Skew Bridges

43
Span Length
125.00100.0075.0050.0025.00
Cra
ck D
en
sit
y
0.06
0.05
0.04
0.03
0.02
0.01
0.00
Figure III-26 Relation between Crack Density and Span Length for Skew Bridges
Skew
70.0060.0050.0040.0030.0020.0010.00
Cra
ck D
en
sit
y
0.06
0.05
0.04
0.03
0.02
0.01
0.00
__
Figure III-27 Relation between Crack Density and Skew Angle (degree) for Skew Bridges
44
Aspect Ratio (Width/Span Length)
2.502.001.501.000.500.00
Cra
ck D
en
sit
y
0.06
0.05
0.04
0.03
0.02
0.01
0.00
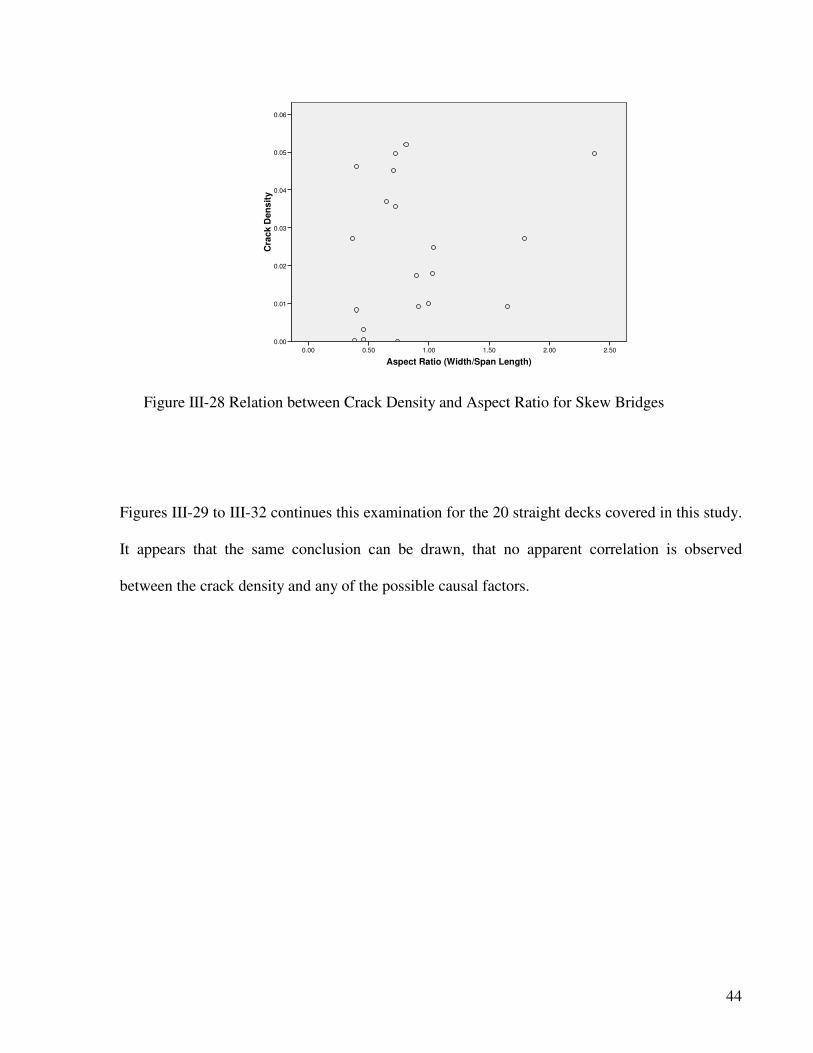
Figure III-28 Relation between Crack Density and Aspect Ratio for Skew Bridges
Figures III-29 to III-32 continues this examination for the 20 straight decks covered in this study.
It appears that the same conclusion can be drawn, that no apparent correlation is observed
between the crack density and any of the possible causal factors.

45
Age
5.004.003.002.001.00
Cra
ck D
ensi
ty
0.1500000
0.1000000
0.0500000
0.0000000
Figure III-29 Relation between Crack Density and Deck Age for Straight Bridges
Slab Thickness
9.008.508.007.507.006.506.00
Cra
ck D
ensi
ty
0.1500000
0.1000000
0.0500000
0.0000000
Figure III-30 Relation between Crack Density and Deck Slab Thickness for Straight Bridges

46
Span Length
120.00100.0080.0060.0040.0020.00
Cra
ck D
ensi
ty
0.1500000
0.1000000
0.0500000
0.0000000
Figure III-31 Relation between Crack Density and Span Length for Straight Bridges
Figure III-32 Relation between Crack Density and Aspect Ratio for Straight Bridges
It appears to be appropriate to conclude that the included parameters, including span length, deck
age, slab thickness, and skew angle magnitude, are not statistically correlated with cracking
severity. Nevertheless, if one ignores a few data points in the plots for the straight decks for low
crack densities at older ages, shorter span lengths, and lower aspect ratios, a trend of crack

47
density increase is seen with age increase, span length decrease, and aspect ratio increase. Of
course these trends are not obvious. Comparison of the crack maps for the skewed and straight
decks also shows that diagonal cracking (not along or perpendicular to the beams) is more often
observed in the corner areas. Such cracking appears to be associated with skew structures.

48
CHAPTER IV
BEHAVIOR OF TYPICAL SKEW DECKS USING PHYSICAL MEASUREMENT
Cracking in Portland cement concrete decks can be caused by a number of factors as discussed in
Chapter II. These factors may also interact with each other. In order to understand the
behavior of concrete deck in both stages of strength development and service, an experimental
program was designed in this project for physical measurement of interested quantities. This
experiment program had two main purposes: 1) To quantitatively understand the strain/stress
behavior of concrete in the field condition for critical stages of its life starting from hydration. 2)
To provide measurement data for the calibration of finite element modeling, so that the
numerical analysis method can be reliably used to understand the behaviors of a larger number of
skew concrete decks. Relatively, the second purpose was more emphasized here, because field
instrumentation and testing of many bridges can be prohibitively costly, and calibrated numerical
modeling and analysis using the finite element method is the only viable approach to
understanding the behaviors of different bridge decks.
IV-1. Experiment Program
The experiment program included two skew concrete decks constructed in the summer of 2005.
One of them had a steel I-beam superstructure supporting a 9” concrete deck on Grove Street
over I-94 (S02-81063); the other a prestressed I-beam superstructure with a 9” deck carrying the
ramp from US-127 to M-50 (S02-38131). These two bridges are referred to as the Grove Street

49
and M50 bridges hereafter in this report. Figures IV-1 and IV-2 show their deck planes,
respectively.
Figure IV-1 Grove Street Bridge (S02-81063) Deck Span 1 and Instrumentation
Mid span
Middle of beam spacing
Transducers
Thermocouples at the bottom of steel beam
Total sensors:
for ambient temperature and humidity 1 Temperature & relative humidity transmitter3 Thermocouples on beams8 Thermocouples in deck12 Strain gages in deck
5'
K
J
H
G
F
E
D
C
B
A
Span 1
S1 S2
S4S3
Data acquisition systemunderneath the bridge
Transmitter for ambient temperature and humidity next to steel box

50
Figure IV-2 M50 Bridge (S02-38131) Deck Span 4 and Instrumentation
The Grove Street Bridge provides two lanes for east and west traffic with a skew angle of 49.1o.
The steel superstructure consists of 10 beams spaced at 7ft, and has a pin-and-hanger
configuration carrying four spans over I-94 with a 9” thick concrete deck slab. Only one span at
the east end was instrumented, which has a span length of 58’-0”. The pin-and-hanger
connection was on the west side of the support and the beam length is 64’-0”. More details of
instrumentation are presented in the next section.
The M-50 structure carries traffic from US-127 to M-50 on a one-lane exit ramp. The
superstructure is made of five AASHTO prestressed concrete beams spaced at 9.57 ft at the
abutment end and a 9” thick concrete deck. The roadway is on a horizontal curve, but the

51
girders themselves are straight. The bridge includes four continuous spans, with various skew
angles. Only one span of length 45ft at the end of the ramp was instrumented, which has a skew
angle of 46o. More details of the instrumentation are presented in the next section.
Results from this experiment program were also used in the calibration of finite element
modeling for skew bridges typical in Michigan, along with their straight counterparts. Two
superstructure types are considered (steel I-beams and prestressed concrete I-beams) for 3 skew
angles (0, 30, and 45 degrees) and two beam spacings (6 and 10 ft). This makes a total of 12
cases of bridges designed according to the AASHTO standard specifications. More details and
the results of these cases are included in Chapter V.
IV-2. Instrumentation
Both the Grove Street and the M-50 bridges were instrumented with 12 separate strain gages in
the concrete at four locations identified as S1, S2, S3, and S4 shown in Figures IV-1 and IV-2
respectively. Each of the four locations in the deck had three one-arm strain gages, one at the
depth of the top reinforcement in the bridge’s longitudinal direction, and the other two at the
depth of the lower reinforcement in the longitudinal and transverse directions. Figure IV-3
includes a vertical cross section of the deck to show the detail of this arrangement. The strain
gages and locations were selected to provide strain measurements for short and long term
behaviors of the deck, as well as possible maximum strain response to truck wheel load.

52
Figure IV-3 Strain Gage and Thermal Couple Depth Locations in Deck
In addition, eight thermocouples were installed in each of the two decks and next to the top strain
gage and the bottom strain gages, as shown in Figures IV-1 and IV-2, to obtain temperature
measurements, because the strains can be an effect of temperature change and in turn they may
cause concrete cracking while the concrete strength is still low and developing. Three more
thermal couples were attached to the bottom flange of the two facia beams and one middle beam
of both bridges. In addition, another temperature gage was placed below the deck at the
abutment, as shown in Figures IV-1 and IV-2 as a dashed line square. These sensors were
intended to provide ambient temperature readings for the temperature field. The heat transfer
and dissipation in the deck during hydration depends on the ambient temperature, and thus the
finite element modeling of the deck hydration will use the measured ambient temperature as its
boundary condition. Furthermore, a humidity sensor was placed under the deck, next to the
temperature transmitter, as shown in Figures IV-1 and IV-2, to gather humidity readings for the
finite element modeling.

53
IV-3. Measurement Results
IV-3.1 Behavior in Hydration Process
Temperature, strain, and humidity data were collected for the first three days of concrete deck
curing for the Grove Street structure and the M-50 structure. The Grove Street bridge deck was
constructed in two phases, one traffic direction in each phase. Phase 1 included the East Bound
half of the bridge, including sensor locations S3 and S4 shown in Figure IV-1. For Phase 2 of
the bridge, we were able to continue data recording for about 21 days starting from concrete
placement. The data were acquired using an Omega Log-book data acquisition system, as
shown in Figure IV-4, powered by batteries.
Figure IV-4 Omega Data Logbook System

54
Grove Street Bridge
Figure IV-5 shows the temperature readings recorded using the thermocouples in the deck and
Figure IV-6 for the transducers for the environment condition. Those temperatures marked as
S3 and S4 are thermocouples embedded in the concrete deck at the respective locations indicated
in Figure IV-1. At each location, two temperature curves are shown, one for the thermal couple
at the top- and the other at the bottom-reinforcement level. The other two temperature records
in Figure IV-6 were obtained from a thermocouple attached to an exterior beam on the East
Bound side and the temperature transmitter underneath the deck near the abutment, also shown
in Figure IV-1. Figure IV-7 exhibits the relative humidity readings underneath the bridge deck
for the ambient humidity condition.
55
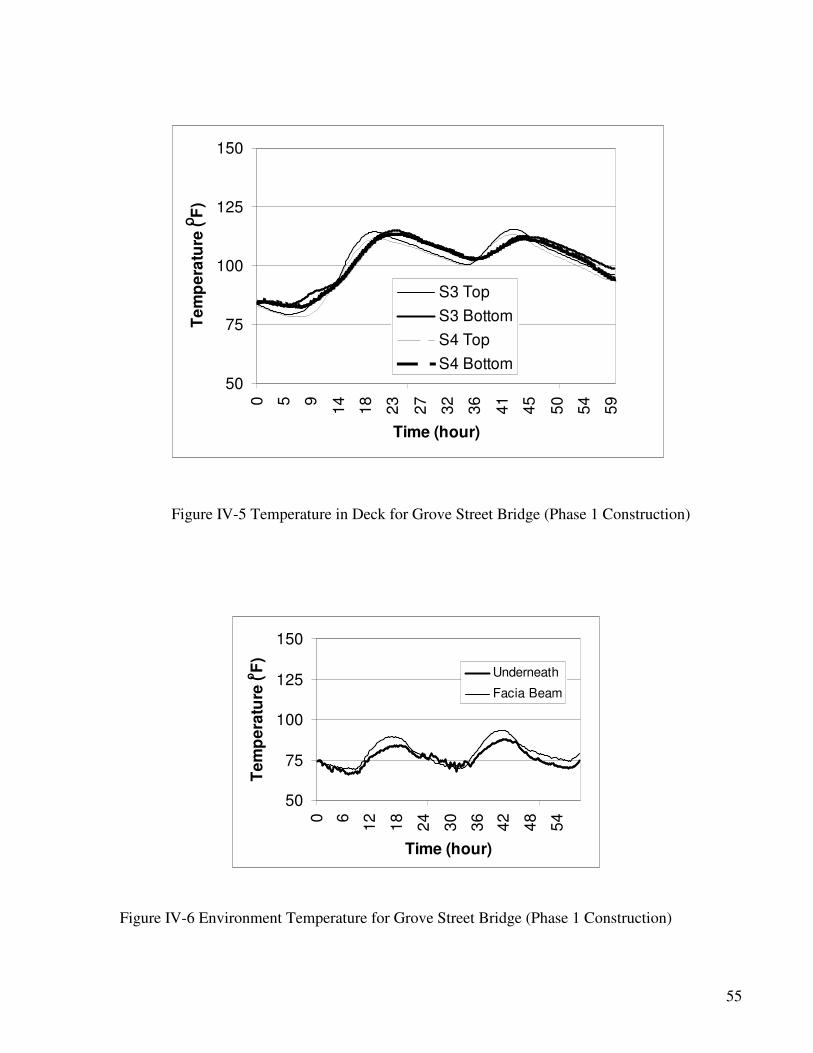
Figure IV-5 Temperature in Deck for Grove Street Bridge (Phase 1 Construction)
Figure IV-6 Environment Temperature for Grove Street Bridge (Phase 1 Construction)
50
75
100
125
150
0 5 9
14
18
23
27
32
36
41
45
50
54
59
Time (hour)
Te
mp
era
ture
(OF
)
S3 Top
S3 Bottom
S4 Top
S4 Bottom
50
75
100
125
150
0 6
12
18
24
30
36
42
48
54
Time (hour)
Te
mp
era
ture
(oF
)
Underneath
Facia Beam

56
20
40
60
80
0 10 20 30 40 50 60
Time (hour)
Am
bie
nt
Re
lati
ve
Hu
mid
ity
Figure IV-7 Environment Humidity for Grove Street Bridge (Phase 1 Construction)
These results show that the two sensors for environmental temperature recorded similar
temperatures, exhibiting essentially a daily variation. Those sensors in the deck also followed
this cycle, with a little time lag behind the cycle of the two sensors for the ambient environment.
Note also that the deck temperatures exhibited a general trend of increase besides the daily cycle.
Figure IV-8 shows the concrete strains recorded through the strain gages at location S3 in the
deck, for the same time period in Figures IV-5 to IV-7. They appear to follow the daily cycle as
well, but not as clearly seen as for the temperatures. The strain gages near the deck bottom
surface show a clearer daily cycle than the one near the top surface. The maximum strain for
this time period is about +300 microstrains.

57
-0.0004
-0.0003
-0.0002
-0.0001
0
0.0001
0.0002
0.0003
0.0004
0.0005
0 10 20 30 40 50 60
Time (hour)
Str
ain
S3 Top Longi'l
S3 BottomLongi'l
S3 BottomTrans
Figure IV-8 Strains at S3 Location in Grove Street Bridge Deck (Phase 1 Construction)
Figure IV-9 shows the same as Figure IV-8 but for the strain gages at location S4. Again the
strain gages near the bottom surface of the deck show a more clearly seen daily cycle, compared
with that near the top. The maximum strain has reached +200 and –100 microstrains. Also
note that the strains at S3 and S4 are different, due to effects of the skew angle and the
constraints. Since S3 is closer to the end of the deck slab, the skew may have more profound
influence.
The temperature and strain readings for Phase 2 of the Grove Street Bridge deck will be
presented in Section IV-3.3 Long Term Thermal and Shrinkage Behavior because much longer
time was covered to observe long term behavior.

58
-0.0004
-0.0003
-0.0002
-0.0001
0
0.0001
0.0002
0.0003
0.0004
0.0005
0 10 20 30 40 50 60
Time (hour)
Str
ain
S4 TopLongi'l
S4BottomLongi'l
S4BottomTrans.
Figure IV-9 Strains at S4 Location in Grove Street Bridge Deck
(Phase 1 Construction)
M-50 Bridge
Figures IV-10 to IV-13 show the temperature and humidity readings for the M50 bridge deck for
the first 3 to 4 days. Except the humidity in Figure IV-13, they are grouped in three figures for
S1 and S2, S3 and S4, and the environmental locations, respectively. The internal thermal
couples at S1 to S4 locations appear to show little cyclic behavior due to the environment, and
the external temperature readings exhibit some cyclic behavior largely due to weather. It
appears that this deck’s hydration process is dominant for the temperature observed, so that the
daily cycling in temperature is not clearly seen.

59
50
60
70
80
90
100
110
120
0 10 20 30 40 50 60 70 80 90
Time (hour)
Te
mp
era
ture
oF
S1 Top S1 Bottom
S2 Top S2 Bottom
Figure IV-10 Temperature in Deck for M-50 Bridge (Locations S1 and S2)
50
60
70
80
90
100
110
120
0 10 20 30 40 50 60 70 80 90
Time (hour)
Tem
pera
ture
oF
S3 Top S3 Bottom
S4 Top S4 Bottom
Figure IV-11 Temperature in Deck for M-50 Bridge (Locations S3 and S4)

60
50
60
70
80
90
100
110
120
0 10 20 30 40 50 60 70 80 90
Time (hour)
Tem
per
atu
re o
FSouth Beam Middle Beam
North Beam Undeneath
Figure IV-12 Environment Temperature for M-50 Bridge
20
30
40
50
60
70
80
90
100
0 10 20 30 40 50 60 70 80 90
Time (hour)
Rela
tive
Hu
mid
ity
(%
)
Figure IV-13 Environment Humidity for M-50 Bridge

61
Figures IV-14 to 17 shows the strain readings at the M-50 bridge deck using the strain
transducers at locations S1 through S4, respectively. The maximum strains in the M-50 bridge
deck are similar to those seen for the Grove Street Bridge, consistent with the temperature
readings shown in Figures IV-10 to 12, the strains mainly due to hydration largely reduced at
approximately 30 to 35 hours of the deck age.
-1.0E-04
-5.0E-05
0.0E+00
5.0E-05
1.0E-04
1.5E-04
2.0E-04
2.5E-04
0 10 20 30 40 50 60 70 80 90
Time (hour)
Str
ain
S1 Top Longitudinal
S1 Bottom Longitudinal
S1 Bottom Transverse
Figure IV-14 Strains at S1 Location in M-50 Bridge Deck

62
-1.0E-04
-5.0E-05
0.0E+00
5.0E-05
1.0E-04
1.5E-04
2.0E-04
2.5E-04
3.0E-04
0 10 20 30 40 50 60 70 80 90
Time (hour)
Str
ain
S2 Top Longitudinal
S2 Bottom Longitudinal
S2 Bottom Transverse
Figure IV-15 Strains at S1 Location in M-50 Bridge Deck
-1.0E-04
-5.0E-05
0.0E+00
5.0E-05
1.0E-04
1.5E-04
2.0E-04
2.5E-04
3.0E-04
0 10 20 30 40 50 60 70 80 90
Time (hour)
Str
ain
S3 Top Longitudinal
S3 Bottom Longitudinal
S3 Bottom Transverse
Figure IV-16 Strains at S3 Location in M-50 Bridge Deck

63
-1.5E-04
-1.0E-04
-5.0E-05
0.0E+00
5.0E-05
1.0E-04
1.5E-04
2.0E-04
2.5E-04
0 10 20 30 40 50 60 70 80 90
Time (hour)
Str
ain
S4 Top Longitudinal
S4 Bottom Longitudinal
S4 Bottom Transverse
Figure IV-17 Strains at S4 Location in M-50 Bridge Deck
IV-3.2 Behavior under Truck Load
In addition to monitoring temperature, strain, and humidity during the hydration and curing
process, truck load testing was carried out to determine the concrete deck’s strain response to
truck wheel loading. Test readings were taken with the truck load on and off the structure to
obtain the load response for each strain gage. The truck was driven over the bridge with one
side (i.e., one wheel line) of the truck going along the central line between two beams to
maximize the bending strain in the deck, where the strain gages were embedded.
The truck load-induced strains were recorded using an Invocon wireless data acquisition system,
as shown in Figure IV-18. The reason for the use of this system for load-induced strains is that
the Invocon system offers a much higher resolution although its memory capacity is much
smaller and not suitable for long-term data acquisition.

64
Figure IV-18 Radio-based Invocon Strain Data Acquisition System
Grove Street Bridge
Figure IV-19 A 6-Axle Truck Loading Grove Street Bridge Deck (Phase 1)
Figure IV-19 shows the truck with 6-axles used to load the Grove Street bridge deck. Before
loading, the axle weights and spacings were measured and recorded to be used in the simulation

65
analysis using the finite element method. The axle weights were 14,380, 15,700, 15,250,
11,840, 14,530, and 15,850 lbs, and the corresponding axle spacings were 12, 4.67, 9.92, 3.75,
and 4.75 ft. Figures IV-20 and IV-21 show typical strain responses of the concrete deck under
the truck load from the strain gages at locations S3 and S4. The truck was driven backward or
forward in each loading run, starting from a location off the span. The truck load path was
restricted within the length of the continuous beams (64’).
Each of these strain curves in Figures IV-20 and 21 shows accordingly six peaks corresponding
to the wheels going over the gage in the backward movement for this case. All the gages did
not experience much strain, not more than 15 microstrains. Note again that these results were
obtained using a data acquisition system with wireless (radio wave) transmission capability.
The system records very low noise and is able to pick up small signals as shown.
Figure IV-20 Strains at S3 Location in Grove Street Bridge due to Truck Load
-6
-4
-2
0
2
4
6
8
10
-70 -50 -30 -10 10 30 50
Distance from Steering Axle to S3 (ft)
Mic
ro S
tra
in
S3 Top Longi'l
S3 BottomLongi'l
S3 BottomTrans

66
-15
-10
-5
0
5
10
-70 -50 -30 -10 10 30 50
Distance from Steering Axle to S3 (ft)
Mic
ro S
tra
in
S4 TopLongi'l
S4 BottomLongi'l
S4 BottomTrans
Figure IV-21 Strains at S4 Location in Grove Street Bridge due to Truck Load
For the other half of the deck constructed in Phase 2 about a month later, a different 6-axle truck
was used to apply load. The axle weights were 18,000, 16,000, 16,000, 13,000, 13,000, and
13,000 lbs, and the axle spacings were correspondingly 12.17, 4.25, 10.17, 3.75, and 3.75 ft.
Figures IV-22 and IV-23 show strain readings at the S1 and S2 locations for a typical truck run.
The curves in each figure may be viewed as the influence lines for the strains at each respective
location. As observed in Phase 1 load test for the S3 and S4 locations, the maximum strains are
below 30 microstrains for both tension (+) and compression (-).

67
-15
-10
-5
0
5
10
15
20
-30 -20 -10 0 10 20 30 40 50 60 70 80 90
Distance from Steering Axle to S1 (ft)
Mic
ro S
tra
inS1 TopLongitudinal
S1 BottomLongitudinal
S1 BottomTransverse
Figure IV-22 Strains at S1 Location in Grove Street Bridge due to Truck Load

68
-20
-15
-10
-5
0
5
10
15
20
25
30
35
-30 -20 -10 0 10 20 30 40 50 60 70 80 90
Distance from Steering Axle to S1 (ft)
Mic
ro S
tra
inS2 TopLongitudinal
S2 BottomLongitudinal
S2 BottomTransverse
Figure IV-23 Strains at S2 Location in Grove Street Bridge due to Truck Load
M-50 Bridge
For the M-50 Bridge, a 5-axle truck was used for loading the deck, as shown in Figure IV-24.
The resulting strains from the embedded strain transducers were recorded using the same
approach as for the Grove Street Bridge. Figures IV-25 to IV-28 show the strain readings for a
typical truck run on the deck, as influence lines. The observed strains due to truck load are
relatively small, as seen for the Grove Street Bridge. They are within -10 (compression) and
+20 (tension) microstrains.

69
Figure IV-24 A 5-axle Truck Loading M-50 Bridge Deck
-15
-10
-5
0
5
10
15
-10 -5 0 5 10 15 20 25 30 35 40 45 50 55
Distance from Steering Axle to S1 (ft)
Mic
ro S
tra
in
S1 Top Longitudinal
S1 Bottom Longitudinal
S1 Bottom Transverse
Figure IV-25 Strains at S1 Location in M-50 Bridge Deck due to Truck Load

70
-15
-10
-5
0
5
10
15
20
25
-10 -5 0 5 10 15 20 25 30 35 40 45 50 55
Distance from Steering Axle to S1 (ft)
Mic
ro S
tra
in
S2 Top Longitudinal
S2 Bottom Longitudinal
S2 Bottom Transverse
Figure IV-26 Strains at S2 Location in M-50 Bridge Deck due to Truck Load
-15
-10
-5
0
5
10
15
20
25
-20 -10 0 10 20 30 40 50 60 70
Distance from Steering Axle to S3 (ft)
Mic
ro S
train
S3 Top Longitudinal
S3 Bottom Longitudinal
S3 Bottom Transverse
Figure IV-27 Strains at S3 Location in M-50 Bridge Deck due to Truck Load

71
-15
-10
-5
0
5
10
15
20
25
-20 -10 0 10 20 30 40 50 60 70
Distance from Steering Axle to S3 (ft)
Mic
ro S
train
S4 Top Longitudinal
S4 Bottom Longitudinal
S4 Bottom Transverse
Figure IV-28 Strains at S4 Location in M-50 Bridge Deck due to Truck Load
IV-3.3 Long Term Thermal and Shrinkage Behavior
Figure IV-29 shows the recorded temperature from the thermal couples in the Grove Street
bridge deck. Figure IV-30 displays the ambient temperature readings at three locations, two at
the bottom flanges of the facia beams and an internal beam in addition to one underneath the
bridge superstructure near the abutment. It is seen that the thermal couples at S1 and S2
locations show higher temperatures in the first two days, apparently due to hydration of that half
of the deck placed in Phase 2. Other temperature readings all show cycling behavior, with a
general trend downward, because the climate was becoming colder in general.

72
0
20
40
60
80
100
0
68
13
6
20
3
27
1
33
9
40
7
47
4
Time (hour)
Te
mp
era
ture
(oF
)
S1 Top
S1 Bottom
S2 Top
S2 Bottom
Figure IV -29 Temperature Readings in Grove Street Bridge Deck (Phase 2)
Figure IV-30 Ambient Temperature at Grove Street Bridge (Phase 2)
0
20
40
60
80
100
0
51
10
2
15
2
20
3
25
4
30
5
35
5
40
6
45
7
50
8
Time (hour)
Am
bie
nt
Tem
pera
ture
(OF
)
Underneath
Facia Beam
Internal Beam

73
Figures IV-31 and IV-32 show the strain readings at locations S1 and S2. The tensile strains are
in the range of about 100 microstrains. Note that the concrete in the S3 and S4 locations
completed curing about a month earlier than the S1 and S2 locations.
-0.0004
-0.0002
0
0.00020
58
11
5
17
3
23
0
28
8
34
5
40
3
46
0
51
8
Time (hour)
Str
ain
S1 TopLongitudinal
S1 BottomLongitudinal
S1 BottomTransverse
Figure IV-31 Strain Readings at S1 in Grove Street Bridge Deck (Phase 2)
-0.0008
-0.0006
-0.0004
-0.0002
0
0.0002
0
59
11
7
17
6
23
4
29
3
35
1
41
0
46
8
52
7
Time (hour)
Str
ain
S2 Top
Longitudinal
S2 Bottom
Longitudinal
S2 Bottom
Transverse
Figure IV-32 Strain Readings at S2 in Grove Street Bridge Deck (Phase 2)

74
IV-4. Discussions
It is seen that the strains induced by the truck wheel load are much lower compared with the
strains recorded in the fast strength-development stage and immediately after. It should also be
noted that a certain amount of strains are due to free thermal or shrinkage strain that do not cause
stress. In other words, the constraint that limits the thermal strain and shrinkage strain causes
stress, which may crack the concrete depending on the strength of concrete at the time.

75
CHAPTER V
BEHAVIOR OF SKEW DECKS USING FINITE ELEMENT ANALYSIS
Physical measurement of skew bridge decks can be only performed on a limited number of
structures and at a limited number of perceived critical locations. However, these
measurements are important and can be used here to calibrate numerical modeling of the
measured structures to provide validation. Finite element analysis (FEA) is considered the
most generally applicable and powerful tool for such modeling. This chapter presents the
process and the results of calibration using the measured data from the Grove Street and M-
50 bridges. Section V-1 below covers the model validation, and Section V-2 summarizes
the modeling and the results for 12 decks typical in Michigan, including 8 cases of skew
decks compared with 4 cases of straight decks. Section V-3 summarizes and discusses the
results for this chapter, in order to lead to the identification of the causes and
recommendation of possible solutions to eliminate or reduce corner cracking in skew
concrete decks.
V-1. FEA Modeling and Validation
DIANA, a 3-D FEA software program, was used in this study to perform the analysis. This
section presents the process and results for the modeling and its validation using the
measured data.

76
V-1.1 Selection of Modeling Elements
In this analysis covering thermal, shrinkage, creep, and truck wheel load effects, the 3-D solid
element CHX60 of the DIANA program is used for modeling the concrete deck and the concrete
beams, curved shell element CQ40S for the steel beams, and 3-D general potential flow element
BQ4HT for the boundaries of the concrete deck involved in heat transferring. These elements
are discussed next in more detail.
Element CHX60
CHX60 in DIANA is a 20-nodes iso-parametric solid brick element. It is based on quadratic
interpolation and Gauss integration. The basic variables in the nodes of the solid element are
the translations ux, uy, and uz in the three orthogonal local directions. The polynomial for the
translations ui (i=x, y, z) is expressed as:
2 2
0 1 2 3 4 5 6 7 8
2 2 2 2 2 2 2
9 10 11 12 13 14 15 16
2 2 2
17 18 19
( , , )i
u a a a a a a a a a
a a a a a a a a
a a a
ξ η ζ ξ η ζ ξη ηζ ξζ ξ η
ζ ξηζ ξ η ξ ζ ξη ξζ η ζ ηζ
ξ ηζ ξη ζ ξηζ
= + + + + + + + +
+ + + + + + + +
+ + +
(V-1)
Figure V-1 Definitions of Nodes and Coordinate
System for Element CHX 60

77
where ξ, η, and ζ are the coordinates of a point in the element as shown in Figure V-1.
Typically, a rectangular brick element in DIANA using polynomial approximates the strain and
stress distribution over the element volume. The normal strain and stress in the x direction vary
linearly in the x direction and quadratically in the y and z directions. The normal strain and stress
in the y direction vary linearly in the y direction and quadratically in the x and z directions. The
normal strain and stress in the z direction vary linearly in the z direction and quadratically in the
x and y directions. The stress condition of CHX60 is three-dimensional, and the loading may be
arbitrary. The CHX60’s dimensions in the three axial directions X, Y, and Z should be in the
same order of magnitude. For the bridge decks here, steel reinforcement in the deck was added
into the solid element according to the reinforcement cross section area.
Element CQ40S
Figure V-2 Displacements and Coordinate System for Curved Shell Element CQ40S

78
CQ40S is an eight-node quadrilateral iso-parametric curved shell element. It is also based on
quadratic interpolation and Gauss integration over the ξη element area. The polynomials for the
translations ui and rotations φi (i=x,y,z) can be expressed as:
(V-2)
Element BQ4HT
BQ4HT is a four-node isoparametric quadrilateral element to describe boundaries in three-dimensional
potential flow analysis. It is based on linear interpolation and Gauss integration.
V-1.2 Material Property and Behavior Modeling
Each of the bridge models is made of the above 3 types of elements. Each type has its own
material properties. The solid element CHX60 is used for modeling the concrete deck and
concrete beams. The curved shell element CQ40S is used for modeling steel beams. The
potential flow element BQ4HT is used for modeling the interface between the concrete and
surrounding environment for heat transfer.
The concrete material properties in this model are divided into two groups: structure analysis
properties and thermal analysis properties. For concrete still in the development stage, the ACI
209 model (1982) is referred to in modeling the shrinkage and creep behavior.

79
Concrete material properties for structural analysis
Concrete mechanical properties vary with time and its variation is modeled here using the ACI
formulas as follows (DIANA 2003, ACI 1982).
• Compressive strength fc(t) in psi at any time t (in day) :
28( )c c
tf t f
tα β=
+ (V-3)
where fc28 is the concrete compressive strength at 28 day in psi, α and β are model parameters
depending on cement and curing type. For example, 4.0α = and 0.85β = are used in this
study for Cement Type 1 using moist curing.
• Modulus of elasticity (Young’s Modulus):
28( )c c
tE t E
tα β=
+ (V-4)
where Ec28 is the concrete’s Young’s modulus at 28 day in psi, Ec(t) is the concrete’s Young’s
modulus at time t (in day), and α, β , and t have been defined above.
• Creep function J(t, t0) according to the ACI 209 model (1982):
0 0
1( , ) (1 ( , ))
( )c
J t t t tE t
φ= + (V-5)
where the creep coefficient 0( , )t tφ is defined as:

80
0.6
00 0.6
0
( )( , )
10 ( )u
t tt t
t tφ φ
−=
+ − (V-6)
where,
2.35u RHLA VS SL FA ACφ φ φ φ φ φ φ=
(V-7)
According to the ACI model, LAφ , RHφ , VSφ , SLφ , FAφ , and ACφ in Eq.(V-7) are correction
factors for loading age, relative humidity, volume-surface ratio, slump, fine aggregate
percentage, and air content, respectively. Their values for the two instrumented bridge decks
are given in Table V-1.
Table V-1 Values of Correction Factors in Eq.(V-7)
Grove Street Bridge 0.994 0.893 0.673 1.202 0.978 1.000
M-50 Bridge 0.994 0.768 0.673 1.202 0.978 1.072
LAφ RHφ VSφ SLφFAφ ACφ
• Total shrinkage strain at age t (in day)
( ) for moist curing ( 7 )
35 ( )( )
( ) for steam curing ( 1 )
55 ( )
ssu s
ss s
ssu s
s
t tt days
t tt t
t tt days
t t
ε
εε
−≥
+ −− =
−≥
+ −
(V-8)
where ts is the duration of initial wet curing and suε is given by

81
6(780 ) 10su RHMC VS SL FA CC ACε γ γ γ γ γ γ γ −= − × (V-9)
where MCγ , RHγ , VSγ , SLγ , FAγ , CCγ , and ACγ are correction factors for moist curing
duration, ambient relative humidity, volume-surface ratio, slump, fine aggregate percentage, and
cement content, and air content, respectively. The ambient relative humidity, concrete slump,
and concrete air content of the deck were based on measurement. The volume-surface ratio,
fine aggregate percentage, and cement content were based on the mix design. The values for the
correction factors in Eq. (V-9) are shown in Table V-2.
Table V-2 Values of Correction Factors in Eq. (V-9)
Grove Street Bridge 1.000 0.838 0.408 1.123 0.874 0.967 0.996
M-50 Bridge 1.000 0.651 0.408 1.123 0.874 0.990 1.004
MCγ RHγ VSγ SLγFAγ
CCγ ACγ
Material properties for thermal analysis
• Thermal conductivity
For 3-D heat flow analysis to model the process of concrete hydration, the concrete conductivity
k is used to measure the ability of the material to conduct heat when the heat transfer is
dependent only on the temperature gradient. The conductivity of ordinary concrete depends on
its composition and, and it ranges generally between about 0.46 and 1.16 Btu/h ft oF (Weiss
1999)

82
• Thermal capacity
Thermal capacity is defined as the amount of heat necessary to change the temperature of unit
mass (e.g., 1 lb) by unit temperature change (e.g., 1oF). The heat capacity c of concrete is little
affected by the mineralogical character of the aggregate, but is considerably increased by
increase in moisture content of the concrete. The capacity also increases with temperature and
with a decrease in the concrete density. The common range of thermal capacity for concrete is
between 0.20 and 0.28 Btu/lb F� .
• Coefficient of thermal expansion
Like most engineering materials, concrete has a positive coefficient of thermal expansion, but its
value depends both on the composition of the mix and on its hydration state at the time of the
temperature change. The influence of the mix proportions arises from the fact that the two
main constituents of concrete, hydrated cement paste and aggregate, have dissimilar thermal
coefficients , and the coefficient for the concrete matrix is a resultant of the two material
properties. The linear coefficient of thermal expansion of hydrated cement paste varies between
about 6 × 610−and 11 × 610−
per F� (Nevelle 1995). It is higher than the coefficient for
aggregate. An average linear thermal expansion coefficient of concrete may be taken as
5.5× 610−/ F� , but the range may be from about 3.2× 610−
/ F� to 7.8× 610−/ F� , depending upon
the type and quantities of the aggregates, the mixture proportions and other factors (Cook 1966).

83
• Adiabatic hydration curve
The adiabatic temperature rise measured under the thermally isolated situation is directly
proportional to the heat released on a cumulated basis, because the heat capacity can be assumed
constant due to the large volume occupied by aggregates having thermal stability.
To model heat production using DIANA, an adiabatic temperature rise curve needs to be
specified as a function of time. Suzuki et al. (1997) systematically carried out a series of
adiabatic temperature rise tests with several types of Portland cement, including early hardening
cement, ordinary cement, moderate-heat cement and binary blended cement including blast
furnace slag or fly ash and ordinary Portland cement. Three casting temperatures (50 F� ,
68 F� , 86 F� ) and three unit cement weights (41.0 lb/ft2, 61.5 lb/ft
2 and 81.9 lb/ft2) were used in
these tests. This set of results is the main source in this study to select appropriate models for
analysis.
For the Grove Street and M50 bridges, the cement used is blended cement including blast
furnace slag and fly ash and ordinary Portland cement. The curing temperature was between
50 F� and 86 F� , according to the field measurement presented earlier. So the adiabatic
temperature curve for binary blended cement is used in the FEA models. Two cases of the
adiabatic curve were used to envelope the real situation, designated as the maximum and
minimum adiabatic temperature rise, respectively, as follows in Table V-3.

84
Table V-3 Parameters Used in Adiabatic Temperature Rise Curves
Parameter Maximum adiabatic
temperature rise Minimum adiabatic
temperature rise
Initial casting temperature 86 F� 50 F�
Slag or fly ash content 81.9 lb/ft2 41.0 lb/ft
2
Properties of steel
The properties of steel also include two groups used in this study, the mechanical properties and
the thermal properties. They are largely constant for different steels. In the DIANA FEA
process used here, the properties are adopted as shown in Table V-4.
Table V-4 Steel Properties Used in DIANA Analysis
Steel Property Selected Value
Conductivity 8.67 Btu/h ft oF
Capacity 56.9 Btu/ft3 oF
Density 490 lb/ft3
Young’s Modules 29,000 ksi
Poison Ratio 0.2
Coefficient of Thermal Expansion 6.67× 610− / o
F

85
Properties of interface
As discussed earlier, the interface element BQ4HT allows the heat flux in the concrete to
interact with that of the surrounding environment. It uses one parameter, the conduction
coefficient K, to model this process. During curing, concrete is covered using wet burlap on
the top surface, plywood forms on the sides, and steel stay-in-place forms for the bottom
surface. Accordingly, the thermal conduction coefficients for these different materials are
selected as shown in Table V-5.
Table V-5 Thermal Conduction Coefficients for Boundary Conditions
Interface Material Conduction Coefficient
Steel Forms 3.30 Btu/h ft2 °F
Plywood Forms 1.03 Btu/h ft2 °F
Wet Burlap 1.76 Btu/h ft2 °F
V-1.3 Selection of Parameters for Analysis
The DIANA FEA is intended to cover the effects of thermal, shrinkage, and truck loading.
There are a number of material parameters that need to be selected for the analysis as follows.

86
Thermal conductivity of concrete
VII. Thermal capacity of concrete
VIII. Coefficient of thermal expansion of concrete
IX. Young’s modulus of concrete (28 day)
X. Poisson’s ratio of concrete
XI. Density of concrete
XII. Slump of concrete
XIII. Amount of fine aggregate
XIV. Air content in concrete
XV. Surface area in contact with ambient air
XVIII. Curing length
XIX. Curing type
XX. Ambient relative humidity
XXI. Cement content
XXII. Cement type
XXIII. Thermal conductivity of wet burlap used to cover concrete for curing
XXIV. Thermal conductivity of plywood form in contact with concrete
XXV. Thermal conductivity of steel in contact with concrete
XXVI. Adiabatic temperature rise curve
These parameters are included in the analysis to understand the behavior of concrete deck during
strength development and the service stages. If two values (or behaviors for the case of
adiabatic curves), such as a maximum and a minimum, of each of these 19 parameters are used

87
for analysis, there would be 219 = 524,288 cases to consider in the analysis program. In order to
keep the number of analysis cases practical, the following parameters were selected as constants
based on the daily concrete reports and the concrete strength reports for the two instrumented
bridge decks.
Table V-6 Properties Selected According to Concrete Test Reports
Parameter Value
Density of concrete 145 lb/ft3
Slump of concrete 5.7 in.
Fine aggregate 40.6%
Air content 5.8% for Grove Street and 6.8% for M-50
In addition, the curing length is set at 7 days as the time period in which wet burlap is used to
cover the deck, and the curing type referring to curing method is set here as moist curing in the
field using wet burlap coverage.
The surface area of concrete, ambient relative humidity, cement content, and cement type are
dependent on the bridge analyzed. They were fortunately either measured by the research team
or available via construction reports. However, there are still 6 required parameters yet to be
selected as summarized in Table V-7.

88
Table V-7 Required Parameters with Respective Estimated Rage
Concrete Parameter Range
Thermal Conductivity 0.46 and 1.16 Btu/h ft oF
Thermal Capacity 0.20 ~ 0.28 Btu/lb per oF
Coefficient of Thermal Expansion 3.22 to 7.78× 610−/ o
F
Young’s Modulus (28 day) 3,400 ~4,070 ksi
Poisson’s Ratio 0.15~0.3
Adiabatic Temperature Rise Curve Minimum Curve ~Maximum Curve
The minimum and maximum curves in Table V-7 refer to the adiabatic temperature rise curves,
respectively, to produce minimum and maximum amounts of heat in a given time period for
curing. For these six parameters, there could be still a large number of possible combinations
for their values. If only a minimum and a maximum case are used for each parameter, there
could be 64 cases to consider. In order to envelope these combinations, a perceived maximum
stress case and a minimum stress case were developed as shown in Table V-8, and used in the
FEA program in this study.

89
Table V-8 Minimum and Maximum Cases for FEA
Minimum Stress Case Maximum Stress Case
Maximum Thermal Conductivity Minimum Thermal Conductivity
Minimum Thermal Capacity Maximum Thermal Capacity
Minimum Difference in Coefficients of Thermal Expansion between
Concrete Deck and Constraining Beams
Maximum Difference in Coefficients of Thermal Expansion between Concrete
Deck and Constraining Beams
Minimum Young’s Modulus(28 day) Maximum Young’s Modulus(28 day)
Minimum Poisson’s Ratio Maximum Poisson’s Ratio
Minimum Adiabatic Temperature Curve
Maximum Adiabatic Temperature Rise Curve
V-1.4 Failure Criteria
The failure criterion refers in general to the threshold used to judge if a material has failed under
the mechanically loaded condition. For simple loading conditions such as uniaxial loading the
failure criterion is simple, such as the tensile or compressive strength. When the stress
condition is more complex, as in the concrete deck interested here, the failure criterion becomes
significantly more complicated. Therefore, a failure criterion in this report is a mathematical
model to predict or identify the failure of a material subjected to combined stresses, based on the
strength of that material measured in a uniaxial stress state.

90
A number of failure criteria have been proposed for different materials in the literature. A brief
review is provided next to cover several commonly used ones. On the other hand, which failure
criterion is most appropriate for the concretes used in the tested decks as well as the typical
decks analyzed in this study is yet unknown, until a comprehensive test program is carried out
for samples from these decks. Such a test program is expensive and is beyond the scope of this
study.
The so called Trasca criterion is a failure criterion based on maximum shear stresses. Thus, it is
also referred to as the maximum shear stress criterion and often used to predict the failure of
ductile materials. A given point in the loaded material is considered safe as long as the
maximum shear stress at that point is under the yield shear stress σy obtained from a uniaxial
tensile test. The mathematical formula for no failure is written as:
Max (|σ1 − σ2 |, |σ2 − σ3 |, |σ1 − σ3 | ) < σy
Max (|σ1 |, |σ2 |, |σ3 | ) < σy
where σ1 , σ2 , and σ3 are the three principal stresses due to the loading. For a 2-D situation, the
no failure region is given as the inside of the dotted line in Figure V-3.

91
Figure V-3 Maximum Shear and von Mises Criteria for 2-D Stress Condition
Also shown in Figure V-3 is the so called von Mises criterion often used to estimate the yield of
ductile material. Its mathematical expression for no failure is
It is seen in Figure V-3 that the maximum shear criterion is more restrictive but the difference
between the two criteria is not significant.
The maximum normal stress criterion is another failure criterion, also known as Coulomb, or
Rankine criterion, widely used for failure prediction especially for brittle materials. It states that
failure occurs when a maximum normal (principal) stress reaches either the uniaxial tension
strength σt, or the uniaxial compression strength σc. For the case of 2-D situation, the no
failure region is shown as the inside of the dotted line in Figure V-4, where another failure
criterion, known as the Mohr’s criterion, is also graphed for comparison.

92
Figure V-4 Maximum Normal Stress and Mohr’s Criteria for 2-D Stress Condition
As mentioned earlier, which failure criterion is most appropriate is unknown specifically for the
concretes used in the tested decks as well as the typical decks analyzed in this study, until a
comprehensive test program is carried out for samples from these decks. On the other hand, it
is known that the controlling parameters for appropriate failure criteria for concrete are the
principal stress and principal strains. Furthermore, the difference among available failure
criteria is not significant as seen above. Accordingly, the first principal stress (namely the
maximum tensile stress) in the concrete deck is used in this study to estimate the potential of
cracking. This is actually equivalent to the maximum normal stress criterion.
It is also worth mentioning that one should keep in mind that since the failure criterion is not a
deterministic threshold (with respect to available knowledge to the profession), whether a
concrete deck cracks or not needs to be understood on a probabilistic base as well. This
approach is used in Section V-2 when examining the analysis results and judging if the concrete
has cracked.
V-1.5 Analysis Process

93
The FEA process of the bridge deck models is divided into two steps: the transient heat flow
analysis to find the temperature distribution as a result of hydration, and the flow-stress analysis
to determine the strain and stress fields for the concrete deck. The first step produces the
temperature, maturity, shrinkage, and viscous-elasticity of the modeled concrete to be used as the
condition for the following flow-stress analysis. Finally, strain, stress, and displacement are
output as the result. As discussed above, in the second step of FEA the resulting principal stress
is used to identify cracking in the concrete deck, which can lead us to the possible causes of
cracking.
The transient heat flow analysis requires the initial condition and boundary condition to start.
The initial condition includes the initial temperature of the concrete when poured. The
boundary condition for the heat flow analysis is the ambient temperature as a function of time.
Fortunately, both were measured using the thermal couples and the temperature transmitter
embedded in the concrete or exposed to the ambient environment. Depending on the purpose
of analysis, different time step lengths may be used, and the DIANA program is restricted to a
total of 100 time steps of analysis. For example, to analyze the first hydration-intensive stage of
concrete development, a time step of 0.75 hours was used for 80 steps or the first two and a half
days (0.75 hours x 80 = 60 hours = 2.5 days).
As a result, the temperature output will be available on the element nodes and on the integration
points as functions of time. These results can then be used in the next step of flow-stress

94
analysis as input. The flow-stress analysis involves nonlinear structure analysis, taking into
account temperature effects on strains and stresses and viscous-elastic concrete material
behavior. Therefore, this step takes more computation time, and reliably predicting reality is
certainly more challenging.
V-1.6 Validation of Modeling Using Measured Responses
The validation was performed on the two instrumented bridge decks, the Grove Street bridge and
the M50 bridge, respectively. In presenting the validation results below, the concrete
development stage is discussed first, followed by the truck load test stage.
V-1.6.1 M50 Bridge Deck in Development (S02-38131)
Figures V-5 to V-12 show the comparison of the temperature results by FEA using DIANA and
measurement using the instrumentation presented in Chapter IV for the M-50 bridge. It covers
the first three and a half days, in which a significant percentage of the hydration process was
believed to have completed. This comparison uses all the available measured data for this
bridge. As discussed earlier, a number of material properties were not available so that a
minimum and a maximum value was used to try to envelope the responses. These figures
include the results using the two respective sets of perceived bounding values.

95
40
60
80
100
120
140
0.0
0.3
0.6
0.8
1.1
1.4
1.7
2.0
2.3
2.5
2.8
3.1
3.4
Time(day)
Te
mp
era
ture
(oF
)
Test Model (Max) Model (Min)
Figure V-5 Comparison for M-50 Bridge Temperature at S1 Top
40
60
80
100
120
0.0
0.2
0.4
0.6
0.8
1.0
1.2
1.4
1.6
1.8
2.0
2.2
2.4
2.6
2.8
3.0
3.2
3.4
Time(day)
Tem
per
atu
re(oF
)
Test Model (Min) Model (Max)
Figure V-6 Comparison for M-50 Bridge Temperature at S1 Bottom

96
Figure V-7 Comparison for M-50 Bridge Temperature at S2 Top
40
60
80
100
120
0.0
0.3
0.5
0.8
1.1
1.4
1.6
1.9
2.2
2.4
2.7
3.0
3.2
Time(day)
Tem
pera
ture
(o F)
Test Model (Max) Model (Min)
Figure V-8 Comparison for M-50 Bridge Temperature at S2 Bottom
40
60
80
100
120
140
0.0
0.3
0.6
0.9
1.2
1.5
1.8
2.0
2.3
2.6
2.9
3.2
Time(day)
Te
mp
era
ture
(oF
)
Test Model (Min) Model (Max)

97
40
60
80
100
120
140
0.0
0.2
0.5
0.7
0.9
1.1
1.4
1.6
1.8
2.1
2.3
2.5
2.7
3.0
3.2
3.4
Time(day)
Te
mp
era
ture
(oF
)
Test Model (Min) Model (Max)
Figure V-9 Comparison for M-50 Bridge Temperature at S3 Top
40
60
80
100
120
0.0
0.3
0.6
0.9
1.2
1.5
1.8
2.1
2.4
2.7
3.0
3.3
Time(day)
Tem
pera
ture
(oF
)
Test Model (Max) Model (Min)
Figure V-10 Comparison for M-50 Bridge Temperature at S3 Bottom

98
40
60
80
100
120
140
0.0
0.3
0.5
0.7
1.0
1.3
1.5
1.8
2.0
2.3
2.5
2.7
3.0
3.2
Time(day)
Te
mp
era
ture
(oF
)
Test Model (Min) Model (Max)
Figure V-11 Comparison for M-50 Bridge Temperature at S4 Top
40
60
80
100
120
0.0
0.2
0.4
0.6
0.8
1.0
1.3
1.5
1.7
1.9
2.1
2.3
2.5
2.7
2.9
3.1
3.3
Time(day)
Tem
pera
ture
(o F)
Test Model (max) Model (Min)
Figure V-12 Comparison for M-50 Bridge Temperature at S4 Bottom
These comparison results show that the FEA was able to produce reasonably reliable
temperatures compared with the measured results. On the other hand, for the first 2 days of
hydration, the range between the maximum and the minimum cases is relatively large and
selecting appropriate material properties may become difficult if the material at the site is not
rigorously tested. Beyond the first two days, it seems that the material property variation causes
very little variation in the concrete temperature.

99
Figures V-13 to V-24 continues this comparison for the strains for the M-50 bridge during the
same time period, obtained using FEA and physical measurement. The FEA again used the
minimum and maximum cases defined earlier to indicate a range of the response strain. As
seen, the FEA results for strain do not match with the test results as well as for the temperature,
although the minimum and maximum cases do show that the measurement results are close to or
within the range. Similarly to the temperature results, the strain results for the minimum and
maximum cases also show a more significant difference during the first two days of hydration
than the rest of time. Note also that Figures V-17 and V-20 show steady increase in strain after
1.5 days. This may be due to drifting of the strain measurement for a long period of time.

100
-0.0001
0
0.0001
0.0002
0.0003
0.0
0.3
0.6
0.9
1.2
1.5
1.8
2.1
2.4
2.7
3.0
3.3
Time(day)
Str
ain
Test Model (Min) Model (Max)
Figure V-13 Comparison for M-50 Bridge Strain at S1 Top Longitudinal
-0.0001
0
0.0001
0.0002
0.0
0.2
0.5
0.7
0.9
1.1
1.4
1.6
1.8
2.1
2.3
2.5
2.7
3.0
3.2
Time(day)
Str
ain
Test Model (Min) Model (Max)
Figure V-14 Comparison for M-50 Bridge Strain at S1 Bottom Longitudinal

101
-0.0001
0
0.0001
0.0002
0.0003
0.0
0.2
0.5
0.7
1.0
1.2
1.4
1.7
1.9
2.2
2.4
2.6
2.9
3.1
3.4
Time(day)S
tra
in
Test Model (Min) Model (Max)
Figure V-15 Comparison for M-50 Bridge Strain at S1 Bottom Transverse
-0.0001
0
0.0001
0.0002
0.0003
0.0
0.3
0.6
1.0
1.3
1.6
1.9
2.3
2.6
2.9
3.2
Time(day)
Str
ain
Test Model (Min) Model (Max)
Figure V-16 Comparison for M50 Bridge Strain at S2 Top Longitudinal

102
Figure V-17 Comparison for M-50 Bridge Strain at S2 Bottom Longitudinal
-0.0001
0
0.0001
0.0002
0.0003
0.0
0.3
0.5
0.7
1.0
1.3
1.5
1.8
2.0
2.3
2.5
2.7
3.0
3.2
Time(day)
Str
ain
Test Model (Min) Model (Max)

103
-0.0001
0
0.0001
0.0002
0.0003
0.0
0.4
0.7
1.1
1.5
1.9
2.3
2.6
3.0
3.4
Time(day)
Str
ain
Test Model (Min) Model (Max)
Figure V-18 Comparison for M-50 Bridge Strain at S2 Bottom Transverse
-0.0001
0
0.0001
0.0002
0.0003
0.0
0.2
0.5
0.7
1.0
1.2
1.4
1.7
1.9
2.2
2.4
2.6
2.9
3.1
3.4
Time(day)
Str
ain
Test Model (Min) Model (Max)
Figure V-19 Comparison for M-50 Bridge Strain at S3 Top Longitudinal

104
-0.0001
0
0.0001
0.0002
0.0
0.3
0.6
1.0
1.3
1.6
1.9
2.3
2.6
2.9
3.2
Time(day)
Str
ain
Test Model (Min) Model (Max)
Figure V-20 Comparison for M-50 Bridge Strain at S3 Bottom Longitudinal
-0.0001
0
0.0001
0.0002
0.0003
0.0
0.3
0.5
0.7
1.0
1.3
1.5
1.8
2.0
2.3
2.5
2.7
3.0
3.2
Time(day)
Str
ain
Test Model (Min) Model (Max)
Figure V-21 Comparison for M-50 Bridge Strain at S3 Bottom Transverse

105
-0.0001
0
0.0001
0.0002
0.0003
0.0
0.3
0.5
0.7
1.0
1.3
1.5
1.8
2.0
2.3
2.5
2.7
3.0
3.2
Time(day)
Str
ain
Test Model (Min) Model (Max)
Figure V-22 Comparison for M-50 Bridge Strain at S4 Top Longitudinal
-0.0001
0
0.0001
0.0002
0.0003
0.0
0.3
0.6
0.9
1.2
1.5
1.8
2.0
2.3
2.6
2.9
3.2
Time(day)
Str
ain
Test Model (Min) Model (Max)
Figure V-23 Comparison for M-50 Bridge Strain at S4 Bottom Longitudinal

106
-0.0002
-0.0001
0
0.0001
0.0002
0.0003
0.0
0.3
0.6
1.0
1.3
1.6
1.9
2.3
2.6
2.9
3.2
Time(day)
Str
ain
Test Model (Min) Model (Max)
Figure V-24 Comparison for M-50 Bridge Strain at S4 Bottom Transverse

107
V-1.6.2 Grove Street Deck in Development (S02-81063)
Figures V-25 to V-28 compares the measured and computed temperatures for the first
two and a half days of the Grove Street Bridge’s East Bound side (Phase 1). This data
acquisition period was slightly shorter than for the M-50 Bridge because the Omega Data
Logbook system had to be removed after the first two and a half days of data acquisition
to catch the opportunity of monitoring hydration process at the M-50 Bridge being
constructed then.
40
60
80
100
120
140
0.0
0.3
0.5
0.7
1.0
1.3
1.5
1.8
2.0
2.3
Time(day)
Te
mp
era
ture
(oF
)
Test Model (Max) Model (Min)
Figure V-25 Comparison for Grove Street Bridge Temperature at S3 Top

108
40
60
80
100
120
140
0.0
0.2
0.4
0.6
0.7
0.9
1.1
1.3
1.5
1.7
1.9
2.1
2.3
2.4
Time(day)
Tem
pera
ture
(oF
)
Test Model (Max) Model (Min)
Figure V-26 Comparison for Grove Street Bridge Temperature at S3 Bottom
40
60
80
100
120
140
0.0
0.2
0.4
0.7
0.9
1.1
1.3
1.5
1.8
2.0
2.2
2.4
Time(day)
Tem
per
atu
re(oF
)
Test Model (Max) Model (Min)
Figure V-27 Comparison for Grove Street Bridge Temperature at S4 Top

109
40
60
80
100
120
140
0.0
0.2
0.4
0.6
0.7
0.9
1.1
1.3
1.5
1.7
1.9
2.1
2.3
2.4
Time(day)
Te
mp
era
ture
(oF
)
Test Model (Max) Model (Min)
Figure V-28 Comparison for Grove Street Bridge Temperature at S4 Bottom
Temperature recorded at the Grove Street bridge deck exhibits more clearly the daily cycling as
seen in Chapter IV. The perceived minimum and maximum responses are able to envelope the
first one and a half days where the peak temperature was observed. Figures V-29 to V-32
show the same kind of comparison for the other half of the bridge deck poured later in Phase 2
(West Bound). Note that this half was constructed about a month later than Phase 1 and we
were able to continue monitoring the temperature and strain for about 21 days. These four
figures show that the minimum and maximum curves better envelope the measured temperature
record, compared with Figures V-25 to V-28.

110
20
40
60
80
100
120
0 2 3 5 6 8
10
11
13
14
16
18
19
21
Time(day)
Te
mp
era
ture
(oF
)
Test Model (Max) Model (Min)
Figure V-29 Comparison for Grove Street Bridge Temperature at S1 Top
20
40
60
80
100
120
0 2 3 5 7 9
10
12
14
16
17
19
21
Time(day)
Te
mp
era
ture
(oF
)
Test Model (Max) Model (Min)
Figure V-30 Comparison for Grove Street Bridge Temperature at S1 Bottom

111
20
40
60
80
100
120
0 2 3 5 7 9 10 12 14 16 17 19 21
Time(day)
Tem
per
atu
re(oF
)
Test Model (Max) Model (Min)
Figure V-31 Comparison for Grove Street Bridge Temperature at S2 Top
20
40
60
80
100
120
0 2 3 5 7 9
10
12
14
16
17
19
21
Time(day)
Te
mp
era
ture
(oF
)
Test Model (Max) Model (Min)
Figure V-32 Comparison for Grove Street Bridge Temperature at S2 Bottom

112
Figures V-33 to V-38 compare the strains in Phase 1 of the Grove Street bridge between
measurement and FEA simulation using DIANA. The measured strains are enveloped between
the maximum and minimum curves in Figures V-35 to V-38. In Figure V-35 the measured
strain appears to be drifting up with time. Figures V-39 to V-44 shows similar comparison for
strains for Phase 2 of the bridge deck. It is seen that during the first one and a half days, the
measured strains were bounded by the envelopes shown. Beyond first 2 or 3 days, the
envelopes did not do well. Also, it should be noted that the strain prediction by FEA is not as
good as the temperature prediction, because the strain computation depends on the temperature
as the input, which was discussed earlier in Section V-1.5. In addition, the strain-stress analysis
is nonlinear, thus more difficult to model and predict.
-0.0001
0
0.0001
0.0002
0.0003
0.0
0.2
0.3
0.5
0.7
0.8
1.0
1.2
1.3
1.5
1.7
1.8
2.0
2.2
2.3
Time(day)
Str
ain
Test Model (Max) Model (Min)
Figure V-33 Comparison for Grove Street Bridge Strain at S3 Top Longitudinal

113
-0.0003
-0.0002
-0.0001
0
0.0001
0.0002
0.0
0.2
0.4
0.6
0.8
1.0
1.2
1.4
1.6
1.8
2.0
2.2
2.4
Time(day)
Str
ain
Test Model (Max) Model (Min)
Figure V-34 Comparison for Grove Street Bridge Strain at S3 Bottom Longitudinal
-0.0002
0
0.0002
0.0004
0.0
0.2
0.4
0.5
0.7
0.9
1.1
1.2
1.4
1.6
1.8
1.9
2.1
2.3
Time(day)
Str
ain
Test Model (Max) Model (Min)
Figure V-35 Comparison for Grove Street Bridge Strain at S3 Bottom Transverse

114
-0.0001
0
0.0001
0.0002
0.0003
0.0
0.2
0.4
0.5
0.7
0.9
1.1
1.2
1.4
1.6
1.8
1.9
2.1
2.3
Time(day)
Str
ain
Test Model (Max) Model (Min)
Figure V-36 Comparison for Grove Street Bridge Strain at S4 Top Longitudinal
Figure V-37 Comparison for Grove Street Bridge Strain at S4 Bottom Longitudinal
-0 .0001
0.0000
0.0001
0.0002
0.0003
0.0 0.5 1.0 1.5 2.0 2.5
Tim e(day)
Str
ain
Test M odel (M ax) M odel (M in )

115
-0.0002
0
0.0002
0.0004
0.0
0.2
0.5
0.7
0.9
1.1
1.4
1.6
1.8
2.1
2.3
Time(day)
Str
ain
Test Model (Max) Model (Min)
Figure V-38 Comparison for Grove Street Bridge Strain at S4 Bottom Transverse
Figure V-39 Comparison for Grove Street Bridge Strain at S1 Top Longitudinal
-0.0003
-0.0002
-0.0001
0
0.0001
0.0002
0 2 3 5 7 9
10
12
14
16
17
19
21
Time(day)
Str
ain
Test Model (Max) Model (Min)

116
Figure V-40 Comparison for Grove Street Bridge Strain at S1 Bottom Longitudinal
Figure V-41 Comparison for Grove Street Bridge Strain at S1 Bottom Transverse
-0.0002
-0.0001
0.0000
0.0001
0.0002
0 1 2 3 4 5 6 8 9
10
11
12
13
14
15
16
17
18
19
20
21
Time(day)
Str
ain
Test Model (Max) Model (Min)
-0.0004
-0.0003
-0.0002
-0.0001
0
0.0001
0.0002
0.0003
0 1 2 4 5 6 7 8 9
11
12
13
14
15
16
18
19
20
21
Time(day)
Str
ain
Test Model (Max) Model (Min)

117
Figure V-42 Comparison for Grove Street Bridge Strain at S2 Top Longitudinal
Figure V-43 Comparison for Grove Street Bridge Strain at S2 Bottom Longitudinal
-0.0004
-0.0003
-0.0002
-0.0001
0
0.0001
0.0002
0.0003
0 1 2 4 5 6 7 9
10
11
12
14
15
16
17
18
20
21
Time(day)
Str
ain
Test Model (Max) Model (Min)
- 0. 0004
- 0. 0002
0
0. 0002
0 2 4 6 8 10 12 14 16 18 20 22
Time(day)
Str
ain
Test Model (Max) Model (Min)

118
Figure V-44 Comparison for Grove Street Bridge Strain at S2 Bottom Transverse
V-1.6.3 Truck Load Test for Grove Street Bridge (S02-81063) and M50 Bridge (S02-38131)
The DIANA FEA models were also used to simulate the truck load tests performed on the two
bridge decks. The comparison of the computed and measured strain for the Grove Street Bridge
is shown in Figures V-45 to V-50 for the 6 strain gages in Phase 1 at locations S3 and S4. The
computed strains are indicated as points marked with small triangles, and the measured strains
are shown as continuous lines formed with filled diamond shapes with a higher resolution,
because more data points were acquired and plotted here.
-0.0008
-0.0006
-0.0004
-0.0002
0
0.0002
0.0004
0 1 2 4 5 6 7 8
10
11
12
13
14
15
17
18
19
20
21
Time(day)
Str
ain
Test Model (Max) Model (Min)

119
-8-6-4-20246
-50
-43
-35
-28
-20
-13 -5 2 9
17
24
32
39
47
Distance from Steering Axle to S3 (ft)
Mic
ros
tra
in
Test
Model
Figure V-45 Comparison of Truck Load Response for Grove Street Bridge S3 Top Longitudinal
Figure V-46 Comparison of Truck Load Response for Grove Street Bridge S3 Bottom Longitudinal
-4-202468
10
-50
-43
-37
-30
-24
-17
-10 -4 3 9
16
23
29
36
42
49
Distance from Steering Axle to S3 (ft)
Mic
ros
tra
in Test
Model

120
Figure V-47 Comparison of Truck Load Response for Grove Street Bridge S3 Bottom Transverse
-14
-12
-10
-8
-6
-4
-2
0
2
-77
-64
-51
-39
-26
-13 0
13
25
38
Distance from Steering Axle to S4 (ft)
Mic
ros
tra
in
Test
Model
Figure V-48 Comparison of Truck Load Response for Grove Street Bridge S4 Top Longitudinal
02468
1012
-34
-31
-27
-23
-20
-16
-12 -8 -5 -1 3 6
10
14
18
21
Distance from Steering Axle to S3 (ft)
Mic
ros
tra
in
Test
Model
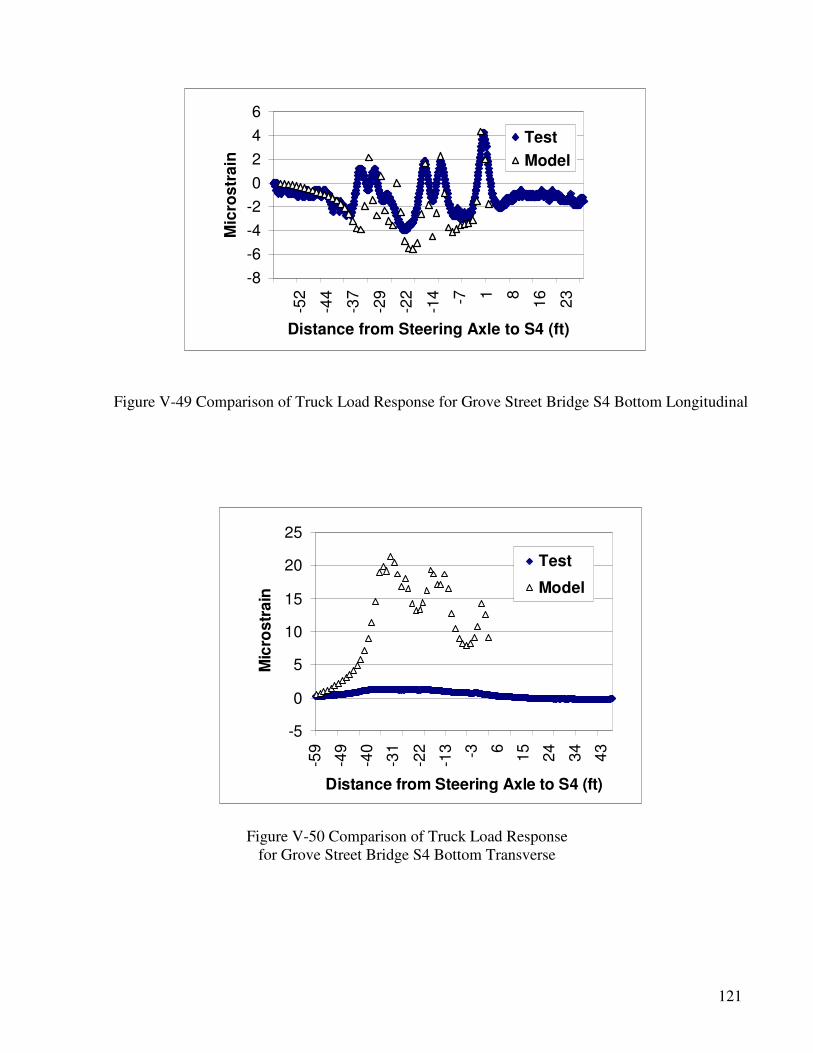
121
Figure V-49 Comparison of Truck Load Response for Grove Street Bridge S4 Bottom Longitudinal
-5
0
5
10
15
20
25
-59
-49
-40
-31
-22
-13 -3 6
15
24
34
43
Distance from Steering Axle to S4 (ft)
Mic
ros
tra
in
Test
Model
Figure V-50 Comparison of Truck Load Response for Grove Street Bridge S4 Bottom Transverse
-8
-6
-4
-2
0
2
4
6
-52
-44
-37
-29
-22
-14 -7 1 8
16
23
Distance from Steering Axle to S4 (ft)
Mic
ros
tra
in
Test
Model

122
In addition, these figures display longer data lines than the computed values, because the FEA
model did not include the approach slab before the analyzed bridge span, nor the other spans
beyond the first pin-and-hanger where measured data were also collected. The load was applied
using a 6-axle truck as shown in Figure V-51, with axle weights of 14380, 15700, 15250, 11840,
14530, and 15850 lbs and spacing of 12, 4.67, 9.92, 3.75, and 4.75 ft.
Figure V-51 6-axle Truck for Loading Grove Street Bridge Phase 1 (S3 and S4)
These comparison results show that the FEA model was able to produce reliable results
compared with measured results for truck loading, except for the transverse bottom strains in the
two locations. It has not been concluded exactly what factors have contributed to the large
discrepancy between the measured and FEA calculated strains. One possible factor is that some
of the strain gages’ locations were moved from where intended during the process of concrete
placement. This could result in inconsistency between the reality and the computer simulated
condition. Another possible factor is that the truck wheels did follow the marked line for direct
loading the instrumented locations.
12.0’ 4.67’9.92’ 4.75’ 3.75’
14380 l
b
15700 l
b
15250 l
b
11840 l
b
14530 l
b
15850 l
b

123
Error!
Bookmark not defined.
Figure V-52 6-axle Truck for Loading Grove Street Bridge Phase 2 (S1 and S3)
For Phase 2 (West Bound half) of the Grove Street bridge, load testing was performed about a
month after Phase 1 construction was completed. A different 6-axle truck shown in Figure V-52
was used to load the deck, with axle weights of 18,000, 16,000, 16,000, 13,000, 13,000, and
13,000 lbs, and axle spacing of 12.17, 4.25, 10.17, 3.75, and 3.75 ft. Comparison of the
measured strains and FEA computed strains is shown below in Figures V-53 to V-58. These
figures all show good agreement between the measured and calculated strains. The bottom
transverse strains are also predicted well, which were not so well predicted for the Phase 1 gages.
12.17’ 4.25’10.17’ 3.75’ 3.75’
18000 l
b
16000 l
b
16000 l
b
13000 l
b
13000 l
b
13000 l
b
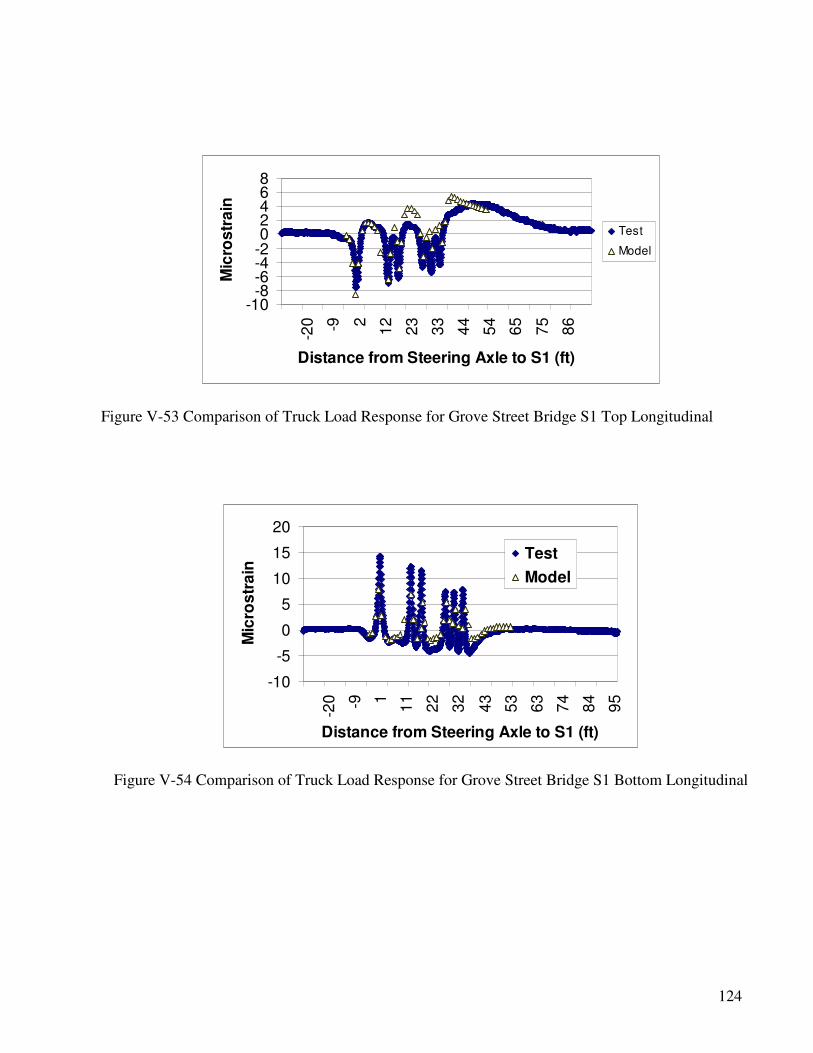
124
-10-8-6-4-202468
-20 -9 2
12
23
33
44
54
65
75
86
Distance from Steering Axle to S1 (ft)
Mic
ros
tra
inTest
Model
Figure V-53 Comparison of Truck Load Response for Grove Street Bridge S1 Top Longitudinal
-10
-5
0
5
10
15
20
-20 -9 1
11
22
32
43
53
63
74
84
95
Distance from Steering Axle to S1 (ft)
Mic
ros
tra
in
Test
Model
Figure V-54 Comparison of Truck Load Response for Grove Street Bridge S1 Bottom Longitudinal

125
-4
0
4
8
12
16
-21
-11 -1 8
18
27
37
46
56
65
75
Distance from Steering Axle to S1 (ft)
Mic
ros
tra
in
Test
Model
Figure V-55 Comparison of Truck Load Response for Grove Street Bridge S1 Bottom Transverse
-20
-15
-10
-5
0
5
-49
-39
-29
-19 -9 1
11
21
31
41
51
61
Distance from Steering Axle to S2 (ft)
Mic
ros
tra
in
Test
Model
Figure V-56 Comparison of Truck Load Response for Grove Street Bridge S2 Top Longitudinal

126
-10
-5
0
5
10
15
-47
-36
-24
-13 -1 10
22
33
45
56
Distance from Steering Axle to S2 (ft)
Mic
ros
tra
in
Test
Model
Figure V-57 Comparison of Truck Load Response for Grove Street Bridge S2 Bottom Longitudinal
-505
101520253035
-39
-20 0
19
39
58
Distance from Steering Axle
to S2 (ft)
Mic
ros
tra
in
Test
Model
Figure V-58 Comparison of Truck Load Response for Grove Street Bridge S2 Bottom
Transverse
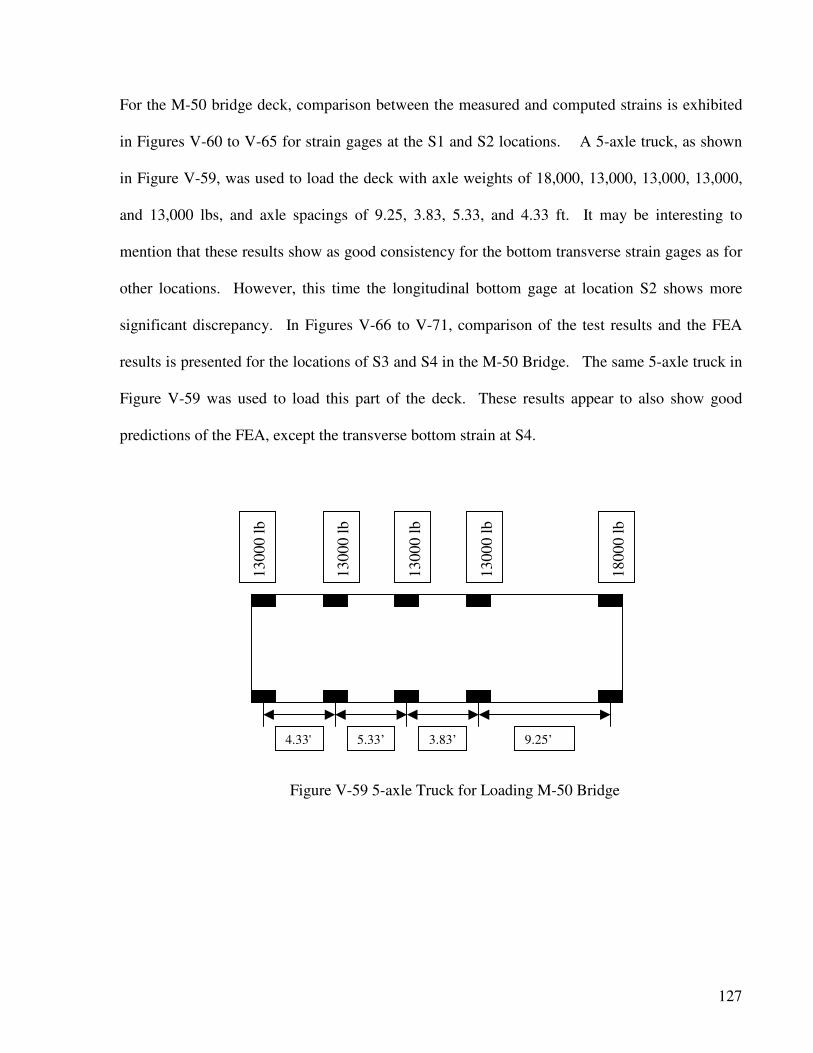
127
For the M-50 bridge deck, comparison between the measured and computed strains is exhibited
in Figures V-60 to V-65 for strain gages at the S1 and S2 locations. A 5-axle truck, as shown
in Figure V-59, was used to load the deck with axle weights of 18,000, 13,000, 13,000, 13,000,
and 13,000 lbs, and axle spacings of 9.25, 3.83, 5.33, and 4.33 ft. It may be interesting to
mention that these results show as good consistency for the bottom transverse strain gages as for
other locations. However, this time the longitudinal bottom gage at location S2 shows more
significant discrepancy. In Figures V-66 to V-71, comparison of the test results and the FEA
results is presented for the locations of S3 and S4 in the M-50 Bridge. The same 5-axle truck in
Figure V-59 was used to load this part of the deck. These results appear to also show good
predictions of the FEA, except the transverse bottom strain at S4.
Figure V-59 5-axle Truck for Loading M-50 Bridge
9.25’ 3.83’4.33' 5.33’
18000 l
b
13000 l
b
13000 l
b
13000 l
b
13000 l
b

128
Error! Bookmark not defined.
Figure V-60 Comparison of Truck Load Response for M-50 Bridge S1 Top Longitudinal
-10
-5
0
5
10
15
-31
-26
-21
-16
-11 -6 -1 4
10
15
20
25
30
Distance from Steering Axle to S1 (ft)
Mic
ros
tra
in
Test
Model
Figure V-61 Comparison of Truck Load Response for M-50 Bridge S1 Bottom Longitudinal
-12-10
-8
-6-4-2
0
2
-30
-25
-20
-15
-10 -5 0 5
10
15
20
25
30
34
Distance from Steering Axle to S1 (ft)
Mic
rostr
ain
Test
Model

129
-5
0
5
10
15
20
-31
-26
-20
-14 -8 -3 3 9
15
20
26
32
Distance from Steering Axle to S1 (ft)
Mic
ro
str
ain Test
Model
Figure V-62 Comparison of Truck Load Response for M-50 Bridge S1 Bottom Transverse
-10
-8
-6
-4
-2
0
2
-38
-31
-24
-16 -9 -2 5
12
20
27
34
Distance from Steering Axle to S2 (ft)
Mic
ros
tra
in
Test
Model
Figure V-63 Comparison of Truck Load Response for M-50 Bridge S2 Top Longitudinal

130
-6
-4
-2
0
2
-37
-29
-22
-14 -6 1 9
16
24
31
Distance from Steering Axle to S2 (ft)
Mic
ros
tra
in
Test
Model
Figure V-64 Comparison of Truck Load Response for M-50 Bridge S2 Bottom Longitudinal
-4
0
4
8
12
16
-36
-28
-20
-13 -5 3
11
19
27
35
Distance from Steering Axle to S2 (ft)
Mic
ros
tra
in Test
Model
Figure V-65 Comparison of Truck Load Response for M-50 Bridge S2 Bottom Transverse

131
-6
-4
-2
0
2
-59
-51
-43
-35
-27
-19
-11 -3 5
13
21
Distance from Steering Axle to S3 (ft)
Mic
ros
tra
in
Test
Model
Figure V-66 Comparison of Truck Load Response for M-50 Bridge S3 Top Longitudinal
-8
-6
-4
-2
0
2
4
6
-58
-50
-42
-34
-27
-19
-11 -3 5
12
20
28
Distance from Steering Axle to S3 (ft)
Mic
ros
tra
in
Test
Model
Figure V-67 Comparison of Truck Load Response for M-50 Bridge S3 Bottom Longitudinal

132
-4
0
4
8
12
16
-60
-51
-42
-34
-25
-16 -7 1
10
19
28
Distance from Steering Axle to S3 (ft)
Mic
ros
tra
in
Test
Model
Figure V-68 Comparison of Truck Load Response for M-50 Bridge S3 Bottom Transverse
-10
-8
-6
-4
-2
0
2
-40
-35
-29
-23
-17
-11 -5 1 7
13
18
24
Distance from Steering Axle to S4 (ft)
Mic
ros
tra
in
Test
Model
Figure V-69 Comparison of Truck Load Response for M-50 Bridge S4 Top Longitudinal

133
-10-8-6-4-20246
-40
-34
-27
-21
-14 -8 -1 5
12
18
25
31
38
44
Distance from Steering Axle to S4 (ft)
Mic
ros
tra
inTest
Model
Figure V-70 Comparison of Truck Load Response for M-50 Bridge S4 Bottom Longitudinal
-5
0
5
10
15
20
25
-42
-37
-31
-26
-21
-15
-10 -4 1 7
12
18
23
29
Distance from Steering Axle to S4 (ft)
Mic
ros
tra
in Test
Model
Figure V-71 Comparison of Truck Load Response for M-50 Bridge S4 Bottom Transverse
V-2. Analysis of Typical Skew Decks in Michigan
Upon completion of the model validation above, the FEA using DIANA was applied to 12 cases
of concrete bridge decks. These cases included two superstructure arrangements (steel and

134
prestressed I-beams) with composite deck, three skew angles (0o, 30o, and 45o), and two beam
spacings (6’ and 10’). All possible combinations of these three sets of the parameter values
result in the 12 cases. To limit the scope of work, these cases have one simply supported span
length of 70 ft. Typical diaphragms at the span ends are also included, but for simplicity
without loss of reliability the barriers are not included in the models. While this sample still
represents a small section of possible designs for Michigan, it was felt that they could envelope a
large majority of situations that are typical in Michigan.
Figures V-72 and V-73 show the cross section of the steel bridges for 10’ and 6’ beam spacings,
respectively. Figures V-74 and V-75 show the prestressed I-beam counterparts. The simply
supported condition was modeled using no constraint to the horizontal translations at one end of
the span and hinge at the other end that is constrained in all three orthogonal directions. These
generic spans were designed according to the current design specifications for MDOT
(AASHTO 2002), to be consistent with current practice. To focus on the deck and its relation to
the supporting beams, the barriers or guide rails are ignored in the FEA models.

135
Figure V-72 Cross Section of Generic Steel Bridge
with a 9” Concrete Deck on 10’ Beam Spacing
Figure V-73 Cross Section of Generic Steel Bridge with a 9” Concrete Deck on 6’ Beam Spacing

136
Figure V-74 Cross Section of Generic Prestressed I-Beam Bridge with a 9” Concrete Deck on 10’ Beam Spacing
Figure V-75 Cross Section of Generic Prestressed I- Beam Bridge
with a 9” Concrete Deck on 6’ Beam Spacing

137
Table V-9 shows a summary of the FEA results for these 12 cases of typical bridge decks, with
respect to the maximum principal stresses during the first three days. The input parameters
discussed in Section V-1.3 are used to produce these results. These maximum values are found
to occur usually between 0.8 to 1.2 days, according to the FEA. They appear in the deck end
areas and close to the bottom surface. These areas connect the deck to a beam, end diaphragm
(end back wall), or both. It is seen that these stress levels well exceed the concrete’s cracking
strength. With an estimated 400 psi cracking strength at 28 days, the cracking strength at 1 day
can be as low as 100 psi. It is also seen that for the 8 skew deck cases (either 30 or 45 degrees),
the maximum principal stress is generally higher than the straight counterparts, highlighting the
effect of skew angle.

138
Table V-9 Maximum Computed Hydration-Induced Thermal Stresses in Concrete Decks Typical
in Michigan (psi) (with the upper bound case designated as Max and lower bound case as Min)
6 ft beam spacing (steel beam) 10 ft beam spacing (steel beam)
Min 509 Min 329 0 o
Max 886
0o
Max 568
Min 656 Min 693 30 o
Max 1451
30 o
Max 1569
Min 711 Min 719 45 o
Max 1596
45 o
Max 1596
6 ft beam spacing (concrete beam)
10 ft beam spacing (concrete beam)
Min 582 Min 540 0 o
Max 764
0 o
Max 840
Min 606 Min 635 30 o
Max 953
30 o
Max 1265
Min 690 Min 686 45 o
Max 1024
45 o
Max 1407
Figure V-76 shows the directions of the principal stresses on the deck top for the Grove Street
bridge, which is typical for other decks analyzed. Note that these directions are seen following
lines along the deck edge or the support line for the superstructure. Thus, cracks in this situation
would appear perpendicular to the principal stress directions or the edge line. For comparison, a
deck crack photograph for the Grove Street bridge is shown in Figure V-77. These cracks are
seen consistent with the maximum principal stress directions found by FEA.

139
As also seen in Figure V-76, the absolutely maximum principal stresses occur at locations near
the end of the deck. These principal stresses are larger at locations directly above the beams
than between the beams. It appears that these larger stresses are caused by the constraint
imposed by the beams during hydration.
For comparison, Table V-10 shows the maximum principal stresses in the same 12 decks due to
a standard truck wheel load of 16 kips. It is seen that these stresses are much lower than those
in the hydration stage. In addition, the concrete deck’s strength is much higher at the time when
truck loads are applied compared with early strengths. Therefore, it appears to be clear that
initiation of skew deck corner cracking is not due to truck load. On the other hand, truck loads
may result in more visible cracks due to fatigue of a cracked deck.
Table V-10 Maximum Computed Truck Wheel Load-induced Stresses (psi) in Concrete Decks
Typical in Michigan
Steel Beam Steel Beam Prestressed Beam Prestressed Beam
Beam Spacing 6ft 10ft 6ft 10ft
Skew (degree)
0 36 42 63 51
30 41 42 69 52
45 41 42 72 54

140
V-3. Discussions
This chapter has presented the process and results of the FEA using DIANA in this project. The
modeling practice was first calibrated using two skew bridge decks constructed in Michigan,
instrumented with strain, humidity, and temperature sensors. The calibration used the measured
data from the processes of truck loading after hardening and thermal and shrinkage loading
during concrete hydration. It is seen that the truck loading-induced stress is much lower than
that caused in concrete hydration.
In addition, further analysis has shown that skew decks may develop much higher stresses than
their straight counterparts.
It is thus concluded that cracking in skew concrete decks is mainly caused by thermal and
shrinkage loading in concrete hydration. On the other hand, it should be noted that truck wheel
load may form a fatigue loading that can gradually make cracking much more visible with time
(Matsui 1985, Perdikaris 1993, Fu et al 2003).

141
Figure V-76 Grove Street Bridge Principal Stress Directions on Deck Top
(Lines for tensile and diamonds for compressive principal stresses)
Figure V-77 Grove Street Bridge Deck Corner Cracking Observed Perpendicular to Deck Edge (Modeled in Figure V-76)

142
CHAPTER VI DISCUSSIONS AND RECOMMENDATIONS
As presented and discussed in Chapter V, skew deck corner cracking can be concluded as caused
by large strain and stress generated due to thermal and shrinkage loading in the process of
concrete hydration development. On the other hand, cracking can be made more visible by
truck wheel loads.
VI-1. Recommended Cures for Skew Deck Corner Cracking
There appears to be several possible approaches that may be used to reduce the strain and stress
in the concrete during the strength development stage. The stress and strain are mainly caused
by the constraints to the deck induced by the beams and diaphragms (end walls). These
approaches are listed and discussed below.
1) Reduction or relaxation of constraint. Changing the composite deck configuration to a non-
composite or less composite one can be an option. At the end of a span, reducing the rigidity of
the end diaphragm or backwall can reduce the constraint as well. For example, the concrete end
diaphragm may be replaced by steel bracings for steel beam spans if this will not affect other
considerations. For concrete bridges, smaller end diaphragms should be considered to reduce
the stiffness of the constraint to the deck. In the case of backwall encasing the bean ends, the
stiffness of the backwall should be minimized if possible.

143
2) Optimizing the ingredients in the concrete mix to reduce the potential of cracking, by reducing
the heat to be generated in a short period of time and the tendency of shrinkage. One option is
to change the type of cement used. However, since this study did not include testing for
possibly optional mixes, it is not appropriate to recommend any quantitative changes, although
this appears to be the most effective approach without requiring other things to change that may
significantly change current practice.
3) Increasing the amount of steel reinforcement in the acute angle corner areas and the end areas
of skewed decks, to reduce the stress in the concrete deck. These areas will benefit from such
reinforcement in the direction along the skew for potential cracking perpendicular to it.
Specifically, additional reinforcement along the deck edge (i.e., along the beam support line) is
recommended over one beam spacing in the longitudinal direction, with a spacing of 4” in both
top and bottom layers. To minimize possible complexity in construction, the top and bottom
additional rebar sizes can be respectively the same as those regularly designed. This additional
steel is recommended for those decks exceeding the skew threshold (25 degrees according to the
AASHTO LRFD design specifications 2004, Article 9.7.13).

144
VI-2. Recommended Future Research Work
It also should be noted that this study has used an approach of calibrated numerical modeling and
diagnosing, with limited physical testing. The approach was applied to a limited number of
cases (12). In addition, a number of important parameters in the model were estimated using the
general knowledge not necessarily specific for the tested decks. To fully understand the
phenomenon and quantitatively prescribe the solution to the problem, more detailed analysis is
required, and more physical testing to determine those important parameters will be very helpful.
In a future study, the following items deserve more attention and further investigation.
1) Improved understanding and better data for the parameters used in FEA modeling, especially
where the minimum stress case and the maximum stress case do not envelope the test results.
2) Identification of potentially optimal mixes that have lower cracking potential than those
concretes being used in current bridge deck construction practice. Experiment with these mixes
in the laboratory condition to select candidates for field trial.
3) Further investigation of the recommended options above for reducing or eliminating deck
corner cracking, using physical testing and computer simulation.
VI-3. Implementation Considerations
Based on the scope of this research project, the recommendation for additional steel
reinforcement in the skew deck end area can be implemented with minimal effort. It is thus
recommended that this recommendation be reviewed by design engineers. When the design is
145
finalized, a number of skew bridge decks (for example three decks) should be selected for
experimental application. After concrete is placed for each of these decks, the deck should be
inspected at ages of 7 days, 28 days, 2 months, and 6 months to detect cracking and record its
pattern if any. These results should be used to determine whether the additional steel design is
effective or needs any improvement.
VI-4. Cost- Benefit Analysis
The recommended additional steel is to reduce or eliminate corner cracking in skewed concrete
bridge decks. This section presents an exercise of cost – benefit analysis based on estimation.
Assuming that, on average, the recommended additional steel is to cover an equivalent length
approximately equal to one fifth of the deck span length (one beam spacing long on each end).
Since the entire width will be covered using the additional steel, the additional cost for this steel
is estimated at 20% of the total reinforcement cost for the span ($8/ft2) or $1.60/ft2. The unit
cost $8/ft2 was obtained based on the MDOT 2007 price report. Let us further assume that this
steel will reduce cracking so that the average deck life to first overlay is to be extended by about
15% (using a 6-year increase for a life to first overlay of 40 years). Therefore the potential
benefit is estimated as 15% of average total deck cost of $24.86/ft2 equal to $3.73ft2, with the
total deck cost estimated according to the MDOT 2007 price report. Thus the cost/benefit ratio
can be estimated at $1.60/$3.73 = 0.43. This represents a net benefit for the recommendation to
be implemented.

146
REFERENCES
AASHTO “Standard Specifications for Highway Bridges” 17th Ed. 2002, Washington D.C.
AASHTO “LRFD Bridge Design Specifications”, 4th Ed, 2007, Washington, DC
Abel, J., Moore, W. P., and Associates Hover, K., (1998) “Effect of Water-Cement Ratio on the Early Age Tensile Strength of Concrete” TRB Annual Meeting practical papers ACI 209 Prediction of Creep, Shrinkage, and Temperature Effects in Concrete Structures. Tech. Rep. ACI 209R-82, American Concrete Institute, 1982 ACI Committee 224, 224.IR-84, (1984) "Causes, Evaluation and Repair of Cracks in Concrete" ACI Manual of Concrete Practice, American Concrete Institute, Detroit, Michigan
ACI Committee 308, (Revised 1986) "Standard Practice for Curing Concrete" ACI Manual of
Concrete Practice, American Concrete Institute, Detroit, Michigan, ACI 308-81 Aktan, H., Fu, G., Attanayaka, U., and Dekelbab, W. “Investigate Causes and Develop Methods to Minimize Early-age Deck Cracking on Michigan Bridge Decks” Final Report to Michigan Department of Transportation, Wayne State University, 2003 Allan, M. L., (1995) “Probability of Corrosion Induced Cracking in Reinforced Concrete” Cement and concrete Research, Vol. 25, No. 6, pp.1179-1190
Almusallam, A. A., (2001) “Effect of Environmental Conditions on the Properties of Fresh and Hardened Concrete” Cement and Concrete Composites, Vol. 23, pp. 353 Babaei, K. and Fouladgar, A. M., (1997) “Solutions to Concrete Bridge Deck Cracking” Concrete International, Vol. 19, No. 7, pp. 34.
Babaei, K. and Hawkins, N. M., (1987) "Evaluation of Bridge Deck Protective Strategies" NCHRP Report 297, Transportation Research Board, National Research Council, Washington, D.C. Berke, N. S. and Roberts, L. R., (1989) “Use of Concrete Admixtures to Provide Long-Term Durability from Steel Corrosion” ACI SP 119-20, pp.384-403
Bolander, J.E. and Le, B.D., (1999) “Modeling Crack Development in Reinforced Concrete Structures Under Service Loading” Journal of Construction and Building Materials
Borrowman, P. E., Seeber, K. E., and Kesler, C. E., (1977) “Behavior of Shrinkage-Compensating Concretes Suitable for use in Bridge Decks” Department of Theoretical and
Applied Mechanics, University of Illinois, Urbana, Illinois, T. and A.M. Report No. 416
147
Boulware, B. L. and Nelson, B. H., (November 1979) “Factors Affecting the Durability of Concrete Bridge Decks: Shrinkage Compensated Cement Concrete in Bridge Deck-Interim Report No. 5” California Department of Transportation, FHWA/CA/SD-79/18
Burke, M. P. Jr., (1999) “Cracking of Concrete Decks and Other Problems with Integral-type Bridges” Transportation Research Record, pp. 131
Cady, P. D. and Carrier, R. E., (1971) “Final Report on Durability of Bridge Deck-concrete-Part 2: Moisture Content of Bridge Decks” Department of Civil Engineering, Pennsylvania State University
Cady, P. D., Carrier, R. E., Bakr, T., and Theisen, J., (1971) “Final Report on the Durability of Bridge Decks-Part 1: Effect of Construction Practices on Durability” Department of Civil
Engineering, Pennsylvania State University
Campbell-Allen, D. and Lau, B., (1978) “Cracks in Concrete Bridge Decks” University of
Sydney School of Civil Engineering, Research Report R313
Carlson, R. W., (June 1940) “Attempts to Measure the Cracking Tendency of Concrete” Journal
of the ACI, Vol. 36, No. 6, pp.533-540
Castaneda, D.E. “Causes of Mechanical Damage to Alabama Bridge Decks” Report to Alabama Department of Transportation, 1995 Cheng, T. T. and Johnston, D. W., (June 1985) “Incidence Assessment of Transverse Cracking in Bridge Decks: Construction and Material Considerations” North Carolina State University, Department of Civil Engineering, Raleigh, North Carolina, FHWA/NC/85-002 Vol. 1
Committee on the Comparative Costs of Rock Salt and Calcium Magnesium Acetate (CMA) for Highway Deicing, (1991) “Highway Deicing Comparing Salt and Calcium Magnesium Acetate” NCHRP Special Report 235, Transportation Research Board Cook,H.K. “Thermal Properties” Significance of Tests and Properties of Concrete and Concrete-making Materials, 1966 Coutinho, A. de S., (December 1959) “The Influence of the Type of Cement on its Cracking Tendency” Rilem, New Series No. 5
Cusick, R. W. and Kesler, C. E., (1980) ”Behavior of Shrinkage Compensating Concretes Suitable for Use in Bridge Decks" American Concrete Institute, Detroit, Michigan, ACISP 64-15, pp.293-310
Dakhil, F. H., Cady, P. D., and Carrier, R. E., (August 1975) "Cracking of Fresh Concrete as Related to Reinforcement" Journal of the ACI, pp. 421-428 DIANA User’s Manual: Material Library, 2003

148
Dry, C. M., (1999) “Repair and Prevention of Damage Due to Transverse Shrinkage Cracks in Bridge Decks” Proceedings of SPIE - The International Society for Optical Engineering, Vol. 3671, pp. 253
Ebeido, T., and Kennedy J., “Shear and Reaction Distributions in Continuous Skew Composite Bridges” J. J. Bridge Eng. 1996, Vol. 1, No. 4, pp. 155-165
Feng, J. “Reinforced Concrete Bridge Deck Fatigue Under Truck Wheel Load” PhD dissertation, Department of Civil and Environmental Engineering, Wayne State University, 2004
Fouad, F. H. and Furr, H. L., (1986) "Behavior of Portland Cement Mortar in Flexure at Early Ages" ACI SP 9-5-6, American Concrete Institute, Detroit, Michigan, pp. 93-113
Freidin, C., (2001) “Effect of Aggregate on Shrinkage Crack-Resistance of Steam Cured Concrete” Magazine of Concrete Research, Vol. 53, pp. 85
French, C., Eppers, L., Le, Q., and Hajjar, J., (1998) “Transverse Cracking in Bridge Decks” TRB Annual Meeting practical papers
Fu, G., J. Feng, W. Dekelbab, F. Moses, H. Cohen, D. Mertz, and P. Thompson “Effect of Truck Weight on Bridge Network Costs”, NCHRP Report 495 (Project 12-51), Department of Civil and Environmental Engineering, Wayne State University, 2003
Fu, G., S. Alampalli, and F. P. Pezze "Lightly Reinforced Concrete Bridge Deck Slabs on Steel Stringers: A Summary of Field Experience", Final Report on R142 to FHWA, FHWA/NY/RR-94/161, Engineering Research and Development Bureau, New York State Department of Transportation, June 1994
Furr, H. L. and Fouad, F. H., (1982) "Effect of Moving Traffic on Fresh Concrete During Bridge-Deck Widening." Transportation Research Record 860, pp. 28-36
Furtak, K., (1999) “Assessment of Crack State in RC Slabs of Composite Bridges” Archives of
Civil Engineering, Vol. 45, pp. 59 Gilbert, R. I., (March-April 1992) "Shrinkage Cracking in Fully Restrained Concrete Members" ACI Structural Journal, Vol. 89, No. 2, pp. 141-149 Hansen, T. C. and Mattock, A. H., (February 1966) "Influence of Size and Shape of Member on the Shrinkage and Creep of Concrete" Journal of the ACI, Vol. 63 [Also PCA Development
Department Bulletin D103, Portland Cement Association]

149
Hanson, J. A., Elstner, R. C., and Clore, R. H., (1973) "The Role of Shrinkage Compensating Cement in Reduction of Cracking of Concrete" American Concrete Institute, Detroit, Michigan, ACI SP 38-12, pp. 251-271 Healy, R. J. and Lawrie, R. A. (1998) “Bridge Cracking: A Dot Experience and Perspective” Concrete International, Vol. 20, No. 9, pp. 37-40
Holt, E.E. and Janssen, D. J., (1998) “Influence of Early Age Volume Changes on Long-Term Concrete Shrinkage” TRB Annual Meeting practical papers
Horn, M. W., Stewart, C. F., and Boulware, R. L., (1972) “Factors Affecting the Durability of Concrete Bridge Decks: Normal vs. Thickened Deck-Interim Report No. 3” Bridge Department, California Division of Highways, CA-HY-4101-3-72-11
Horn, M. W., Stewart, C. F., and Boulware, R. L., (1972) “Webber Creek Deck Crack Study-Final Report.” State of California, Business and Transportation Agency, Department of Public Works, in Cooperation with the FHWA, Research Report CA-HWY-BD-624102 (2)-72-2
Horn M. W., Stewart, C. F., and Boulware R. L., (March 1975) “Factors Affecting the Durability of Concrete Bridge Decks.” Construction Practices-Interim Report No. 4. Bridge Department, California Division of Highways, CA-DOT-ST-4104-4-75-3
Hue, F., Serrano, G., and Bolano, J. A., (2000) “Oresund Bridge Temperature and Cracking Control of the Deck Slab Concrete at Early Ages” Automation in Construction, Vol. 9, pp. 437
Irwin, R. J. and Chamberlin, W. P., (September 1981) "Performance of Bridge Decks with 3-inch Design Cover" New York State Department of Transportation, Report No FHWA/NY/RR-81/93
Issa, M. A., (1999) “Investigation of Cracking in Concrete Bridge Decks at Early Ages” Journal
of Bridge Engineering, pp. 116 Issa, M.A., Yousif, A.A., and Issa, M.A., (August 2000) “Effect of Construction Loads and Vibrations on New Concrete Bridge Decks” Journal of Bridge Engineering
Jauregui, D.V., (2001)” A Field-Testing System for Experimental Bridge Evaluation” Experimental Techniques, Vol. 25, pp.37
Jovall, O., (2001) “Avoiding Early Age Cracking.” Concrete Engineering International, Vol. 5, pp. 41
Khaloo, A., and Mirzabozorg, H., “Load Distribution Factors in Simply Supported Skew Bridges.” J. Bridge Eng. Vol. 8, No. 4, pp241-244, 2003

150
Kosel, H. C. and Michois, K. A., (January 1985) “Evaluation of Concrete Deck Cracking for Selected Bridge Deck Structures of the Ohio Turnpike, Report to Ohio Turnpike Commission” Construction Technology Laboratories (CTL)
Kraii, P., (September 1985) "A Proposed Test to Determine the Cracking Potential Due to Drying Shrinkage of Concrete" Concrete Construction, Vol. 30, No. 9, pp. 775-779 Krauss, P. D. and Rogalla, E.A, (1996) “Transverse Cracking in Newly Constructed Bridge Decks” NCHRP Report No. 380. Washington, D.C.
Ksomatka, S. H. and Panarese, W. C., (1990) “Design and Control of Concrete Mixtures” Thirteenth edition, Portland Cement Association
Kumaat, E. and Lorrain, M., (1996) “Cracking of Plain or Reinforced High Performance Concrete Slabs” International Journal of Structures, Vol. 16, pp. 1
Kwak, H. G., Seo, Y. J., and Jung, C. M., (2000) “Effects of the Slab Casting Sequences and the Drying Shrinkage of Concrete Slabs on the Short-Term and Long-Term Behavior of Composite Steel Box Girder Bridges. Part 2” Engineering Structures, Vol. 22, pp. 1467
Kwak, H. G., and Seo, Y. J., (2002) “Shrinkage Cracking at Interior Supports of Continuous Pre-Cast Pre-Stressed Concrete Girder Bridges” Construction and Building Materials, Vol. 16, pp. 35
La Fraugh, R. W. and Perenchio, W. F., (October 1989) “Phase Ι Report of Bridge Deck Cracking Study West Seattle Bridge” Wiss, Janney, Elstner Associates, Report No. 890716
Lebet, J. P. and Ducret, J.M., (1998) “Experimental and Theoretical Study of the Behavior of Composite Bridges During Construction” Proceedings of the 1998 2nd World Conference on
Steel in Construction, Journal of Constructional Steel Research Lerch, W., (February 1957) "Plastic Shrinkage" Journal of the ACI, Vol. 53, No. 2, pp. 803-802 Lower. D. O., (1980) "Summary Report on Type K Shrinkage-Compensating Concrete Bridge Deck Installations in the State of Ohio" American Concrete Institute, Detroit, Michigan, ACI SP 64-10, pp. 181-192 Maleki, S. “Deck Modeling for Seismic Analysis of Skewed Slab-girder Bridges” Engineering Structures, 24, pp1315–1326, 2002 Manning, D. G., (December 1981) “Effect of Traffic-Induced Vibrations on Bridge Deck Repairs" NCHRP Synthesis 86, Transportation Research Board, National Research Council Washington, D.C. Mendelson, A. Plasticity: Theory and Application. Second Edition 1970

151
McDonald, J. E., (1992) "The Potential for Cracking of Silica-Fume Concrete" Concrete
Construction Meyers, C., (1982) "Survey of Cracking on Underside of Classes B-1 and B-2 Concrete Bridge Decks in District 4" Investigation 82-2, Missouri Highway and Transportation Department, Division of Materials and Research
Nevelle, A. M. Properties of Concrete, 4th Ed, 1995
Newmark, N. M., Siess, C. P., and Penman, R. R. “Studies of Slab and Beam Highway Bridges, Part I Tests of Simple Span Right I- Beam Bridges”, University of Illinois Bulletin, Vol. 43, No.42. 1946
Newmark, N. M., Siess, C. P., and Peckham, R. M. “Studies of Slab and Beam Highway Bridges, Part II Tests of Simple Span Skew I-Beam Bridges”, University of Illinois Bulletin Series, No.375. 1947 Nishida, N., Ushioda, K., Dobashi, Y., and Matsui, K., (1995) “Evaluation of Thermal cracking Index in Slab-Concrete Under Uncertain Parameters” Transactions of the Japan Concrete
Institute, Vol. 17, pp. 127 Ohama, Y., Demura, K., Satoh, Y., Tachibana, K., and Miyazaki, Y., (1989) “Development of Admixtures for Highly Durable Concrete” ACI SP 119-17, pp. 321-342
Ottosen, N. S. “A Failure Criterion for Concrete” ASCE Journal of the Engineering Mechanics Division, Vol.103, EM4, pp. 527-535, 1977
Perfetti, G. R., Johnson. D. W., and Bingham, W. L., (June 1985) “Incidence Assessment of Transverse Cracking in Concrete Bridge Decks” Structural Consideration, FHWA/NC/85-002 Vol. 2
Perragaux, G. R. and Brewster, D. R., (June 1992) "In-Service Performance of Epoxy-Coated Steel Reinforcement in Bridge Decks-Final Report" New York State Dept. of Transportation Technical Report 92-3
Pettersson, D. and Thelandersson, S., (2001) “Crack Development in Concrete Structures Due to Imposed Strains - Part I: Modelling” Materials and Structures/Material Constructions, Vol. 34, pp. 7
Phillips, M.V., Ramey, G.E., and Pittman, D.W., (November 1997) “Bridge Deck Construction Using Type K cement” Journal of Bridge engineering
Popovic, P., Rewerts, T. L., and Sheahen, D. J., (January 1988) “Deck Cracking Investigation of the Hope Memorial Bridge” Ohio Department of Transportation

152
Portland Cement Association, (1970) Final Report-Durability of Concrete Bridge Deck--A Co-operative Study
Purvis, R. L., (1989) “Prevention of Cracks in Concrete Bridge Decks” Wilbur Smith Associates, Report on Work in Progress Purvis, R. L. and Babaei, K., (1995) “Premature Cracking of Concrete Bridges: Causes and Method of Prevention” Conference Proceedings 7, Vol. 1, pp. 163-175
Ramey, G. E., Stallings, J. M., and Oliver, R. S., (1999) “Cracking Damage/Deterioration and Rehabilitation Considerations of Some Birmingham, Alabama, Interstate Bridge Decks” Transportation Research Record, pp. 33
Randall, F. A., (1980) "Field Study of Shrinkage Compensating Cement Concrete" American
Concrete Institute, Detroit, Michigan, ACI SP 64-13, pp. 239-257
Rawi, R. S. A. and Kheder, G. F., (July-August 1990) "Control of Cracking Due to Volume Change in Base-Restrained Concrete Members" ACI Structural Journal, Vol. 87, No. 4, pp. 397-405
Reis, E. E., Jr., Mozer, J. D., Bianchini, A. C., and Kesler, C.E., (1964)” Causes and Control of Cracking in Concrete Reinforced with High Strength Steel Bars-A Review of Research.” T. &
A.M. Report No. 261, Department of Theoretical and Applied Mechanics, University of Illinois, Urbana, Illinois Rhodes, C. C., (1950) “Curing Concrete Pavements with Membranes” Journal of the ACI, Vol. 57, No. 12, pp. 277-295
Russell, H. G., (1980) "Performance of Shrinkage-Compensating Concretes in Slabs" American
Concrete Institute, Detroit, Michigan, ACI SP 65-6, pp. 81-114
Schmitt, T.R and Dawin, D., (February 1999) “Effect of Material Properties on Cracking in Bridge Decks” Journal of Bridge Engineering
Shah, S. P., Weiss, W. J., and Yang, W., (1998)” Shrinkage Cracking - Can It Be Prevented?” Concrete International, Vol. 20, pp. 51 Shah, S. P., Marikunte, S., Yang, W., and Aldea, C., (1996) “Control of Cracking with Shrinkage-Reducing Admixtures” Transportation Research Record, pp. 25
Shi, Z.; Nakano, M., (2001) “Application of a 3-D Crack Analysis Model to RC Cantilever Decks of Excessive Cracking” Structural Engineering and Mechanics, Vol. 12, pp.377

153
Spellman, D. L., Woodstrom, J. H., and Baily, S. N., (June 1973) “Evaluation of Shrinkage Compensated Cement” Materials and Research Department, California Division of Highways, CA-HY-MR-5216-1-73-15
Stewart, C. F. and Gunderson, B. J., (November 1969) “ Factors Affecting the Durability of Concrete Bridge Decks-Interim Report #2” Report by the Research and Development Section of the Bridge Department, State of California Suh, Y. and McCullough, B. F., (1994) “Factors Affecting Crack Width of Continuously Reinforced Concrete Pavement” Transportation Research Record, pp. 134
Tindal, T. T. and Yoo, C. H. “Thermal Effects on Skewed Steel Highway Bridges and Bearing Orientation”, ASCE Journal of Bridge Engineering, Vol. 8, No. 2, March 1, 2003. Van der Veen, C., Koenders, E. A. B., and Kaptijn, N., (1996) “Thermal Cracking in a Cantilever Bridge Made of HSC” Computing in Civil Engineering (New York), pp. 892 Wang, Q., Zhang, T., and Zhao, G., (2001) “Analysis of Biaxial Bending of Reinforced Concrete Slabs with Simply Support Under Concentrated Loads” Journal of Dalian University of
Technology, Dalian Ligong Daxue Xuebao, Vol. 41, pp. 481 Weiss,W.J. Prediction of Early-age Shrinkage Cracking in Concrete Elements, 1999