Embed Size (px)
Citation preview

Fire and Paramedic Services Optimization Final Report
Department of Community Safety
April 2017

Fire Optimization Report
Fire and Paramedic Optimization Report
Page 13
INTRODUCTION
What you will learn in this section:
Following the adoption of the Emergency Services Strategic and Tactical Plans, in August
2015 Council directed staff to prepare a report on the optimization of Fire and
Paramedic Services and a goal of achieving a One City One Service delivery model for
Greater Sudbury.
Five guiding principles form the foundation of the Optimization Plan and are related to
the need to balance the three pillars of service, risk and cost associated with the delivery
of emergency services.
Paramedic and Fire Services fall under the responsibility of the Department of
Community Safety and aims to protect the people, property, infrastructure, economy and
reputation of the City of Greater Sudbury.
Background
Greater Sudbury is the largest city in northern Ontario, the largest municipality by area (3,627km2) in
Ontario, and the 29th largest in population (160,000 people)1 in Canada. The city is also home to more
than 4,000 businesses who employ at least one staff person according to the latest Canadian Business
Patterns report (June 2016), with an additional 7,000 self-employed businesses (without paid staff).
The City of Greater Sudbury was formed on January 1, 2001, with the amalgamation of the communities
which comprised the former Regional Municipality of Sudbury. Sudbury, Capreol, Nickel Centre,
Onaping Falls, Rayside-Balfour, Valley East and Walden, as well as many unincorporated townships
became part of Greater Sudbury as recommended by the Report to the Minister of Municipal Affairs and
Housing on Local Government Reform for Sudbury (November 1999).
With the amalgamation of all of these communities, Greater Sudbury Fire Services inherited seven
separate fire service delivery models that provided various service models of fire suppression,
emergency rescue and medical assistance response to the community. Since that time, there has been
very little change made to the way fire services are delivered to the entire community under the
amalgamated, single-service delivery model.
In 2000, just prior to amalgamation, land ambulance services were transferred to municipalities from
the Ontario government on a 50/50 cost sharing basis with the Ministry of Health and Long-Term Care
(MOHLTC) continuing to play a regulatory role through the Ambulance Act, regulations and provincial
standards.
1 Statistics Canada. (2011). Population and Dwelling Count Highlight Tables, 2011 Census. Retreived February 20, 2017 from Statistics Canada:
http://www12.statcan.gc.ca/census-recensement/2011/dp-pd/hlt-fst/pd-pl/Table-
Tableau.cfm?LANG=Eng&T=301&SR=1&S=3&O=D&RPP=50&PR=0&CMA=0

Fire and Paramedic Optimization Report
Page 14
Since assumption, the City of Greater Sudbury established a performance-based paramedic service
model focused on a higher quality, reasonably-priced service. Paramedic Services have been
continuously improving and optimizing their service delivery in Greater Sudbury since 2000.
One City One Service
As noted above, unlike Paramedic Services, Fire Services has seen minimal growth or adjustments in
service since amalgamation. Several reports and studies have been commissioned and written related to
the delivery of fire services in the community that provide information and recommendations on how to
move forward more strategically. In particular, over the last several years as it became clear that more
efficient operations could be achieved. A Master Fire Plan was completed with the assistance of the IBI
(consultant) Group in 2003, a Fire Fleet Rationalization Study was prepared by Fire Protection Survey
Services in December 2010, and in March 2014 the IBI Group was again contracted to prepare a
Comprehensive Fire Services Review. Each of these studies attempted to identify how to improve fire
service delivery within the City of Greater Sudbury, however, there was a need to look at the model of
emergency services in totality to better provide context and more effectively frame recommendations
for Council’s consideration in moving forward.
In June 2011, following the consolidation of Fire, Paramedic and Emergency Management services into
the City’s Emergency Services department (now the Community Safety department), a high level review
of the needs and capabilities of the department was undertaken, resulting in 38 recommendations.
These were the foundation for the Emergency Services Strategic Plan, which was adopted by Council in
August 2014 and identified the need to optimize resources with a vision towards a One City, One Service
approach to the delivery of Fire and Paramedic Services in Greater Sudbury. Identified as a business
principle in the Emergency Services Strategic Plan, the One City, One Service model is described as
follows:
Resources are allocated based on the overall Council priority, risk assessment and collective needs.
Deployment and service models are based on getting the right resources to the right call, and those services that can provide the greatest opportunity for the best outcome.
The operations model for Fire Suppression and Paramedic Services must give consideration to response time/coverage capabilities balanced with approved staffing levels.
A seamless Emergency Service response model will be applied when responding to emergency service requests.
In August 2014, the Emergency Services Strategic Plan and IBI Group Comprehensive Fire Services
Review were presented to Council through the Community Services Committee where the Strategic Plan
was adopted through resolution. These plans identified the need to optimize resources and a resolution
was passed by the committee in August 2015 to optimize Fire Services and prepare a report. Then, in
February 2016, Council amended the original motion to include Paramedic Services and directed staff to
prepare a report on the optimization of fire and paramedic services, stations and service levels via the
following resolution:
Fire and Paramedic Optimization Report
Page 15
“That the City of Greater Sudbury direct staff to bring a report back to a Council meeting in
October 2016 regarding the optimization of Fire and Emergency Medical Services, stations and
man power/service levels, in line with the Emergency Services Tactical Plan adopted by Council in
2014.”
The deadline to submit the report was ultimately extended to the first quarter of 2017 following an
update to Council in September 2016.
What is Optimization?
The Merriam Webster Dictionary defines optimization as: “an act, process or methodology of making
something (as a design, system or decision) as fully perfect, functional or effective as possible”2. When
considering Fire and Paramedic Services Optimization, it is important to assess the ability to meet
desired service levels and their associated costs and the ability to effectively respond to the risks within
the community. To be effective, leadership must align the delivery of services with the strategic
direction of Council, and the expectations of the public. Of prime importance is a One City, One Service
approach to service delivery, which is highlighted by an underlying set of guiding principles that identify
the priorities in relation to service, cost and risk.
Guiding Principles
The Emergency Services Strategic Plan 2014-2020 outlines three strategic business principles: Value for
Money, One City, One Service, and One Team. The following guiding principles have arisen from this
strategic plan. These principles offer a basis for establishing effective service plans that build public trust
and confidence. The five guiding principles are:
A service-based approach to planning and delivering fire and paramedic services to achieve a
consistent level of service and response throughout the city
Responsive, long-term decision-making for a service delivery model that aligns actual costs and
taxation
Standardize response criteria to align with community needs and risks
Minimize risk to staff, the public, property and municipality by maintaining meaningful
participating, competent, skilled responders
Protect the City of Greater Sudbury’s economy and reputation
These principles also offer an approach for testing ideas that inform judgments about what an optimized
service looks like.
Three Pillars of the Optimization Review – Service, Risk and Cost
When City Council initiated the project to study the optimization of Fire and Paramedic Services, a series
of concerns existed which needed to be addressed.
2 Optimization. 2017. In Merriam-Webster.com. Retrieved March 6, 2017 from https://www.merriam-webster.com/dictionary/optimization

Fire and Paramedic Optimization Report
Page 16
These concerns had been defined and categorized as a result of the several reports and studies of the
services done since amalgamation, by the Office of the Fire Marshal, staff and several consultants.
Service level disparities resulting in gaps that manifest themselves as community risks along with
overarching funding shortfalls were all noted by prior studies.
Within this report, service is focused on the provision of what stakeholders, Council and the public
expect from their Fire and Paramedic Services. Public services work best when they are technically
capable of achieving their objectives and meet stakeholder expectations. A stakeholder in the public
service can represent many different groups, from the person who calls 911 for service, to the employee
whose business experiences an emergency that threatens its ability to continue operations, to the
taxpayers whose funds provide the means of paying for the service. The different groups can have
unique and sometimes conflicting expectations. Nonetheless, choices about how the service works, how
much it costs and who pays are all important considerations.
The Office of the Fire Marshal defines risk as, “a measure of the probability and consequence of an
adverse effect to health, property, organization, environment or community as a result of an event,
activity or operation.” Furthermore, the National Fire Protection Association, which is responsible for
developing principles in fire operations, indicates:
“a fundamental concept of Fire risk is associated with modern society. Public fire service
organizations are expected to reduce the risk within their areas of jurisdiction by taking measures to
prevent the outbreak of fires, limit the extent and severity of fires, provide for the removal or rescue
of endangered persons, control and extinguish fires that occur within the jurisdiction, and perform
other emergency response operations and delivery of EMS.” (NFPA Standard 1710 A.1.2.1.)
All of this to say that risk mitigation is at the heart of any effective emergency service.
The last of the three pillars is of keen interest to all community members. In evaluating service delivery
costs, both the current service costs as well as future costs must undergo an analysis. This can be
complex. Costs are the direct and indirect financial expenditures associated with running the service
(salaries and benefits for staff, and facility and equipment costs) and can also include predicted future
expenditures, for example, if emergency services staff experience lost time injuries in the line of duty.
While taxation is not necessarily related to cost, this report also includes an analysis of the current area-
rated taxation model with an eye toward a fair taxation model to better support both current and future
fire service delivery costs. Finally, insurance rates, which are important to not only the city resident but
also the business owner and some industry corporate entities, were evaluated. Although these rates are
not necessarily associated with cost, they can be a related outcome of the level of investment in the
department.
All decisions about public services involve choices about how to best manage service, risk and cost. For
example, a reduction of service, while leading to an initial reduction in cost, can have a subsequent
increase in risk. There is the potential that if risk is realized, the costs will be far greater than the original
cost it would have taken to properly provide the service in the first place.

Fire and Paramedic Optimization Report
Page 17
The Process/Analysis Method
An evidence-based approach was used for this review. Evidence based research involves identification
and definition of a problem, compilation and analysis of data, development and testing of possibilities,
and arrival at a conclusion.
A comprehensive team of staff was established to complete the optimization project. The work included
reviewing existing reports on the state of the Fire and Paramedic Services in Greater Sudbury, along with
analysis of similar reports from comparator municipalities.
Data was collected and analyzed with support from the Geographic Information Surveys and Mapping,
Finance and Tax departments. The age, condition, maintenance and life cycle of the existing stations
and major pieces of equipment/vehicles were also assessed from a compliance perspective in relation to
legislative requirements.
In developing different options, industry experts were consulted, and City systems were analyzed. The
Fire Underwriter’s Survey (FUS), a national third party organization, was engaged to update the Public
Fire Protection Classification (PFPC), and Dwelling Protection Grade (DPG) ratings (See Appendix #R1).
These ratings are used by the insurance industry to establish fire insurance rates for residents and
businesses within the community. The full extent of FUS will be detailed further within this document
however in this context, expected service delivery models for both Fire Services and Paramedic Services
were reviewed based on pertinent dedicated legislation, supporting legislation, standard setting bodies
and industry best practices.
An initial Community Risk Profile was completed in order to assess the hazards present in the
community. A station location analysis was included to address the expectations of FUS, major
stakeholders, City Council and the public. Additionally, station location recommendations were
designed to maximize response to identified community risks, improve overall response coverage based
on Municipal Property Assessment Corporation (MPAC) valuation, and comply with legislative
requirements, standards and best-practices.
An Enterprise Risk Assessment (See Appendices #R2 and #R3) was also undertaken in conjunction with
the City of Greater Sudbury Auditor General’s Office to identify the ongoing business continuity risk for
both Fire and Paramedic Services, and to ensure that any recommended improvements would serve to
address them.
Operations in other comparable municipalities were reviewed and some visited, while various local
stakeholder groups were engaged to identify additional challenges, and consider solutions and potential
outcomes. This included an assessment of the expectations and delivery of response by career,
composite and volunteer fire stations.
A series of Emergency Services Committee (ESC) reports were generated to outline the progress of the
project, and to inform City Council and the public of the current service delivery models. As well, in the
interest of transparency and accountability, an overhaul and update of the Fire Services website was
completed to inform the public. Paramedic Services is currently undergoing a review and update of
their website which is expected to be completed in the coming months.

Fire and Paramedic Optimization Report
Page 18
From a process perspective, engagement with various stakeholder groups (Council, union groups, staff,
public, media and other) was undertaken to educate and inform on Fire and Paramedic Services as a
whole, as well as to provide an update on the Optimization Project. For local union groups this
engagement was taken one step further through the use of consultation sessions where comments and
written submissions for input was sought. Questions were asked but no written input was received.
Who is Emergency Services?
In brief, Paramedic Services protect people, while Fire Services generally protect property,
infrastructure, and economy. Overall, both services along with Emergency Management aim to protect
the city’s reputation. As an essential public safety service responsible for citizens, visitors, businesses,
industries and infrastructure, Fire and Paramedic Services is overseen by the City of Greater Sudbury’s
General Manager of Community Safety /Chief of Fire and Paramedic Services. All emergency
preparedness, prevention, education and response not within the purview of Greater Sudbury Police
Services is provided to the City of Greater Sudbury by this department. In support of this service, the
Community Safety department also includes the Emergency Management Division and the Strategic and
Business Services Division. Oversight of the department as a whole is completed through members of
the Chief’s office which consists of an Executive Assistant, an Administrative Assistant, the Executive
Deputy Chief of Fire and Paramedic Services and the Manager of Strategic and Business Services. Daily
operations of the individual divisions of Fire and Paramedic Services are overseen by two deputy chiefs
per division. A detailed functional organizational chart providing a high level overview of the
responsibility and function of the department is shown below.

Fire and Paramedic Optimization Report
Page 19
Greater Sudbury Fire and Paramedic Services maintains over 600 employees in the provision of emergency medical, fire, technical rescue and hazardous material (HAZMat) response to the citizens and infrastructure of the community. Emergency resource allocation is based on a number of factors including departmental recommendation, Council priority, risk assessment and community need. Service and deployment models are centered on getting the right resources to the right location, within an appropriate response time.
Paramedic Services
Paramedic Services is responsible for the provision of primary and advanced medical care to ill and
injured persons to, from, and between medical treatment facilities. Greater Sudbury Paramedic Services
employs 170 full and part-time employees which include:
97 full-time and 46 part-time Paramedics,
four full-time Platoon Superintendents (supervisors),
seven full-time and six part-time Logistical staff,
two Platoon Trainers,
four Professional Standards (two non-union, two unionized) staff, and
five front-line non-union personnel.
All of these employees perform a vital function in the delivery of emergency medical response to not
only the over 160,000 citizens, but also an average of over 1.1 million annual visitors to the city. All
unionized staff within Paramedic Services, including paramedics, are represented by the Canadian Union
of Public Employees (CUPE) Local 4705 Inside Unit. This unit also represents municipal workers who
perform office, clerical, technical, leisure programming, transit, library, museum and social services
work.
Paramedic Services operates 31 front-line ambulances and emergency response vehicles out of 11
stations, while responding to over 30,000 calls per year. Of the 11 stations throughout the city, eight
are cohabitated with Fire Services (See Appendix #M1). The operating budget for Paramedics Services in
2016 was $21.3 million, of which 50% is currently funded through a grant from the provincial
government (See Appendix #F1).
Paramedic Services evolved out of the former city and Regional Municipality of Sudbury, but for
different reasons than Fire Services. A brief history of Paramedic Services within the City of Greater
Sudbury reveals the following:
1960s Ambulance service provided by Funeral Homes
1969 Ambulance service provided by Sudbury General Hospital as the MOHLTC
continues an attempt to standardize provincial ambulance services
1979 Ambulance service provided by private operators

Fire and Paramedic Optimization Report
Page 20
1996 Ambulance attendants trained to defibrillate patients in cardiac arrest and to
administer six new symptom relief medications to patients with specific
emergency medical conditions
1998 Ontario Prehospital Advanced Life Support Study (OPALS) results in Advanced
Care Paramedics in Sudbury
2000 Province transferred responsibility of land ambulance to the municipality on a
50/50 cost sharing basis
Despite the transfer of land ambulance services to the municipal level, the provincial government has
maintained responsibility for setting legislation and standards relating to ambulance services as well as
maintaining full control of ambulance dispatch.
Since 2000, Paramedic Services has been optimizing operations in an effort to ensure consistent and
reliable delivery throughout the city, utilizing a performance-based service. Many novel and innovative
programs have been implemented within the city through Paramedic Services, including the Care
Transition and Health Promotions and Community Paramedicine pilot programs. Paramedic Services has
also developed and implemented two diversion programs: one for mental health and the other for
addictions, which are unique programs within the province. Optimization presents further opportunities
expected to enhance Paramedic Service delivery.
Fire Services
Fire Services is responsible for delivering what is known as the Three Lines of Defense: public fire safety
education, fire safety standards and enforcement (fire prevention) and emergency response (fire
suppression). In the provision of these services, Greater Sudbury Fire Services employs 129 full-time
employees including:
104 career firefighters,
four Platoon Chiefs
nine fire prevention services personnel,
four training personnel,
three fleet services personnel, and
five management personnel.
The longstanding compliment of career (full-time) firefighters is represented by the International
Association of Fire Fighters (IAFF) as Sudbury Professional Fire Fighters Association (SPFFA) Local 527.
There are also approximately 260 volunteer firefighters who recently engaged in a relationship with the
Christian Labour Association of Canada (CLAC) as Local 920 of the Eastern Ontario Volunteer Firefighters
in 2013.
Fire and Paramedic Optimization Report
Page 21
Fire Services provides protection to approximately 64,000 properties in the City of Greater Sudbury,
which have an assessment value of nearly $18.5 billion, based on the 2015 MPAC taxation year (see
Appendix #T1). In addition, Fire Services protects the fixed infrastructure assets such as roads and
bridges, the possessions of the residents and commercial and industrial businesses in the community,
and residents from natural and human-made disasters. Two of the often overlooked duties of the Fire
Service are fire safety education to the most vulnerable community citizens, and the code enforcement
of residential, commercial, assembly and industrial buildings in the city. This is a vital service in the
protection of the citizens and visitors to the city.
Operating a fleet of 73 front-line fire trucks and the associated major equipment out of 24 fire stations,
Fire Services responds to nearly 4,500 calls per year. As noted previously, eight of the 24 stations
throughout the Greater City are cohabitated with Paramedic Services (See Appendix #M1). The
operating budget for Fire Services in 2016 was $24.3 million, all of which is reflected wholly on the
municipal tax levy (See Appendix #F1).
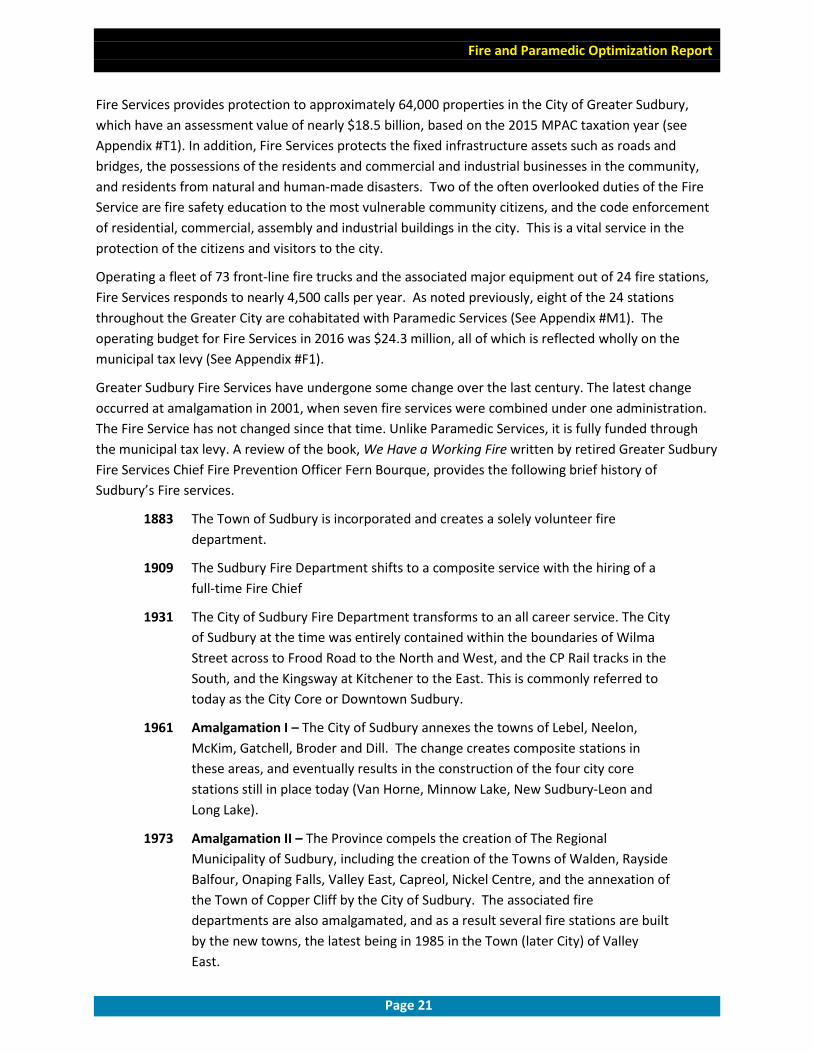
Greater Sudbury Fire Services have undergone some change over the last century. The latest change
occurred at amalgamation in 2001, when seven fire services were combined under one administration.
The Fire Service has not changed since that time. Unlike Paramedic Services, it is fully funded through
the municipal tax levy. A review of the book, We Have a Working Fire written by retired Greater Sudbury
Fire Services Chief Fire Prevention Officer Fern Bourque, provides the following brief history of
Sudbury’s Fire services.
1883 The Town of Sudbury is incorporated and creates a solely volunteer fire
department.
1909 The Sudbury Fire Department shifts to a composite service with the hiring of a
full-time Fire Chief
1931 The City of Sudbury Fire Department transforms to an all career service. The City
of Sudbury at the time was entirely contained within the boundaries of Wilma
Street across to Frood Road to the North and West, and the CP Rail tracks in the
South, and the Kingsway at Kitchener to the East. This is commonly referred to
today as the City Core or Downtown Sudbury.
1961 Amalgamation I – The City of Sudbury annexes the towns of Lebel, Neelon,
McKim, Gatchell, Broder and Dill. The change creates composite stations in
these areas, and eventually results in the construction of the four city core
stations still in place today (Van Horne, Minnow Lake, New Sudbury-Leon and
Long Lake).
1973 Amalgamation II – The Province compels the creation of The Regional
Municipality of Sudbury, including the creation of the Towns of Walden, Rayside
Balfour, Onaping Falls, Valley East, Capreol, Nickel Centre, and the annexation of
the Town of Copper Cliff by the City of Sudbury. The associated fire
departments are also amalgamated, and as a result several fire stations are built
by the new towns, the latest being in 1985 in the Town (later City) of Valley
East.

Fire and Paramedic Optimization Report
Page 22
2001 Amalgamation III – The Province once again compels the amalgamation of the
City of Sudbury with the Regional Municipality of Sudbury, and several other
towns. As a result, the seven fire services then in existence were combined
under one administration.
2017 Today – The Fire Service continues to operate from the same stations and with
the same service model as at amalgamation. The service operates as a
municipal responsibility and is fully funded by the municipal tax levy.
Key takeaways of this section:
- A One City One Service delivery model aims to provide a seamless response model that
fairly allocates resources based on Council priority, risk assessment and collective needs
of the city when responding to emergency service requests.
- Optimization is making something as fully perfect, functional or effective as possible. It
is not just about cutting costs, but creating efficiencies and highest achievable
performance.
- This plan aims to create a balance of service, risk and cost that fits the needs of the
community as a whole.
- An enormous collection of data has been reviewed, analyzed, modeled and tested to
create a highly interconnected system that protects the safety of the community.

Fire and Paramedic Optimization Report
Page 23
Introduction to Risk
As noted earlier, the three pillars of service, risk and cost are the foundation of the Optimization Plan.
Any service analysis, whether in the private or public sector, must address competing priorities and
make choices that affect service and/or cost. The effect of such choices influences risk.
For Fire and Paramedic Services, managing risk is an overt part of the core business. There are two risk
categories: external community risks that influence the design and delivery of emergency response, and
internal business risks that could contribute to a negative operational impact, such as inadequate data
for decision support, a lawsuit, or a loss of public confidence in their Emergency Services.
When it comes to external community risks, Paramedic Services has a robust system in place mainly due
to legislative requirements instituted by the MOHLTC. Each ambulance (paramedic) service in the
province of Ontario must undergo and successfully complete the Land Ambulance Certification service
review administered by the MOHLTC. The purpose of this legislated Service Review is to ensure
ambulance services are operated in a manner consistent with Land Ambulance Certification Standard
and in compliance with all other applicable legislation, regulations and provincial standards. Services
are required to successfully complete the prescribed Ambulance Service Review certification process
once every three years in order to maintain their certification to operate. Participation in these
comprehensive service audits provides an excellent opportunity for this division to have a third party
review, assess operations and take a detailed critical view of all aspects of the service to ensure risks are
being managed in all areas.
To address the external community risks, Fire Services has completed, as part of this project, an initial
Community Risk Profile aimed at identifying and quantifying the risks in place within the city. This
Community Risk Profile is based on established industry standard impact and likelihood criteria. It is
important to note that the Fire Protection and Prevention Act (FPPA) identifies Community Risk Profiling
as the primary step in identifying appropriate service levels for a given community. The
recommendations identified within this report take into account community level risk, the service levels
needed to protect these communities, and the associated costs. All of these factors have been
evaluated against the five Guiding Principles and the One City, One Service principle approved by Council
within the Emergency Services Strategic Plan.
Lastly, to address internal business risk, both divisions of Fire Services and Paramedic Services have
completed an Enterprise Risk Register (ERR) in conjunction with the City of Greater Sudbury’s Auditor
General’s Office (See Appendices #R2 and #R3). These ERRs aim to identify and quantify threats to the
operation of each service, with an additional focus on the effectiveness of mitigation strategies currently
in place. A further analysis of each ERR was performed to evaluate the impact of the Optimization
Project in relation to recommendations for adjustments in service levels, staffing models and long-term
financial accountability.
A detailed review of risk for each of the Fire and Paramedic Services will be presented in greater detail
later in this report.

Fire Optimization Report

Fire and Paramedic Optimization Report
Page 24
ANALYSIS OF CURRENT MODEL - PARAMEDIC SERVICES
What you will learn in this section:
Overview and analysis of Paramedic Service operations
Legislative requirements of delivering paramedic services and regulated reporting
requirements
Evolution of the service since it was downloaded to municipalities by the provincial
government in 2000
Challenges faced by Paramedic Services
Greater Sudbury Paramedic Services is responsible for seamless coverage of primary and advanced
medical care to residents and visitors of the City of Greater Sudbury. Additionally, under the Ministry of
Health and Long-Term Care’s concept of seamless ambulance coverage, Greater Sudbury Paramedic
Services also provides ambulance services to other adjacent areas where resources are closer than any
other. In essence, Greater Sudbury ambulances cover an area approximately 9,221 square kilometres in
size, which includes the City’s 3,627 square kilometres.
Fire and Paramedic Optimization Report
Page 25
History of Optimization in Paramedic Services
The provincial government adopted some fundamental principles to be considered in the assumption
and ongoing operation of future ambulance services. These principles include the following concepts:
accessibility to all persons
integration within the greater health-care system
seamlessness across municipal boundaries (nearest ambulance to respond to emergencies)
accountability both financially and for the quality of service
responsiveness to change (demographic change, advanced technology and other).
In 1999, the IBI Group was commissioned by the City to assess the current state of the land ambulance
service and provide analysis on service delivery issues that would assist Council in making decisions on
the future delivery model. These reports identified an ambulance service that was ministry funded and
privately operated on behalf of the MOHLTC, but under resourced in terms of budget, stations, vehicles
and staff.
Pre-amalgamation, the ambulance service system in Sudbury was considered a level-of-effort model
that was focused on managing the financial bottom line. The Service used 14 ambulances to deliver
service from one main four-vehicle station on Falconbridge Road, with two paramedic posts in the City
on Notre Dame Avenue and Kelly Lake Road, and with satellite reporting stations in Valley East,
Chelmsford and Lively. Vehicle deployment amounted to approximately 53,664 hours a year.
One of the beneficial projects the Service at the time was involved in was the Ontario Advanced Life
Support Study (OPALS). OPALS was a research project focused on investigating the benefits of fully-
trained Advanced Life Support Paramedics in 20 municipalities across Ontario. This study provided the
opportunity to train 22 Sudbury Primary Care Paramedics to the Advanced Care Level.
Prior to assumption in 2000, the service was not meeting certain response time targets and was at risk
of being removed from the OPALS research project. Additionally, the service was not meeting the
legislated 1996, 90th percentile Code 4 (emergency) response time of 12 minutes and 12 seconds. The
following table details historical yearly 90th percentile response times.

Fire and Paramedic Optimization Report
Page 26
In an attempt to improve response times, paramedics working in the city core were required to spend
their entire shift in their ambulance on stand-by in high call volume areas of the city. Under this model,
crews were performing 10-12 calls per shift and rarely met the meal break provision within the
Employment Standards Act. This model of deployment was unsustainable in the long term.
In the year 2000, Council made two key decisions. One was to implement a direct delivery model while
the second was a commitment to transform the previous level-of-effort service to a performance-based
model that:
Delivers clinical excellence, response time reliability, economic efficiency and customer
satisfaction;
Monitors, measures and ensures accountability for pre-defined standards of care and response
times;
Is designed in a way that will provide paramedics with a working environment conducive to
professional career development and employment stability;
Is delivered by one provider to achieve a high-quality, reasonably-priced land ambulance
service; and
Creates a system where the dispatch function is integrated with the land ambulance service
operation.
Although the provincial government created a new service relationship for ambulance services on a
50/50 grant cost sharing basis with the municipality, the MOHLTC maintained full control of the
provincial ambulance dispatch system in an attempt to ensure ambulance services continued to be
delivered in accordance with the ministry’s established fundamental principles.
Since assuming responsibility for the delivery of ambulances services on December 3, 2000, Paramedic
Services has been engaged in a continual process of quality improvements using evidence-based
decision- making to evolve the service to a performance-based delivery model addressing all aspects of
the service with consideration to service outcomes, risks and cost.

Fire and Paramedic Optimization Report
Page 27
Some improvements are a result of legislative requirements, while many others are focused on quality
outcomes, accountability, the specification of expected results measured against pre-determined
standards or response times, economic efficiency, and patient outcomes, including patient satisfaction
as key tenants of a performance-based service model.
Paramedic Services Legislation
Ambulance (Paramedic) Services in the Province of Ontario are governed by a multitude of legislation
with the pre-eminent document being the Ontario Ambulance Act. Within the section entitled
Responsibilities of Upper-Tier Municipalities it is stated;
6. (1) Every upper-tier municipality shall,
(a) except as otherwise provided by regulation, be responsible for all costs associated with the
provision of land ambulance services in the municipality, subject to any grant made to the
municipality under subsection 4 (3); and
(b) be responsible for ensuring the proper provision of land ambulance services in the
municipality in accordance with the needs of persons in the municipality. An ambulance service
“includes all services provided by an ambulance service in connection with the transportation of
persons by land.” Every ambulance service must have a current certificate from the Province to
operate. 3
In being responsible for ensuring the proper provision of ambulance service in accordance with the
needs of the persons within the municipality, it is clear that the Province expects each municipality to
determine their own levels of service. While it is the municipality that sets the levels of service, other
legislation governs who a municipality can hire, what qualifications they must have, what skills they can
use, what equipment is carried and what vehicles are certified for use in the province.
From an optimization perspective it must be understood that any optimized Paramedic Service would
continue to abide by all legislative requirements. The following provides a brief description of some of
the more pertinent pieces of legislation.
The Ambulance Act
The MOHLTC provides provincial oversight through its authority established under the Ambulance Act
and Regulations. The Ambulance Act provides the overall legislative framework in which governs the
delivery of Paramedic Services (land ambulance) in Ontario. The Ambulance Act grants the Director of
Emergency Health Services the authority to establish minimum standards governing the delivery of
ambulance services. These key minimum standards include Patient Care, Vehicle design,
Documentation, Communicable Disease, Equipment, Patient Care and Transportations, and Land
Ambulance Certification Process.
3 Ambulance Act, Part 3

Fire and Paramedic Optimization Report
Page 28
Ontario Regulation 257/00
This regulation made under the authority of the Ontario Ambulance Act covers specific legislative
requirements on the following issues: Certification of ambulance operators, Qualifications of
paramedics and re-qualifying exams for paramedics, standards of patient care and documentation,
operations of ambulance services, obligations of communications centres, base hospitals and land
ambulance services funded by the province, Response Time Performance Plans, and lists of controlled
acts permitted by primary, advanced and critical care paramedics.
Ontario Regulation 129/99
This regulation, made under the authority of the Ontario Ambulance Act, provides the legislative
framework and process in which municipalities can recover and shall apportion costs for the delivery of
land ambulance services amongst two or more municipalities. In addition the process to establish cross
border costs.
Ambulance Services Collective Bargaining Act
The above act sets out the legislative framework to ensure the continuation of essential ambulance
services in the event of a strike by ambulance workers.
In addition to the Ambulance Act, regulations and provincial standards there are several other pieces of
legislation that impact the delivery of paramedic services. These include, but are not limited to:
Personal Health Information Protection Act
Health Care Consent Act
Child and Family Service Act
Coroner's Act
Health Protection and Promotion Act
Highway Traffic Act
Mental Health Act
Occupational Health and Safety Act
Staffing
Greater Sudbury Paramedic Services employs both Primary Care (PCP) and Advanced Care (ACP)
Paramedics in the delivery of pre-hospital medical care. At assumption, a PCP was able to deliver
symptom relief (five medications) along with semi-automatic defibrillation. Over the last 10 years, the
scope of practice has dramatically increased adding nine additional medications, and 10 new delegated
acts. The ACP has also increased their scope with the addition of six new drugs and an additional 10 new
medical directives. In support of the services delivered by the paramedics, equipment vehicle
technicians (EVT) aid in the delivery of emergency care through a variety of methods including
inspecting, stocking, decontaminating and disinfecting ambulances with the goal of allowing the
paramedics to get out into areas of high call volume in the most effective manner possible.

Fire and Paramedic Optimization Report
Page 29
Primary Care Paramedic (PCP)
A Primary Care Paramedic (PCP) is a graduate of a two-year community college paramedic program that
meets the criteria to challenge the MOHLTC Advanced Emergency Medical Care Assistant (A-EMCA)
exam. Upon successful passage of the A-EMCA, a person is able to obtain employment as a PCP with a
certified service in Ontario. Once hired by a Paramedic Service, the PCP must also successfully certify
with the Regional Base Hospital Medical Director in order to perform a number of delegated medical
acts used by the respective service. A detailed review of medications delivered and skills performed is
found within (See Appendix #T2).
Each PCP must also successfully complete many mandatory and elective continuing medical education
courses on an annual basis to maintain their qualifications and certifications under the regional base
hospital program.
Advanced Care Paramedic (ACP)
An Advanced Care Paramedic (ACP) will have had 2 years of training to become a PCP before spending
an additional year of schooling to progress to the advanced care level. The ACP course is highly intensive
and upon successfully completing the college portion the potential ACP must successfully complete a
provincial exam administered by the MOHLTC. Once employed with a certified ambulance service the
ACP must then successfully be certified by the Regional Base Hospital Medical Director. A detailed
review of medications delivered and skills performed is found within (See Appendix #T3).
Each ACP must also successfully complete many mandatory and elective continuing medical education
courses on an annual basis to maintain their qualifications and certifications.
In terms of continuous system improvements it is important to note that in many cases components
have been modified several times to address specific system needs and challenges that have developed
over the last 17 years. At assumption in December 2000, Paramedic Services began with 59 full-time
staff (37 PCP, 22 ACP) in the delivery of 76,272 vehicle service hours annually. Over the years there have
been incremental increases in staffing that align with vehicle service hour increases which were needed
due to increasing call response volumes. The following table demonstrates an overall staffing increase
of 66% from 2000 to 2016.

Fire and Paramedic Optimization Report
Page 30
2000 2017 2000-2017
Classification Full-Time Part-Time Total Full-Time Part-Time Total % Increase
Primary Care
Paramedic (PCP)
37 27 64 47 37 84 31 %
Advanced Care
Paramedic (ACP)
22 0 22 50 9 59 168 %
SUB TOTAL: 59 27 86 97 46 143 66 %
Paramedic Services is a 24-hour-a-day, 365-day-a-year operation that uses a variety of staffing and
schedule profiles including seven, eight, and 12-hour shifts to ensure appropriate staffing coverage
requirements. This scheduling is currently shared between a Senior Payroll and Finance Clerk and the
Paramedic Services Platoon Superintendent. These two roles are responsible to manage a schedule that
is under constant change by the hour due to absences occurring from paramedics, logistics, training,
professional standards and management staff. The Senior Payroll and Finance Clerk core function is not
scheduling, but the contribution of over 20% of their time assisting with the scheduling needs of the
Service places a strain on their ability to ensure all payroll and other financial matters are handled in an
efficient manner. This position is currently responsible to schedule starting the one week ahead and out
to a three-month period. The reality of the strain on this position often means that the schedule is only
complete to 3-4 weeks out because of other job pressures.
The Platoon Superintendent is responsible for covering open shifts from the current day to seven days in
advance. Handling over 300 time-off requests and in excess of 750 shift changes each year places strain
on a position that again does not have scheduling as a true priority. Each time off request, shift change,
or other scheduling requirement involves a significant number of steps to ensure that correct scheduling
is completed in compliance with collective agreement requirements and corporate policy. The Platoon
Superintendent often requires many hours to be spent in the office addressing scheduling requirements
and reporting, at times making close to 100 calls to find replacement staff.
The previous table also demonstrates a significant increase in ACPs to meet demands. Upon assumption
the service goal was to grow the number of ACPs in order to ensure an ACP was able to respond to every
call. Throughout the years, different deployment models sought to ensure appropriate ACP response.
Even though the closest available ambulance is always dispatched, the service deployment plan dictates
a mandatory ACP response to those calls with an increased potential for serious illness and injury (for
example cardiac arrest and penetrating trauma). So while the closest ambulance would always be
dispatched per MOHLTC legislation, the closest ACP vehicle (if the initial unit was not an ACP unit) would
also be sent in cases where their skill set has shown to help improve patient outcome.
Fire and Paramedic Optimization Report
Page 31
Equipment Vehicle Technician (EVT)
Equipment Vehicle Technicians (EVT) are vital to the logistical support of Paramedic Services ensuring all
vehicles and medical equipment are cleaned, sanitized, inspected and restocked in accordance with
provincial legislation, regulations, standards and service policy. EVTs prepare a minimum of 16 vehicles with
accompanying sets of medical equipment for deployment every 24 hours. EVTs manage a significant
inventory of medical equipment including ambulance stretchers, immobilization equipment, cardiac
defibrillators, oxygen equipment and laptops, in addition to a significant inventory of drugs and disposable
medical supplies. They are trained and certified to carry out preventative maintenance and repairs on power
stretchers and power load systems as well as specialized oxygen delivery equipment. Additionally, EVTs
transport paramedic vehicles to and from the Lorne Street Depot for preventative maintenance and
unscheduled repairs several times each shift.
Working shifts 24-hours a day and 365 days a year, EVTs respond with the service’s Emergency Support Unit
and Remote Paramedic Response Unit (Argo/Gator) to calls in remote areas, transporting paramedics and
equipment to remote accident scenes, and back to the waiting ambulance. Finally, EVTs have been trained
and licensed to drive the city's Mobile Command Unit which responds to incident scenes when requested by
Police, Fire, Emergency Management and Paramedic Services.
Stations
To effectively deliver paramedic services with response time reliability across such a large municipality,
there has been an increase in stations from the original four stations and two posts in 2000, to the
current 11. These stations are comprised of three distinct types of configurations. One central start
station, Paramedic Headquarters, is located in Azilda. There are also five posts which are located in the
former City of Sudbury within former fire stations (Long Lake, Van Horne, Leon, Minnow Lake and
Garson) where call volumes are higher. Lastly, there are five satellite reporting stations located in the
suburban communities of Levack, Chelmsford, Walden, Val Therese and Capreol.
At assumption of Paramedic Services, the decision was made to co-habitate in existing fire stations in
the city core along with some appropriate suburban stations (Levack, Walden and Val Therese) as a
measure of economic efficiency. The paramedic stations in Chelmsford and Capreol started as, and have
remained, as dedicated stand-alone paramedic stations.
An analysis completed in 2000, at the time of assumption, identified significant challenges with co-
habitation which included:
lack of sufficient space for paramedic vehicles in some stations,
lack of proper male/female bathrooms,
undesirable placement of common lounge/kitchen areas adjacent to sleeping quarters resulting
in tension within the varied workforce,
lack of private office space for paramedics to complete confidential paperwork.
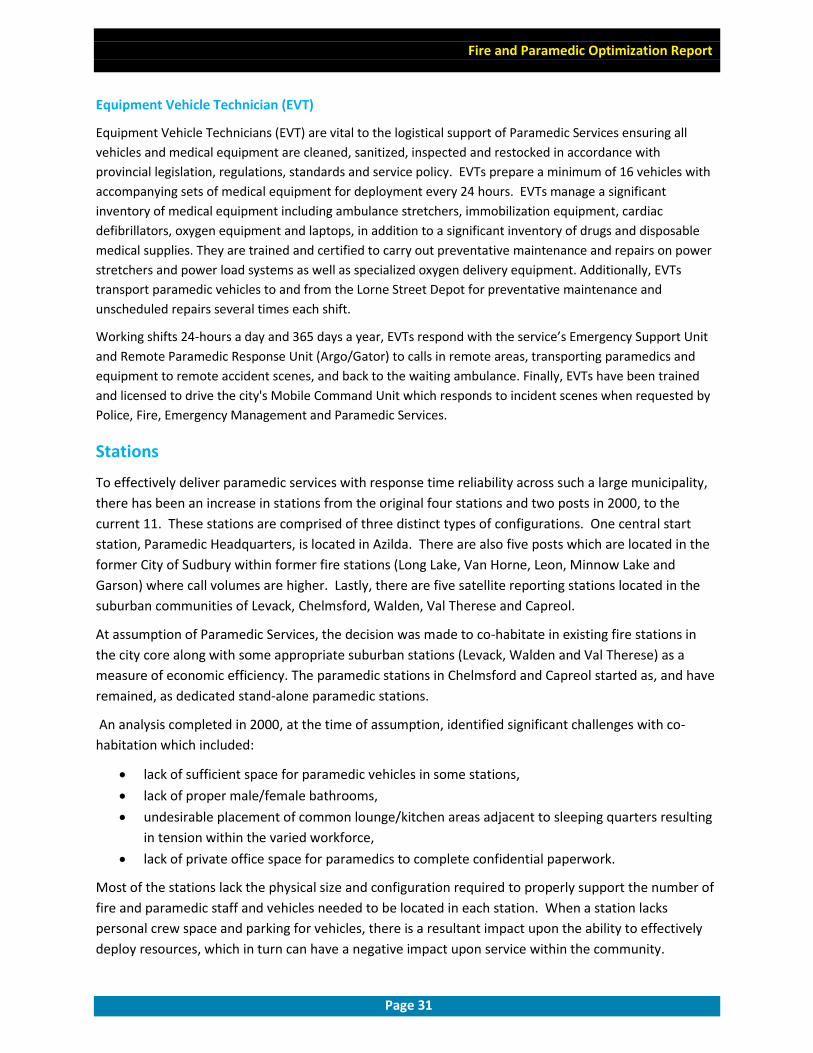
Most of the stations lack the physical size and configuration required to properly support the number of
fire and paramedic staff and vehicles needed to be located in each station. When a station lacks
personal crew space and parking for vehicles, there is a resultant impact upon the ability to effectively
deploy resources, which in turn can have a negative impact upon service within the community.

Fire and Paramedic Optimization Report
Page 32
The current station locations are depicted on the following map with response time radiuses shown in
varying colours dependent on time.

Fire and Paramedic Optimization Report
Page 33
Headquarters Central Start Station Location
In the central start Headquarters station (HQ), all oncoming paramedic crews report to a vehicle that has
been cleaned and fully equipped by the EVTs. The use of these specialized logistical staff decreases the
need for paramedics (at higher hourly wage rates) to stock or clean the vehicles. This system drastically
decreases the number of unit hours that are lost to these functions, which in turn increases the number
of hours deployed in service to the emergency needs of the community. Single start stations are a best
practice for many larger or busy urbanized paramedic services in Ontario providing effective deployment
of paramedics and more efficiently managing large inventories of vehicles and medical equipment.
Paramedic Posts
A post is an existing Emergency Service Station that paramedics use to take breaks and meals when not
performing emergency calls throughout the duty shift. Paramedics do not start or end their shift in
these locations. Paramedic posts are supported by the HQ and are located in the old city at Long Lake,
Van Horne, Leon, Minnow Lake and the Garson Emergency Service Stations. Many of these stations are
well located for Paramedic Service delivery however they are old and in poor condition. As noted
previously, they were also not originally designed to support both Fire and Paramedic services in terms
of the numbers of staff and vehicles.
In 2004, an investment of $200,000 was made to develop dedicated paramedic space to address the lack
of staff space in the four career Fire stations (Long Lake, Van Horne, Leon and Minnow Lake) within the
city. Then, in late 2016 some changes to Fire vehicle locations and configurations provided an
opportunity, for the first time, to assign dedicated parking for two ambulances, an increase of just one
space inside the downtown Van Horne station. Despite ongoing efforts by the Fire and Paramedic
Services senior management team, the location, physical size and station design continue to be
significant barriers to a more flexible vehicle deployment and harmonious station environment for staff.
Satellite Reporting Stations
Paramedic Services utilizes five reporting stations in lower call volume areas of the city. Paramedics
report directly to these stations where they start their shift by advising dispatch while taking charge of a
vehicle and equipment. In this model, paramedic crews are responsible to stock and clean their own
ambulances at their home station. They are afforded this opportunity by the lack of needing to deploy
to a post location and by the decreased number of calls for service. Three of the five reporting stations
are staffed with a PCP/ACP crew configuration and are located in Chelmsford, Walden and Valley East.
The remaining two stations house Paramedic Response Units (PRU) typically staffed with a single
Advanced Care Paramedic. These stations are located in Levack and Capreol.
Fire and Paramedic Optimization Report
Page 34
Vehicles
Since the year 2000, Paramedic Services has grown its fleet to 38 vehicles which allows for the proper
support in the delivery of Paramedics Services. The breakdown of these vehicles includes 23 primary
response ambulances and eight Paramedic Response Units (PRU). In addition, Paramedic Services
deploys, on a need basis, an Emergency Support Vehicle, a Remote Paramedic Response Unit
(Argo/Gator) and trailer for remote/off-road response, a Multi-Casualty Incident trailer, three Command
Emergency Response Vehicles, a Mobile Command Unit (tractor-trailer unit) and an administration
vehicle.
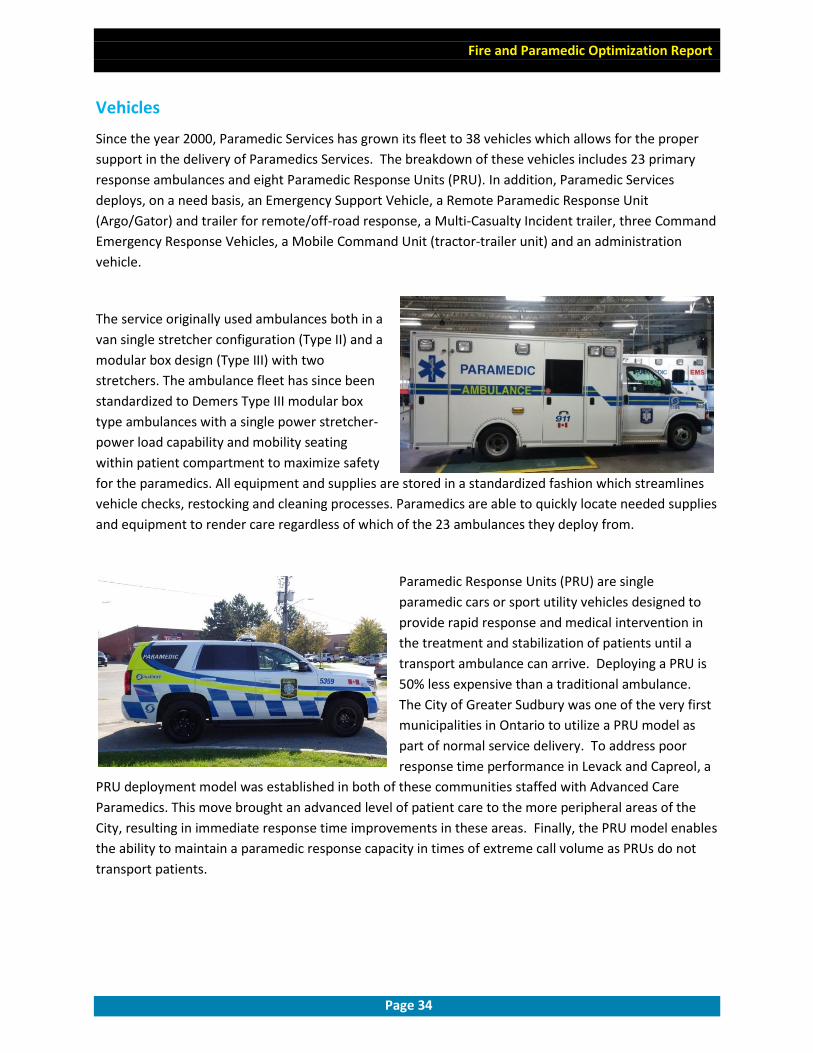
The service originally used ambulances both in a
van single stretcher configuration (Type II) and a
modular box design (Type III) with two
stretchers. The ambulance fleet has since been
standardized to Demers Type III modular box
type ambulances with a single power stretcher-
power load capability and mobility seating
within patient compartment to maximize safety
for the paramedics. All equipment and supplies are stored in a standardized fashion which streamlines
vehicle checks, restocking and cleaning processes. Paramedics are able to quickly locate needed supplies
and equipment to render care regardless of which of the 23 ambulances they deploy from.
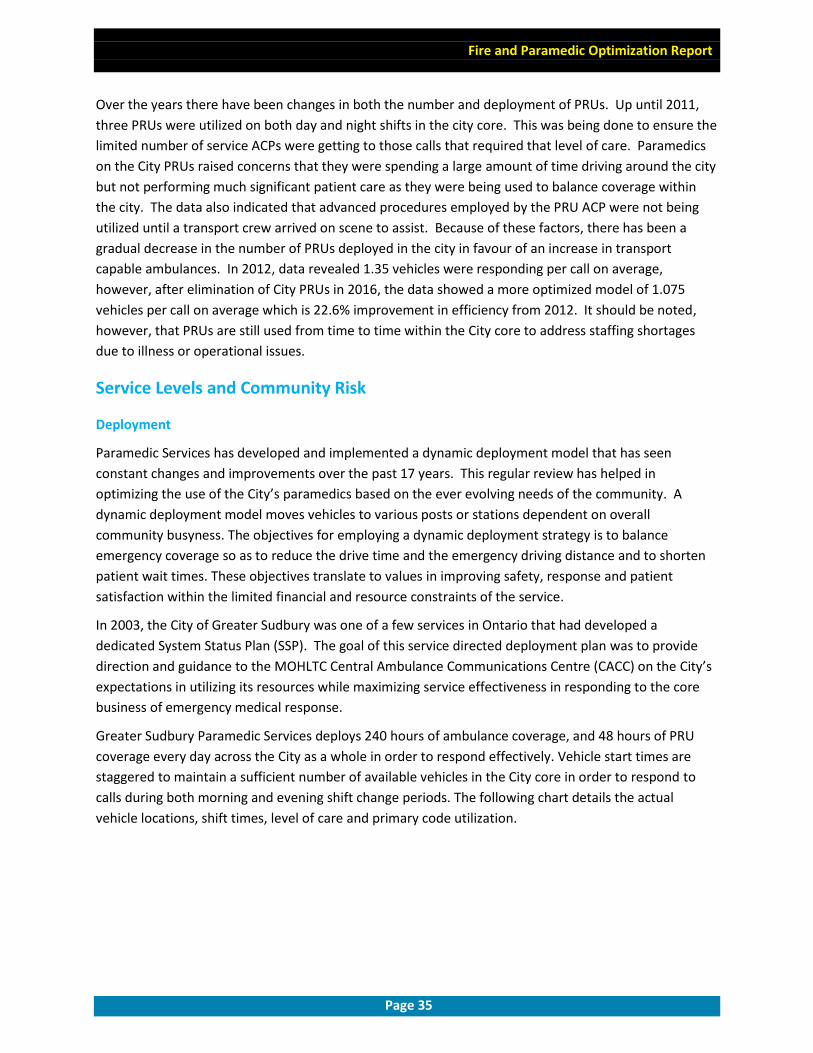
Paramedic Response Units (PRU) are single
paramedic cars or sport utility vehicles designed to
provide rapid response and medical intervention in
the treatment and stabilization of patients until a
transport ambulance can arrive. Deploying a PRU is
50% less expensive than a traditional ambulance.
The City of Greater Sudbury was one of the very first
municipalities in Ontario to utilize a PRU model as
part of normal service delivery. To address poor
response time performance in Levack and Capreol, a
PRU deployment model was established in both of these communities staffed with Advanced Care
Paramedics. This move brought an advanced level of patient care to the more peripheral areas of the
City, resulting in immediate response time improvements in these areas. Finally, the PRU model enables
the ability to maintain a paramedic response capacity in times of extreme call volume as PRUs do not
transport patients.
Fire and Paramedic Optimization Report
Page 35
Over the years there have been changes in both the number and deployment of PRUs. Up until 2011,
three PRUs were utilized on both day and night shifts in the city core. This was being done to ensure the
limited number of service ACPs were getting to those calls that required that level of care. Paramedics
on the City PRUs raised concerns that they were spending a large amount of time driving around the city
but not performing much significant patient care as they were being used to balance coverage within
the city. The data also indicated that advanced procedures employed by the PRU ACP were not being
utilized until a transport crew arrived on scene to assist. Because of these factors, there has been a
gradual decrease in the number of PRUs deployed in the city in favour of an increase in transport
capable ambulances. In 2012, data revealed 1.35 vehicles were responding per call on average,
however, after elimination of City PRUs in 2016, the data showed a more optimized model of 1.075
vehicles per call on average which is 22.6% improvement in efficiency from 2012. It should be noted,
however, that PRUs are still used from time to time within the City core to address staffing shortages
due to illness or operational issues.
Service Levels and Community Risk
Deployment
Paramedic Services has developed and implemented a dynamic deployment model that has seen
constant changes and improvements over the past 17 years. This regular review has helped in
optimizing the use of the City’s paramedics based on the ever evolving needs of the community. A
dynamic deployment model moves vehicles to various posts or stations dependent on overall
community busyness. The objectives for employing a dynamic deployment strategy is to balance
emergency coverage so as to reduce the drive time and the emergency driving distance and to shorten
patient wait times. These objectives translate to values in improving safety, response and patient
satisfaction within the limited financial and resource constraints of the service.
In 2003, the City of Greater Sudbury was one of a few services in Ontario that had developed a
dedicated System Status Plan (SSP). The goal of this service directed deployment plan was to provide
direction and guidance to the MOHLTC Central Ambulance Communications Centre (CACC) on the City’s
expectations in utilizing its resources while maximizing service effectiveness in responding to the core
business of emergency medical response.
Greater Sudbury Paramedic Services deploys 240 hours of ambulance coverage, and 48 hours of PRU
coverage every day across the City as a whole in order to respond effectively. Vehicle start times are
staggered to maintain a sufficient number of available vehicles in the City core in order to respond to
calls during both morning and evening shift change periods. The following chart details the actual
vehicle locations, shift times, level of care and primary code utilization.

Fire and Paramedic Optimization Report
Page 36
Greater Sudbury Emergency Services Resource Allocation
Monday to Sunday
Station Assignment DAY
Shift Time
NIGHT
Shift Time Level of Care Primary Utilization*
HQ 05:30 - 17:30 PCP/ACP CODE 1, 2, 3, 4, 8
HQ 06:00 - 18:00 18:00 - 06:00 PCP/ACP CODE 1, 2, 3, 4, 8
HQ 06:30 - 18:30 18:30 - 06:30 PCP/ACP CODE 1, 2, 3 4, 8
HQ 06:30 - 18:30 PCP/ACP CODE 1, 2, 3, 4, 8
HQ 07:00 - 19:00 19:00 - 07:00 PCP/ACP CODE 1, 2, 3, 4, 8
HQ 07:00 – 19:00 19:00 - 07:00 PCP/ACP CODE 1, 2, 3, 4, 8
HQ 07:30 – 19:30 19:30 - 07:30 PCP/ACP CODE 1, 2, 3, 4, 8
HQ 07:30 – 19:30 PCP/ACP Code 1, 2, 3, 4, 8
HQ 14:00 – 02:00 PCP/ACP CODE 1, 2, 3, 4, 8
LEVACK 07:00 – 19:00 19:00 – 07:00 ACP (PRU) CODE 3, 4, 8
CHELMSFORD 06:30 - 18:30 18:30 - 06:30 ACP CODE 3, 4, 8
VALLEY EAST 06:00 - 18:00 18:00 - 06:00 ACP CODE 3, 4, 8
CAPREOL 07:00 – 19:00 19:00 – 07:00 ACP (PRU) CODE 3, 4, 8
WALDEN 07:30 – 19:30 19:30 -07:30 ACP CODE 3, 4, 8
* Primary Utilization Call Definitions:
Code 4 (Urgent – life-threatening) or lights and sirens responses
Code 3 (Prompt – non-life threatening)
Code 2 (Non-urgent Transfer for Scheduled Appointment)
Code 1 (Non-urgent Transfer)
Code 8 (Standby coverage for a police or fire incident, or to provide emergency coverage)
Fire and Paramedic Optimization Report
Page 37
System Status (Deployment) Plan
There have been and continues to be numerous issues impacting upon service performance at any given
time. Issues such as patient demographics, call volumes, the one-site hospital, ambulance off load
delays, centralized health care to HUB hospitals (Health Sciences North), airport call volumes and
paramedic wellness are just a few of the issues that require an evaluation of the System Status Plan
(SSP) on an annual basis. The dynamic deployment model presented within the SSP has seen constant
change and refinement over the past 17 years. Annual evaluations review patient and call data from
various perspectives including patient demographics, call volumes, response times, vehicle utilization,
current service issues and trends. Then, working directly with dispatch staff and in consultation with the
paramedics, service gaps are identified and recommendations for positive change are made. Often
these recommendations will result in short pilot projects aimed at testing new strategies. The
deployment model is regularly monitored for improvements and any adjustments made to optimize
outcomes. Over the years many changes have occurred including:
alteration of shift start times to better align with peak call volume,
shift changes to improve second meal break compliance,
elimination of PRUs as part of the normal city deployment in favour of increased transport
capability for both day and night shift,
reduction in vehicle availability for non-urgent transportation which allows for the diversion of
resources to emergency response.
Some additional changes have resulted in improved working conditions for the paramedics as part of the
City’s focus on employee wellness. These alterations aim to improve end of shift strategies to
reduce/control shift extension getting crews home on time, maintain improved meal break compliance
rate that was 93% compliant in 2016 and eliminate standby on street corners.
It is important to note that through service system improvement evaluations Paramedic Services
remains focused on response time reliability, impact on patient outcomes and staff wellness. Most
recently, last July Council supported an increase in vehicle service hours by 32 hours every weekend to
better align with call volumes during those timeframes. In the past, having fewer ambulances on
weekends reflected a time with lower emergency call volumes and less inter-facility transfers. Over the
last few years, the number of calls on weekends is no longer significantly less than that of weekdays.
Fire and Paramedic Optimization Report
Page 38
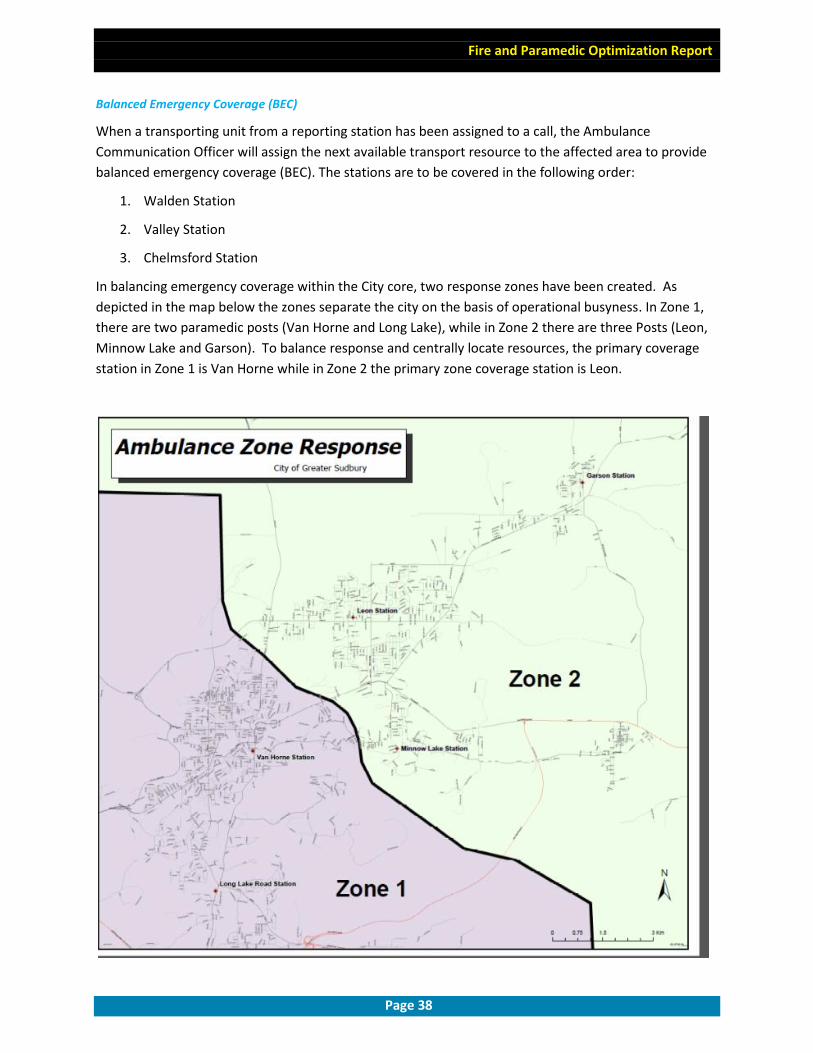
Balanced Emergency Coverage (BEC)
When a transporting unit from a reporting station has been assigned to a call, the Ambulance
Communication Officer will assign the next available transport resource to the affected area to provide
balanced emergency coverage (BEC). The stations are to be covered in the following order:
1. Walden Station
2. Valley Station
3. Chelmsford Station
In balancing emergency coverage within the City core, two response zones have been created. As
depicted in the map below the zones separate the city on the basis of operational busyness. In Zone 1,
there are two paramedic posts (Van Horne and Long Lake), while in Zone 2 there are three Posts (Leon,
Minnow Lake and Garson). To balance response and centrally locate resources, the primary coverage
station in Zone 1 is Van Horne while in Zone 2 the primary zone coverage station is Leon.

Fire and Paramedic Optimization Report
Page 39
Call Volume
A key driver of ambulance call volume is the aging demographic. Baby boomers born in the post World
War II era of 1946 to 1964 make up a large number of the population and are now between 53 and 70
years of age. The following chart details the percentage of seniors aged 65 or older within the city on a
historic and predicted future basis.
Research suggests that nearly one-third of a person’s lifetime health-care expenditure is incurred during
middle age, and nearly half is incurred during the senior years. Greater Sudbury’s aging population is
becoming a larger share of its total population, so it is reasonable to anticipate increased call volumes in
future years.
The following Call Volume and Projection Chart depicts the actual call volume by high priority (Code 3
and 4) and all calls (Code 1 to 4) from 2011 through to 2016. Projections for 2017 through to 2025
based upon historical call volume are also included.
13.9% 14.9% 15.5%
19.9%
24.4% 24.7%
0.0%
5.0%
10.0%
15.0%
20.0%
25.0%
30.0%
2001 2006 2011 2021 2031 2036
Seniors Aged 65+ as a total population: Projections for Greater Sudbury CGS
2001-2006 Projections Source: Natural Increase Scenario (Community & Strategic Planning Section,
March 2003) 2001-2006 Projections Source: Natural Increase Scenario (Community & Strategic Planning Section,
March 2003)

Fire and Paramedic Optimization Report
Page 40
The projected call volumes would suggest high priority call volumes to increase by 37%, while all calls
will increase by 20%. In consideration of these call volumes, there exists an opportunity to improve
through the Optimization process as well as through work with the MOHLTC and other stakeholders to
reduce non-urgent call volumes which will be detailed later in this report.
Managing Paramedic Service Community Risks
Since the year 2000, it is apparent that Paramedic Services has been on a continual path towards
Optimization. Managing risk and service levels has been a focus as the delivery of emergency pre-
hospital medical care is inherently a high risk public service. Most of the significant risks relate to
response time reliability, appropriate patient care, and patient safety. As a highly legislated industry,
Paramedic Services must be part of managing and mitigating risk through a variety of manners. The
establishment of a Response Time Standard is one way in which the MOHLTC manages risk with the over
50 different municipal based systems operating individual services. Additionally, the MOHLTC
maintenance of a Base Hospital Program ensures that Paramedic Services adhere to current medically
evidenced standards. Dovetailing with the Base Hospital program, Greater Sudbury Paramedic Services
maintains an active Quality Assurance program that evaluates all aspects in the delivery of service.
Lastly, the Land Ambulance Certification Standard sets in part the standard to which services must
operate. The MOHLTC as part of this responsibility has maintained control over licensure of Paramedic
Services within the province through this standard and accompanying Ambulance Service Review
process.

Fire and Paramedic Optimization Report
Page 41
Response Time Standard
An important measure of a performance-based ambulance service is response time reliability. Lengthy
response times for specific call types can have a greatly negative impact on patient outcome and
mortality, length of hospital stay and long term recovery. There is however growing evidence that
suggests the correlation between response times and patient outcomes is not as strong as once thought
and that only a small subset of call types truly benefit from quick response times such as cardiac arrest
and certain CTAS 1 calls.
The legislated response time requirement until 2013 required ambulance services to meet the 90th
percentile code 4 (dispatched as life threatening) response time established in 1996 for that jurisdiction.
Although this measure is no longer a legislated performance metric, many services continue to monitor
this measure as a demonstration of response time reliability. The following chart demonstrates the
response time reliability being achieved by paramedics across the City of Greater Sudbury. It reveals
that response times have remained relatively stable over the last six years, with an average 90th
percentile emergency response time of 10 minutes 38 seconds.
Commencing January 2013 the legislation was changed to reflect the newly developed Response Time
Standards (RTS). The Ambulance Act mandates that every service provider in Ontario must prepare and
submit an annual performance plan targeting response times for their respective service area by
October 31st of each year. Furthermore, each service provider must submit the actual performance on
their previous years plan by March 31st of the following year. It should be noted that each year the
MOHLTC posts the results of every land ambulance service provider RTS Performance Plan publicly on
the Ministry’s website.
The Response Time Standard (RTS), through a retrospective analysis, measures response times
according to how sick the patient was at time of paramedic arrival to the patient. The Regulation also
sets out multiple response time targets based on medically relevant categories. These categories use the

Fire and Paramedic Optimization Report
Page 42
Canadian Triage Acuity Scale (CTAS), a standardized triage tool used by all paramedics, nurses and
doctors within the emergency field across Canada.
From a process perspective, the paramedic assesses a patient once on scene and then assigns a CTAS
level using a five-level scale with Level 1 (Resuscitation) representing the “sickest” patients, and with
Level 5 (Non-urgent) representing the least ill group of patients. paramedics assign a CTAS level to
patients to more accurately define the patient’s need for care primarily based on the optimal time to
medical intervention. The five levels are:
CTAS Level 1: Resuscitation
CTAS Level 2: Emergent
CTAS Level 3: Urgent
CTAS Level 4: Less Urgent
CTAS Level 5: Non Urgent
The legislation allows the services to build their own response time performance plans using the specific
reportable call criteria as outlined within the Regulation. The following are the key criteria found in a
response time performance plan:
1. The percentage of the time that a person equipped to provide any type of defibrillation has
arrived on-scene to provide defibrillation to sudden cardiac arrest patients within six minutes
of the time notice is received. Note, this is a community response – any bystander, emergency
responder or paramedic with a defibrillator will count within this criterion.
2. The percentage of the time that a paramedic has arrived on-scene to provide medical care to a
sudden cardiac arrest patient or other patient categorized as CTAS 1 within eight minutes of the
time notice is received.
3. The percentage of the time that an ambulance crew has arrived on-scene to provide ambulance
services to a patient categorized as CTAS 2, 3, 4, and 5 within the response time targets set by
the upper-tier municipality.
Greater Sudbury City Council approved Paramedic Services Response Time Performance Plan in October
2013. This plan has not been amended since the start and sets out the following response time criteria:
Level of Acuity Time Percentile % (Set by Council)
Sudden Cardiac Arrest 6 minutes (Set by MOHLTC) 70%
CTAS 1 8 minutes (Set by MOHLTC) 80%
CTAS 2 10 minutes (Set by Council) 85%
CTAS 3 , 4, and 5 15 minutes (Set by Council) 85%

Fire and Paramedic Optimization Report
Page 43
Since inception of the new standard, Paramedic Services has recommended aggressive response times to Council as a measure to improve system performance. In setting the recommended times, past response time performance was reviewed and the standard was set above the previous performance levels in an effort push the system towards better performance. The following table is an image of the posted yearly data on the MOHLTC website.

Fire and Paramedic Optimization Report
Page 44
Response Time Reliability
Response time reliability in meeting Council approved legislated Response Time Performance Plans is
important to ensure response to high acuity calls to maintain the public confidence. For the
Optimization project, a review of the three most time sensitive patient category calls was performed. A
comparative analysis was completed based on actual 2015 response time performance against the other
52 paramedic services in Ontario. Greater Sudbury Paramedic Service’s positioning further points to a
system that is operating at a very high level.
Sudden Cardiac Arrest
The benchmark for Sudden Cardiac Arrest established in 2015 was 70% with the actual percentage
achieved in 2015 of 73%. Sudden Cardiac Arrest responses account for less than 1% of all calls. This
small volume (122 calls) means a small number of responses in excess of the six minutes can have a
significant impact on the plan’s results and can produce wide fluctuations in response time performance
year over year. As noted previously, the Sudden Cardiac Arrest response time is not a direct reflection
of just the Paramedic Service, but rather a community response as anyone with a defibrillator can stop
the clock. Response times are measured from the time the paramedic crew is notified, to arrival on
scene of any first responder or bystander with a defibrillator. When measuring response times it is
important to note that when responding from the station, paramedics have a legislated two-minute
“chute” time in which to collect call information and become mobile, leaving really only four minutes for
travel time.
Greater Sudbury’s very aggressive SCA response time plan of 70% in six minutes or less ranks within the
top three highest goals for municipal paramedic services in Ontario. Despite significant challenges
associated with the City’s vast geography, Greater Sudbury is ranked fifth best in reported actual
performance for the 52 services in the Province.

Fire and Paramedic Optimization Report
Page 45
2015 Response Time Standards - Sudden Cardiac Arrest
This result is even more impressive in the fact that only 65% of households are within a four (4) minute
drive time of existing Emergency Services Stations. The Service continues to work with community
groups to install Public Access Defibrillators (PADs) and train local residents in cardiopulmonary
resuscitation and PAD use in more remote locations of the City.
CTAS 1
The benchmark established in 2015 for a CTAS 1 calls was 80% with an actual achievement of 81%. CTAS
1 calls account for less than 2% of all emergency calls. As previously noted, when responding from the
station paramedics have a legislated two-minute “chute” time in which to collect call information and
get mobile, in this case leaving only six (6) minutes for travel time. Paramedic response to outlying areas
continues to be a challenge, with only 86% of households within a six minute drive time from our
stations. The CTAS 1 category includes both Sudden Cardiac Arrests and other calls reflecting the most
acutely ill or injured patients who require aggressive treatment and resuscitation by a paramedic.
Greater Sudbury’s CTAS 1 response time plan of 80% in 8 minutes or less ranks the service 2nd highest in
terms of goal setting with an actual result of 81% also placing the service as second best in actual
performance amongst the 52 municipal services.

Fire and Paramedic Optimization Report
Page 46
2015 Response Time Standards – CTAS 1
CTAS 2
The benchmark established in 2015 for a CTAS 2 call was a ten (10) minute response 85% of the time.
The Service met its target with an actual percentage achieved of 85%. CTAS 2 patients are acutely sick
and injured; some examples are strokes, heart attacks, and closed head injuries requiring emergency
transport to hospital and as in the case of CTAS 1 responses, only a paramedic can stop the clock on the
ten (10) minute response for a CTAS 2 call.
In evaluating the CTAS 2 response time performance it was noted that only 36% of the 52 services
established a response time of 10 minutes or less (one 8 min.) for CTAS 2 calls. With an actual CTAS 2
performance coming in at 85% Greater Sudbury is ranked 7th best in reported performance for CTAS 2
responses amongst the 52 services in the Province.

Fire and Paramedic Optimization Report
Page 47
2015 Response Time Standards – CTAS 2
When assessing service based response time performance year over year from 2013 through to 2015
there has been gradual improvement year over year in all response times.
Globally, in 2015 Greater Sudbury paramedics achieved the mandated response times amongst all CTAS
levels 95% of the time or better. Paramedic Services however, continues to explore opportunities for
improvement in response time performance. In the spring of 2015, a detailed review of the System
Status Plan, and subsequent deployment changes, realigned resources during peak response times.
These changes resulted in a reduction of double dispatching of resources and increase of one transport
ambulance during peak call times. Furthermore, the Service continues to develop and monitor key
performance indicators to assist and guide system improvements aimed at improving effective and
efficient deployment strategies.

Fire and Paramedic Optimization Report
Page 48
Base Hospital System
Paramedic Services delivers mobile emergency health care, bringing a high level of clinical training and
sophisticated medical skill and capability to address a patient’s illness or injury. The MOHLTC has
developed both Basic Life Support and Advanced Life Support patient care standards that provide clear
expectations to paramedics in the treatment of most emergency situations. Additionally, the MOHLTC
has 7 Regional Base Hospitals within Ontario with Medical Directors working out of each site that are
responsible for the provision of medical oversight, paramedic certification, ongoing medical education
and quality assurance for all paramedics working in their catchment area. This ongoing program is
designed to ensure that paramedics are delivering patient care according to standards and improving
patient safety relating to the provision of pre-hospital emergency care.
Internal Quality Assurance Program
Upon assumption the service established a Quality Assurance Section outside of Operations with a single
manager responsible for monitoring service compliance in regards to the legislative requirements. Over
a number of years this section has commonly become known in Paramedic Services as Professional
Standards and has grown in capability and scope of responsibility with four dedicated staff now in this
section. Responsibilities of this section in the maintenance of appropriately high quality care include:
Monitoring of compliance with legislation, regulations and standards pertaining to patient care,
Supporting clinical excellence through both patient care and service level clinical audits,
Identifying training gaps and opportunities based on patient care and service wide audits,
Development and implementation of new clinical diversion strategies,
Conducting of patient care and complaint investigations in support of quality outcomes,
Conducting of quality assurance activities and promotion of clinical excellence by supporting
research projects the service is involved in through various activities including participation on
the service’s Quality Care Committee,
Ensuring compliance with Personal Health Information and Protection Act
Ensuring electronic patient care records are secure from unauthorized access and stored in
compliance with legislative requirements,
Supporting paramedics in job related legal proceedings and acting as liaison between the courts
and the paramedics,
Working with legal teams and the courts to protect the city’s interests and reputation,
Oversight of Community Paramedicine and health system integration and community
engagement ensuring paramedic services are integrated into the health care system.
The above key functions of the Professional Standards Group demonstrate a patient centric focus in
support of clinical excellence and protection of the patients and the communities as a whole. This
section is an essential component of an Optimized model.

Fire and Paramedic Optimization Report
Page 49
Logistics Section
A Logistical section has been cultivated since assumption. At the heart of this group are the Equipment
Vehicle Technicians (EVTs). Noted in detail earlier, the EVT position is a best practice in the industry for
larger urban services. It has been demonstrated that in order to manage vehicles and equipment
effectively and efficiently, the Service needs to consolidate these resources as much as possible and
manage these logistical needs through a team dedicated to this type of work. To use highly paid and
trained paramedics for the logistical function is not an efficient use of their skills, and reduces their
availability to deliver on their core mandate of patient care.
Introducing this section at assumption with only a couple of EVT staff, over the years there has been
continual improvements to the system leading to the current Logistical Section that has 6 full-time and
6 part-time staff who have developed numerous logistical processes to provide support. In 2016 the
service introduced the LEAN methodology into the logistics section as a way to evaluate and optimize
work process through the identification and removal of ineffective non-value added steps (waste) from
work processes. Implemented very recently, LEAN has since been successfully in the realm of
improvement to vehicle processing.
Land Ambulance Certification Program
The Ambulance Act states that no person shall operate an Ambulance Service unless the person holds a
certificate issued by the certifying authority. The certifying authority in this case is the MOHLTC
Emergency Health Services Branch. The Act further stipulates that, “a person shall be issued a certificate
by the certifying authority only if the person has successfully completed the certification process
prescribed by the Regulations". This certification process is known as the Ambulance Service Review.
The last Ambulance Service Review, completed in 2015, found that, “the Greater Sudbury Paramedic
Services continues ongoing improvement toward ensuring delivery of high quality ambulance service”.
Also stated was that Greater Sudbury Paramedic Services meets the certification criteria and the
legislated requirements and accordingly, was issued a renewed Certificate to operate an ambulance
service.

Fire and Paramedic Optimization Report
Page 50
The purpose of the Ambulance Service Review is to ensure Ambulance Services are operated in a
manner consistent with the Land Ambulance Certification Standards and in compliance with the
legislation. Services are required to successfully complete the prescribed Ambulance Service Review
certification process once every three (3) years in order to maintain their certification to operate the
Service. In completing the Ambulance Service Review Certification process, Services are required to
meet all of the legislative quality requirements in the following areas:
Level of Service
Employee Qualifications
Staffing
Documentation
Training
Service Review Program
Patient Care
Vehicles
Patient Care Equipment
Policy and Procedures
Operations
Liaison/Communication
From a process perspective, months in advance of the Ambulance Service Review site visit, the MOHLTC
conducts a comprehensive review of the mandatory information and documents supplied by the
Service. This includes background information on call volume, response times, staffing profiles, types
and numbers of vehicles and station locations. In addition, several hundred random patient care
records are submitted for off-site review and auditing.
During the actual site visit, over the course of two days the Ambulance Service Review team reviews all
aspects of the organization. Everything from interviews with senior managers, and review of all
maintenance, policy and procedure records, to peer review ride outs and vehicle inspections with
paramedics occurs. The Service is then graded against legislative requirements and standards.
Following the visit, the MOHLTC provides a “Draft” Ambulance Service Review - Executive Summary
Report detailing the Service review findings. Within thirty days of receiving the draft report a service is
to respond with an action plan that addresses the Ambulance Service Review findings. Once the Service
responds with the action plan addressing the findings, an MOHLTC inspector is assigned to complete a
follow-up site visit to verify that the Service action plan is being implemented in a manner satisfactory to
the MOHLTC.
In the case of the last Ambulance Service Review, on November 19, 2015 the MOHLTC inspector
conducted the follow-up site visit of Greater Sudbury Paramedic Services and was satisfied with the
Services action plan to address the findings in the draft report. That visit concluded the most recent
Ambulance Service Review.

Fire and Paramedic Optimization Report
Page 51
The first Ambulance Service Review occurred in 2003, three years after assumption. Since then there
has been a steady improvement in meeting the legislative standards expected by the MOHLTC as
exemplified by the following chart.
While the Ambulance Service Review process is quite comprehensive it does allow for Paramedic
Services to understand how they are performing against industry standards. To achieve a continual
improvement with the last review detailing only 5 observations is a testament to the continual path
towards Optimization in Paramedic Services.
NELHIN – Non-Urgent Patient Transportation Review and Restructuring
A review of non-urgent patient transportation (NUPT) across Northeastern Ontario began in June 2013
by the North East Local Health Integration Network (NELHIN) in response to concerns about the current
system expressed by patients, hospitals and paramedic service providers. The review’s objective was to
develop a model of transportation that provides timely, safe and cost effective non-urgent patient
transfers into and out of the four HUB hospital centres (Sudbury, North Bay, Timmins, and Sault Ste.
Marie) in Northeastern Ontario, while safeguarding needed paramedic service coverage in communities
across the region. The review of non-urgent patient transfers had been identified as a key project in the
NELHIN’s 2013-2016 Integrated Health Service Plan. Such a new operational model is intended to create
two distinct delivery streams for NUPT.
1. Short Haul – Paramedic/EMS Services across the LHIN and non-EMS transfer resources (Sudbury,
North Bay) will continue to deliver short haul transfers that fall within the coverage area.
41
17 14
10
5
0
5
10
15
20
25
30
35
40
45
2003 2006 2009 2012 2015
Nu
mb
er
of
Re
com
me
nd
atio
ns
Service Review Date

Fire and Paramedic Optimization Report
Page 52
2. Long Haul – Long Haul NUPT will be delivered via a route-based model with scheduled legs
serviced by multi-patient vehicles. Eight routes were identified, with four of these being selected
for early implementation they include:
Elliot Lake to Espanola to Sudbury (165 km)
Mindemoya to Little Current to Espanola to Sudbury (163 km)
Kapuskasing to Smooth Rock Falls to Timmins (166 km)
Cochrane to Iroquois Falls to Matheson to Timmins (224 km)
The NELHIN has secured sufficient funding to allow a limited implementation of the recommended
NUPT delivery mode. Once implemented this 3rd party NUPT system will assume many long haul non-
urgent patient transfers locally from HSN to other community hospitals. This model has the opportunity
to reduce long distance NUPT which are currently completed by paramedic services. As noted earlier,
there is a predicted disproportionate increase in emergency call volumes in comparison to non-urgent
volumes. This is not due to mitigation strategies such as a NUPT system but rather due to the fact that
the older population is creating a greater need for emergency response. A reduction of these non-
urgent calls would thus create a resultant increase in paramedic service capacity to respond to
emergency calls, furthering the path towards an optimized model.
Airport call Volume in Support of Provincial Centralized Health Care
HSN, as a hub hospital depends on the movement of patients between the Hospital and Airport to be
carried out on demand, and on time in order to maximize overall health care system effectiveness. As a
necessary part of a provincial health care system, inter-facility patient transfers between health care
facilities must be performed. Lower acuity inter-facility patient transfers over 240 kilometres (one-way)
are completed by Ontario’s Provincial Air Ambulance system, Ornge Ambulance, through the utilization
of third party air carriers. These air carriers do not currently have a mechanism in place to transport
their patients to and from the airports and rely upon local Ambulance resources to perform this task.
The increasing emergency call volume within the city makes completion of the calls between the airport
and the hospital more difficult. This challenge continues to result in negative impacts on patients, their
caregivers, and the hospital, while increasing health care costs and eroding public confidence in the
overall health care system. According to Ornge, the Sudbury Airport has the third highest volume of
patient movement within the Province. As depicted in the chart below there is a great volume and
correlating great amount of time spent on performing inter-facility transfers in support of the regional
healthcare system. It must be clearly understood that most of the patients seeking care from other
communities within HSN are not residents of the City of Greater Sudbury. Essentially the City is
financially supporting this provincial health care transportation model on our local tax levy. The
average length of time on an airport call is approximately 78 minutes.
YEAR VOLUME TOTAL TIME (hrs:min)
2015 1502 2016:09
2016 1356 1831:52

Fire and Paramedic Optimization Report
Page 53
Paramedic Services has been seeking methods to mitigate this issue. Next steps will involve entering
into discussions with the MOHLTC and Ornge to explore opportunities to service the lower acuity calls
through an alternate service model. This model would have the added benefit of assisting the air
carriers through a reduction of air carrier detention fees, while additionally providing a much needed
timely and predictable movement of patients. The solution to this problem will require both innovation
and a commitment from the MOHLTC, Ornge, and the City to come to the table to implement a
successful and proactive solution that could further reduce call volumes for the service. This is yet
another example of the path towards optimization currently underway in Paramedic Services.
Dispatch Transformation
Statistical call data indicates that the current dispatch triage tool (Dispatch Priority Card Index Version 2)
prioritizes more than 60% of all calls dispatched as life threatening (lights and siren response) while less
than 20% transported to hospital are prioritized as emergent. The MOHLTC is undertaking
transformational change in the Provincial dispatch centres to modernize their medical triage tools. Once
implemented this could result in a reduction in high priority calls by 20%. A new triaging tool that is
more accurately able to identify the proper acuity of patients opens up opportunities to better
coordinate lower acuity calls directing them to alternate health care pathways to better meet the
patients’ needs while at the same time freeing up ambulance resources.
Improved triage capability within the Provinces 22 dispatch centres open further opportunities for new
strategies to divert patients away from hospital emergency departments and unnecessary ambulance
transport in favour of community based care in a coordinated pro-active manner with an aim to reduce
the escalating demand on ambulance resources. While these alternate clinical pathways will likely take
years to develop, the new triage system being implemented could occur within the next couple of years
and could have an immediate impact on call volumes. It is important to monitor this emerging issue
closely to determine if it will result in increased ambulance call capacity. In the event the new triage
system implementation is delayed, or not anticipated to yield the desired results, the service will need
to consider additional ambulance resources to keep pace with the escalating call volumes.
Operational Control of Dispatch
For a number of years, the City of Greater Sudbury has been investigating the feasibility of integrating
land ambulance dispatch, a function administered by the MOHLTC, into the City’s dispatch system for 9-
1-1, Police and Fire. An integrated dispatch model has the potential to increase service coordination and
improve overall administration of the services.
In 2014, a comprehensive study was undertaken to examine the integration of emergency service
dispatch services in Sudbury. The results of that study supported full integration of Paramedic Service’s
dispatch with the City’s 9-1-1, recommending Police and Fire as the preferred emergency
communications services system model for the City of Greater Sudbury. To complement this suggested
integration, City Council adopted the following resolution on April 17, 2012:

Fire and Paramedic Optimization Report
Page 54
THAT the City of Greater Sudbury undertake a feasibility study to achieve a fully integrated
Emergency Communications Services System for Greater Sudbury, and
THAT the Chief of Emergency Services working with Police Services and the Office of the Chief
Administrative Officer develop a Business Case for the consideration of Council and submission to
the Ontario MOHLTC.
The next step on this initiative involves the development of a Business Case in partnership with the
MOHLTC in support of a pilot project for a fully integrated Emergency Services Dispatch Centre.
Community Paramedicine
It is well documented that the aging population is a key driver of increased calls for paramedic services;
a trend which is projected to continue to increase over the next 20 years. Currently, patients 60 years of
age and older represent almost 60% of Greater Sudbury Paramedic Service’s total call volume, with a
forecasted increase of 33% in service request volume for cohorts 65+ over the next eight years. Frailty
and disability are consequences of advanced age. Additionally, the elderly often suffer from complex
inter-related health and social problems that make them highly vulnerable to serious, while potentially
preventable, adverse outcomes.
The Community Paramedic Program is a paradigm shift from traditional emergency response to pro-
active preventative strategies with the goal of slowing the escalation of emergency calls. Many older
adults are homebound and have access challenges to medical care and often suffer higher rates of
complex and multiple illnesses including dementia and functional impairments. These measurements
clearly demonstrate the need for Paramedic Services to focus more on proactive and preventative
Community Paramedicine programs to address seniors' needs and chronic disease in the home with
support from community based programs.
Dr. Samir Sinha, the Provincial Lead on Ontario’s Seniors Strategy in his 2012 report “Living Longer,
Living Well” has recommended the development and expansion of Community Paramedicine Programs
that can offer significant contributions to improvement of health care in Ontario. The MOHLTC
continues to consult with healthcare stakeholders including the Ontario Association of Paramedic Chiefs
(OAPC) and Municipal Paramedic Services to determine advancing the development of a provincial
Community Paramedicine program.
A number of pilot Community Paramedicine Programs have arisen across Canada. These programs
utilize paramedics in an enhanced role in screening, community health referrals, and diverting patients
from the Emergency Department to more appropriate community-based services.
In the fall of 2013, the MOHLTC in partnership with the OAPC funded work on a Provincial Community
Paramedicine Toolkit aimed to support the roll-out of a standardized and evidence-based community
paramedic referral program. These assessment tools enable paramedics, with a patient’s consent, to
make a direct referral to appropriate community agencies, the most common being the Community
Care Access Centre (CCAC). Greater Sudbury Paramedic Services is an active participant in this
innovative program.
Fire and Paramedic Optimization Report
Page 55
Paramedic Services is also currently active in several other Community Paramedicine initiatives. These
programs generally focus on three key areas: Prevention/Education, Intervention, and Diversion
Strategies. These community initiatives are all aimed at improving the quality of life for City residents
focusing on three overarching themes of innovation, building capacity, and creating synergistic
partnerships while hand in hand continuing in the provision of first-class emergency services that are
responsive, reliable, timely and safe.
Greater Sudbury Paramedic Services is actively involved in many prevention and education programs
including:
CP@Clinic (Community Paramedic at Clinic program formally The Community Health
Assessment Program though Emergency Medical Services) – focused wellness clinics and overall
health checkups
Care Link Medical Information – magnetized fridge file holders that were developed in Sudbury
and have now been used in other areas of the province to provide quick easy access to timely
medical information in an emergency.
Prevention of Alcohol Related Trauma in Youth (PARTY) Program – partnership with Health
Sciences North Trauma Program aimed at providing education for high school students on the
dangers of alcohol and increased risk of trauma in our youth.
The City’s Public Access Defibrillator (PAD) program coordinated through Paramedic Services has
placed 120 units within the City in partnership with the Heart and Stroke AED program.
Public CPR training in conjunction with the PAD program which aims to encourage citizen CPR
and use of the public access defibrillators to help decrease out of hospital sudden cardiac arrest
deaths.
In terms of intervention programs since 2011, paramedics have been able to submit “Community Health
Concern Reports” to the Service. These reports identify patients who are faced with challenges in the
home that may result in a medical crisis or a loss to their independent lifestyle. Conditions such as an
unsanitary living environment or “failure to thrive” are of concern as these situations could indicate a
level of benefit from additional community intervention and/or support. Submission of these
reports results in a case review and typically some type of referral process from the Paramedic Service
to community partner agencies that aims to address the patients unmet needs.
Paramedic Services also works to identify patients who have a high utilization service. Only about 40% of
those high-use patients will accept additional assistance aimed at reducing their dependency on
paramedic services, but for those who do accept the additional assistance there has been a 65%
reduction in the use of paramedic services. The reverse trend is true for the frequent users of
Paramedic Services who refused service intervention as there was an average increase of 8% across the
year.
Discussions have been ongoing between Paramedic Services and HSN Mental Health and Addictions on
diversion strategies that would see patients transported by paramedics to specialized clinics and

Fire and Paramedic Optimization Report
Page 56
treatment centres within the community. This Diversion strategy is aimed at decreasing non-acute
transportation to the Emergency Department (ED) reducing ED overcrowding, but most importantly,
more appropriately meeting the patient’s needs. Through this program a further reduction in the
utilization of Paramedic Services can be realized.
There is strong evidence to suggest that community paramedics can support patients in their homes
outside of the traditional institutional care model. This support, in turn, reduces 9-1-1 calls
for paramedic response, Emergency Department visits, and hospital and long-term care admissions.
These types of reductions have the ability to result in cost savings in comparison to the traditional model
of institutional health care with an added opportunity for a re-investment of these savings to ensure the
long-term sustainability of Community Paramedic Programs.
Continuing partnerships with and memberships in various Community Networks and Strategy tables (for
example Community Drug Strategy, Sudbury Road Safety Committee, Community Mobilization Sudbury,
Health Links Sudbury) will help at ensuring best practices in public and community safety.
The Paramedic Services division continues to advocate for an integrated Community Paramedicine
Program within The City of Greater Sudbury with an aim of further optimizing of the overall department.
Key messages of this section:
- Paramedic Services is a highly regulated service that is required to report on their performance
on an annual basis not only to City Council, but to the Province through the Ministry of Health
and Long Term Care.
- Since responsibility for the Land Ambulance Act was downloaded to municipalities in 2000,
Paramedic Services has continued to evolve their service delivery model through regular
review and analysis of performance metrics, followed by implementation of improvements
over time resulting in the achievement of a sophisticated and optimized, One City One Service
model that has evolved to meet the changing demands of the service responding to nearly
90% of the population in a timely manner making them one of the top ten performers in the
province.
- The analysis identified a few challenges for Paramedic Service including: need for a full-time
scheduler to help manage over 150 paramedics and support staff; imbalance of full-time
Emergency Vehicle Technician hours needed and those available; station locations that were
chosen based on existence in the general area, and not necessarily in the best site; stations
that were moderately modified to accommodate the service, but do not fully meet the needs
of the service.

Fire Optimization Report

Fire and Paramedic Optimization Report
Page 57
ANALYSIS OF CURRENT MODEL - FIRE SERVICES
What you will learn in this section:
Overview and analysis of Fire Service operations
Understanding of legislation and standards for fire service delivery
Lack of changes to service since amalgamation of seven distinct fire services
What is the Fire Underwriter’s Survey and what is their involvement with Fire Services
Numerous challenges that Fire Services is trying to manage with limited resources
Fire Services is responsible for delivering what is known as the, Three Lines of Defense: public fire safety
education, fire safety standards and enforcement (fire prevention) and emergency response (fire
suppression). Public education includes: visiting schools to educate students on fire safety and home
escape plans; educating seniors and other vulnerable segments of the public; and informing the
community about seasonal safety issues, such as Christmas tree safety and winter ice conditions. Fire
prevention includes several types of inspection programs such as: request and complaint inspections;
vulnerable occupancy inspections; building construction and renovation plans review; and targeted high
risk inspections. Emergency Response includes fire suppression and fire rescue in relation to actual fires
and also includes response to medical emergencies (in assistance of paramedic services) and technical
rescues such as auto extrication, ice and water rescue, confined space, trench, and hazardous material
(HAZMat) response.
Legislation and Standard Setting
Fire Protection and Prevention Act (FPPA)
In the Province of Ontario, Fire Services are mandated under the Ministry of Community Safety and
Correctional Services and are governed under the authority of the Fire Protection and Prevention Act
(1997). The Act makes fire education and fire prevention services mandatory in all communities, but
allows fire suppression levels to be set by the municipality (Council with the advice of the Fire Chief),
based on “local needs and circumstance.” This permissive legislation for fire suppression encourages
the individual municipality to set individual emergency response service levels. In the City of Greater
Sudbury, the Establishing and Regulating Bylaw 2014-84 (see Appendix #R4) is designed to identify the
levels and types of services offered, and not offered throughout the community, and any exceptions to
the services outlined. It also identifies the fees associated with certain services, if any.
The reference to ‘local needs and circumstance’ is the expectation in the legislation for the individual
municipality to identify the risks in place in the community, and design its response capabilities to
address them. Included in the risk assessment is the identification of the risks not only for fire
response, but also for the related disciplines of technical rescue, HAZMat response, and medical tiered
response. The above are known as the service types and are offered at varying service levels.

Fire and Paramedic Optimization Report
Page 58
National Fire Protection Association (NFPA)
The service levels for each of the three lines of defense are identified by Fire Administration and are
based on levels established primarily by the National Fire Protection Association (NFPA). The NFPA is an
internationally recognized authority on fire department operations, including prevention, education and
response. Amongst its programs, the NFPA develops and maintains a series of guidelines and standards
for fire operations which are created by committees of stakeholders including fire administration, front-
line employees, career and volunteer organizations, including labour, business, industry, and regulating
bodies. These standards and guidelines are neither regulation nor law, but have been recognized
worldwide as best practice.
In determining service levels, NFPA has created the following criteria in order from most basic to highly
specialized. These training and response levels are identified in both NFPA 1670 Standard on Operations
and Training for Technical Search and Rescue Incidents and in a much more thorough way, in NFPA 472
Standard for Competence of Responders to Hazardous Material/Weapons of Mass Destruction Incidents.
The levels of capability are:
1. Awareness – This level represents the minimum capability for response, generally limited to
scene security.
2. Operations – This level represents the capability to respond and mitigate an event in a defensive
fashion, and support an agency trained to operate at a higher service level.
3. Technician – This level represents a capability to respond and mitigate an incident in an
aggressive fashion, using advanced training and equipment.
4. Specialist (HAZMat only) – This level is reserved for incidents and hazards of special impact or
unique response parameters.
The recognition of these service levels, and the NFPA Standards associated with them as ‘industry
standard’ and/or ‘industry best practice’ can lead to serious consequences for fire services. These
standards, while not having the same authority as legal regulation, are strongly encouraged to be
adopted as minimum standards by industry stakeholders. For example, the insurance industry has
accepted many of them as customary practice, and enforces them for their own purposes, while
expecting fire services to as well in their operations. In addition, the Ministry of Labour, in its
enforcement of the Occupational Health and Safety Act (OHSA) in particular Section 25.( 2), (h), widely
known as ‘due diligence’, does enforce these industry best practice standards as the de-facto regulation
for operations.
NFPA has released two standards which are considered as industry best practice for recommended
staffing at emergency response. NFPA 1710 Standard for the Organization and Deployment of Fire
Suppression Operations, Emergency Medical Operations, and Special Operations to the Public by Career
Fire Departments is the standard which identifies the expected response by an urban fire department.
NFPA 1720 Standard for the Organization and Deployment of Fire Suppression Operations, Emergency
Medical Operations, and Special Operations to the Public by Volunteer Fire Departments refers to the
performance expectations of volunteer departments, but also for composite departments.
Fire and Paramedic Optimization Report
Page 59
Fire Underwriters Survey
The Fire Underwriters Survey (FUS) is a national organization that provides data on public fire protection
for insurance underwriting purposes and establishes a Public Fire Protection Classification (PFPC) grade
between one (best) and 10 for each fire department. The intent of the PFPC grade is to provide a
standardized measure of the ability of the fire department to prevent and control fires that may be
expected to occur and compare that level of protection against the level of fire risk in the community.
FUS also sets a Dwelling Protection Grade (DPG) between one (best) and five for underwriters to
determine personal property insurance rates for detached dwellings not exceeding 3600 sq ft. The FUS
grading system considers fire potential based on the physical structures and makeup of the community
environment when determining both the PFPC and DPG grades. A change of one rating point for a fire
station’s PFPC grade has an impact of approximately 10 per cent on the fire protection insurance for
commercial properties. Changes to DPG grades can have a similar impact on residential insurance rates,
however it is important to remember that there are several key factors which must be in place for
residents and business owners to realize the benefits of these improvements. They must be in a hydrant
protected zone, and they must be within 8 kilometres of the applicable fire station (5 km for commercial
buildings).

Fire and Paramedic Optimization Report
Page 60
The table below summarizes dwelling protection grade terms of reference for residential properties.
Further details can be found in (see Appendix #R1).
Grade Description
DPG 1 Career, Fully Protected
Indicates to insurers that a superior level of response to a residence is located within 8
km of a career or composite fire department with reasonable staffing and with
recognized water supplies.
DPG 2 Composite, Fully Protected
Indicates to insurers that an intermediate level of response to a residence is located
within 8 km of a primarily volunteer fire department with limited staffing and
recognized water supplies.
DPG 3A Volunteer, Fully Protected
Indicates to insurers that a minimum level of response to a residence is located within 8
km of a primarily volunteer fire department with recognized water supplies.
DPG 3B Volunteer, Standard Shuttle, Semi-Protected
Indicates to insurers that a minimum level of response to a residence is located within 8
km of a primarily volunteer fire department without recognized water supplies
DPG 4 Volunteer, Limited Protection (Semi or Unprotected)
Indicates to insurers that the fire department is recognized however there are serious
deficiencies in at least one area of fire protection that prohibit a minimum level of
response.
Normally given to communities with only one piece of apparatus and no recognized
water supply (hydrant).
*Minimum volunteer response pool of 15 firefighters
Greater Sudbury Fire Service contacted FUS to initiate a full fire service review in order to generate an
up-to-date rating for the insurance industry to reference when insuring properties in the City of Greater
Sudbury. This served two purposes: to act as an independent third party in the assessment of the
efficiency of the municipal fire service without bias, and to provide an expectation of a reflection of
savings to the community in the way of reduced fire insurance premiums under an Optimized model.

Fire and Paramedic Optimization Report
Page 61
The review performed in 2015/2016 allowed FUS to update the two ratings for the City of Greater
Sudbury for the first time since the late 1980s. The entire FUS report, including the updated ratings on a
station-by-station basis can be found as an appendix of this report (see Appendix #R1) with some details
of the evaluation being embedded within the correlated sections of this report.
Staffing
In the provision of the Three Lines of Defense Greater Sudbury Fire Services is composed of Fleet,
Training, Prevention/Education, and Operations.
The Fleet Section consists of a Chief Mechanical Officer and a Fire Services Technician who in
combination, are tasked to acquire, service and maintain the 73 large response vehicles, approximately
20 small fleet vehicles and all of the equipment required in the delivery of the service. This division also
handles the maintenance of the 24 Fire/Emergency Services Stations that fall within the Fire Service
scope.
The Training Section consists of a Chief Training Officer and two Training Officers who develop and
deliver core and specialty training to firefighters. They also provide assistance and recommendations in
the development of proactive strategies in equipment procurement and usage and service delivery.
The Fire Prevention and Education Section consist of a Chief Fire Prevention Officer, a single Public
Safety Officer and six Fire Prevention Officers. The mission of the Prevention Section is to deliver
focused education programs to the 97 schools, 78 day cares, 51 seniors’ facilities and 57 care and
treatment facilities located in the city. This Section also provides Building Services consultation
regarding the Fire Code as it relates to building construction and renovation. The overarching goal of
the section is to enforce Fire Code compliance of the city’s 63,582 residential, commercial and industrial
buildings. Achieving these goals is accomplished through scheduled inspections of vulnerable
occupancies, as per regulation, and Complaint and Request Inspections. Complaint Inspections are
generated as a result of a public complaint regarding the fire protection in a building, while Request
Inspections are performed at the request of the owner, and are often associated with the sale of a
building. The Fire Service currently does not offer any other type of regular preventative inspections,
such as targeted inspections of high risk buildings, despite these inspections being recommended by the
insurance industry.
The Fire Underwriters Survey evaluated the City’s prevention and education activities during their
analysis. For prevention, the ability to inspect, enforce, and utilize the Fire Code and municipal by-laws
in order to manage the level of fire risk throughout the community was measured. The FUS frequency of
inspection schedule and total occupancy numbers, and Municipal Property Assessment Corporation’s
(MPAC) classifications, identified that fire prevention and education services are provided at a less than
adequate level, and are offered across the city at a standard that varies in the career, composite and
volunteer areas.
Further to their evaluation, FUS considers community risk reduction programs, public education
programs, and information provided to occupancies for items such as code enforcement, building codes,
or fire loss occurrences. They then develop a score on the ability of the fire service to achieve these

Fire and Paramedic Optimization Report
Page 62
within the community. The evaluation conducted by FUS for prevention and education activities
demonstrates the need to make improvements to mitigate risks that exist in the community.
The Operations Section operates as the emergency response arm of the service. Often called the
Suppression branch of fire services, it consists of four career Platoon Chiefs, 24 career station Captains,
35 volunteer Captains, 17 volunteer Lieutenants, 80 career firefighters, and 209 out of a budgeted 350
volunteer firefighters as of December 31, 2016. Greater Sudbury has a composite fire service which by
definition means that operations include the use of both a career and volunteer firefighter force.
Consideration in the provision of Fire Response Service must be given to the varying service levels
identified in each the career, composite and volunteer response areas. These three levels of response
are established, operated and maintained in significantly different ways, and return significantly
different performance outcomes.
Career Firefighters
The Fire Protection and Prevention Act defines a firefighter as, “a fire chief and any other person
employed in, or appointed to, a fire department and assigned to undertake fire protection services, and
includes a volunteer firefighter.” In the city core (former City of Sudbury), full-time career firefighting
services are provided at four stations which are staffed 24 hours a day, seven days a week. These
stations include: Van Horne, Minnow Lake, Leon Street (New Sudbury) and Long Lake Road. A minimum
of four career firefighters are on duty at all times, with the Van Horne station having an additional four
firefighters to operate the aerial truck.
Firefighting is a rather unique profession, and a brief description of operations is warranted. A team of
four firefighters working together in a station work on the same truck and operate entirely as a single
unit response. When the vehicle leaves the station for any reason, whether going for fuel, training,
proactive pre-planning of buildings, community service or in response to a call, the team remains
together at all times. For the entirety of their 24-hour shift, all firefighters are fully on duty and operate
as what could be described as a pit crew when responding to an incident. Each seat within the fire truck
has an assigned duty for each type of response including a Captain (supervisor) who is in charge of the
entire crew. On any given day, all stations and crews (career and volunteer), the Platoon is directed by a
single Platoon Chief.
Composite firefighting is not a classification of firefighter but rather a designation whereby response is
accomplished with a team of both career and volunteer firefighters. Composite firefighting service is
only provided at the Val Therese Emergency Service Station. This station maintains a minimum staffing
of two career firefighters 24 hours a day, seven days a week and is augmented by volunteer firefighters.
The two person crew operates in similar fashion to the career crew, with the obvious observation that
the truck has only the driver and officer seats occupied. On arrival on the scene of a fire, interior rescue
and/or fire attack is dependent on the arrival of additional firefighters from the volunteer complement.
Career staff at the Val Therese station also provide support for calls to the Val Caron and Hanmer
stations.

Fire and Paramedic Optimization Report
Page 63
All career firefighters, including those working in Composite station staffing, receive 288 hours of
training per year. Instruction is provided by the Captain on a daily basis, with occasional instruction by
the Training Officers for subjects of special challenge or significance. Attendance is mandatory as it is
provided during regularly scheduled shifts. Any training missed due to vacation or illness is made up by
the firefighter at a later date. An annual training event is also undertaken at the Fire Training Grounds
located at the Lionel E. Lalonde Centre (Headquarters) with participation by both career and volunteer
firefighters.
Volunteer Firefighters
Volunteer firefighters are an integral part of the fire services delivery model in Greater Sudbury. The
FPPA defines volunteer firefighters further as “a firefighter who provides fire protection services either
voluntarily or for a nominal consideration, honorarium, training or activity allowance.” Volunteer
services are provided at 19 fire stations throughout the city in the more rural areas. They include:
Azilda
Beaver Lake
Capreol
Chelmsford
Coniston
Copper Cliff
Dowling
Falconbridge
Garson
Hanmer
Levack
Lively
Red Deer Lake
Skead
Val Caron
Vermillion Lake
Wahnapitae
Waters
Whitefish
Volunteer firefighters are not posted at their stations like career firefighters, but respond when paged
from wherever they may be at the time of the incident. As outlined in Schedule B, 1a of the Collective
Bargaining Agreement between the City of Greater Sudbury and volunteer firefighters; “A volunteer
firefighter will respond to an alarm when he is available to respond. Each firefighter shall determine at
his discretion when he is available to respond to an alarm, subject to the minimum attendance
requirements set out in this agreement.”
Presently, the City and CLAC have not agreed to a minimum attendance standard, and therefore
individual employee attendance to incidents is entirely discretionary. As a result, volunteer firefighter
attendance is neither guaranteed nor consistent in these volunteer serviced areas. While many
volunteer firefighters maintain an excellent attendance record, the overall average attendance at
incidents was 32.1% in the 2016 calendar year which can be a challenge when responding to larger
incidents. Further details and analysis on volunteer attendance can be found in Appendix #T4.
The chart below demonstrates the attendance rate at incidents that each volunteer firefighter attended
in their assigned station against the total number of incidents the station was dispatched to in its
response area, also known as the fire beat. The blue area identifies the percentage of all incidents that

Fire and Paramedic Optimization Report
Page 64
each volunteer firefighter attended and conversely, the pink coloured area shows the percentage of all
incidents that a particular firefighter did not attend. In summary, about 75 (shown by the solid vertical
line) of the total 260 volunteers attend incidents at least 50% of the time (as shown by the dashed
horizontal line). A review of incidents within the district shows a similar result with about 70 of the 260
volunteer firefighters attending these incidents 50% of the time. Further details on volunteer firefighter
attendance can be found in Appendix #T4.
Volunteer firefighters are paid an honorarium for their services when they respond to incidents or
attend paid training sessions. The current training model for volunteers provides instruction one-night-
per-week at each station, with a maximum payment amount of six hours per month (72 per year). Some
stations provide additional training with no monetary compensation. Additionally, volunteers are paid
to participate in four hours of mandatory annual training with career firefighters at the Lionel E. Lalonde
Fire Academy.
Similar to incident response is the requirement for volunteers to attend training. As outlined in
Schedule B, 3a of the Collective Bargaining Agreement between the City of Greater Sudbury and
volunteer firefighters (CLAC): “The Employer shall schedule regular weekly training periods at each
station that volunteer will attend at their discretion, subject to attendance requirements.” Once again,
there has been no agreement achieved between the parties regarding attendance requirements for
volunteer attendance at training, and thus training attendance, and the resultant skill set, remain
discretionary based upon the will of the volunteer to attend.

Fire and Paramedic Optimization Report
Page 65
In 2016, the overall average for attendance at training by all volunteers was 37.31% and attendance
hours ranged between two and 134 hours during the year (see Appendix T#4). It was observed that
volunteers attended training more often when paid for their time (66.2%) versus unpaid training (8.8%).
This may demonstrate the need for a more flexible training curriculum and perhaps additional paid
training opportunities to encourage volunteer firefighters to attend training. Exit interviews provided
by resigning volunteer firefighters regularly note the challenge of aligning their family life with the
expectations of a restrictive training model. Frequent training can help to ensure skill and ability is at its
finest level, especially in those areas where call volume is low and infrequent and practical application is
intermittent.
Another challenge of utilizing a volunteer firefighter force is the high attrition rate. Similar to much of
Ontario, Greater Sudbury Fire Services experiences an average loss of about 18% of their volunteer
firefighters per year. This is often due to challenges from competing priorities of work, home, social and
community involvement, resulting in an inability to be a meaningful, participating volunteer. This is
terminology associated with the expectations of FUS, but the expectations for attendance associated
with it are items to be negotiated with the CLAC to identify acceptable thresholds for training and
incident attendance.
During the public information sessions, it was clear that volunteer firefighters are highly recognized and
valued in their individual communities for their great participation and support of local events. They are
seen as having a good sense and familiarity of neighbourhood characteristics and residents may fear
that outside career firefighters would not be as knowledgeable of the intricacies of smaller communities
like Beaver Lake, Skead, Capreol and Wahnapitae.
It is important to note the importance that the volunteer response model presents to the optimized
response model, and that the volunteer service is crucial to its success. As such, the recruit training, the
ongoing training, and the efforts of recruiting and retention of quality volunteer staff is of the utmost
importance. A meaningfully participating, well-trained volunteer firefighter represents a significant
investment for Greater Sudbury Fire Services, and can represent an important return on this investment
for the community. As was noted in the Final IBI Report, March, 2014:
“We recommend that GSFS should consider developing an ongoing evaluation process to assess
the quality and effectiveness of the Training Program against the curriculum being used. They
should investigate / take advantage of opportunities to combine volunteer and career training,
to promote unity in operations and reinforce the ‘one department’ philosophy.”
This assessment has been confirmed by the analysis for optimization, and the recommendation for
cooperative training has been incorporated.

Fire and Paramedic Optimization Report
Page 66
Stations and Fleet
Location of Stations
The Greater Sudbury Fire Service Division operates and maintains 24 fire stations, eight of which are co-
habitated with Paramedic Services. Fire and Paramedic Services Headquarters is currently located in
Azilda at the Lionel E. Lalonde Centre (LEL), which also houses the Azilda Fire Station. The location of
Headquarters is removed from the bulk of employees, and as a result there is a disconnect between
administration and those delivering front-line services. While many organizations operate with a
number of distinct locations without issue, this separation of management from the front-line workforce
increases the risk of poor communication and real-time feedback. For Fire Services, this risk has been
fully realized.
The LEL Headquarters location also serves as the central maintenance site and supply and equipment
warehouse for the service. While consideration has been given to the creation of district storage areas
for crucial supplies, the size and layout of the current stations does not make this a viable option. The
distance from the bulk of the front-line staff creates logistical bottlenecks and supply inefficiencies
during daily operations. The impact is even more notable during emergency events of large size and
impact, when equipment and supplies must be transported from Azilda to the location of the incident.
Furthermore, there is no dedicated 24 hour staffing in the Fire Services Division at the Headquarters in
Azilda and thus incidents that occur outside of regular business hours (8:30 a.m. to 4:30 p.m.) can
experience delays in the supply of requested equipment at these times.
The following map details the current location of the stations as well as the fire beat, which is the
surrounding geographic area associated with each station’s response borders.

Fire and Paramedic Optimization Report
Page 67

Fire and Paramedic Optimization Report
Page 68
All of the current stations were assumed at amalgamation; however the stations were originally located
to service the former communities in which they were built without consideration of operational
advantages that could be realized if they were considered as part of a network instead of an individual
location. Since amalgamation and prior to the IBI study of 2014, no consideration had been made to
station location that would best serve the City of Greater Sudbury as a whole community.
The implications of this lack of adjustment were observed in the analysis report provided by FUS when
they scored the Public Fire Protection Classification (PFPC) and Dwelling Protection Grade (DPG) for
Greater Sudbury Fire Services. During their assessment, FUS measured the ability to appropriately
respond and attack a fire, taking into account the required water supply (through hydrants, water
mains, tanker shuttles), initial response (first due apparatus), fire department resources and logistics,
communications and dispatching, pre-incident programs, personnel and staffing levels, and operational
training. The results of their assessment showed that some of Greater Sudbury’s stations are not in
locations that allow them to efficiently back each other up and/or provide coverage to parts of the
community that duplicate the coverage provided by other nearby stations.
A review of response drive distances for each station, based on NFPA guidelines of 8 km for residential
buildings, and 5 km for commercial and industrial buildings is part of FUS’ analysis. These drive time
distances were used to generate response maps for each station to assist in identifying both duplication
and gaps in service.

Fire and Paramedic Optimization Report
Page 69
Waters and Lively Stations (Walden Area) Overlap of Service
The map above exhibits hydrants in the community of Walden, located in the southwestern portion of
the city. The yellow shaded polygon above represents a 5 km driving distance response, the NFPA
guideline for commercial property protection, from the Waters Station. The blue shaded polygon
represents the same distance response from the Lively Station. These polygons overlap to create a grey
shaded polygon demonstrating a duplication of fire protection services in this area. In consideration of
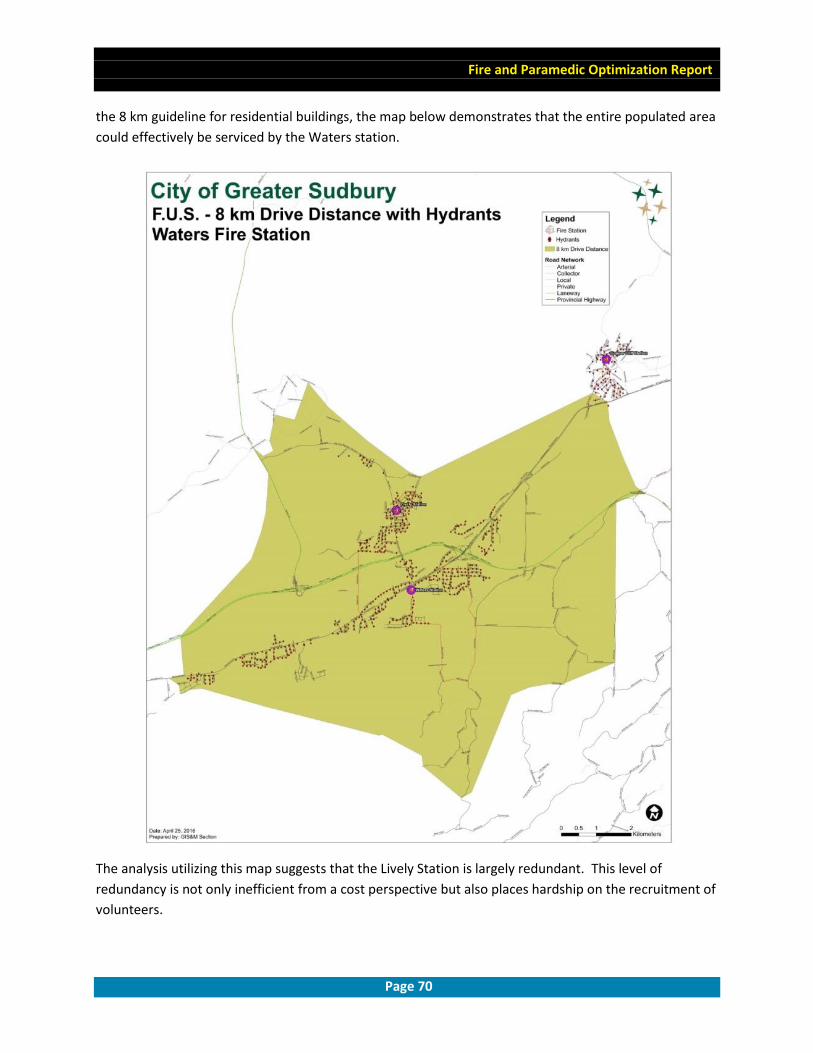
Fire and Paramedic Optimization Report
Page 70
the 8 km guideline for residential buildings, the map below demonstrates that the entire populated area
could effectively be serviced by the Waters station.
The analysis utilizing this map suggests that the Lively Station is largely redundant. This level of
redundancy is not only inefficient from a cost perspective but also places hardship on the recruitment of
volunteers.

Fire and Paramedic Optimization Report
Page 71
An example of volunteer recruitment revealed through the series of public information sessions on this
subject, would be the case of the Town of Espanola. The Town of Espanola with one fire station was
able to successfully recruit a large number of volunteers. The land area of Espanola based on 2011
census data is just less than 83km2 with a population of nearly 5,000 people. In the case of the Waters
and Lively stations, both stations exist within the Lively Population Centre as per the 2016 Census. Lively
has a population of 5,608 with a geographic area of just over 9 km2. Having nearly the same number of
residents as Espanola, the Lively area is required to support two volunteer fire stations. This
redundancy drives the need to staff two volunteer stations with a population base not much different
than Espanola. If there were only one station within the Lively area there would be a full complement of
volunteers.
Similar analysis follows which identifies that these redundancies exist among a number service areas in
the city, most notably Valley East, Garson/Falconbridge, Wahnapitae/Red Deer Lake, Chelmsford/Azilda
and Long Lake/Van Horne/Copper Cliff.
Valley East Overlap of Service

Fire and Paramedic Optimization Report
Page 72
The Map above identifies the overlap of service represented by the three stations in the Val Caron, Val
Therese and Hanmer Stations. While redundancy of service is important in higher risk areas, this
redundancy is provided by the appropriate vehicle assignment for the area, and is not dependent on the
number of stations. In the case of Valley East, the appropriate number of trucks in two stations provides
superior response at a reduced long term cost.
The above map serves to identify the coverage the community of Falconbridge receives, from Garson
Station in its current location. The recommended optimized location was specifically identified to
ensure continued coverage for Falconbridge.

Fire and Paramedic Optimization Report
Page 73
The above map identifies the 8 kilometre response distance associated with Wahnapitae Station, and its
coverage for the location for the Red Deer Lake Station, currently condemned and inoperable due to
structural damage.

Fire and Paramedic Optimization Report
Page 74
The above map identifies the 8 kilometre drive distance associated with the Chelmsford Station.
Relocation of the station, as recommended, to the intersection of MR 15 and Highway 144, allows for
full coverage of the town of Azilda where fire hydrants are present. Areas beyond hydrant protection
receive the lowest FUS grading applicable to the city.

Fire and Paramedic Optimization Report
Page 75

Fire and Paramedic Optimization Report
Page 76
As noted in the map above, the 8 kilometre response distance for Long Lake Station identified by FUS, completely services the community of Copper Cliff. Although not shown on this map, the 8km response distance for Van Horne Station also serves to fully protect the community of Copper Cliff.
One consequence of note relates to the insurance impact associated with this drive distance
phenomenon. Every residential building within 8 kilometres of a fire hall receives a value from that
station, and in the event that there are two stations protecting a residence, only the higher rated station
is counted.
The map for the Val Therese 8 kilometre response distance is provided below. This map indicates that
all residential buildings in the former City of Valley East receive the FUS valuation from the Val Therese
Station, including the residents living directly beside the Val Caron and Hanmer Stations. This is due to
the Val Therese Composite Station achieving a higher FUS valuation than the Hanmer and Val Caron
Volunteer Stations. A similar effect is demonstrated in other redundant coverage areas where one
station is ranked higher than the adjacent one, Garson Station for Falconbridge, and Leon (New
Sudbury) Station for areas of Garson. The areas where the station FUS rankings are equal operate with a
redundancy of service only and do not have positive insurance costing implications. In the example of
Chelmsford/Azilda, there is an overlap of service coverage with zero correlating improvement in
insurance rates.
This redundancy of service demonstrates that some historically located stations exist in an improper
location. It would further suggest that an opportunity exists to reduce the overall number of stations,
provided there is an overarching view to relocation as a whole, with a focus on minimizing redundancy
while attempting to improve services.

Fire and Paramedic Optimization Report
Page 77
Condition of Stations
The state of repair of the entire composition of stations was assessed in 2013-2014 through engagement
of the CCI Group, a private sector engineering firm. This group generated a significant report in which
they described an ongoing deficiency of capital investment in Greater Sudbury fire stations. This
deficiency requires an estimated $20.4 million to repair the stations in order to bring them up to current
standards. Furthermore, it was identified that the average age of the stations of over 40 years was high,
and that most were approaching the end of their expected lifespan. This report confirmed the general
observations of managerial and front-line staff that the buildings lack the essential functionality to
operate as fire stations, paramedic stations or shared stations. In fact, many of the stations are non-
compliant with applicable health and safety regulations for dual gender operations (for example
separate sleep quarters and shower areas).
A more detailed analysis of the costs associated with required building maintenance is provided in the
cost section of this report (see Appendix #F2). The table below provides a summary of expected station
repairs and maintenance over a ten year period identified from the analysis completion date of 2014.

Fire and Paramedic Optimization Report
Page 78
Total Estimated Repair and Maintenance Costs by Station
Station Amount
01 - Main $2,237,000
02 - Minnow Lake $695,000
03 - New Sudbury / Leon $780,000
04 - Lockerby / Long Lake $1,014,000
05 - Copper Cliff $739,000
06 - Waters / Walden $947,000
07 - Lively $367,000
08 - Whitefish $931,000
09 - Beaver Lake $528,000
11 - Chelmsford $834,000
12 - Dowling $792,000
13 - Vermillion Lake $413,000
14 - Levack $700,000
15 - Val Caron $740,000
16 - Val Therese $776,000
17 - Hanmer $555,000
18 - Capreol $881,000
20 - Garson $872,000
21 - Falconbridge $506,000
22 - Skead $528,000
23 - Coniston $495,000
24 - Wahnapitae $498,000
25 - Red Deer Lake $337,000
ES - HQ $3,318,000
Grand Total $20,483,000

Fire and Paramedic Optimization Report
Page 79
As identified in the CCI Engineering Group Building Condition Assessment report, their analysis of the
buildings was solely meant to determine the repairs and maintenance required to bring the buildings up
to the minimum requirement of the Building Code. It is very clear in the background documentation
that there is NO provision for:
A hazard assessment to identify hazardous materials such as asbestos
An energy audit to identify the efficiency of the stations
An audit of the stations compliance with the Accessibility for Ontarians with Disabilities
Act (AODA)
A full assessment of the station’s mechanical facilities, but instead provide only a
reference for replacement based on life-cycle, and expected longevity
The implications of these exclusions are considerable. Any exposures to risks associated with the four
items listed above are in addition to the estimated $20.4 million. Of particular concern is the fact that
none of the current stations are considered fully accessible as noted in the CCI Building Condition report
disclaimer. The report states that given “The City of Greater Sudbury has publicly indicated that they
are in compliance to both the Ontarians with Disabilities Act 2001 (AODA) and the Accessibility for
Ontarians with Disabilities Act, 2005 and supports the AODA’s primary goal (refer to City of Greater
Sudbury Multi Year Accessibility Plan).” The costs associated with achieving compliance with the
Accessibility legislation is not included in the station cost assessments, above.
As noted, the CCI Engineering Group Building Condition Assessment report was clearly focused on the
assessment of the buildings in relation to the Ontario Building Code and it did not consider the
Occupational Health and Safety requirements of a Fire and Paramedic Station. All of the stations
currently in use were designed and built in the 1950s, 1960s, 1970s or 1980s, and a single station was
built in the 1990s (Val Therese in 1993). While many of the stations have undergone significant
renovations and upgrades, it is notable that none of these included renovations to comply with the
Accessibility for Ontarians with Disabilities Act 2005 (AODA), nor have renovations focused on the
expectations of the Ministry of Labour Section 21 Sub Committee under the Occupational Health and
Safety Act. Additionally, several of the stations were not actually built as fire stations, but as municipal
garages, which were later adapted to Fire and/or Paramedic stations. As such, they were neither
designed nor built with the required infrastructure to operate a fire or paramedic service. Historically,
the fire service in particular has been a male dominated service and the design of the older buildings
reflects this in that no consideration was given to the needs of a dual gender workplace such as separate
shower and sleeping facilities.
The conversion of the previous garages into emergency services stations has also created a situation
where bathroom facilities lack showering capabilities. This is a mandatory requirement for a fire service
under the regulations associated with the Occupational Health and Safety Act (OHSA). Similarly,
although the connection between diesel soot and some forms of cancer are recognized in literature,
none of the current Fire and Paramedic Stations are equipped with point-source-capture of diesel
emissions.
Fire and Paramedic Optimization Report
Page 80
Point of source capture is the recommended practice in the Province of Ontario under the OHSA Section
21 Guidance Notes for the Fire Service. Under the guidance of the OHSA, each of the stations undergoes
a monthly inspection by a member of the OHS Committee. These inspections continue to identify these
and similar concerns which place a significant liability on the municipality under the Occupational Health
and Safety Act. Section 25 (2) (h) of the Act states an employer must “take every precaution reasonable
in the circumstances for the protection of a worker (e.g. to protect a worker from injury or getting a work
related illness).”
The combination of too many insufficiently-maintained stations, situated in inefficient and ineffective
locations has provided a unique opportunity to optimize Fire and Paramedic Services through the
relocation of services into new, modern, properly designed, and well-located stations aligning the
services in the community with the risks they are designed to protect. To respond quickly, emergency
response stations should be located on main roadways that provide easy access to multiple routes in an
area.
Fire Vehicles and Major Equipment
Fire Services Administration implemented a Fleet Rationalization Policy in 2014 to address the ongoing
issue of non-standard fleet and equipment, as well as to address vehicles and equipment operating
beyond their expected life cycle. Greater Sudbury Fire Services has a fleet of 73 major response vehicles
that were combined from the seven distinct fire services during amalgamation in 2001. In much the
same manner as with stations, the fleet has seen no alterations since that time. The challenge with
maintaining a fire fleet is significant. The vehicles are very expensive to purchase, operate and maintain,
and the consequence of a vehicle failure is often serious. The insurance industry, as represented by FUS,
expects that the vehicles will be designed, built and operated following the recommendations
entrenched in the applicable NFPA Standard: NFPA 1901 Standard for Automotive Fire Apparatus (2016)
Annex D - Guideline for First Line and Reserve Fire Apparatus. Of special note is life expectancy for fire
response vehicles, which is 20 years for front-line service. Vehicles in operation beyond this lifespan are
considered to be of no front-line service value by the insurance industry when calculating residential,
commercial and industrial insurance premiums. This contributes to higher insurance costs.
This expectation places a significant strain on the capital funding model currently in place. In fact, the
current investment in the fleet is materially below what is needed to maintain the fleet. Internal
analysis has identified the current capital shortfall in fire vehicles and major equipment to be $16.1
million (see Appendix F3).

Fire and Paramedic Optimization Report
Page 81
Service Level and Community Risk
Service Level
It is understood that Fire Services offers protection to the community in the forms of Fire Education, Fire
Prevention and Fire Suppression Response. What is less well known is that Fire Services offers additional
protection in the community as directed by Council, in the form of Technical Rescue (such as auto
extrication, water and ice rescue, rope rescue, confined space rescue and trench rescue), HAZMat
response, and MTR. For all of the services offered except Medical Tiered Response, Greater Sudbury Fire
Service’s is the service of last resort in that there is no other agency capable of offering these services,
and there is no adjacent community capable to assist in the response.
Fire Suppression Response
Fire suppression involves all of the activities in controlling and extinguishing fires. It is what generally
comes to mind when people think of the work completed by a firefighter. As per the Establishing and
Regulating By-law 2014-84 (see Appendix #R4), Fire Services currently attempts to deliver fire
suppression services across the city in a consistent fashion, meaning that the entire city is entitled to
both offensive and defensive fire response. Offensive fire response includes interior fire rescue and
attack, while defensive fire response is exterior only attack, with additional consideration for exposure
protection (adjacent buildings and vegetation). In 2016, Greater Sudbury Fire Services responded to
4,448 incidents of which 501 were fire calls. Of those, 254 were considered structure fires, therefore,
these incidents are frequent and the consequences, if not mitigated quickly, are significant.
While Fire Services commits to offering this service consistently throughout the city, the actual delivery
of the service is heavily dependent upon fire ground staffing levels, and effective response times in
establishing an initial firefighting complement of four firefighters and an effective firefighting
complement of 14 to16 firefighters.

Fire and Paramedic Optimization Report
Page 82
The diagram above details the progression of a fire over time, from when it starts, to when it’s fully
developed, to when it decays. The following is what can be described as the anatomy of a fire call. It is
important to understand that the following requirement falls in line with the resources and steps
required for Greater Sudbury Fire Services to successfully perform interior suppression and rescue
efforts on a residential, under 2,000 square foot structure in alignment with fire services best practice,
Occupational Health and Safety requirements, the Ministry of Labour Section 21 guidelines and Office of
the Ontario Fire Marshal guidelines.
Interior fire attack and rescue for incidents with no risk of collapse or entrapment can begin with four
firefighters, with a confirmed knowledge of additional resources en route. In the event that a fire is
more advanced, and where there is a risk of collapse or entrapment, interior fire rescue and suppression
cannot occur until 14 firefighters are on scene. These requirements are based on the National Fire
Protection Association (NFPA) 1710 and 1720 Response Standards. While these standards are not
currently officially adopted by Greater Sudbury Fire Services and are not enforceable in the province,
they are considered best practice and are considered as such by the Ministry of Labour and FUS, and
thus the insurance industry. In cases where legislation is absent or lacking, best practice principles
provide agencies with the greatest possible guideline and direction for safe operation of services.
Once 911 have been notified, the closest fire stations will be alerted. In the case of a career response
the dispatcher immediately notifies the station without operational delay via direct radio into the
station or truck if firefighters are responding to a call. Initially, three units will respond with a request for
a fourth unit to respond as rapidly as possible. Each unit will have four firefighters on each fire truck. As
each unit arrives, each firefighter will be assigned a critical fire ground task(s) as outlined by Fire Service
best practice and as required by legislation.

Fire and Paramedic Optimization Report
Page 83
In the case of a volunteer response, a second dispatcher receives the call and makes preparations to
notify the volunteers via pager. The volunteer paging system, as with any paging system that is not
hardwired into a location relies on a series of events such as picking the appropriate volunteer response
station, keying in the appropriate numbers, and then recording a voiceover message which will
accompany the tones on the waist pager. This causes an inherent operational delay of 20 to 60 seconds.
The units dispatched are currently done by station, with all vehicles in the station included in all
messages. Fire Services has a dispatch protocol in place to determine minimum vehicle response, but it
is not currently in use in the volunteer response area, pending introduction of the appropriate
technology.
Once at the incident, the first officer on scene is the Incident Commander, who is in charge of the
situation and will perform a quick external walk around to best determine a plan of attack. The
apparatus driver will be the Pump Operator, staying beside the truck and in control of the water supply.
The next two firefighters are on Hose Line duty, preparing to make entry upon notice of the imminent
arrival of additional resources. While the work of these four fire fighters establishes initial operations,
there is only so much they can do as they await the arrival of additional resources as required depending
on the size and severity of the fire.
Two more fire trucks would then arrive, for a total of eight more firefighters. One firefighter will serve as
an Accountability Officer for purpose of firefighter safety, keeping track of who is on the scene, where
they are and what they’re doing. Two members from one unit will serve as part of the Rapid
Intervention Team, standing by outside for fellow firefighters that may need support or rescue. The final
firefighter from this second truck acts as the second Tools and Pump Operator.
From the third truck, two firefighters will prepare to make entry with an additional hose line to search
the residence for possible occupants. The final two firefighters perform the role of Ladders and
Ventilation. This means they’ll place ladders up the wall and prepare to ventilate heat out of the roof.
One more unit would then arrive. From this unit, two firefighters will serve as a safety hose line for the
interior crews. The remaining two firefighters will complete the Rapid Intervention team as per
regulations. With 16 firefighters on the scene, the house would safely be entered and the fire
successfully controlled. As noted earlier, entry can be made with four firefighters on scene, if there is no
risk of entrapment or collapse and also when the 16 necessary are en route and arrival is known to be
imminent.
In the event of a fire in a larger structure, like a strip mall containing several businesses, there is a
requirement for 44 firefighters performing a variety of tasks.
Whether it is a residential home or a strip mall, the resources required in person power and equipment
to fight a fire is much more than what the initial unit of career or volunteer firefighters have at their
disposal. At minimum 16 firefighters are required for an interior attack on a fire where there is risk of
collapse or entrapment. Proper resources help ensure that Greater Sudbury Fire Services upholds its
mission to “prevent the loss of life and minimize the loss of property to fire and other emergencies,
natural or human generated”.

Fire and Paramedic Optimization Report
Page 84
The recommended response criteria in the NFPA Standards are: five minutes and twenty seconds (5:20)
for urban areas, nine minutes (9:00) for suburban areas and 14 minutes (14:00) for rural areas. All of
these time goals include an inherent chute or assembly time, which is the time from notification
(dispatch for career and pager notification for volunteer) until the fire truck leaves the station. In career
response areas, this chute time is recommended to be one minute and 20 seconds (1:20). There is no
defined time in a volunteer area. The actual average chute time for Greater Sudbury Fire Services is one
minute and 34 seconds (1:34) in the career response area, and five minutes and 48 seconds (5:48) in the
volunteer response area, according to 2015 response time data. The map below demonstrates the real-
time response data for the initial truck arrival, based on the assembly times as noted above, using 2015
data plus the required drive time. The green colouration identifies areas where trucks arrive within 5:20
minutes from dispatch time, yellow indicates a response time between 5:21 and 9:00 minutes, and red
indicates a response time between 9:01 and 14:00. Areas outside of these colourations indicate
response times longer than 14:00 minutes. The table below summarizes response time performance in
2015. See Appendix #T4 for further details.

Fire and Paramedic Optimization Report
Page 85
Protection Area
Percent response LESS THAN 6 MIN
Percent response LESS THAN 9 MIN
Percent response GREATER THAN 9
MIN
Average # of Firefighters
per Unit
Career 66.78% 83.66% 16.35% 4
Composite 50.03% 78.16% 21.83% 2.3
Volunteer 19.36% 50.57% 49.43% 2.8
See Appendix T7 for 2015 Average Response Time by Fire Beat.
In addition to response time, the number of firefighters arriving on the first truck to an incident is very
important to ensure effective fire ground staffing and the safety of not only firefighters, but bystanders
as well. NPFA Guidelines (Annex A) states that,
“the progression of a structure fire to the point of flashover (i.e. the very rapid spreading of the
fire to due superheating of room contents and other combustibles) generally occurs in less than
10 minutes. Two of the most important elements in limiting fire spread are the quick arrival of
sufficient personnel and equipment to attach and extinguish the fire as close to the point of
origin as possible”.
The tables below (taken from NFPA 1710 - Annex A) provides data on losses to life and assets based on
various stages of fire containment. As mentioned previously, the city core is serviced by four career
stations which operate five trucks with four responders per truck at all times. This guarantees that all
responses have initial staffing of four firefighters and that when necessary any incident can have a
response of twenty firefighters on scene within the limitations of the response times.
Rate per 1000 Fires
Extension Civilian Deaths
Civilian Injuries
Average Dollar (US$) Loss per Fire
Confined to room of origin 2.32 35.19 $3,185
Beyond the room but confined to floor of origin 19.68 96.86 $22,720
Beyond floor of origin 26.54 63.48 $31,912

Fire and Paramedic Optimization Report
Page 86
Rate per 1000 Fires
Extension Civilian Deaths
Civilian Injuries
Average Dollar Loss
per Fire
Confined fires or contained fire indentified by incident type 0 10.29 $212
Confined fire or flame damage confined to object of origin 0.65 13.53 $1,565
Confined to room of origin, including confined fires and fires confined to object 1.91 25.32 $2,993
Beyond the room but confined to floor of origin
22.73 64.13 $7,445
Beyond floor of origin 24.63 60.41 $58,431
The Val Therese Station in the former City of Valley East is a composite station staffed by both career
and volunteer firefighters. As a minimum, two career firefighters on a single truck are posted at this
station at all times ensuring that the first arriving vehicle will respond with that minimum number of
firefighters. This response area is dependent upon a volunteer firefighter response to augment the
guaranteed response for both the initial response (minimum of four firefighters) and the effective
response (minimum of 14 to 16 firefighters). This volunteer response is not guaranteed and response
times of volunteer firefighters vary and can result in a delay of the assembly time and overall fire ground
staffing. Additionally, there is an effect on the rescue at the scene under a model that does not have a
guaranteed full complement of four firefighters per truck, as four firefighters are required to perform
initial rescue and attack activities.
The remainder of the city relies entirely on volunteer firefighters for initial truck response. When a call is
placed, volunteer firefighters are paged to report to the fire station for assembly and deployment with a
fire truck. There is currently no minimum number of volunteers identified to respond to incidents of any
type and therefore, the initial truck may arrive with anywhere from a single firefighter, or a full
complement of four, in any given incident. This system can result in a significantly delayed response of
the initial four firefighter response and consequently the effective 14 to 16 firefighter large incident
response.

Fire and Paramedic Optimization Report
Page 87
It has been noted that incident attendance by volunteer firefighters is discretionary. They respond only
when they are available. An analysis was completed to determine the additional volunteer firefighters
required to meet a minimum response of 16 as outlined above. Using the 2016 average attendance rate
of about 30%, it was determined that an additional pool of 747 volunteers would be needed at a cost of
nearly $12 million. This is equivalent to hiring 87 full-time career firefighters at an approximate cost of
$11.3 million. If response rates were to improve to 50%, Fire Services would need to hire an additional
320 volunteers at a cost of approximately $5.1 million, the equivalent of 37 career firefighters at a cost
of about $4.8 million. This analysis only takes into account costs associated with the delivery of fire
services (wages, protective equipment, WSIB contributions, and other). It does not include the cost of
purchasing additional vehicles to transport the firefighters or the cost to enlarge stations where needed
to store the additional protective equipment. Furthermore, the exposure to the potential liability from
WSIB claims is higher in the model that relies on increased volunteer firefighters simply due to an overall
larger staffing complement (total staffing of 1,165 versus 455 using the current 30% attendance rate).
The graph below demonstrates the average incident attendance value based on 2016 attendance
records. It shows the number of volunteers attending incidents at each percentage level. See Appendix
#T4 for further details of this analysis.

Fire and Paramedic Optimization Report
Page 88
First truck response by career firefighters occurs, on average, in less than six minutes 67% of the time in
the city core and from the Val Therese composite station. Further, arrival on scene within nine minutes
of a dispatch occurs 84% of the time. In the outlying areas, which are protected primarily by volunteer
firefighters, response occurs on average within six minutes of dispatch about 25% of the time. Further,
volunteer response occurs in less than nine minutes from time of page about 55% of the time on
average. In 2016, seven volunteer stations took more than nine minutes to respond to a total of 342
incidents.
In the city core, there is a guaranteed immediate minimum response of four full-time career firefighters
for every call. In the outlying areas protected primarily with volunteer coverage, the number of
firefighters responding on the first truck ranges from 1.4 to 3.6 with the average being 2.7 firefighters. A
complete table outlining average response capability for volunteer firefighters is provided in Appendix
#T4.

Fire and Paramedic Optimization Report
Page 89
Comparison of Services by Area Rated Taxation Boundaries
Career Stations former City of
Sudbury Full-time Stations
Composite Station(s) Val Caron, Val
Therese and Hanmer response area only
Volunteer 16 stations
Proper fire ground staffing - industry best practice for interior fire suppression and entry requires 16 FFs on scene
guaranteed 22 Full-time FF response
guaranteed 2 full-time FF response - all others discretionary
response
Discretionary volunteer response
- data shows this response area rarely
has a 16 + FF response - backed
up by career response
Meets industry standard response times (5:20, 9:00, 14:00)
Yes No - unless fully
staffed with additional FFs
No
Attendance at training 100% 100% / 35% 34%
Medical Tiered Response Yes Yes No except for
Levack, Dowling and Capreol
Trench Rescue Yes Delivered by career
(2018) Delayed response
by career only
Hazardous Material Response
Yes Delivered by career
(2018) Delayed response
by career only
Water and Ice Rescue Yes Delivered by career
Skead and Azilda plus delayed
response by career in other areas
Fire Prevention Yes Delivered by career Delayed response
by career only
Public Education Yes Delivered by career Delayed response
by career only
Pre-incident Planning Yes Delivered by career Delayed response
by career only

Fire and Paramedic Optimization Report
Page 90
The current modeling reveals that Greater Sudbury Fire Services provides fire response at three
significantly different service levels across the city. The career service level is substantially compliant
with public expectations and all standards and industry best practices. The composite service level is
compliant in response time, but is non-compliant with staffing levels and public expectations, and the
volunteer services level is inconsistent by its inherent nature and can operate below public expectations
and industry best practices.
Protecting our Properties, Investments and Employment
An important concept in firefighting is that a fire department’s main goal is to protect a community’s
property and infrastructure. This concept is self evident in all realms of the three lines of defence of
firefighting, but it is obviously most associated with the fire response/suppression section.
In Ontario, the Municipal Property Assessment Corporation (MPAC) is responsible for classifying and
assessing the value of all properties (see Appendix #T1 for assessment summary by category). These
values are provided to the City of Greater Sudbury for municipal taxation purposes. The mission of Fire
Services is to protect these properties, and the investment they represent. Therefore, an analysis of the
MPAC value protected by Fire Services within the time criteria recommended by the NFPA is a direct
measure of the efficiency of the service level provided to residents, businesses and industry in the city
(see Appendix T6). An analysis of the data used to create the previous map was used to generate the
following table, which identifies the MPAC valuation of properties currently protected by the career,
composite and volunteer levels of response by the Greater Sudbury Fire Services.
Fire Response Coverage and Property Assessment Value – Current Model
Fire Response Times
5:20 minutes or less NFPA 1710
9:00 minutes or less NFPA 1720
14:00 minutes or less NFPA 1720
Coverage beyond 14 minutes
Properties Covered
(%)
Assessed Value
(billion $)
Properties Covered
(%)
Assessed Value
(billion $)
Properties Covered
(%)
Assessed Value
(billion $)
Properties Covered
(%)
Assessed Value
(billion $)
Current Model
Career 35% $ 7.487 48% $ 10.428 61% $ 12.711 0% -
Composite 5% 0.849 12% 1.902 15% 2.288 0% -
Volunteer 1% 0.085 9% 1.166 18% 2.488 0% -
Beyond 14 minutes
0% - 0% - 0% - 6% 0.936
Total 42% $ 8.421 69% $ 13.496 94% $ 17.487 6% $ 0.936
Fire and Paramedic Optimization Report
Page 91
In total, the City of Greater Sudbury had a 2015 MPAC valuation of nearly $18.5 billion. Fire Services is
able to respond within 5:20 minutes to about 42% of the MPAC valuation (approximately $8.4 billion).
An additional 27% (approximately $5 billion) can be responded to within the 5:21 to 9:00 minute, and a
further 25% (approximately $4 billion) in the 9:01 to 14:00 minute response time. In combination with
the previous map, this information demonstrates that fire protection meets industry best practices for
first truck arrival for a significant portion of the city core (NFPA 1710) within the city core (Former City of
Sudbury), however, the response in the outlying areas requires improvement.
The above simply identifies overall protection of all properties with no consideration for differences in
risk. In order to identify locations of highest risk, Fire Services has performed a Community Risk Profile
(CRP) which identifies the size, type and location of the high hazard buildings throughout the
community. This detailed breakdown is provided in the CRP analysis below.
Fire Prevention and Education
Fire Services currently has six Fire Prevention Officers, who perform request inspections, complaint
inspections, and annual vulnerable occupancy (for example retirement homes and long-term care
facilities) inspections. In 2016, Fire Prevention Officers conducted 1,085 inspections and reviewed 537
building permits along with 27 site plans specific to Ontario Fire Code compliance. The 2016 Fire
Underwriter’s Survey (FUS) reviewed the operation of Fire Services and identified Fire Code
enforcement as an area that has significant opportunity for improvement.
Noted earlier, FUS ratings are provided to insurance companies, of which approximately 90% use to set
base insurance premiums for residential and commercial properties. FUS recommends that scheduled
inspection of high risk occupancies should include regular visits to theatres, clubs, churches, hotels,
restaurants, schools, jails, apartment buildings, gas stations, warehouses, paint booths and a variety of
retail occupancies. Currently, Fire Services does not schedule or perform any annual inspections on
these types of commercial, industrial or high occupancy residential properties.
Using the recommended FUS threshold for frequency of commercial, residential, assembly, and
industrial occupancies (see Appendix #R1), Fire Services has generated the following table. The table
identifies the total person hours required for the inspection of these identified properties, as well as the
total person years. It has identified a total of about four person years as the required staffing to meet
these recommended thresholds.

Fire and Paramedic Optimization Report
Page 92
Occupancy Description
(Building Code Occupancy)
Total # of
Occupancies
Lines of Insurance
Hours per Initial
(H)
Total Hours (T) (#xH=T)
Frequency (F) (1=annual)
(0.5=every 2 yrs)
(0.33=every 3 yrs)
Total Inspection Days (TD)
TxF/7
Total Person Years (TPY)
TD/168
Number of Inspections
if Risk Matrix
Followed
Assembly Occupancies (A) 268 Commercial 1.0 268.0 1.0 38.3 0.2 268.0
Assembly >150 (A) 20 Commercial 2.0 40.0 1.0 5.7 0.0 20.0
Assembly >300 (A) 15 Commercial 3.5 52.5 1.0 7.5 0.0 15.0
Night Clubs (A2) 10 Commercial 2.0 20.0 2.0 5.7 0.0 20.0
Elementary Schools (A2) 87 Commercial 3.0 261.0 1.0 37.3 0.2 87.0
High Schools (A2) 10 Commercial 4.0 40.0 1.0 5.7 0.0 10.0
Daycares (A2) 78 Commercial 3.0 234.0 1.0 33.4 0.2 78.0
Hospitals (B2) 3 Commercial 80.0 240.0 0.5 17.1 0.1 1.5
B1 3 Commercial 4.0 12.0 1.0 1.7 0.0 3.0
B2 57 Commercial 3.0 171.0 1.0 24.4 0.1 57.0
B3 51 Commercial 2.5 127.5 1.0 18.2 0.1 51.0
Rooming Houses/Group homes (B3) 37 Commercial 2.0 74.0 1.0 10.6 0.1 37.0
Residential Mid Rise - up to 6 storeys (C) 196 Commercial 2.0 392.0 0.5 28.0 0.2 98.0
Residential High Rise -more than 6 storeys (C) 20 Commercial 4.0 80.0 0.5 5.7 0.0 10.0
Hotel, High (C) 0 Commercial 5.0 0.0 1.0 0.0 0.0 0.0
Hotel, Mid (C) 42 Commercial 4.0 168.0 1.0 24.0 0.1 42.0
Business, Personal Serv. Mercantile (D/E) 327 Commercial 1.0 327.0 0.3 14.0 0.1 98.1
High Hazard Industrial (F1) 608 Commercial 4.0 2432.0 1.0 347.4 2.1 608.0
Med Hazard Industrial (F2) 87 Commercial 3.0 261.0 0.5 18.6 0.1 43.5
Low Hazard Industrial (F3) 85 Commercial 2.0 170.0 0.5 12.1 0.1 42.5
Total: 3.9 Person Years
Fire and Paramedic Optimization Report
Page 93
Note that the recommended inspection schedule’s time commitment is based upon inspection time
alone, and does not include additional employee time allocations such as travel time, administrative
duties, education/training, nor absences due to vacation or illness. Currently all inspections are
conducted by Prevention Officers. There may be an opportunity for front-line firefighters to be tasked
with providing some initial inspection information for specifically identified buildings to reduce the
amount of time needed specifically by Prevention Officers to conduct an inspection. Administration may
also consider balancing the frequency of inspections against the identified workload and expectations of
FUS.
Fire Services has one Public Safety Officer who is tasked with providing targeted fire safety education
programs to the most vulnerable members of the population: school-aged children and the elderly. In
Greater Sudbury, there are 97 schools and 186 registered vulnerable occupancies (for example
retirement/long-term care facilities, and care and treatment occupancies). The Public Safety Officer has
the significant task of identifying, designing and presenting the pubic fire safety message to the students
and residents in these facilities.
In summary, Fire Services currently provides the minimum fire prevention and education components
however these services are not delivered consistently across the city. Providing these services at the
recommended levels are known to help reduce the probability of a fire occurring, and if by chance one
finds themselves involved in a fire, they are better prepared to react effectively to reduce the chance of
injury to those involved. These are key components of improving community safety and awareness
levels.
Technical Rescue
As per the Establishing and Regulating By-law 2014-84, Fire Services currently offers the technical rescue
services of auto extrication, water and ice rescue, and low-angle rope rescue. The frequency of these
types of incidents varies from frequent (auto extrication) to somewhat infrequent (ice rescue).
Regardless of frequency, the consequence of these incidents, when serious, is high as these incidents
are almost always life threatening if not responded to quickly with strategically located staff and
equipment.
Auto extrication is offered from 13 stations (a mix of career, composite and volunteer stations). The only
compromise to consistent service delivery across the city is related to the response time spectrum from
the various stations as noted in the Fire Service 2015 Response Time Map above (see Appendix #M3).
Low angle rope rescue consists of assisting in patient extrication using rope, where the majority of the
load is not supported by the rope, such as rescuing an unconscious person being carried on a stretcher
on a hillside. Due to the geography and topography of the city, this service is offered throughout the
community under the same response time limitations as above.

Fire and Paramedic Optimization Report
Page 94
Water and ice technical rescue is provided by all career stations, the Val Therese composite station, and
volunteer stations in Azilda and Skead at an enhanced level. This enhanced level speaks to additional
training to the firefighters in these stations, and the additional equipment to perform these types of
rescues, such as boats, personal floatation devices, ropes and harnesses. These types of rescue are
offered elsewhere at an awareness level (shore-based rescue). Given that Greater Sudbury is known as
a City of Lakes by virtue of containing more lakes than any other municipality in Canada (330 freshwater
lakes over 10 hectares in size), water rescue service levels do not align with the risks associated with in
the community. Lake Wanapitei is the largest city-contained lake in the world at 13,257 hectares and
Ramsey Lake is the second largest. In 2009, approximately 7,000 people or 4% of the city’s population
lived on a lake and many others have camps and cottages on the city’s lakes, not to mention the tourist
activities that the city lakes attract4.
The response capability of Fire Services for water and ice technical rescue is identified on the map below
(see full size map in Appendix #M4). Once again, the response time is based upon 2015 data for average
assembly time, plus the required drive time. The yellow polygons on Map 2 indicate a nine minute
response time for water and ice technical rescue based on response from the stations containing trained
firefighters for this type of rescue. The intense concentration of blue (water) on this map demonstrates
the vast network of lakes and rivers which are spread across the entire City of Greater Sudbury. The map
also details industrial properties, railways, major highways and utility rights of way, further reinforcing
that the service level offered to the community for all technical rescue does not align with the
distribution of risk.
4 Greater Sudbury Key Facts. Retrieved March 7, 2017 from https://www.greatersudbury.ca/living/about-greater-
sudbury/key-facts/location/
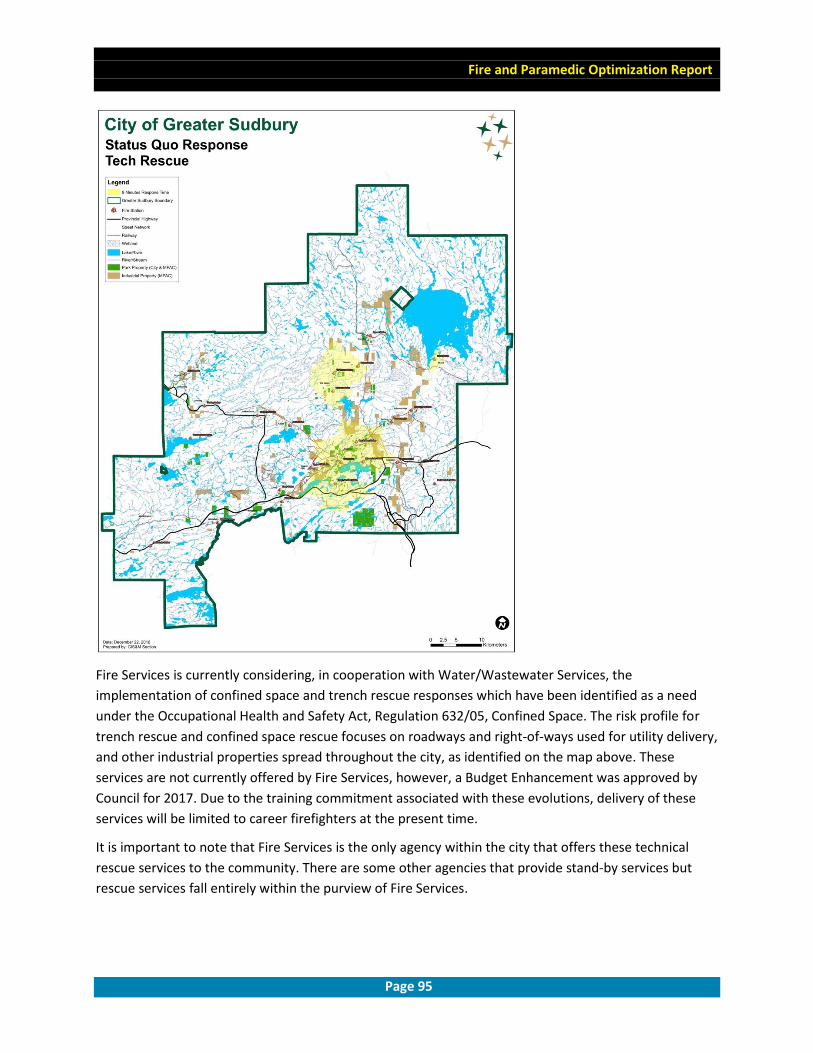
Fire and Paramedic Optimization Report
Page 95
Fire Services is currently considering, in cooperation with Water/Wastewater Services, the
implementation of confined space and trench rescue responses which have been identified as a need
under the Occupational Health and Safety Act, Regulation 632/05, Confined Space. The risk profile for
trench rescue and confined space rescue focuses on roadways and right-of-ways used for utility delivery,
and other industrial properties spread throughout the city, as identified on the map above. These
services are not currently offered by Fire Services, however, a Budget Enhancement was approved by
Council for 2017. Due to the training commitment associated with these evolutions, delivery of these
services will be limited to career firefighters at the present time.
It is important to note that Fire Services is the only agency within the city that offers these technical
rescue services to the community. There are some other agencies that provide stand-by services but
rescue services fall entirely within the purview of Fire Services.

Fire and Paramedic Optimization Report
Page 96
Hazardous Materials (HAZMat) Response
As per the Establishing and Regulating By-law 2014-84, Greater Sudbury Fire Services currently offers
HAZMat response at the Awareness level (Awareness being the lowest level), throughout the city. The
By-law identifies that Fire Services offers decontamination line services to agencies that may respond in
order to mitigate any incidents in the city. This HAZMat training has only been provided to career
firefighters. The department has the equipment as well, but requires the enhancement in order to
properly protect the city for the hazards that exist. The City’s Hazard Identification and Risk Assessment
(HIRA) has identified HAZMat incidents as the highest risk incidents which could cause an emergency
declaration for the community as a whole. The frequency of these types of incidents varies from
frequent small spills to somewhat infrequent large spills and transportation emergencies, however, the
consequence of these incidents, when serious, is extremely high, with a great possibility of being life
threatening to entire neighbourhoods. Furthermore, HAZMat incidents can have serious community-
wide impact to the infrastructure, environment, economy, and reputation of the City of Greater
Sudbury.
The City’s HIRA has also identified that the level of service provided by Fire Services is low and does not
align with the identified risk in the community. Greater Sudbury has significant industrialization related
primarily to the mining, milling and smelting of base metals which is the backbone of the local economy.
Large quantities of chemicals needed for industrial manufacturing and processing are delivered into, out
of and through the city by way of the three high volume railways and three major highway corridors,
including the TransCanada Highway. In the first half of 2016, about 10,000 railcars (or 1.25 million
barrels) of crude, oil and gas passed through Greater Sudbury just by rail alone. The amount of
hazardous materials that are transported by road remains unknown as transportation companies are
not required to report to municipalities the type or volumes of hazardous materials that are shipped
through or around our city by road. Over the past three years, Greater Sudbury has experienced two
train derailments with at least three major derailments having occurred just outside the city borders.
Lastly, Transport Canada had identified that the Greater Sudbury area has nine of the top 500 highest
risk railway crossings in Canada.
In Greater Sudbury, there are 733 industrial businesses which correlate to approximately 452
businesses per 100,000 of population. For comparison, the City of Ottawa has 236 industrial
businesses per 100,000 and the City of Toronto has 446 per 100,000. Greater Sudbury currently
supports an awareness level for HAZMat response, whereas the aforementioned two largest cities in
the province while having a lower concentration of industrial businesses have a higher level of
response (Technician Level). Given the high volume of industrial and mining activity in the city, it is no
surprise that significant quantities of hazardous materials are also stored in warehouses within the
city, with constant shipments throughout town for use in various manufacturing and industrial
facilities. By nature of Greater Sudbury’s industry, the risk of hazardous material spills in the
community is extremely high and Fire Services should be better prepared to respond.
Many of the above noted risks can be generally identified by the location and concentration of these
facilities (mine sites, industrial parks, warehouses, and other) in the community. These risk areas are

Fire and Paramedic Optimization Report
Page 97
identified on map shown below (see full size map in Appendix #M5). As noted above, Greater Sudbury
Fire Services responds to emergencies involving these risks at the awareness level, which means the
provision of basic scene security, such as erecting barricades. A request for assistance would then be
made from Ottawa or Toronto Fire Services. As Ottawa and Toronto have a technician level response,
they may actively participate in mitigation of the HAZMat emergency. In Greater Sudbury, mitigation,
clean up, and remediation would need to be led by agencies requested from outside of the city and
Fire Services would be available for support only.
Medical Tiered Response (MTR)
As per the Establishing and Regulating By-law 2014-84, Greater Sudbury Fire Services currently offers
Medical Tiered Response (MTR) at the Emergency First Responder level. MTR is the act of Fire Services
supporting Paramedic Services by responding to high priority calls such as heart failure and
Fire and Paramedic Optimization Report
Page 98
unconsciousness when ambulances are unavailable to respond. This support by firefighters enhances
service capacity in areas with high emergency response call volumes or in areas where service levels
fluctuate due to unpredictable nature of emergency response. It is not meant to take away from
paramedic responsibility. This means that firefighters could provide basic first aid, cardiopulmonary
resuscitation (CPR), and rapid application of an automated external defibrillator (AED) when paramedics
are not immediately available. They would continue to medically support patients only until the arrival
of paramedics. MTR is currently provided by city core career stations, the Val Therese composite station,
and the Capreol, Dowling and Levack volunteer stations. None of the remaining stations offer this type
of response.
In 2015, Fire Services responded to almost 800 calls for medical assistance, which constitutes 18% of the
total call volume. The frequency of these types of incidents is significant, and the consequence is high as
the MTR Agreement outlines that Fire Services response is limited to incidents that are almost always
life threatening when not responded to immediately. Fire Services offers this service in support of
Greater Sudbury Paramedic Services when paramedics are otherwise preoccupied by other medical
emergency calls or when a larger team of professionals would yield beneficial results in patient care.
Fire Services is not the primary agency for medical response as MTR is meant to represent a depth of
service for medical response to patient in need.
The following map details the response polygon for MTR as well as the location of occupancies which
generate the highest frequency of incidents (see full size map in Appendix #M6). The yellow polygons
indicate a 5:20 or less response time and the blue polygons indicate a 5:21 to 9:00 minute response time
from those stations which have been trained for MTR.

Fire and Paramedic Optimization Report
Page 99
It is important to recognize that Greater Sudbury Paramedic Services is the primary response agency for
medical emergencies and that Paramedic Services offers a consistent level of service throughout the
city, including single ambulances located in each of the identified communities. Greater Sudbury Fire
Services medical tiered response provides primary coverage when an area’s ambulance is responding to
an incident and an additional ambulance is on route to backfill the coverage.
The table below provides a breakdown of the number of vulnerable occupancies and the response
capability of Fire Services. As shown on the above map, there are a significant number of areas that do
not have protection within a nine minute response. It is also noted that there are significant community
risks such as schools, daycare centers, and old age/senior care facilities in the former communities of
Rayside Balfour, Walden and Nickel Centre that are not currently being protected by Fire Services
medical tiered response.

Fire and Paramedic Optimization Report
Page 100
Number of Vulnerable Occupants
Prepared by the GIS&M Section, City of Greater Sudbury, January 17, 2017
Outside of the vulnerable facility listing, the 2011 Census shows that Greater Sudbury has 72,418
dwellings with a population of 160,269. Understanding that MTR is also utilized in private homes, Table
2 details the current ability Greater Sudbury Fire Services has to respond to private dwellings within five
and nine minutes. This shows that just over 20,000 dwellings occupied by approximately 49,000
residents are not served by MTR.

Fire and Paramedic Optimization Report
Page 101
Dwellings and Population
SOURCE: 2011 Census of Canada, Statistics Canada
Prepared by the Community and Strategic Planning Section, City of Greater Sudbury, January 17, 2017
The above analysis of the service types and levels currently being provided by Greater Sudbury Fire
Services demonstrates that services are currently being rendered in an inconsistent fashion and a
significant opportunity for improvement exists.

Fire and Paramedic Optimization Report
Page 102
Community Comparison
A review of current service levels would not be complete without a review of comparators. The City of
Greater Sudbury is somewhat unique in that there is no singular comparator that mirrors all aspects
inherent to the City of Greater Sudbury. Being so large in geography with pockets of population and
unique hazards it is hard to find comparisons from a single community, so we must examine a variety of
communities that have some, but not all, of Greater Sudbury’s characteristics. A review of 12 other
cities within the province was undertaken in an attempt to compare and contrast levels of service. A full
table detailing the comparator communities can be found in Appendix #T6. The 12 comparators are:
Barrie
Burlington
Chatham-Kent
Hamilton
Kingston
London
Mississauga
Niagara Falls
Ottawa
Richmond Hill
Thunder Bay
Windsor
Many aspects of these comparator cities were reviewed including population, land area, population
density, amount of dwellings and assessed value of property. Of greatest interest was a review on the
basis of ratios utilizing career fire fighters as one of the data points.
It must be noted that to use the measure of career firefighter only is appropriate in these comparisons
as the career model is the only one that guarantees a response. While many of the City of Greater
Sudbury’s communities are covered primarily by a volunteer response, a career response is always sent
for an emergency involving a working fire or smoke emanating from a building. With no minimum
attendance standard for volunteer firefighters it would be unfair to allocate the uncertain level of
participation in relation to protection. As such, all volunteer firefighter numbers were excluded not only
from Greater Sudbury’s numbers, but also from any comparator that had volunteer staffing.
Additionally, when it comes to the full gamut of firefighting performance, career firefighters regularly
train in different techniques including specialized response skills and also perform in the community
during the course of their normal daily duties. Areas involving education and pre-incident planning are
part of the career, full-time duties.

Fire and Paramedic Optimization Report
Page 103
The first analysis reviewed pure city population. The following table reveals Greater Sudbury’s position
in relation to career firefighters to the area’s population. Ranking 12th out of 13 in protection of the
population on a per career firefighter basis places Greater Sudbury near the bottom of the list. While
ranked 12th in the per firefighter ratio, the City of Greater Sudbury ranks as the 8th largest in population.
Being the 8th largest in actual population and 12th per capita is inconsistent and suggests Greater
Sudbury Fire Services must be operating at a more efficient level, or is providing a different level of
service. As this review illustrates, the latter is more applicable.
Protection of Population
Rank City Total
Population 1 Career
Firefighter:Population
1 Thunder Bay 170,909 562
2 Niagara Falls 88,071 759
3 Windsor 217,188 839
4 Barrie 141,434 982
5 Kingston 123,798 1,032
6 Burlington 183,314 1,066
7 Ottawa 934,243 1,081
8 London 383,822 1,129
9 Hamilton 536,917 1,147
10 Mississauga 721,599 1,171
11 Richmond Hill 195,022 1,393
12 Greater Sudbury 161,531 1,496
13 Chatham-Kent 101,647 1,564

Fire and Paramedic Optimization Report
Page 104
Next a review of protection of dwellings was performed by taking the total number of dwellings in each community and dividing again by the number of career firefighters. Falling 12th out of 13, Greater Sudbury is again near the bottom on a per career firefighter basis even though Greater Sudbury ranks 6th in terms of overall dwellings. This finding is once again misaligned in that the apparent level of protection does not match the overall quantity of what is being protected.
Protection of Dwellings
Rank City Total
Dwellings 1 Career
Firefighter:Dwellings
1 Thunder Bay 50,388 262
2 Niagara Falls 37,265 321
3 Barrie 54,227 377
4 Windsor 97,777 378
5 Mississauga 248,469 403
6 Burlington 772,535 422
7 Ottawa 395,985 458
8 Richmond Hill 66,465 475
9 Hamilton 227,918 487
10 Kingston 59,977 500
11 London 175,558 516
12 Greater Sudbury 75,029 695
13 Chatham-Kent 46,103 709

Fire and Paramedic Optimization Report
Page 105
Protection of overall property value assessment was also reviewed. Being 7th overall in assessed value
of the property within the 13 cities, Greater Sudbury ranks 9th on a per career firefighter basis. This is
better in terms of alignment however the fire protection being provided by Greater Sudbury Fire
Services once again falls short, albeit only minimally in this case.
Lastly, comparisons on the protection of the city’s overall economy was performed by looking at values
in commercial and industrial properties.
Protection of Property (based on assessment value)
Rank City
Total Property
Value ($ Billion)
1 Career Firefighter: $ Million
1 Thunder Bay $10.0 $52.3
2 Windsor $16.8 $65.0
3 Niagara Falls $10.7 $92.0
4 Barrie $17.8 $123.4
5 London $42.7 $125.7
6 Ottawa $117.3 $135.7
7 Hamilton $66.1 $141.2
8 Kingston $17.2 $143.5
9 Greater Sudbury $18.4 $170.6
10 Chatham-Kent $11.8 $180.8
11 Burlington $36.5 $212.2
12 Mississauga $143.2 $232.5
13 Richmond Hill $45.1 $322.0

Fire and Paramedic Optimization Report
Page 106
Protection of Commercial Property
Rank City
Total Property
Value ($ Billion)
1 Career Firefighter: $ Million
1 Chatham-Kent $0.9 $8.0
2 Thunder Bay $1.4 $12.6
3 Greater Sudbury $1.9 $17.5
4 Kingston $2.2 $20.7
5 Niagara Falls $2.5 $22.9
6 Barrie $2.5 $23.2
7 Windsor $2.5 $23.4
8 Richmond Hill $3.6 $33.2
9 London $4.3 $39.6
10 Burlington $4.6 $42.4
11 Hamilton $5.7 $52.4
12 Ottawa $25.1 $232.0
13 Mississauga $25.1 $232.6

Fire and Paramedic Optimization Report
Page 107
Protection of Industrial Property
Rank City
Total Property
Value ($ Million)
1 Career Firefighter: $ Million
1 Thunder Bay $ 128.84 $ 0.7
2 Niagara Falls $ 102.08 $ 0.9
3 London* $ 409.62 $ 1.2
4 Kingston $ 158.89 $ 1.3
5 Ottawa $ 1,377.25 $ 1.6
6 Chatham-Kent $ 124.78 $ 1.9
7 Windsor $ 518.62 $ 2.0
8 Hamilton $ 1,082.53 $ 2.3
9 Barrie $ 336.40 $ 2.3
10 Greater Sudbury $ 453.69 $ 4.2
11 Richmond Hill $ 605.50 $ 4.3
12 Burlington $ 985.93 $ 5.7
13 Mississauga $ 5,298.11 $ 8.6
The comparison was interesting when it came to commercial and industrial property evaluation. Each
comparator lined up in order in both total value and per firefighter categories. What this assessment
truly revealed was that Greater Sudbury has a great deal of value in Industrial assessment. With $454
million in assessed industrial value in Greater Sudbury it is apparent that industry is an important
economic driver in the city. Understanding that it is Fire Services’ responsibility to protect a city’s
infrastructure and economy, these are important items to note.

Fire and Paramedic Optimization Report
Page 108
Key messages of this section:
- Fire service delivery is partly regulated by the province in that they are mandated to provide fire
education and fire prevention, and that each municipality’s city council must establish standards
for fire suppression delivery in their community to address local risks and needs.
- Fire stations, staffing and equipment were established to protect individual communities prior to
amalgamation and have not been adjusted to protect the entire community of Greater Sudbury as
a single, integrated and cohesive department.
- FUS is a third party organization that evaluates fire service departments across Canada based on
best practice standards established by the National Fire Protection Association (NFPA) to
determine their effectiveness in protecting communities and keeping them safe. FUS identified a
number of areas where service delivery was below standard, which would be expected to result in
increased insurance premiums being charged to residents and businesses of the community for the
fire portion of their rates.
- Fire Services has been underfunded for many years and requires a significant investment in the
service to meet NFPA standards and guidelines followed by fire departments around the world.
- Fire Services faces numerous challenges, some of which are quite significant and could cause grave
financial hardship in a short period of time.
o A large funding shortfall exists for the replacement of aging vehicles and major equipment
as well as repairs and renewals to old stations that are reaching the end of their life cycles
and many of which are showing signs of impending failure.
o Poor participation and delayed response in volunteer protected areas poses a high risk for
the occurrence of large damaging incidents in some areas of the city. This is especially true
in those areas where significant population and commercial growth have occurred in
recent years, such as the Chelmsford, Garson, Lively and Valley East communities.
o The city lacks enhanced training and service delivery that would be expected in a
community of our size and with the hazards that exist in our resource-based industrial
economy. These include specialized response for: hazardous material, trench and
confined space emergencies.
o Fire Services only protects about 70% of the value of the properties in the city in a timely
manner (based on industry best practices), and services are delivered inconsistently across
the city, as well as within each service delivery area (career, composite, volunteer).
o Current staffing does not provide enough resources to complete fire prevention and
education duties recommended in NFPA industry guidelines (such as inspections and fire
safety programming) which puts our community at risk of: experiencing an increased
number of incidents; delays in interior attack for structures where specific hazards are
unknown; and endangering firefighters who may respond to high risk occupancies
unknowing that hazards may exist.

Fire and Paramedic Optimization Report
Page 109
RISK ANALYSIS
What you will learn in this section:
What is a Community Risk Profile?
Understanding of where high risk properties exist in the City of Greater Sudbury
Understanding of the response capability of Fire Services to respond to incidents at high risk
properties
Understanding of the business risks for Fire and Paramedic Services as analyzed by the City’s
Auditor General’s Office
Greater Sudbury Fire Services Community Risk Profile
The Fire Services mission is to respond to community risk as exemplified by the people, buildings,
infrastructure, geography, and economy contained within. The assessment of the level of this risk
within a given municipality is known as the Community Risk Profile (CRP). The community risk profile, in
conjunction with the City of Greater Sudbury’s Hazard Identification and Risk Assessment (HIRA) Report
and the Fire Underwriter’s Survey (FUS) Report (see Appendix #R1), has identified the residential,
commercial and industrial areas of the city with the highest risk of potential emergency incidents. It has
also identified that the services currently provided are not in place to mitigate these identified risks; and
further, that they are not provided in a consistent manner across the city
Like Paramedic Services, Fire Services is also exposed to the business continuity risk inherent in its own
operation. These internal risks represent a concern which can be equally as serious and consist of such
things as the service’s reputation, ongoing fiscal stability, legislative demands and exposure to civil
litigation. The analyses of these internal risk items have been quantified in cooperation with the Auditor
General’s Office within an Enterprise Risk Register (ERR) to demonstrate the current risk mitigation
strategies, and assess the impact of Optimization on these risks.
A Community Risk Profile (CRP) is derived as a result of a community risk analysis. It provides an
assessment of the hazards or dangers which may affect persons, properties and the economy within a
community. The analysis includes several factors, including the exposure to natural and man-made
disasters, the building risks due to age and occupancy type, population density and demographics, and
exposure to hazardous materials and technical rescue situations.
Identification of community risk provides a basis for determining effective resource allocation and
service provision. Essentially, the more probable and consequential the risk, the greater the need is for a
plan to mitigate the event if the risk becomes a real problem. The CRP analysis also takes into account
the ability of Greater Sudbury Fire Services to respond to these risks, based on factors identified in the
analysis, such as weather conditions, road network layout and congestion, and existing station location
and staffing profile. An analysis of the City of Greater Sudbury’s community risk was undertaken in an
effort to assess the community risk level, evaluate the current response, and match the appropriate
initial response, and effective total necessary response to an emergency incident.

Fire and Paramedic Optimization Report
Page 110
The City of Greater Sudbury, from a fire service perspective, is divided into five districts, and 24 fire
beats each centered on a given station. For the purposes of the CRP, the city is further divided into 37
Fire Response Zones (FRZ). Greater Sudbury Fire Services adopted the community borders, as defined in
the Community Profiles, which were developed through the City’s Healthy Communities Initiative
Strategy, to generate the Fire Response Zones (FRZs) to be used in the analysis. The borders of these
Community Profiles and the resultant Fire Response Zones are determined based on information from
the Planning Department and related Census Data. To view a map of all FRZs for Greater Sudbury see
Appendix #M16. These FRZs do not represent individual response areas, and are not intended to
represent borders to response. Their sole intent is to analyze the risk present within a defined area.
These zones allow for a very detailed analysis from a risk perspective, with an opportunity to identify
specific buildings, occupancies, infrastructure and geographic features that present a unique hazard not
only to the community, but to the responders tasked with protecting them. Response to a building in a
FRZ in any fire district is designed to be inclusive, and includes all of the resources necessary from all
responding stations.
A geographical analysis of the city reveals that the population density overall is 0.5 persons per hectare
(P/Ha). Population density is an important factor from a risk perspective, and the National Fire
Protection Association (NFPA) has identified it as a key indicator for setting the response standard in a
community. Obviously, the city’s population is not evenly distributed, so it is important to identify and
analyze each of the various hubs (communities) to determine their individual population density. Once
these are identified, it is then recommended that similar communities receive similar response
standards.
The CRP identifies natural and human-made disasters most likely to threaten the city in conjunction with
the provincially mandated Hazard Identification and Risk Assessment (HIRA) which is updated annually.
The CRP analyzes the community and Fire Services in a thorough manner, including;
Climate and weather hazards and the impact of weather events on response;
Current and future city road networks and the hazards and response challenges associated with
them;
Rail network and highway shipping hazards based on load characteristics and amounts; and the
impact on response to rail events, and the traffic disruption characteristics of the rail crossings
in the city;
Critical infrastructure in the city, and the response challenges they represent;
The city’s exposure to wildland fires at the urban/rural interface;
The building stock age, condition, construction, use and fire protection systems;
The water supply from the seven municipal water systems, in addition to the access to water
from fixed drafting locations in the non-hydrant serviced areas of the city;
The water flow needs for high-risk residential, industrial, institutional, and commercial
properties;
Future growth areas, current and future land use, and neighbourhood and industrial park areas;
Community demographic profiles and population density;

Fire and Paramedic Optimization Report
Page 111
Service type demands, and incident frequency and impact;
Identified high risk areas for the four fire response types; fire, technical rescue, hazardous
materials, and medical assist;
Critical task identification for service delivery;
Station location analysis for current stations, and recommendation criteria for integration,
closure, and/or relocation and new construction.
Analysis of these and other factors has identified that the current Greater Sudbury Fire Services
operations have several deficiencies in its capacity to respond. Many of the issues earlier were assessed
as high risk.
Primarily, the response to hazardous materials (HAZMat), given the exposure the city has due to its large
industrial economy, was found to be inadequate. Fire Services has a responsibility to protect Greater
Sudbury as the Hard Rock Mining Capital of the World and Global Leader in the Mining Supply and
Services Industry as identified and endorsed in From the Ground Up: A Community Economic Strategic
Plan. Additionally, the service level delivery for Technical Rescue (auto extrication, water, ice, confined
space, trench, rope rescues) was found to be inadequate and/or inconsistent in the various areas of the
city, based on the risk factors present. Lastly, the fire response analysis identified a large variability in
response between the career, composite, and volunteer areas, beyond the built-in delay aspect of the
volunteer response system.
The career response area was found to align with industry standards in arrival time, initial vehicle
staffing, effective firefighting force staffing and arrival time. Meanwhile, the composite and volunteer
response areas are not currently in compliance with any of these response criteria, when judged against
industry best practice or recommended standard setting bodies. Attendance for both training and
incidents in the volunteer (and composite) areas was found to be substandard, resulting in a response
model which does not align with the suburban communities where there is a large exposure to high risk
type buildings, most notably in Chelmsford, Lively, Val Caron and Garson.
These four communities are not only the primary suburban towns in their respective fire districts, but
also contain a concentration of high risk properties. These communities have the ability to serve as
efficient, central response locations to service the high risk properties within their entire district. The
Medical Tiered Response service offered by Fire Services was found to exhibit similar variances, with
career and composite response generating notable impact, and response in the volunteer areas offering
the service (Capreol, Dowling and Levack) providing value, within the limitations imposed by the built-in
delay in response.
The station location analysis undertaken as part of the CRP was of particular importance in light of the
Optimization Project. The findings confirmed those identified by the FUS in their analysis to update the
Public Fire Protection Classification (PFPC) and Dwelling Protection Grade (DPG) numbers for the city.
All the findings point to several stations being in the wrong location, with some providing an overlap of
service creating an unnecessary level of redundancy. The table below provides information about each
fire response zone that was used for the analysis that follows.

Fire and Paramedic Optimization Report
Page 112
Fire Response Zones
(FRZ) Community Population
(2011) Pop. Density
P/Ha
MPAC Assessed Value (2016)
(Millions)
# of High Risk Properties
Total # of properties
% of High Risk
Properties
FRZ 1 Downtown 2,717 15.22 497.3 107 732 14.6%
FRZ 2 Kingsmount 4,688 15.86 491.3 40 1,764 2.3%
FRZ 3 South End 17,443 4.83 2,944.20 123 5,756 2.1%
FRZ 4 West End 8,185 17.13 790.9 134 3,043 4.4%
FRZ 5 Donovan 6,021 11.2 497.3 62 2,157 2.9%
FRZ 6 Flour Mill 6,815 17.83 497.1 88 1,851 4.8%
FRZ 7 New Sudbury 24,329 6.79 2,903.30 232 9,090 2.6%
FRZ 8 Minnow Lake 11,303 4.96 1,274.60 55 4,115 1.3%
FRZ 9 Rural South End 4,086 0.28 739.9 28 1,997 1.4%
FRZ 10 Rural Sudbury 312 0.12 48.8 6 45 13.3%
FRZ 11 Copper Cliff 2,604 3.57 272.8 26 854 3.0%
District 1
88,503
10,957.50 901 31,404 2.9%
FRZ 12 Lively 6,365 3.47 610.2 23 2,421 1.0%
FRZ 13 Naughton 758 1.81 106 3 418 0.7%
FRZ 14 Whitefish 288 4.5 21.7 2 150 1.3%
FRZ 15 Rural Walden 3,153 0.04 748.2 108 2,730 4.0%
District 2
10,564
1,486.10 136 5,719 2.4%
FRZ 16 Azilda 4,297 1.24 496.2 31 1,961 1.6%
FRZ 17 Chelmsford 7,147 5.42 635.4 58 2,630 2.2%
FRZ 18 Rural Rayside Balfour 3,113 0.11 344.4 20 1,563 1.3%
FRZ 19 Dowling 1,712 2.27 140.7 8 642 1.2%
FRZ 20 Onaping 639 3.13 36.6 2 320 0.6%
FRZ 21 Levack 1,403 2.58 79.9 22 608 3.6%
FRZ 22 Rural Onaping Falls 1,120 0.04 191.4 13 853 1.5%

Fire and Paramedic Optimization Report
Page 113
(FRZ) Community Population
(2011) Pop. Density
P/Ha
MPAC Assessed Value (2016)
(Millions)
# of High Risk Properties
Total # of properties
% of High Risk
Properties
District 3
19,431
1,924.60 154 8,577 1.8%
FRZ 23 McCrea Heights 1,258 0.97 124.7 4 596 0.7%
FRZ 24 Blezard Valley 695 0.92 93 22 332 6.6%
FRZ 25 Val Caron 4,377 4.39 461.5 56 2,120 2.6%
FRZ 26 Val Therese 8,102 6.82 708.5 11 2,940 0.4%
FRZ 27 Hanmer 5,945 4.12 534.7 20 2,238 0.9%
FRZ 28 Rural Valley East 3,601 0.07 508 14 2,106 0.7%
FRZ 29 Capreol 3,276 5.12 224.2 31 1,425 2.2%
FRZ 30 Rural Capreol 10 0 19.3 1 100 1.0%
District 4
27,264
2,673.90 159 11,857 1.3%
FRZ 31 Garson 6,329 8.25 538.8 24 2,222 1.1%
FRZ 32 Falconbridge 683 2.29 89.6 4 314 1.3%
FRZ 33 Rural Nickel Centre 2,659 0.08 453.5 40 1,503 2.7%
FRZ 34 NE Townships 43 0 1.7 0 10 0.0%
FRZ 35 Coniston 2,149 1.64 171.4 12 875 1.4%
FRZ 36 Wahnapitae 1,349 0.38 97.6 9 465 1.9%
FRZ 37 SE Townships 1,232 0.08 116.7 37 729 5.1%
District 5
14,444
1,469.30 126 6,118 2.1%
160,206
18,511.40 1,476 63,675 2.3%
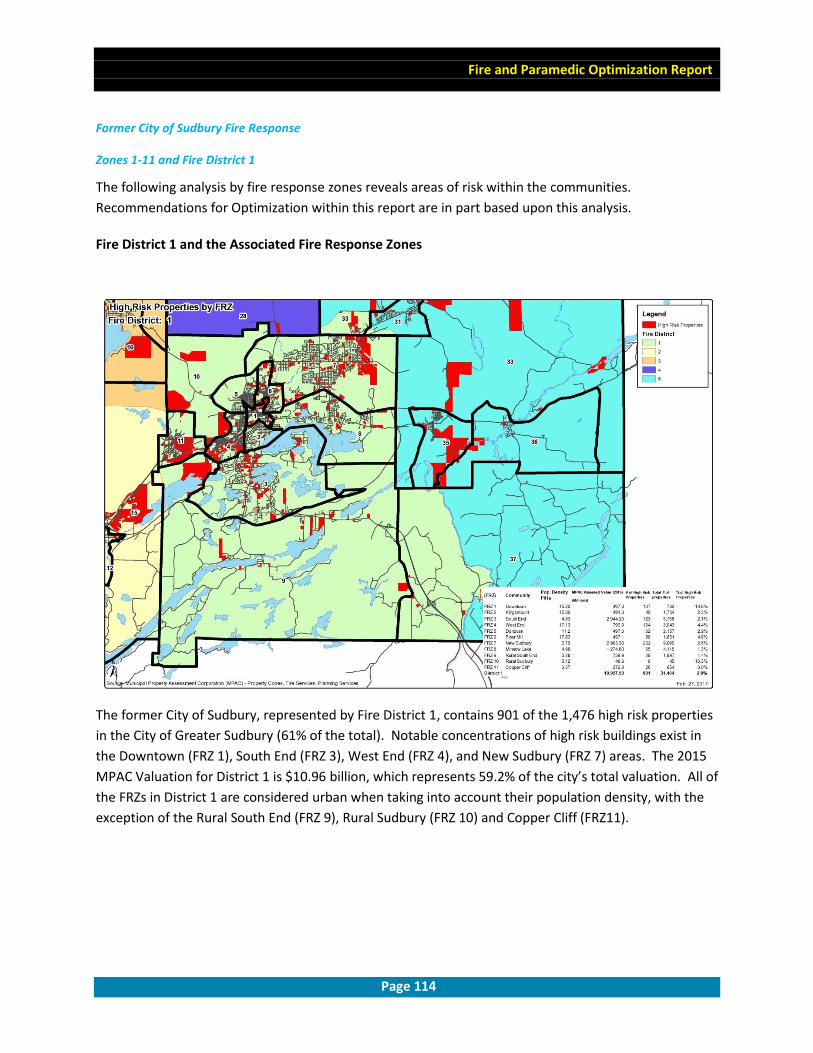
Fire and Paramedic Optimization Report
Page 114
Former City of Sudbury Fire Response
Zones 1-11 and Fire District 1
The following analysis by fire response zones reveals areas of risk within the communities.
Recommendations for Optimization within this report are in part based upon this analysis.
Fire District 1 and the Associated Fire Response Zones
The former City of Sudbury, represented by Fire District 1, contains 901 of the 1,476 high risk properties
in the City of Greater Sudbury (61% of the total). Notable concentrations of high risk buildings exist in
the Downtown (FRZ 1), South End (FRZ 3), West End (FRZ 4), and New Sudbury (FRZ 7) areas. The 2015
MPAC Valuation for District 1 is $10.96 billion, which represents 59.2% of the city’s total valuation. All of
the FRZs in District 1 are considered urban when taking into account their population density, with the
exception of the Rural South End (FRZ 9), Rural Sudbury (FRZ 10) and Copper Cliff (FRZ11).

Fire and Paramedic Optimization Report
Page 115
In 2016, there were 3,146 incidents in District 1 which returned a sub nine minute first truck arrival in
83.7% of those cases, primarily with a career level response. Additionally, due to the career fire
response model of a guaranteed immediate minimum of four firefighters per truck, all arriving vehicles
had the appropriate initial staffing for minor incident mitigation. Furthermore, the total available
firefighter complement in District 1 is 23. This number is in close alignment with fire ground staffing
recommendations for initial interior attack on an Open Air Shopping Centre as determined by NFPA to
be 27/28 firefighters. NFPA has identified the same response complement to respond to a Garden Style
Apartment Building (townhouse or row house). The current total firefighter complement falls
significantly short of the recommended initial attack complement for a seven storey and higher
apartment building, which is 43 firefighters. The City of Greater Sudbury has fewer than 20 high-rise
buildings within this category.
Copper Cliff Fire Response Zone 11 (FRZ11)
Analysis of FRZ 11 reveals that there are currently 26 High Risk properties, a population density of 3.57
P/Ha, a MPAC valuation of $200 million, and an average of 17 calls per year over a two-year period
(2015-2016). Current response analysis reveals that the Copper Cliff Station achieves a nine minute or
less response 62.9% of the time, with an average of 2.6 firefighters per response. GIS mapping also
reveals that virtually the entirety of FRZ 11 is within the 8 kilometre response polygon of both the Van
Horne and Long Lake Road stations, both of which currently respond to FRZ 11 in cooperation with
Copper Cliff station. Waters Station, which currently does not respond to Copper Cliff unless requested,
also contains Copper Cliff within its 8 kilometre response polygon. This demonstrates an impactful
response to Copper Cliff when necessary.

Fire and Paramedic Optimization Report
Page 116
Lively Fire Response Zone 12 (FRZ12) and Fire District 2
Fire District 2 and the associated Fire Response Zones (FRZ)
Lively is the largest suburban town on the Highway 17 West response corridor identified by Fire Services
as District 2, which contains FRZs 12, 13, 14 and 15. District 2 contains 9.2% of the identified high risk
properties in the City of Greater Sudbury.
Detailed analysis of FRZ12 (Lively) reveals that the population density is 3.47P/Ha (Persons per hectare),
and has a MPAC assessment valuation of $610.2 million. NFPA 1720 identifies a population density of
3.86P/Ha as the threshold for urban density, and between 1.93P/Ha and 3.86P/Ha for suburban.
Therefore, the Lively/Waters area is currently just under the NFPA population density definition for
urban density. It is important to note that this is an area of the city that has experienced sizeable
growth over the past few years and has been identified in the City’s Official Plan to expect continued
growth into the future. There are 23 high-risk properties representing 1.0% of the building stock in this
FRZ. The identified properties include elderly care occupancies, schools, and industrial and commercial
business interests

Fire and Paramedic Optimization Report
Page 117
Other Fire Response Zones within District 2 also contain significant high risk properties. Notably, FRZ15
(Rural Walden) while only having a population density of 0.04 P/Ha, exhibits a MPAC valuation of $748.2
million, and has 108 high-risk buildings, representing 4% of the building stock. This high risk building
stock is primarily concentrated in the Walden Industrial Park, and the related travel corridor on
Municipal Road 55 between Copper Cliff and Lively. Response for FRZ 12, and FRZ 15 are primarily
supplied by Waters, Lively and Copper Cliff Stations. Note that although Copper Cliff Station is in District
1, it is the initial response station to properties in the Copper Cliff/Lively response corridor. Combined,
these three stations responded to 178 incidents in 2016. The primary response station Waters Station,
achieved a nine minute first truck arrival to 36.7% of the 116 incidents in its area, with an average
attendance of 3.4 firefighters. Lively Station achieved a nine minute first truck arrival to 68.5% of the 32
incidents in its area, with an average attendance of 3.3 firefighters. Copper Cliff Station achieved a nine
minute first truck arrival to 62.9% of the 30 incidents in its area, with an average attendance of 2.6
firefighters.
These response averages fall short of the expectations of NFPA 1720 for an urban area, which is a nine
minute response, 90% of the time. While FRZ12 Lively/Waters falls just under the threshold for strict
inclusion in the urban response criteria, the high density and number of high risk properties in it and the
adjacent FRZ are compelling for inclusion in the urban analysis.
Fire Response Zone 15 (FRZ15) and Beaver Lake Station
Analysis of FRZ 15 reveals that, as noted above, there currently are 108 High Risk properties; a
population density of 0.04 P/Ha, and that the response area covered by Beaver Lake Station received an
average of 13 calls for service per year over the previous two year period. GIS mapping reveals that only
a single High Risk property in FRZ 15 is within the Beaver Lake Station response area. Current response
analysis reveals that the Beaver Lake Station achieves a nine minute or less response 12.9% of the time,
with an average of 1.4 firefighters per response. Note that this FRZ does not have the population
density to be considered an urban response area, and is in fact considered remote/rural. As such, the
time threshold information is provided for reference only.
The initial response to the buildings in District 2 is volunteer service level response.

Fire and Paramedic Optimization Report
Page 118
Chelmsford (FRZ 17) and Fire District 3
Fire District 3 and the associated Fire Response Zone
Chelmsford is the largest suburban town on the Highway 144 North response corridor identified by Fire
Services as District 3, which contains Fire Response Zones 16, 17, 18, 19, 20, 21 and 22. District 3
contains 10.4% of the identified high risk properties in the City of Greater Sudbury.
Detailed analysis of FRZ17 (Chelmsford) reveals that the population density is 5.42P/Ha (Persons per
hectare), and there is a MPAC assessment valuation of the building stock of $635.4 million. NFPA 1720
identifies a population density of 3.86P/Ha as the threshold for urban density, and therefore,
Chelmsford should be considered urban. There are 58 High Risk properties representing 2.2% of the
building stock in this FRZ. The identified properties include elderly care occupancies, schools, and
industrial and commercial business interests.
The associated Fire Response Zones also contain significant high risk properties. Notably, FR16 (Azilda)
with a population density of 1.24 P/Ha and an MPAC valuation of $496.2 million, contains 31 high risk
buildings, representing 1.6% of the building stock. Also of note, FRZ21 (Levack) and FRZ 22 (Rural
Onaping Falls) combined have 35 high risk buildings, concentrated in the mining areas surrounding the
town. Response to these high risk properties represents a significant challenge to the service.

Fire and Paramedic Optimization Report
Page 119
Response for FRZ 17 and FRZ 16 are primarily supplied by Chelmsford nd Azilda Stations. Combined,
these two stations responded to 211 incidents in 2016. The primary response station, Chelmsford
Station, achieved a nine minute first truck arrival to 50.9% of the 123 incidents in its area, with an
average of 4.7 firefighters. Azilda Station achieved a nine minute first truck arrival to 45.1% of the 88
incidents in its area, with an average attendance of 3.3 firefighters.
These response averages fall short of the expectations of NFPA 1720 for an urban area, which is for a
nine minute response, 90% of the time.
Fire Response Zone 18 (FRZ 18) and Vermillion Lake Station
Analysis of Rural Rayside Balfour, FRZ 18 reveals that, as noted above, there currently are 20 High Risk
properties; a population density of 0.11 P/Ha, and that the response area covered by Vermillion Lake
Station received an average of 1 call for service per year over the previous two-year period. GIS
mapping reveals that there are no High Risk property in FRZ 18 that are within the Vermillion Lake
Station response area. Current response analysis reveals that the Vermillion Lake Station achieves a
nine minute or less response 0% of the time, with an average of 1.4 firefighters per response. Note that
this FRZ does not have the population density to be considered an urban response area, and is in fact
considered remote/rural. As such, the time threshold information is provided for reference only.
The initial response to the buildings in District 3 is volunteer service level response.

Fire and Paramedic Optimization Report
Page 120
Val Caron (FRZ 25) and District 4
District 4 and the associated Fire Response Zones
Val Caron, while not the largest Fire Response Zone by population in District 4, exhibits the highest
concentration of High Risk properties. This District 4 response corridor contains Fire Response Zones
23, 24, 25, 26, 27, 28, 29 and 30. District 4 contains 10.8% of the identified high risk properties in the
City of Greater Sudbury.
Detailed analysis of FRZ25 (Val Caron) reveals that the population density is 4.39P/Ha (Persons per
hectare), and has a Municipal Property Assessment Corporation (MPAC) assessment valuation of the
building stock of $461.5 million. NFPA 1720 identifies a population density of 3.86P/Ha as the threshold
for urban density, and therefore, Val Caron should be considered urban. There are 56 High Risk
properties representing 2.6% of the building stock in this FRZ. The identified properties include elderly
care occupancies, schools, and industrial and commercial business interests. This concentration of High
Risk properties identifies Val Caron as the economic hub of Fire District 4. Of note is the Valley East
Industrial Park, with a significant amount of high risk and high impact occupancies.

Fire and Paramedic Optimization Report
Page 121
The associated Fire Response Zones also contain significant high risk properties. Notably, FR26 (Val
Therese) has an urban population density of 6.82 P/Ha, an MPAC valuation of $708.5 million, and 11
high risk buildings. Also of note, FRZ27 (Hanmer) has an urban population density of 4.12 P/Ha, and 20
High Risk Buildings, and FRZ 29 (Capreol) has an urban population density of 5.12 P/Ha, and 31 High Risk
Properties. Response to these high density areas and high risk properties represent a significant
challenge to the service.
Response for FRZ 25, FRZ 26 and FRZ 27 are primarily supplied by Val Caron, Val Therese and Hanmer
Stations respectively. Combined, these three stations responded to 438 incidents in 2016. The primary
response station, Val Therese Station (Composite) achieved a nine minute first truck arrival to 81.5% of
the 256 incidents in its area, with an average of 2.4 firefighters. Val Caron Station achieved a nine
minute first truck arrival to 77.4% of the 99 incidents in its area, with an average of 2.3 firefighters.
Hanmer Station achieved a nine minute first truck arrival to 75.6% of the 83 incidents in its area, with an
average of 2.2 firefighters. Note that the responses in both FRZ 25 (Val Caron) and FRZ 27 (Hanmer)
include the instances where the first responding truck is actually the Val Therese Composite Truck.
These response averages fall short of the expectations of NFPA 1720 for an urban area, which is for a
nine minute response, 90% of the time.
The initial response to the buildings in District 4 is composite level from the Val Therese Station
supported by volunteer service level response, and volunteer service level in the remainder of Valley
East, and all of Capreol.

Fire and Paramedic Optimization Report
Page 122
Garson (FRZ 31) and Fire District 5
District 5 and the associated Fire Response Zones
Garson is the largest
suburban town on the
Eastern margin of the city.
This area of the city,
identified by Fire Services as
District 5, contains Fire
Response Zones 31, 32, 33,
34, 35, 36 and 37. District 5
contains 8.5% of the
identified high risk
properties in the City of
Greater Sudbury.
Detailed analysis of FRZ31
(Garson) reveals that the
population density is
8.25P/Ha (Persons per
hectare), with a Municipal
Property Assessment
Corporation (MPAC)
assessment valuation of the
building stock of $538.8
million. NFPA 1720
identifies a population
density of 3.86P/Ha as the
threshold for urban density,
and therefore, Garson
should be considered urban.
There are 24 High Risk
properties representing
1.1% of the building stock in
this FRZ. The identified
properties include schools,
and industrial and
commercial business

Fire and Paramedic Optimization Report
Page 123
interests. The location of Garson being adjacent to the New Sudbury area allows for cooperative
response to these areas.
The associated Fire Response Zones also contain significant high risk properties. Notably, FR33 (Rural
Nickel Centre) with a population density of only 0.08 P/Ha, but with an MPAC valuation of $453.5
million, and 40 high risk buildings, representing 2.7% of the building stock. Included in these occupancies
are the Greater Sudbury Airport and the Garson/Falconbridge mining complex, which extends out to the
Skead area. Response to these remote and high risk properties represent a significant challenge to the
service. There are also several notable high risk properties identified in and around Coniston (FRZ35).
Response for FRZ 31 and FRZ 33 are primarily supplied by Garson Station and supported by the
appropriate support station. Garson Station achieved a nine minute first truck arrival to 74.0% of the
117 incidents in its area, with an average attendance of 3.6 firefighters.
This response averages fall short of the expectations of NFPA 1720 for an urban area, which is for a nine
minute response, 90% of the time.
Fire Response Zone 36 and 37 (FRZ 36, 37) and Red Deer Lake Station
Analysis of Wahnapitae (FRZ 36) and the South East Townships (FRZ 37) reveals that there currently are
a combined 46 High Risk properties; a population density of 0.38 P/Ha in Wahnapitae and 0.08P/Ha in
the Townships, and that the response area covered by Red Deer Lake Station received an average of
four calls for service per year over the previous two-year period. GIS mapping reveals that there are
minimal high risk properties in FRZ 36 and FRZ 37 that are within the Red Deer Lake Station response
area. Current response analysis is currently not available for the Red Deer Lake Station. The station was
condemned for structural issues in 2015, and its associated volunteers now co-respond with
Wahnapitae Station.
Wahnapitae Station achieves an under nine minute response 63.2% of the time, with an average of 2.8
firefighters per response. Note that this FRZ does not have the population density to be considered an
urban response area, and is in fact considered remote/rural. As such, the time threshold information is
provided for reference only. Note also that much of FRZ 37 is served from a first response perspective
from Long Lake Station.
The initial response to the buildings in District 5 is volunteer service level response.
The City of Greater Sudbury is notable for having a high level of industrial investment as a proportion of
the overall MPAC valuation present in the city. This speaks to the resource extraction base of the
economy, and the large associated mining supply and service industry. This industrial base constitutes a
significant proportion of the high risk properties identified by the Community Risk Profile. In total, only
61% of high risk properties are located in the city core, while the remaining 39% are located in the
surrounding suburban, rural and remote areas. Currently the 39% of suburban, rural, or remote high
risk properties are protected by a composite response level, and/or a volunteer response level.

Fire and Paramedic Optimization Report
Page 124
These properties are distributed relatively equally in what the Fire Service has identified as its four
suburban districts; District 2 (Walden) – 9.2%, District 3 (Rayside Balfour and Onaping Falls) – 10.4%,
District 4(Valley East and Capreol) - 10.8%, and District 5(Nickel Centre) – 8.5%. Further complicating
matters is the fact that, included in the more remote areas, are high risk properties such as the city’s
airport, and much of the industrial mining and mine equipment sites. These properties form the base
for much of the city’s economy.
Auditor General – Enterprise Risk Registry
The Auditor General (AG) for the City of Greater Sudbury is tasked with researching the business risks for
the various departments of the municipality. More recently the AG has contacted Community Safety to
conduct an Enterprise Risk Registry (ERR) for each of Fire (see Appendix #R3) and Paramedic Services
(see Appendix #R2). The AG’s Office tracks information related to the short, mid-, and long-term
sustainability of the department, and an analysis of the liabilities inherent in the delivery of services.
Major criteria for the analysis include: reputation, operations, financial, and legal/regulatory.
The AG’s Office used standard risk identification methodology by first identifying the potential
consequence or impact of an event, and then assessing the frequency or likelihood of the event, based
on historical analysis and/or projected frequency. The risk score for the event is then the simple
multiplied product of these two numbers. Each criteria is scored on a scale of one to four, with one
being low or least likely and four being high or likely, resulting in a risk score ranging from one to 16.
The City of Greater Sudbury has adopted explanatory notes to assist in the scoring matrix for both
impact and likelihood. These serve to reduce the subjectivity of the process to a minimum.
Both services worked independently with the AG’s Office in identifying and scoring the departmental
mitigation criteria to reduce or eliminate the identified risks. Mitigation techniques are grouped into
three categories of people, process and information systems/technology.
The mitigation techniques of people, process and system/technology are not necessarily independent of
each other, with the most successful mitigation techniques rely on a combination thereof. A conceptual
example of this is the idea is that a new software program (system/technology) can reduce the
likelihood of an identified risk, but the same program, when combined with a policy/procedure (process)
for its use, and documented training (people) could reduce the likelihood of the risk significantly more.
It should be noted, the impact of some risks cannot be mitigated so their impact on the organization
remains consistent, for example the death of an employee. Each identified risk must be assessed
individually to determine if the residual impact is changed by the application of mitigation techniques.
For Paramedic Services, 54 overall risks were identified for analysis. They are grouped into the following
four categories: eight relate to Reputation, 22 relate to Operations, 18 relate to Finance, and six relate
to Legal/Regulatory issues. Of the 54 risk subjects identified by the AG’s Office, 49 are mitigated to a
low risk level (six or less) by way of people, process or system/technology. The five remaining risks with
a residual score of 6.1 or greater are related to station location and functionality and cannot be further
mitigated outside of investments in stations. Building investments as proposed in the Optimization Plan
would reduce the residual risk range from the current moderate residual levels to a low residual.

Fire and Paramedic Optimization Report
Page 125
The five identified high risk items can be broken down further based on the ability for the Paramedic
Services to design and implement impactful mitigation. For example in risk item O1A- paramedic
stations are noted to be in wrong locations. Headquarters is identified as a significant mitigated risk
with a rating of nine. Based on existing knowledge and the fact that current mitigation strategies have
already been exhausted (EVT program, staggered shift start times) and there are no ways to reduce
mitigation through evolving Paramedic Services opportunities, the only way left to reduce the risk would
be to move the station, which is one of the recommendations of the Optimization Plan.
Paramedic Services
High Rated Risk Subjects – Current Mitigation and Optimized Mitigation
Risk Subject
Unmitigated
Risk
Mitigated
Risk
Optimized
Risk
Op
era
tio
nal
O1A Paramedic stations are in wrong locations (Headquarters) 16.0 9.0 2.7
O1B Paramedic stations are in wrong locations (In-town posts) 12.0 6.8 2.4
O1C Paramedic stations are in wrong locations (Satellite posts) 12.0 6.8 2.4
O02 Paramedic stations lack essential functionality 12.0 7.7 2.8
Fin
anci
al
F18 Financial impact of Paramedic Headquarters in wrong location 14.0 9.0 2.7
In Fire Service, there were 60 identified risks including: 12 related to reputation, 23 for operations, 16
related to finance, and nine connected to legal and regulatory issues. Thirty-nine of these are currently
mitigated to an acceptable level by way of the people, process, system/technology that are in place.
The remaining 21 items require either: public acceptance of the risks at the current level(s) by the
community including Council, the Executive Leadership Team, Fire Services Administration, Community
Stakeholders, and the citizens of the city; or additional mitigation at an acceptable risk level by whatever
means are deemed appropriate by Fire Services and/or Council.
The 21 identified high risk items for Fire Services are listed in the following table and broken down
further based on the ability of the Fire Services Administration to design and implement impactful
mitigation. For example, risk item O1-Fire Stations are in the wrong locations, is identified as a
significant risk, and based on the research associated with the Optimization Project, the likelihood of
this item is four (out of a possible four).
That being said, Fire Services cannot mitigate this risk beyond a certain threshold, due to the fact that
the stations cannot easily be moved. Further, the decision to move the stations rests with Council, not
Fire Services. Additional examples would involve those dependent upon the provincial or federal

Fire and Paramedic Optimization Report
Page 126
governments, or items under control of the municipal government, but primarily outside of the Fire
Services Department, such as financial investment in the department.
The following table is designed to recognize these challenges. Items shaded in blue or orange are
essentially beyond the scope of Fire Services to mitigate further than what has currently been done.
The green coloured items do provide Fire Services with an opportunity for mitigation, but due to the
necessity for financial investment for almost all of them, would require approval by Council to effect any
significant mitigation. For the service level items, the basis for departmental mitigation at the present
time would primarily entail public communication of service levels.

Fire and Paramedic Optimization Report
Page 127
Fire Services
High Rated Risk Subjects – Current Mitigation and Optimized Mitigation
Risk Subject
Unmitigated Risk
(/16)
Mitigated
Risk (/16)
Optimized Risk
(/16)
Re
pu
tati
on
R1 Old trucks may result in breakdowns and incidents 10.5 8.5 3.8
R2 Volunteer response is inconsistent, and may compromise service 12.0 10.8 4.9
R4 Fire Prevention and Education Services are inadequate - Volunteer
Area 10.5 10.5 3.8
R5 Fire response capability may be inadequate – Volunteer Area 11.3 10.2 1.2
R6 Medical response capability may be inadequate – Non-MTR Areas 7.5 7.5 2.4
R7 Technical response capability may be inadequate – Non-Water
Rescue Areas 10.5 10.5 3.8
R8 HAZMat response capability may be inadequate 11.3 10.2 2.5
Op
era
tio
nal
O1 Fire stations are in wrong locations 15.0 13.5 2.2
O2 Fire stations lack essential functionality 14.0 12.6 2.0
O3 Volunteer staff are ineffective in terms of skills (training, knowledge
and experience) 10.5 9.5 4.3
O4 Volunteer staff response is unreliable 12.0 10.8 4.9
O12 Serious staff and/or citizen injuries occur while enroute to the scene 11.3 9.1 4.1
O22 Fleet may fail and compromise service delivery 10.5 8.5 3.8
Fin
anci
al
F1 Fire services are not sustainable/affordable 10.5 9.5 9.5
F3 Labour costs are not sustainable/affordable 9.8 8.8 8.8
F11 The investment in fleet has been insufficient for effective fire
services 14.0 11.3 5.1
F12 The investment in buildings has been insufficient for effective fire
services 15.0 12.2 3.0
F13 Lack of effective asset management systems compromises budget
decisions 10.5 8.5 4.8
F14 Lack of effective long-term financial planning processes in CGS
compromises capital budget decisions 10.5 8.5 4.8
Legi
slat
ive L1 Presumptive legislation imposes unaffordable costs 9.0 7.3 4.7

Fire and Paramedic Optimization Report
Page 128
All of the items have been assessed to determine the impact of the Optimization Project, and the resulting risk score is presented for consideration. The reduction credited to Optimization is a projection based on the current legislative framework in place in the province and the municipality, and assumes a relatively consistent expectation of services by the public. As a result, they may be under or overstated. Note that all items experience an impact, including the ones under outside jurisdiction. This is due to the reduced exposure to provincial legislation and Arbitral Jurisprudence that would result from optimization, once implemented.
Key messages of this section:
The communities of Chelmsford, Garson, Lively and Val Caron/Val Therese each have a sizable total population, population density and considerable concentration of high risk buildings that are currently not responding at an urban level, in alignment with response standards of the National Fire Protection Association (NFPA).
These finding have been confirmed through the analysis by the Fire Underwriter’s Survey in 2015.
The City’s Auditor General reviewed Paramedic and Fire Service operations and identified over 100 risks (54 for Paramedic, 60 for Fire). Of these risks, 26 (five for Paramedic, 21 for Fire) were identified has high risk items that are not currently mitigated to an acceptable level. These items are mainly related to station condition and location, inadequate fire response capability, and insufficient funding for building repairs and replacement of fire vehicles and major equipment.
Implementing the proposed optimized model can reduce the risk of many of the items identified in the Enterprise Risk Registry by the Auditor General.

Fire and Paramedic Optimization Report
Page 129
COST ANALYSIS
What you will learn in this section:
Source and size of the funding shortfall that exists for Fire Services
What is presumptive legislation and how does it affect the cost of staffing
During the analysis, a number of key observations were identified that relate directly to the costs of
operating Fire and Paramedic Services. Included observations are the existence of a significant capital
gap for station maintenance, and replacement of fire vehicles and major equipment, and an
underfunded presumptive legislation liability.
Capital Gap
Stations
Twenty-seven emergency services stations, including Headquarters, are currently operated by the
Community Safety Department. Eight of these stations are shared by Fire and Paramedic Services, 16
are stand-alone fire stations and two are stand-alone paramedic stations. The average age of the
stations is 44 years. Three stations are already beyond their recommended 50 year lifecycle and an
additional 12 stations will reach the end of their lifecycle within the next 10 years. One station, Red
Deer Lake, has been closed since 2015 due to foundation/structural failures. If a significant investment
is not made to improve the condition of the stations, service delivery may be further compromised.
In 2013-2014, CCI Engineering Group was commissioned to conduct an independent building condition
assessment on 25 of the 27 stations operated under the Community Safety Department. The two stand-
alone paramedic stations were not included in this assessment. The report concluded that the probable
costs required to address building deficiencies would necessitate an investment of $20.4 million (in
2013-14 dollars) over the next 10 years (see Appendix #F2). This independent report focused solely on
needs relational to systems and structures and did not address any improvements to size and
configuration that are needed to meet current legislative requirements under the Occupational Health
and Safety Act (OHSA).
A risk assessment analysis conducted by the Auditor General’s Office, identified that several Emergency
Services Stations lack essential functionality as required by the Occupational Health and Safety Act. In
certain stations, the garage doors and bay areas are too small to accept the modern fleet of vehicles
which results in placement of trucks based on their ability to fit in the station and not necessarily what is
needed to effectively respond to calls in the area. Furthermore, none of the stations have a point-
source-capture diesel emission system which is a recommended system under the Section 21 Guidelines
from the Ministry of Labour. Several stations do have space ventilation systems, which activates when
diesel emissions are detected, but these result in exposure prior to activation of the system. The lack of
a proactive safety system creates a liability for the City.
In summary, a major financial investment is required to address current building deficiencies. The cost
to repair and/or replace the existing stations is based on a recommended 50 year lifecycle and is

Fire and Paramedic Optimization Report
Page 130
estimated to be $135 million over the next 20 years (see Appendix #F4). This value has been calculated
using the third party building condition assessments for repairs and a new construction rate from the
City’s Assets Management Real Estate Department of $350 per square foot for new builds, which
includes estimated costs for architecture and engineering services. There is currently no funding within
the budget to address these needs.
Vehicles and Major Equipment
An analysis of the capital requirements for Paramedic Services was conducted and it was determined
that the current funding model is sufficient to meet the replacement needs for vehicles and major
equipment. This is primarily due to the fact that the delivery of land ambulance services is 50% funded
through the Ministry of Health and Long-Term Care, but also due in part to Paramedic Services continual
approach towards optimization. As a result, this section will focus solely on the replacement
requirements for Fire Services front-line vehicles and major equipment.
Fire Services currently has 73 front-line response vehicles and over 6,900 pieces of major firefighting
equipment (see Appendix #F3). Most of the front-line response vehicles have a 20 year lifecycle. A
major factor in the 20-year lifecycle is that vehicles older than 20 years have a negative impact on the
FUS rating and thus insurance rates for residents and businesses in the community. As of 2016, there
were 14 front-line vehicles that are at or beyond the 20-year lifecycle with an additional 10 units
surpassing their useful life within the next two or three years. This represents 33% of the front-line
vehicle fleet. Lifecycles for major firefighting equipment range from five to 20 years. Some equipment,
such as bunker gear (the fire protective clothing) must be discarded at the end of their 10 year lifecycle
regardless of the condition of the equipment. Self-contained breathing apparatus (SCBA/oxygen mask
and kit) are replaced every 15 years as per provincial regulations.
From a financial perspective, there is a direct correlation between the number of firefighters employed
and the cost required to retain appropriate levels of vehicles and major equipment. Due to the high cost
of firefighting vehicles and equipment, it’s imperative that the service maintain an effective level of
meaningfully participating firefighters to ensure efficient use of funds required to purchase these
expensive pieces of equipment.
A capital replacement analysis (see Appendix #F3) shows that the cost to replace the current fleet of
vehicles and major equipment over a full 20-year lifecycle is $47.2 million. The amount of funding
received over the same period is $31.1 million resulting in a shortfall of $16.1 million.

Fire and Paramedic Optimization Report
Page 131
Presumptive Legislation
The City of Greater Sudbury is a Workplace Safety and Insurance Board (WSIB) Schedule 2 employer
which means that the organization has opted to pay the WSIB dollar for dollar for costs associated with
a claim instead of a paying a regular premium based on wages. This payment also requires an additional
administrative fee which averages approximately 35% of the claim amount. Furthermore, the City is
responsible for paying the costs of claims indefinitely.
Employers of firefighters, both career and volunteer, are subject to presumptive legislation liability.
WSIB policy states that “if a firefighter is diagnosed with a prescribed cancer on or after January 1, 1960,
and meets the employment duration and additional criteria for the prescribed cancer, then the disease is
presumed to be an occupational disease due to the nature of the worker’s employment, unless the
contrary is shown”. There are currently 13 different cancers covered by this legislation which includes a
number of the most common cancers such as prostate, lung, colorectal, kidney, brain, bladder and
leukemia. Based on the 2015 Canadian Cancer Statistics Report, males have a 45% lifetime probability
of contracting cancer. Additionally, a recent study conducted by Fraser Valley University suggests that
firefighters are 9% more likely to contract cancer that the general population.
According to section 16.01 of the volunteer (CLAC) Collective Bargaining Agreement, the employer
agrees to set the amount of Workplace Safety and Insurance Board coverage for volunteers to the
maximum allowable rate as set by Workplace Safety and Insurance Act (WSIA). The WSIA requires that
municipalities set an agreed WSIB amount for volunteers which must be at least 50% of the earnings
maximum and it must be the same for all volunteers. Fire Services has 418 current and past employees
that meet the employment duration eligibility for presumptive cancer legislation.
Presumptive legislation also exists for firefighters who, “experience heart injury while, or within 24 hours
of (a) attending a Fire scene in the performance of his or her duties, or (b) actively participating in a
training exercise that is related to his or her duties and that involves a simulated Fire emergency”. As of
December 31, 2016, Greater Sudbury Fire Services employs 373 career and volunteer firefighters.
In addition to the above mentioned firefighter presumptive legislation, as an employer the City is subject
to Bill 163 Supporting Ontario’s First Responders Act (Post-traumatic stress disorder), 2016. This
legislation creates the presumption that post-traumatic stress disorder (PTSD) diagnosed in first
responders including firefighters and paramedics, is work-related and thus employers are responsible
for related costs. Unlike presumptive cancers, there is no minimum employment durations associated
with post traumatic stress disorder legislation. It’s possible for a worker to develop post traumatic
stress disorder on their very first call. There are a total of 158 paramedics employed by the City plus the
above mentioned 373 firefighters, who would fall under this legislated liability.
Of the 613 full-time staff working within the Community Safety Department, 575 are covered by
presumptive legislation under the Workplace Safety and Insurance Act. To provide sufficient funding to
cover the potential liability related to presumptive legislation, it’s estimated that $2.20 for every $100 in
wages is needed to be set aside in reserve to cover future claims. In the chronic exposure policy, for
prescribed cancers and heart injury, under WSIA there is no distinction between a career firefighter and

Fire and Paramedic Optimization Report
Page 132
a volunteer firefighter (a firefighter is a firefighter). As a result, for the purpose for calculating the
potential liability for presumptive legislation a First Class Firefighter rate was used as the annual wage
for volunteers. The total amount determined to be set aside each year is estimate at $1.6 million. In
2016, the total amount of money set aside for WSIB related claims for Fire Services was $252,000
meaning that $1.37 million remains unfunded (see Appendix #F5). Since Bill 163, related to presumptive
post traumatic stress disorder came into effect in 2016, the potential liability for Paramedic Services has
been included in the estimates outlined above.
Key messages of this section:
- In 2014, the CCI Engineering Group identified that the City’s 24 fire stations and Headquarters
require an investment of $20.4 million to address deficiencies related to systems and
structures. This amount does not address improvements to size and configurations that are
needed to meet legislative requirements.
- Stations have a recommended lifespan of 50 years and currently, the average age of Greater
Sudbury’s 24 fire stations is 44 years old. This current service delivery model requires an
investment of $135 million over the next 20 years for the renewal of all emergency services
stations.
- Fire Services requires $47.2 million over the next 20 years to replace front-line vehicles (fire
trucks) and major equipment, but are only funded to receive $31.1 million resulting in a
shortfall of $16.1 million.
- Presumptive legislation results in a staffing cost for employers of firefighters (career and
volunteer) and paramedics to cover WSIB claims associated with workplace related illnesses or
injuries such as cancer, heart injury, or post-traumatic stress disorder (PTSD). The funding for
this expense is allocated below the recommended rates resulting in a shortfall of nearly $1.4
million.

Fire and Paramedic Optimization Report
Page 133
AREA RATED TAXATION ANALYSIS
What you will learn in this section:
How taxation for fire services is applied in Greater Sudbury
Issues with current taxation model
Options for possible changes to taxation for fire services that provide a fairer taxation model
based on the current service delivery model
Current Fire Service Taxation Model
Prior to amalgamation, a transition board was established to ensure a smooth changeover from a two-
tiered municipal system to one city. A decision was made by the first Council of the City of Greater
Sudbury, as recommended by the transition board to only area rate Fire and Transportation Services,
recognizing the differing service levels. Although an analysis of the different service levels provided by
the seven former area municipalities was completed, it’s apparent now that there wasn’t a clear
understanding or ability to analyze true costs and usage (staffing, vehicle, equipment and buildings) to
operate each Fire Service. Additionally, no benchmarks existed at that time to define a viable Fire
Service and to provide a true measure of risks or needs and circumstances. There was also no consistent
application of a third party analysis, standards and/or best practices (FUS/NFPA), and no consideration
was given to response times.

Fire and Paramedic Optimization Report
Page 134
The map above demonstrates the division of the city by career, composite and volunteer serviced areas.
Based on an average home assessment value of $230,000 in 2016 and on the 2016 tax rates, each of
these areas pay a different tax rate based on these service levels. In the career serviced area (high
service), a homeowner is paying approximately $340 per year in taxes for fire service. This amount is
$233.82 for composite rated areas (medium service) and $134.32 for volunteer rated areas (low
service). See Appendix #F6 for further taxation calculation details.
A substantial number of resources (staffing, vehicle, equipment and buildings) are required to support
the delivery of fire protection services. It is often portrayed by some stakeholders that the volunteer
firefighter costs are $1.3 million annually. However, this amount only reflects the staffing component
and doesn’t take into consideration the usage of resources such as vehicles, equipment and buildings.

Fire and Paramedic Optimization Report
Page 135
An in depth analysis of all costs related to the provision of fire protection services was conducted to
identify the true costs for each level of service (career, composite and volunteer). Area rated taxation is
distributed based on 100% of the wages of the firefighters associated with the level of service, plus a
portion of the base costs. Base costs include:
Contribution to capital envelope,
administration costs,
fleet and apparatus costs,
prevention and public education costs,
training costs, and
the training academy.
These costs are allocated to each area based on a rate that was determined at amalgamation (59% to
the career area, 12% to the composite area and 29% to the volunteer area). Calculations for taxation in
each area are provided in Appendix #F7. In summary, the fire portion of 2016 taxation for a home
valued at $230,000 would be $340.45 in the career rated area, $233.79 in the composite rated area, and
$134.01 in the volunteer rated area.
An analysis of the actual costs of providing fire services in each of these areas compared to the taxation
charged was also undertaken. As demonstrated in the diagrams below, there is a significant difference
between the use of resources (stations and vehicles) and the taxation that is charged to residents and
businesses in both the career and volunteer rated areas. The career rated area utilizes 26% of the
resources required to provide fire services, but pays over 59% of the base costs. The opposite is true in
volunteer rated areas which utilize 61% of the resources but are taxed factoring in just under 29% of the
base costs. The composite rated area is the most balanced where resource utilization is about 13% and
taxation is just under 12% of the base costs.

Fire and Paramedic Optimization Report
Page 136
Further to this cost disparity, several service level inconsistencies currently exist within each area rated
taxation level. For example:
Remote and rural areas such as Worthington, Fairbank Lake, Stinson, Hwy 537 corridor, receive
a significantly delayed response within the same area rating taxation as downtown Chelmsford,
Lively or Garson.
Highway 69 South in the Wanup area pays volunteer taxation rate while its primary response is
a career firefighter response from Long Lake Station.
Copper Cliff pays career taxation rate while its primary response is volunteer with career co-
response for every incident.
Garson and Coniston currently pay volunteer taxation and have rapid career response for all
significant incidents. Primary response remains at the volunteer level.
Much of the greater Capreol area is entrenched in the composite taxation area and receives
primary response from Capreol station which is volunteer response level.
Skead and Azilda stations are the only two volunteer stations that offer water rescue response
at an enhanced level while maintaining a volunteer taxation level.
Capreol, Dowling and Levack stations are the only three volunteer stations which offer medical
tiered response (MTR) while maintaining a volunteer taxation level.
Further adding to this inconsistent approach, Fire Services dispatches career response (optimized tiered
response) to any working fire or smoke showing regardless of the taxation levels paid by the citizens.
This is done in the interest of public safety, first responder safety, and in an attempt to minimize
corporate risk identified in the inherent nature of the volunteer firefighter discretionary response. This
enhanced response is also not accounted for in the current area rated taxation model.
The examples above demonstrate that the boundaries established at amalgamation no longer reflect
the service being received. Should the boundaries remain unchanged, they may also not align with a
One City One Service delivery model. Added to this is the need for greater investment to meet the
current maintenance and capital replacement necessities previously mentioned for vehicles, equipment
and buildings. In order to fully fund these requirements, an increase to the annual capital budget of
approximately $2.8 million per year is needed, which includes $756,000 to close gap for vehicles and
major equipment and an additional $2.04 million to repair existing stations (based on CCI Group building
condition report). This increase would be added to the base costs and allocated to each service level
area based on the established rates as noted above (Career – 59%, Composite – 12%, Volunteer – 29%).
Continuing to use the current area rated taxation model would result in a significant increase of this
burden to taxpayers in the career-rated areas as they cover over 59% of base costs.

Fire and Paramedic Optimization Report
Page 137
Current Model Taxation (No Change)
The graph below demonstrates inflationary increases only to taxation over the next ten years based on
an average home assessment value of $230,000 in 2016 at the 2016 tax rates and at an annual inflation
rate of 3%. In this scenario, career rated areas will continue to subsidize volunteer rated areas as
described above (actual adjustments will be greater or lesser depending on a property’s actual assessed
value).
Current Model - Taxation Corrected Based on Actual Usage
The following graph demonstrates changes to taxation if the area rated model was adjusted. Once
again, the calculations are based on an average home assessment value of $230,000 in 2016 at the 2016
tax rates, and at an annual inflation rate of 3%. In this scenario, each area is taxed for the Fire Services
resources they are actually using.
In the following taxation year, residents in the career rated area would see their taxes for Fire Services
decrease from $340 to $297.97. Both the composite and volunteer rated area residents would receive
tax increases to $249.48 and $243.47 respectively (actual adjustments will be greater or lesser
depending on a property’s actual assessed value).

Fire and Paramedic Optimization Report
Page 138
Current Model – Flat Rate Taxation
The graph below demonstrates changes to taxation if a flat rate model is applied. Once again, the
calculations are based on an average home assessment value of $230,000 in 2016 at the 2016 tax rates
and at an annual inflation rate of 3%. In this scenario, all residents pay the same rate of taxation for Fire
Services which would adjust immediately to $276.57. This represents a decrease of $63.43 for the
career rated area, and an increase to the composite and volunteer rated areas of $42.75 and $142.25
respectively with no service level improvements for residents (actual adjustments will be greater or
lesser depending on a property’s actual assessed value).
The effects on taxation from implementing an optimized model will be described at the end of this section.

Fire and Paramedic Optimization Report
Page 139
Key messages of this section:
- Taxation for fire services was established during amalgamation based on level of service
(career, composite or volunteer) and the associated firefighter wages. It did not appropriately
allocate the use of resources such as stations, vehicles and major equipment (base costs). An
analysis of actual resource usage identified that the career rated area is subsidizing the
volunteer rated areas, and that the composite rated area is nearly balanced.
- Career response is dispatched to any working fire or smoke showing regardless of the taxation
level paid by residents in the interest of public safety, first responder safety, and in an attempt
to minimize risk to the organization of the City of Greater Sudbury.
- Recommendation that area rated taxation should be adjusted even if the Optimized Plan is
not adopted so as to better reflect the actual usage of fire services by residents (an adjusted
utilization model or flat rate model).

Fire Optimization Report

Fire and Paramedic Optimization Report
Page 140
PROPOSED OPTIMIZED MODEL
What you will learn in this section:
Solutions that place Fire and Paramedic Services in a sustainable position and focus on public
safety.
Suggested service level standards that will establish clear goals and performance metrics for
fire service delivery that can be used to understand current and future staffing and service
needs.
Recommendations for changes to achieve an optimized, One City One Service delivery model
that address community needs and risks.
An overview of the costs associated with the changes for an optimized model that over time
will create a fair taxation model that appropriately funds proper service delivery.
Fire and Paramedic Services has developed an optimized service delivery model that is a highly
interconnected system. All of the optimized solutions work together to create a system as fully
functional and effective as possible.
This optimized model requires a phased in transformation of stations and locations, proper alignment
and delivery of services to address the risks that exist in the community, and a phased in transformation
of the staffing profile to achieve a One City One Service model that aims to realize the identified guiding
principles. This model realizes opportunities for cost avoidance and, where necessary, invests in
infrastructure and staffing that best serves not only today’s residents, but those of the future as well.
At the heart of Optimization is public safety. This Optimized Plan offers a number of significant benefits
to the community. From a Paramedic Services perspective, Optimization presents an opportunity to
continue improvement with an ability to reach more of the communities through newly aligned station
locations. There is also an opportunity for a cost avoidance strategy to redeploy service hours through
the relocation of stations. From a Fire Services perspective, Optimization vastly improves fire ground
attendance and response times which means an emergency vehicle gets to the citizens when it matters
most. Optimization greatly increases the safety of residents, properties, motorists and injured persons
through immediate guaranteed, timely response. Technical rescue services such as ice and water,
confined space, trench rescue and hazardous materials are created and enhanced to align with
community risks. Overall, public safety is of the greatest importance and the Optimization Plan would
succeed in improving it.

Fire and Paramedic Optimization Report
Page 141
Service Level Standards
The first step in pursuit of an optimized model should be the establishment of service level standards. In
Paramedic Services, mainly due to provincial legislation but also based on direction from Council, service
level expectations are set. The main area in this regard is the Ambulance Response Time Standard,
touched upon earlier. There are clear goals that Paramedic Services strives toward and is measured
against. Establishing goals and setting out to achieve them is the main focus of a performance based
system. The decision at assumption to place Paramedic Services in a performance-based approach has
led to Greater Sudbury Paramedic Services being one of the best services in the province.
Throughout the many public presentations leading up to this report, it has become evident that
Paramedic Services provides a trusted, well established service delivery model. The same has not been
said for Fire Services. There are best practice documents available, namely the NFPA 1710 and 1720
guidelines, which are primarily used to measure value for money and the ability to consistently serve the
public. In the absence of legislation or direction, these standards would be used in an investigation to
determine a service’s response benchmark.
Service delivery standards would establish benchmarks that would allow Council, Fire Administration
and the public to understand current and future staffing and service needs for the Fire Service. Greater
Sudbury Fire Services does not have established service delivery standards for determining acceptable
levels of emergency services that they provide.
As noted in the 2014 IBI Group Fire Service Comprehensive Review;
“At the present time there are no response standards / targets in place for the
volunteer fire operations. The Communications Centre monitors the page-out
and assembly of the volunteers to determine whether or not to re-page or call
out additional resources.
Several peer departments surveyed have established standards and/or targets
based on National Fire Protection Association 1720 for volunteers which
suggests; time for the dispatch process, established assembly/turnout times,
response times and on-scene staffing targets.
Although there is no legislative requirement of what performance measure or
standard to meet, municipalities are tasked with setting the service level that
meets the needs and financial capabilities of their municipality
We recommend that GSFS should establish and strive to achieve response
standards/targets for the Volunteer Fire Operations based on NFPA 1720 and
consider incorporating into an internal operating policy.”

Fire and Paramedic Optimization Report
Page 142
While the IBI Group notes the lack for the volunteer area, it is important to recognize that there are also no service standards in place in the career or composite response areas in the City of Greater Sudbury. For purposes of Optimization, service standards aim to address this service gap identified by the IBI Group for all fire personnel regardless of being career, composite or volunteer.
The key to successful mitigation of emergencies is based on a combination of factors including: dispatch,
chute, and response times. Dispatch time is considered the point of receipt of the emergency alarm at
the public safety answering point (a call to 911 being answered), to the point where sufficient
information is known to the dispatcher and applicable units are notified of the emergency (dispatcher
notifies firefighters). Chute time was identified earlier as the time from being notified or paged of the
emergency to the time that the crew notifies Dispatch that they are travelling to the scene. Response
time is a combination of chute time and the actual travel time it takes to be on scene. It is important to
note that these time measurements mirror similar measurements established within the performance
based Paramedic Services model.
Several factors need to be considered when establishing service levels, including risk to life and
property, hazards and population demographics. Below are a series of considerations for future
discussion on service delivery standards:
1. Establishing a minimum of four firefighters per responding apparatus for engines, pumpers and
aerial devices, with certain defined exceptions.
2. Establishing a risk analysis approach to response service standards for the entire City of Greater
Sudbury.
3. Negotiate with Police Services Dispatch to establish dispatch standards which apply to all fire
services incident paging and dispatch in the City of Greater Sudbury.
4. Fire Services establish a career turnout standard, and a volunteer assembly standard to apply in
the entire City of Greater Sudbury.
5. Establishing a response time arrival standard for urban, suburban, rural and remote emergency
incidents, based on the NFPA 1720 benchmark population densities of:
a. Urban - 3.86 Persons/Hectare,
b. Suburban - 1.93-3.86 P/Ha,
c. Rural - Less than 1.93P/Ha,
d. Remote - Beyond 13km from a fire station.
6. Establishing a policy for interior fire attack (and technical rescue) and rescue which identifies
four firefighters on scene as the minimum for situations where, in the qualified opinion of the
Incident Commander, there is no risk of entrapment or collapse, and the interior (or rescue)
operations can be attempted safely.

Fire and Paramedic Optimization Report
Page 143
7. Establishing a policy for interior attack and rescue which identifies a minimum of 14 firefighters
on scene, or imminently arriving on the scene, for situations where in the qualified opinion of
the Incident Commander a risk of entrapment or collapse is possible.
8. Establishing a policy of exterior attack, with no rescue, for incidents where fire ground staffing
does not meet or exceed the thresholds identified above.
9. Establish annual auditing for all service delivery standards which will allow for confirmation of
service levels and serve as a planning tool for future growth.
10. Establish a minimum annual call volume for a response station. Stations which regularly
experience call volumes below this threshold should be given consideration for consolidation
with adjacent stations. Such consideration will include a review of the Community Risk Profile,
and the Service Delivery Standards as the basis for recommendations to Council.
Greater Sudbury Fire Services has researched industry best practice, and the initial recommendation
would seek to establish a standard which will see a dispatch time of 60 seconds or less, 90% of the time,
for all fire beats. In addition to seeking direction from Council, Greater Sudbury Police Services (GSPS) is
the contractor for these services, and identification and administration of this standard would be
dependent upon a Service Level Agreement (SLA) negotiated and agreed with them. This one-minute
(60 second) Dispatch Time is in accordance with the NFPA 1710 and NFPA 1720 recommendation for all
fire protection areas.
In addition, initial analysis and recommendation would seek to establish a chute time of 1:20 minutes,
90% of the time for career stations (inclusive of the career portion of composite stations) and under five
minutes, 90% of the times for volunteer stations. Confirmation of these recommendations would be at
Council’s direction.
A compilation of the resultant response time initial recommendations would be established based upon
urban, suburban, rural and remote designations as detailed above, and are summarized below;
A. URBAN for Fire Protection Districts with population density exceeding 3.86P/Ha, and a total
population greater than 3,000.
1) A dispatch time of 60 seconds. 2) A turnout time of one minute, twenty seconds (1:20). 3) A response time of five minutes twenty seconds (5:20), or less 90% of the time for single
unit responses, or for the first arriving unit of a multiple unit response. The initial unit will have a staffing of a minimum of four firefighters.
4) A response time of nine minutes or less 90% of the time be established for subsequent arriving units of a multiple unit response or alarm assignment.
5) A full alarm assignment consists of two Engines, one Aerial, for a total of 12 personnel. 6) A dedicated Incident Commander will be dispatched on full alarm assignments, with no
response time criteria.

Fire and Paramedic Optimization Report
Page 144
7) A subsequent alarm assignment consists of a minimum of two units (configuration acceptable to the Incident Commander) for a total of eight additional personnel.
B. SUBURBAN for Fire Protection Districts with population density between 1.93 and 3.86 P/Ha,
and/or a total population greater than 1000.
1) A dispatch time of 60 seconds. 2) Career Turnout: A turnout time of one minute, twenty seconds (1:20). 3) Volunteer Turnout: A turnout time of five minutes (5:00) or less 90% of the time. 4) A response time of nine minutes or less 90% of the time for single unit responses, or for
the first arriving unit of a multiple unit response. The initial unit has a staffing of a minimum of four firefighters.
5) A response time of nine minutes or less 80% of the time be established for subsequent arriving units and eight firefighters, for a multiple unit response or alarm assignment.
6) A dedicated Incident Commander will be dispatched on full alarm assignments, with no response time criteria.
C. RURAL for Fire Protection Districts with population density below 1.93 P/Ha, but within 13
kilometres of a fire station.
1) A dispatch time of 60 seconds. 2) Career Turnout: A turnout time of one minute, twenty seconds (1:20). 3) Volunteer Turnout: A turnout time of five minutes (5:00) or less 90% of the time. 4) A response time of 14 minutes or less 80% of the time for single unit responses, or for
the first arriving unit of a multiple unit response. The initial unit has a staffing of a minimum of four firefighters.
5) A response time of 14 minutes or less 80% of the time be established for subsequent arriving units and six total firefighters, for a multiple unit response or alarm assignment.
6) A dedicated Incident Commander will be dispatched on full alarm assignments, with no response time criteria.
D. REMOTE for properties beyond 13 kilometres from the nearest fire station.
1) A dispatch time of 60 seconds. 2) Career Turnout: A turnout time of one minute, twenty seconds (1:20). 3) Volunteer Turnout: A turnout time of five minutes (5:00) or less - 90% of the time. 4) A response time dependent upon the drive time to the incident. The initial unit has a
staffing of a minimum of four firefighters.
The establishment of a performance-based system of service delivery in the Fire Services would advance
not only moving toward an optimized system, but would also establish the level of expectation from
both Council and citizens. It is essential that service delivery standards are set to ensure that
expectations of this essential public service are determined in advance of an actual emergency.

Fire and Paramedic Optimization Report
Page 145
Stations
The Fire and Paramedic Services Optimized model reduces the total number of stations required in the
provision of emergency response for paramedics and firefighters from 27 to 17 buildings in locations
that are best able to respond to the risks and needs of the entire city (see Appendices #M23, #M24, and
#M25). This reduction in number of stations will reduce the overall average age of stations to just 19
years from its current average age of 44, and will help ensure that buildings meet the modern needs and
legislative requirements for both services. Furthermore, these stations will be appropriately staffed
through the use of both career and volunteer firefighters. The transformation of these stations and
associated staffing is anticipated to occur in a number of phases over the next seven to ten years.
Staff reviewed each area of the city and identified the appropriate classification of urban, suburban or
rural as per NFPA guidelines to determine the level of response recommended for each area. Next, they
reviewed historical number of incidents, response times and incident attendance for each area to see
how they aligned to industry standards. Finally, staff looked at the presence of high risk properties in
each area to determine the level of hazards that may exist in a community. A table summarizing these
details of each station can be found in Appendix #T7. Cost and the ability to reduce operating expenses
for building repairs and maintenance was also a determining factor for the overall plan. Staffing
recommendations are also aimed to balance service level needs and risks present with labour costs.
New Fire and Paramedic Services Headquarters and Former City Stations
It has been determined that to best serve both Paramedic and Fire Services, the Headquarters should be
located within the city core in the vicinity of Lasalle Boulevard and Maley Drive Extension, which is
currently being constructed. The main Headquarters at the Lionel E. Lalonde Centre would look to be
repurposed. The building, while older, still has a good infrastructure that could be used by many other
departments within the City. The fact that the building is not in an optimal location for Fire and
Paramedic Services does not mean that it wouldn’t be a good location for others. With the current
infrastructure inherent in the building, one use could be converting it into a full training centre.
The relocation of Headquarters to a more centrally located location within the city core has many
benefits. A central location will allow management, logistical and administrative staff to better support
front-line emergency services workers working in the field. The reduction in travel time for the
Paramedic Services Platoon Superintendent required to reach the majority of the paramedic crews
allows them to more effectively respond to issues from their office. Furthermore, being located within
the area where over 70% of paramedic calls occur, allows the Platoon Superintendent to support and be
more involved in major incidents in a more timely fashion.
Moving Headquarters into the city core would result in a change to the central reporting system for
Paramedic Services and would save about 4,000 ambulance hours per year which equates to nearly one
full extra paramedic shift per day, which can be redeployed to other high volume areas of the city
(Valley East).

Fire and Paramedic Optimization Report
Page 146
Moving paramedic response to the Hanmer location would provide for a more optimal response and
reduces the dependence on the Capreol Paramedic Response Unit to provide balanced emergency
coverage in the Valley East area. Increased paramedic resources in the area as a whole is enabled with
the realignment of Emergency Services Stations in the Valley East area, which will undoubtedly lead to
improvement in response time and depth of service with reduced dependence to backfill with a city
vehicle to balanced emergency coverage.
Additionally, the change will allow for the implementation of central warehousing for supplies and
equipment for both Fire and Paramedic Services. The Headquarters would also be used as a responding
station for Fire Services to replace Leon Station (#3) located in New Sudbury. This move allows fire
services to better protect the northwest quadrant of the city core up to McCrea Heights and Val Caron.
With a Headquarters being within the core of higher call volume, Paramedic Services would be in a
location from which to deploy all City resources and would also become a response station as well. The
current HQ in Azilda does not support a response resource as all the resources deployed out of
Headquarters respond from posts in the city core. Finally, further supporting response capability, being
located near arterial roadways allows quick travel North, South, East and West with multiple access and
egress routes. Currently, when MR35 is blocked ambulances can take up to one hour to reach the city as
they need to go through Valley East.
Paramedics responded to 3,191 calls in 2016 from the New Sudbury Leon Street station. This represents
12% of the total annual call volume. The ambulance from this location also responded to Valley East,
Garson and Minnow Lake as required when ambulances in those areas were busy. Being in close
proximity to some arterial roadways has made this a good location for Paramedic Services. Response
performance by the New Sudbury Station is shown below. A complete table of response time for all
stations individually is included in Appendix #T9.
As the Leon St. Station is not in the right location for Fire Services and with a new Headquarters being
constructed in the vicinity of Lasalle Boulevard and the Maley Drive Extension, under the Optimized Plan
a new Paramedic Post in the Barrydowne Road area will be sought. This location being fairly centrally
located amongst the other relocated Emergency Services stations in the former city will allow this site to
support not only New Sudbury, but also access the Kingsway, Second Avenue and Minnow Lake areas
effectively. Potential properties for development will need to be evaluated from a response prospective
as part of the implementation plan.
2016 New Sudbury Response Times (Leon)
SCA < 6 min.
70%
CTAS1 <8 min.
80%
CTAS <10
85%
Average Response
time
Code 4
90th Percentile
89% 94% 93% 05:54 08:56

Fire and Paramedic Optimization Report
Page 147
Locating the Headquarters in the city core provides opportunities for greater communication and
training of front-line and supervisory staff. Furthermore, it improves the ability for Community Safety
staff to engage and work more collaboratively with other City staff located at Tom Davies Square in
downtown Greater Sudbury.
The downtown Van Horne Station (#1) would be closed and rebuilt out towards the intersection of Elm
Street and Big Nickel Mine Road. This location removes the station from the congested downtown and
puts it on a main throughway that allows quick access to multiple areas of the city (north toward
Chelmsford, west toward Copper Cliff, and south into the Downtown). It would also enable the closure
of Copper Cliff Station which is located too close to a major hazard in the city should an emergency
arise. Volunteer firefighters would be integrated into adjacent stations.
Paramedics responded to 6,989 calls in 2016 from the downtown Van Horne station, representing 27%
of the total annual call volume. Being in close proximity to several arterial roadways, namely Paris
Street, Brady Street, Kingsway, and Notre Dame Avenue, allows ambulances from this location to move
quickly around the city core. This location and its close proximity to several arterial roads has resulted in
very good response times from this location.
2016 Downtown Response Times (Van Horne)
SCA < 6 min. 70% CTAS1 <8 min.
80%
CTAS <10
85%
Average Response
time
Code 4
90th Percentile
94% 93% 96% 05:11 07:44
The Van Horne Street Station is recommended to be closed due to a number of reasons including:
age of building (41 years old in 2016)
CCI Engineering Group report details $2.2 million in repairs required
wrong location for Fire Services to respond to identified community risks
while a good location for Paramedics Services, it is far too large for a paramedic post, and both
the building and property are too small to repurpose as a Headquarters
poor location due to inherent community risk (rail yard)
Van Horne Station is proposed to be replaced with a fire station in the area of Elm St. West. With this in
mind, the Optimized Plan calls for a new Paramedic Post to be constructed in close proximity to the Van
Horne location that is well situated for paramedic response to the highest call activity in the city. This
plan recommends construction of a new Paramedic Post along Notre Dame Avenue near the downtown
area.

Fire and Paramedic Optimization Report
Page 148
The Long Lake Station (#4) is ideally located to protect both the south end of the city and into the
downtown core. The Optimized Plan recommends that the station be rebuilt since it will be 45 years old
by 2022. The cost to renovate is expected to be $1.2 million based on the building condition
assessments. The cost to rebuild five years later is estimated to be $5.2 million. It would be more cost
effective in the long term to build a new station rather than try to renovate the existing structure. It
would remain a shared paramedic and fire response station.
To best service the northeastern portion of New Sudbury and former Nickel Centre areas of the city, this
plan is recommending that the Garson Station (#20) be rebuilt in the town centre slightly south of its
current location. This will allow better coverage and response into the northeast portion of the city
core, including the industrial area located on Maley Drive. This relocation does not compromise
coverage in the Garson area and places the station on a main roadway that allows for better and quicker
response during an emergency. Paramedics would also remain in this emergency response station.
To provide optimal coverage to the southeastern portion of the city, it is recommended that the
Minnow Lake Station (#2) be moved close to the intersection of the Kingsway/Hwy 17E and Levesque
Street. Once again, it allows for quick and easy response onto a main roadway and extends coverage
into the Coniston area, where there is abundant industrial activity, without compromising coverage into
the city core. This is currently a shared station with Paramedic Services and should remain so when it is
relocated.
All four of the city core fire stations would remain as career response. The realignment of locations
would help to balance call volumes and allow Fire Services to better respond not only to incidents in the
city core, but also into the outwardly areas of Walden, Chelmsford/Azilda, Garson, and Coniston where
significant growth and industrial activity exists. It is recommended that Garson be converted to a
composite station that would provide an immediate four person response that is augmented by
volunteer firefighters. It is further recommended that Falconbridge Station be closed and volunteers be
integrated into the Garson Station.

Fire and Paramedic Optimization Report
Page 149
District 2 (Walden) Stations
The Walden area, District 2, currently contains five stations: Copper Cliff, Waters, Lively, Whitefish and
Beaver Lake. The Optimized Plan recommends the integration of the Lively Station (#7) into the Waters
Station (#6). These two stations are currently located just a couple of kilometres apart from each other.
Although they are separated by a railway, the reduced rail traffic, shorter trains and ability to contact
the railways to stop a train if needed reduces the concern of it affecting the ability of Fire Services to
respond to an emergency. Due to the population density and concentration of commercial and
industrial activity in the area, it is recommended that the Waters Station be converted to a composite
station to ensure an immediate four-person guaranteed response that would be augmented with
volunteer firefighters. The Waters Station should be rebuilt either on the existing City owned property
or within one kilometre of its current location and remain as a shared emergency response station with
Paramedic Services. Once again, this positions the Emergency Services Station on the main throughway
allowing for quick response and access to many areas of the community including the Walden Industrial
Park and numerous mine sites. When reviewing the Beaver Lake Station (#9), it was determined that
given the low call volume, high costs and low presence of risk, this station’s response should be
integrated with the Whitefish Station (#8). Given the age and condition of the Whitefish Station, it
should be rebuilt on the existing piece of property, perhaps in collaboration with Infrastructure Services
who operate a public works station on the same piece of property which is as equally aged and in need
of significant repairs. The administration is also currently investigating the possibility of engaging in an
automatic aid agreement with the neighbouring town of Nairn Centre which is located just seven
kilometres west of Beaver Lake.
District 3 (Rayside-Balfour) Stations
The former Rayside-Balfour area, District 3 includes five stations: Chelmsford, Azilda, Dowling,
Vermillion and Levack. Paramedic Services shares the Levack Station and has their own station in
Chelmsford. A review of the call volume, population growth, intensity of commercial and industrial
businesses, as well as the presence of a long-term care facility, indicates that Chelmsford should be
converted to a composite station. This station would be a new build ideally located at the intersection
of Municipal Road 35 and Highway 144 to allow ease of access to the main corridors. This location
allows for coverage into Azilda without compromising response into Chelmsford. The new Chelmsford
Station would be an emergency response station that is shared with Paramedic Services. This
improvement would provide an immediate four-person guaranteed response augmented by volunteer
firefighters. It maintains coverage in the Dowling area with enhanced support from the Chelmsford
Station. Both Dowling (#12) and Levack (#14) would remain in place and would undergo extensive
renovations to bring the buildings up to required standard. At the end of their life cycle, these stations
would eventually be replaced. The Vermillion Station (#13) is recommended for closure and would
result in the integration of volunteer firefighters with the Dowling Station. Dowling has had only one call
over the past two years, has an annual cost of about $ 138,000 and requires about $400,000 in repairs.

Fire and Paramedic Optimization Report
Page 150
District 4 (Valley East) Stations
The community of Valley East (District 4) has four stations: Val Caron, Val Therese, Hanmer and Capreol.
It has been determined that a composite response station should remain in the area, however, due to
the concentration of industrial activity in the southern part of the community, the Optimized Plan
recommends building a new station closer along Municipal Road 80, near Municipal Road 15. It further
recommends the closure of the Val Therese Station and rebuilding of the Hanmer Station. These
movements maintain coverage of the Valley East area with just two stations, reducing operating costs
for the area. The Hanmer Station would be rebuilt with consideration for continued growth in the area.
Volunteers would once again be integrated with adjacent stations. For paramedic response in the area,
a full-time ambulance would operate 24 hours a day, seven days a week, most likely at the Val Caron
Station. The addition of a 12-hour, seven day a week day shift ambulance would also be placed in the
area at the Hanmer Station to provide coverage in response to the increased call volumes that are being
experienced in the Valley East area. This can be done by repurposing the hours saved in travel time
gained in the move of Headquarters into the city core area. Additionally, this will also help reduce the
need to remove resources from the city core to provide coverage in the Valley East area. As well, it
would provide an additional reporting option for paramedics, perhaps enticing those living in the Valley
East area who may be interested in a shorter commute to work and a familiarity with the work location.
In reviewing the district, it was also determined that the Capreol Station is nearing its useful life but is in
a good location, with a decent call volumes for both Fire and Paramedic Services, and has acceptable
volunteer firefighter participation. It should be rebuilt and turned into a shared post for Fire and
Paramedic Services. The current standalone paramedic post can be sold.
Where appropriate, From Home Response should be implemented for volunteers. This means that
some volunteers would go directly to the scene of an emergency instead of responding to the station
first. This is a model used by many municipalities in Ontario and improves response times to
emergencies, a critical element in ensuring the safety of residents and properties. In fact, the Red Deer
Lake Station (#25) is already using From Home Response, due to their station being condemned. This
type of response is particularly effective for composite station response which is being recommended
for Waters, Chelmsford, Garson and Val Therese. Knowing that a fire truck had been dispatched with a
minimum of four career firefighters allows for volunteers to carry their own personal protective
equipment (PPE) and their bunker gear in an appropriate storage container in their vehicle. Enabling
them to respond directly from wherever they may be without having to report to a station to become
part of a crew responding in a fire truck can greatly improve fire ground staffing assembly and set up
time, allowing firefighters to more quickly manage the emergency scene. This can often result in
reduced damage to a property and/or improved success rates to the condition of any victims of an
emergency scene whether it is a fire or motor vehicle accident.
It must be noted that the reduction in stations identified in the optimized map is absolutely dependent
upon the staffing enhancement identified in the following section. The following table summarizes the
recommended changes specific to the location of new builds and associated closures.

Fire and Paramedic Optimization Report
Page 151
Summary of Proposed Station Changes
New Station Old Station(s)
Elm West Fire Station
(Elm Street at Big Nickel Mine Road)
Van Horne (Main) Fire and Paramedic Shared Station
Copper Cliff
Downtown Paramedic Post
(Notre Dame Avenue between bridge and Kathleen Street)
Van Horne (Main) Fire and Paramedic Shared Station
Minnow Lake Fire and Paramedic Shared Station
(17 East atKingsway)
Minnow Lake Fire and Paramedic Shared Station
Coniston Fire Station
Headquarters and New Sudbury Fire and Paramedic Station
(Maley Drive at Lasalle Boulevard and Notre Dame Avenue)
New Sudbury (Leon) Fire and Paramedic Shared Stations
Emergency Services Headquarters (LEL)
New Sudbury Paramedic Post Only
(Barrydowne/Lasalle area)
New Sudbury (Leon) Fire and Paramedic Shared Station
Chelmsford Fire and Paramedic Shared Station
(Hwy 144 at MR 35/15)
Chelmsford Fire Station
Chelmsford Paramedic Post
Azilda Fire Station
Garson Fire and Paramedic Shared Station (Falconbridge Road near Garson Tim Horton’s)
Garson Fire and Paramedic Shared Station
Falconbridge Fire Station
Val Caron Fire and Paramedic Shared Station
(MR 80 at MR 35 - Main Street)
Val Caron Fire and Paramedic Shared Station
Val Therese Fire Station
Hanmer Fire Station
(Cote Boulevard at MR 80)
Hanmer Fire and Paramedic Shared Station
Lively/Waters Fire and Paramedic Shared Station
(Within 1 km of current Waters site or on current site)
Waters Fire and Paramedic Station
Lively Fire Station
Fire and Paramedic Optimization Report
Page 152
These new stations are strategically positioned for optimal service coverage, on main roadways which
enable quick response, and in alignment with projected future growth of the community. See Appendix
#M24 and 25 for response times for both Fire and Paramedic Services. When identifying the best
location to position emergency stations, a consideration of major hazards such as railways and large
industrial operations have been taken into account to reduce or eliminate the possibility of a station
becoming located within or too close to an emergency scene. Stations were also located on the outer
edges of city core in order to provide balanced response both inwards to the urban area and outwards
to more suburban areas. The location of vulnerable occupancies such as daycares, schools, and senior
housing complexes was also taken into account in the positioning of stations within optimal response
times to these high demand and high risk populations. Lastly, there is an aim to locate stations on major
roadways to allow for quick and flexible response by emergency crews.
Two new paramedic posts, as noted in the table above, are included in the plan to meet higher
emergency medical call volume demand in the Downtown and New Sudbury areas. The separation of
Paramedic and Fire Services stations in some areas will improve the effectiveness of medical tiered
response with the reduction in duplication of response from the same station with an accompanying
ability to cover greater gaps between paramedic posts or stations.
Concerns and issues regarding age, size, configuration, environmental impact and legislative
requirements are addressed by building new structures that are designed for today’s modern Fire and
Paramedic Services. The changes noted above also aim to align with the identified community risks.
Furthermore, these new builds represent a much needed investment in Fire and Paramedic Services
infrastructure that will reduce the capital gap and long-term costs.
Positive outcomes relational to the merging of stations are numerous. By relocating and merging
stations there is a great opportunity to reduce overall costs. Understanding that there is already a great
deficit in capital funding, finding ways to reduce this gap is essential in an optimized plan. Merging
stations reduces the overall operating and maintenance costs of the department while aligning staffing
and resources to create better service. With the better service arrived at by merging stations there is
also an opportunity to improve FUS ratings through the redundancy of stations. While obvious, it is not
commonly thought that with a reduction in stations there would also be a reduction in equipment, such
as vehicles required to support operations within those stations. This further reduces the capital gap in
equipment purchasing. The redundant buildings would either be transformed for alternative purposes
or sold thereby offsetting the costs of new construction. Lastly, merging stations can increase efficiency
in aligning to call volumes (demand) for service while reducing operational costs.

Fire and Paramedic Optimization Report
Page 153
Staffing
The optimized model relies on a greater number of career firefighters while still maintaining a core
group of meaningfully participating volunteers. These changes, as noted above, align with the changes
in numbers of stations and the need to ensure quick response in high risk areas (densely populated
areas, or those with a concentration of industrial activity). The decrease in stations and equipment and
correlating increase in staffing will actually optimize service.
Of largest impact to service is the creation of composite stations in the communities of Garson,
Chelmsford, Val Caron, and Waters (Walden). There are many benefits to a composite model of
firefighting. The transformation of fire suppression staffing ratio from 108 career and 350 volunteer
firefighters to 166 and 135 respectively aligns staffing with service and risk. This model allows for a
guaranteed immediate response of four full-time firefighters quickly with additional resources deployed
from the volunteer force. It allows Fire Services to minimize staffing costs, while safeguarding that the
required number of firefighters are available to effectively fight a fire upon initial arrival at an
emergency scene. This composite model is effective in ensuring a timely response is available in these
denser suburban areas of the city and where there is significant risk identified due to vulnerable
occupancies, and commercial and industrial activities.
As noted in the fire growth curve earlier in this report, time matters when it comes to fighting fire. The
goal of a proactive fire response is to arrive quickly with enough properly equipped firefighters before
the fire spreads. With a career firefighting force not only is there a guaranteed four-person response,
but there is an average assembly time of 1:20 minutes as these firefighters are working in the station
awaiting calls, or in the field conducting inspections or pre-incident plans. The volunteer response
model is designed to incorporate a delayed assembly time of approximately six minutes as these
firefighters require the additional time to arrive at the station for deployment from their location at the
time of page. With a guaranteed career fire response there is obviously a great improvement in
response times. An additional benefit to a composite scenario is the improvement of volunteer
attendance at emergency scenes knowing that full-time personnel are already responding.
As identified earlier, the Collective Bargaining Agreement for volunteer firefighters states that they have
full discretion as to whether or not they attend an incident and no minimum thresholds have been
established. Furthermore, the system currently being used does not allow for volunteer firefighters to
indicate their availability to respond in a timely manner. Given the advances in technology and
availability of cellular service even in more rural areas, an optimized service would greatly benefit from
implementing modern, advanced technology that allows firefighters to register their availability and/or
quickly indicate their intention to respond to a call upon being notified. This timely information would
help the on-duty Platoon Chief determine if additional resources from adjacent stations is required for
an incident in a quick and efficient manner, improving the outcomes of an emergency situation.
Currently, career firefighters complete training during their regularly scheduled shifts and volunteers
generally train one night per week at their volunteer station.

Fire and Paramedic Optimization Report
Page 154
By providing 24 hour, seven day a week, full-time staffing at composite stations, this allows for a more
encompassing, consistent and flexible training model for all firefighters. The optimized model
recommends that training be provided at composite and career stations every day with varying
schedules and that all firefighters would be instructed collectively. This training model would allow
volunteers to have the flexibility to attend training sessions that best match their home and work lives,
and would build strong working relationships amongst all firefighters. A formally designed training
program and curriculum would be developed to ensure all firefighters are trained consistently and
appropriately on the risks that exist overall in the community. Specialty training would also be provided
in areas to align with specific risks that exist within certain geographies, such as water and ice rescue in
areas that have major waterways, or HAZMat in areas with industrial concentration. (See maps
Appendices #M26, #M27, and #M28). These improvements to the training model will provide all
firefighters with a consistent level of knowledge and skill which aligns with service needs and
community risks.
The FUS Report identified that ratings could be improved if Greater Sudbury Fire Services conducted
inspections and pre-incident planning according to their recommended guidelines (Appendix #R1).
Applying these guidelines would suggest the need for additional resources in Fire Prevention to support
the volume and type of inspections based on the composition of occupancies that exist in the
community. The Risk Base Inspection Program Table (see Appendix #T8) demonstrates that nearly four
person years is required to complete inspections based on the composition of businesses that exist in
Greater Sudbury and the recommended inspection schedule. This serves to follow the recommendation
of the 2014 IBI Group Comprehensive Fire Service Review, as can be seen in the excerpt below:
“Both the 2011 review and the OFM Audit have recommended that FPPE(fire prevention and
public education) needs to develop a proactive building inspection strategy and prioritized work
plan based on occupancy category and risk, giving priority to assembly, care facilities and large
business / mercantile buildings.
We are advised that GSFS is currently addressing this recommendation as part of a
Comprehensive Fire Risk Assessment that is underway and that a 5 year agreement with the
Building Department to perform the plans review function has been established.
The work in process includes a review of Fire Prevention files to ascertain which buildings require
an inspection, or follow up based on a past inspection, and a building stock inventory, giving
initial consideration to extreme and high-risk occupancies.
The work also includes development of a strategy to deal with potential fire risks from a Fire
Safety Standards and Code Enforcement perspective. The strategy will include a pre-fire
inspection by suppression firefighters. Public education will also play a significant role, thereby
utilizing the three lines of defence to avert potential risks posed by the building, its contents or
occupants.
As noted above FPPE personnel are overwhelmed by the current volume of work, and they would
be hard pressed to successfully implement the proposed strategy described above, despite the

Fire and Paramedic Optimization Report
Page 155
OFM’s participation in the process. For this reason, we again reiterate that the solution to this
situation may be that, for a temporary period, GSFS may have to secure additional staff.”
An improvement to the city’s FUS ratings would potentially reduce insurance premiums for residents
and business owners. Furthermore, improving inspections and record keeping on high risk occupancies
in the community better prepares firefighters for a scene in the event of an emergency. Staff would be
aware and knowledgeable of specific risks that are associated with these properties and would have a
response plan in place should an emergency occur.
Public Education Officer
Public education was also identified as inadequate by FUS. This is mainly due to the fact that the
Greater Sudbury Fire Services has only one Public Education Officer and there are nearly 100 schools
and 200 long term care facilities in Greater Sudbury. Additional resources in Public Education would
provide good coverage and penetration of fire prevention programs across the entire community. This
includes programming such as: Learn Not to Burn, Family Escape Plans, Fire Drills, Senior Older and
Wiser, Remembering When, and Arson Prevention Program for Children.
Generalist
A position entitled, Generalist has also been added in the recommendation for staffing increases. This
position would be a full-time non-Union position that would provide support to the overall Community
Safety Department. Currently there are only four positions available to provide support to major
projects and initiatives such as continuous improvement, talent management, employee engagement,
benchmarking and business analytics. As a result, the senior leadership is trying to complete these
initiatives of the corner of their desks while still trying to run the department. This aligns with
recommendations made in the IBI report which stated that increased support is needed for the
department, especially for the management of volunteer firefighters.
Paramedic Services Scheduling Clerk
As mentioned in the analysis section for Paramedic Services, scheduling duties are currently being
performed by the Payroll and Finance Clerk and the Platoon Superintendent. Completing this task takes
away from other core duties of these positions therefore it is recommended that a new position,
Scheduling Clerk, be created. The scheduling of staff could more effectively and efficiently be
performed by a full-time Scheduling Clerk. This position would be responsible for performing all
scheduling functions with the exception of last minute changes that affect the next shift which would
remain the responsibility of the Platoon Superintendent. The addition of this position would free up the
Platoon Superintendent enabling them to spend more time in the field directly supervising and
supporting operations and employees.
Equipment Vehicle Technician (EVT)
As noted earlier EVTs are vital to the logistical support of Paramedic Services ensuring all vehicles and
medical equipment are cleaned, sanitized, inspected and restocked in accordance with provincial

Fire and Paramedic Optimization Report
Page 156
legislation, regulations, standards and service policy. The detailed job tasks related to the EVT system
have been described previously within this report. A major issue with this part of the service they
provide is that the time dedicated to this task has increased by 50%, now taking about 665 hours
annually as a result of Fleet Services’ move from Northwest Depot in Chelmsford to the Lorne Street
garage.
The current complement of five full-time EVTs are available to work 400 regularly scheduled hours in a
two week period, however the Service requires 552 hours of work during this time frame. Furthermore,
this requirement does not take into account absences due to vacation, training or illness. The addition
of one full-time EVT will:
Fill an existing regular schedule rotation, reducing the dependence on part-time staff to cover
these scheduled hours.
Provide a modest increase in staffing hours (388) to meet the increased service demands that
includes: processing vehicles/equipment for deployment and the increase of time on task to
transport vehicles to Fleet Services located on Lorne Street.
The Optimization study shows that Paramedic Services does not require additional paramedics or
vehicle hours at the present time. It is important however to recognize that any such request would fall
in line with the current process when it comes to addressing emergency response pressures. Paramedic
Services, as noted previously, has done a great job of ensuring that is has placed enough resources
within the community to meet the needs of the citizens of Greater Sudbury. If the call volume trend
continues without relief from other anticipated programs and processes, Paramedic Services will
approach Council during the annual budget process with a business plan to address any needs. At this
time it is prudent to simply monitor system performance and emerging trends that could have the
ability to reduce call volumes and create capacity within the system before a request is made for
additional staff or vehicles.
As noted earlier, trends in Paramedic Services are aimed at reducing the requirement to enhance vehicle
deployment hours and staffing. The North East LHIN Non Urgent Patient Transportation Project is
finalizing a public procurement process to secure third party services to carry out this work across
Northeastern Ontario and specifically to address routine scheduled non urgent transportation in and out
of Health Sciences North. This project, once in full operation, could significantly reduce the number of
long distance transfers paramedics are currently doing, resulting in additional capacity to address
system challenges. The MOHLTC is also undertaking transformational change within the Provincial
dispatch centres to modernize their triaging algorithms. It is predicted that once implemented, there
will be a reduction in the number of high priority calls thus allowing a better coordination of low acuity
calls which will address system challenges including response time performance.
Paramedic Services has been successful in making small incremental increases to vehicle and staffing
hours to meet increased demands on service over the last 17 years and will continue to monitor service
performance to determine when additional resources are required to address emerging challenges.
Fire and Paramedic Optimization Report
Page 157
When additional resources are deemed to be required, a request for additional paramedic staff or
vehicles will be done through the normal budget process.
Finally, a Project Manager position has been included in the recommendations. This would be a limited
contract position initiated to oversee and provide support for the implementation of the proposed
Optimization Plan. This is a large and complex project that simply cannot be handled off the corner of
someone’s desk. It requires the full attention of a single person to manage the various aspects of the
plan.
The Optimized Model, when mapped using the response criteria recommended in NFPA 1710 and NFPA
1720 (five minutes and twenty seconds (5:20) for urban areas, nine minutes (nine) for suburban areas,
and 14 minutes (14:00) for rural areas), reveals the following before and after response situations.
Actual historical assembly times were used for the current model. It is important to note that a five
minute assembly time for volunteer stations has been used in the optimized model with the goal of
improving existing response times and having these stations meet or exceed the industry standard.

Fire and Paramedic Optimization Report
Page 158
Current Response Map
Optimized Model Response Map
A detailed analysis of these maps provided by the City’s GIS Department in the table below reflects
expected improvements in Fire Service coverage expected due to Optimization. Significant response
time gains are identified in the ‘under 5:20 minute’ response where 53% of the MPAC valuation would
have guaranteed response by four firefighters compared to 35% under the current model. The
optimized model is expected to provide 90% coverage within a nine minute response as compared to
only 69% in the current model. Additionally, this Optimized model is composed of a four-person
1 Van Horne 9 Beaver Lake 17 Hanmer
2 Minnow Lake 10 Azilda 18 Capreol
3 New Sudbury (Leon) 11 Chelmsford 20 Garson
4 Long Lake 12 Dowling 21 Falconbridge
5 Copper Cliff 13 Vermillion 22 Skead
6 Waters 14 Levack 23 Coniston
7 Lively 15 Val Caron 24 Wahnapitae
8 Whitefish 16 Val Therese 25 Red Deer Lake
1 Elm West 8 Whitefish 17 Hanmer
2 Kingsway @ 17E (HQ) 11 Chelmsford 18 Capreol
3 Maley @ Lasalle 12 Dowling 20 Garson
4 Long Lake 14 Levack 22 Skead
6 Lively / Waters 15 Val Caron

Fire and Paramedic Optimization Report
Page 159
guaranteed response for 80% of the MPAC valuation with the remaining 10 % coverage being provided
by volunteer firefighters, with continued career/composite support. Given the city’s geographic
challenges, this achievement is quite impressive.
Fire Response Coverage and Property Assessment Value
Current Model and Optimized Model
Fire Response Times
5:20 minutes or less
NFPA 1710
9:00 minutes or less
NFPA 1720
14:00 minutes or less
NFPA 1720
14 minutes or more
Properties Covered
(%)
Assessed Value
(billion $)
Properties Covered
(%)
Assessed Value
(billion $)
Properties Covered
(%)
Assessed Value
(billion $)
Properties Covered
(%)
Assessed Value
(billion $)
Current Model
Career 35% $ 7.487 48% $ 10.428 61% $ 12.711 0% -
Composite 5% 0.849 12% 1.902 15% 2.288 0% -
Volunteer 1% 0.085 9% 1.166 18% 2.488 0% -
Beyond 14 minutes
0% - 0% - 0% - 6% 0.936
Total 42% $ 8.421 69% $ 13.496 94% $ 17.487 6% $ 0.936
Optimized Model
Career/
Composite 53% $ 10.985 80% $ 15.631 83% $ 16.175 0% -
Volunteer 0% - 10% 1.238 12% 1.510 0% -
Beyond 14 minutes
0% - 0% - 0% - 5% 0.738
Total 53% $ 10.985 90% $ 16.869 95% $ 17.685 100% $18.423
Note: Service level expectations are based on NFPA Standard 1720 – Standard for the Organization and Deployment of Fire Suppression Operations, Emergency Medical Operations and Special Operations to the public by Volunteer Fire departments, which is applied for both composite and volunteer departments.

Fire and Paramedic Optimization Report
Page 160
Fire Vehicles and Major Equipment
The reduction in the overall number of stations will also enable the decrease in the number of fire trucks
from 73 to 48 and a further decrease in the associated equipment required to deliver fire services. The
table below presents an overview of the current Fire Services large vehicle fleet and the expected
impact of the Optimization implementation on it. The reduction in overall stations and firefighters,
along with the conversion to From Home Response for some volunteer firefighters reduces the necessity
for vehicles served primarily to transport volunteers to and from the scene of an incident. Additionally,
the continued implementation of the current fleet rationalization introduced by Fire Services
Administration in 2014 will continue to standardize the fleet and apparatus within the limitations of
manufacturer’s abilities over several purchase cycles. This process also includes the rotation of vehicles
and equipment to maximize effective lifespan. The remaining stations will be better stocked with
standardized vehicles that best meet the community needs and not based on what fits in the station.
These changes all aim to help reduce the capital gap while increasing service delivery. It should be
recognized that the above noted efficiencies are estimates of fleet numbers when the plan is fully
implemented, and amendments may be required as continued analysis refines these recommendations,
based on evolving community risk, and service needs.
Front-Line Vehicles:
Current
Model Optimized
Model Change
Engine - Commercial 14 3 -11
Engine - Custom 13 16 3
Tanker 11 11 0
Support - Rehab Units 11 2 -9
Ladder (Aerial) 4 2 -2
Support - Bush Trucks 11 6 -5
Boat and Trailer 6 7 1
HAZMat Unit 1 1 0
Rescue Units 2 0 -2
Total Front-Line Vehicles 73 48 -25

Fire and Paramedic Optimization Report
Page 161
Service Level and Community Risk
Greater Sudbury Fire Services has the potential to implement an emergency response model that
delivers a consistent response to the community-based on a solid understanding of risk and a service
response plan designed to address hazards present in the community. It can provide enhanced specialty
team response for hazardous materials, trench rescue, confined spaced rescue, water and ice rescue, as
well as deliver a consistent medical tiered response.
Improvements to service levels are expected to improve FUS ratings used by the insurance industry to
determine premiums for businesses and home owners. For example, a single career firefighter on a
truck gives a FUS Dwelling Protection Grade (DPG) of two, versus an all-volunteer truck which receives a
three. Stations with four career firefighters on a truck receive a DPG of one. So, for areas where a
composite station is being recommended, the FUS grade should improve simply based on these changes
to staffing.
As part of Optimization, Fire Services will implement a fire prevention delivery model that is consistently
applied throughout the city. It will be led by the Chief Fire Prevention Officer and where applicable,
involves participation by both on duty career suppression and volunteer firefighters. This program will
prioritize the type and scope of fire prevention delivery specific to the community risks. It will include
volunteer firefighters to provide education and prevention in alignment with career firefighters. These
improvements to fire prevention are expected to improve FUS ratings in some areas which again may
result in a reduction in premiums for fire insurance.
A pre-incident planning program that is consistently applied throughout the city will be implemented as
part of optimization. It will be led by the Deputy Fire Chief and where applicable, involves participation
by both on duty career suppression and volunteer firefighters. Pre-incident planning will allow for
proactive training of firefighters as they will have identified the type and scope of hazards that exist in
the community prior to an emergency response. This program provides an opportunity to properly
identify service types and levels. One again, it is expected that improved FUS ratings and thus more
favourable insurance premiums will be achieved in some areas.
Finally, Fire Services will implement a Targeted Inspection Program for high risk occupancies including
vulnerable occupancies, and heavy industrial and large commercial buildings. This will increase and
enhance the pre-incident plan for suppression crews throughout the city. Firefighters will perform life
safety walkthroughs in high density residential buildings, schools and seniors facilities to provide an
initial level of inspection and identify any deficiencies to have a Fire Prevention Officer pursue. This also
serves to provide a face to the service for our most vulnerable of citizens. The service will increase
targeted education programs to youth and the elderly in line with the approximate 100 schools and 50
vulnerable occupancies that exist in Greater Sudbury. Where appropriate, volunteer firefighters will
assist with education and prevention programming. These activities help to mitigate the risk of an
emergency occurring and may improve FUS ratings in some areas, which as a result adjust insurance
premiums for both residents and businesses.

Fire and Paramedic Optimization Report
Page 162
For Paramedic Services, there will be continuous monitoring of the paramedic system through the use of
established key performance indicators. Paramedic Services has not identified a need for new staff or
vehicle hours within the context of the Optimization Plan’s seven to10 year implementation window. It
is important to recognize, however, that additional staff will be needed over the coming years if service
demand exceeds our paramedic response capacity. At this time it is prudent to monitor system
performance trends along with some emerging health care system initiatives that have the ability to
reduce service calls and work to improve service capacity within the paramedic system before there is a
request for additional staff or vehicles.
Currently the North East LHIN Non Urgent Patient Transportation Project is finalizing a public
procurement process to secure third party services to carry out this work across Northeastern Ontario
and specifically to address routine scheduled non-urgent transportation in and out of Health Sciences
North. This project, once in full operation, could significantly reduce the number of long distance
transfers paramedics are currently performing resulting in additional capacity to address system
challenges.
Another change that should address system busyness is the undertaking of the MOHLTC to make
transformational change in the Provincial dispatch centres to modernize their triaging tools. Once
implemented this could result in a reduction in high priority calls by 20%. A new triaging tool that is
better able to identify less acute patients opens up opportunities to better coordinate low acuity calls by
directing them to alternate health-care pathways that better meet the person’s needs, while at the
same time freeing up ambulance resources.
Paramedic Services will continue to monitor key performance indicators, such as call volumes, response
times, no ambulance availability, airport call volumes and overtime due to shift extension to name just a
few. In addition to monitoring system performance the service will continue to explore opportunities to
reduce non-emergency call volume thereby creating service capacity. These opportunities in the shorter
term may include further reducing non-urgent transfer call volumes and airport call volumes. Paramedic
Services will also continue to be innovative in developing programming such as the Community
Paramedicine and Diversion Programs which aim to support the health-care system. When Paramedic
Service performance and capacity trends suggest a need for additional service enhancements, a
business case will be brought to Council through the normal budget process as has been historical
practice.
With all the above being noted, Optimization does present several opportunities to further improve the
delivery of Paramedic Services. Infrastructure investment in station development is key to longer term
plans for Valley East. The move of Headquarters from Azilda to the city (Notre Dame and Maley) and
rebuild of both the Val Caron and Hanmer Emergency Services Stations would be required as a first step.
Once these infrastructure improvements are done Paramedic Services would redeploy a 12-hour day
ambulance from the city core to Valley East in one of the remaining stations while the 24/7 crew
currently located in Val Therese would be moved to the other remaining station.

Fire and Paramedic Optimization Report
Page 163
These deployment changes would result in improved response times across the Valley East area, while
at the same time reducing the number of times a city ambulance is moved to the Valley East area to
provide balanced emergency coverage.
Optimized Costs
As with any service provider, budgets and costs are integral to providing reliable and trustworthy
services. Being one of the three pillars of the plan, costs must be balanced with both service and risk.
The Optimized Plan must provide an appropriate level of service for the risks that exist in the
community, but should not come at an excessive cost to taxpayers.
An extensive financial analysis was conducted to review costs related to the delivery of Emergency
Services (see Appendix #F7). The analysis is a snapshot in time and is based on information that was
available as of March 3, 2016. As a result, the following three costing models were developed that are
anticipated to be phased in over a 7 to10 year period.
Current (Status Quo) – This model represents no changes to the current delivery models, staffing or
funding. More specifically, there will be:
No service level improvements to address community risks
Insufficient funding to support presumptive legislation
No funding to complete major repairs and/or replace stations
Insufficient funding to replace existing front-line vehicles and major equipment
Current (Status Quo) Fully Funded – This model represents no changes to the current delivery model or
staffing but addresses funding shortfalls related to presumptive legislation and capital requirements for
stations, vehicles and major equipment. More specifically, there would be:
No service level improvements to address community risks
Sufficient funds to support presumptive legislation
Sufficient funds to complete major repairs and/or replacement of stations
Sufficient funds to replace existing front-line vehicles and major equipment
Optimized – This model represents an optimized Fire and Paramedic Service that is fully funded. More
specifically, there would be:
Service level improvements that address community risks
Enhanced Technical Rescue capabilities (Hazardous Material, Trench Rescue, Medical Tiered
Response)
A reduction of 150 personnel over the next ten years. Staffing levels would be aligned to meet
service level improvements.
A reduction in the number of stations to 17 from the current 27
A reduction in the number of front-line vehicles from 73 to 48
Financially sustainable operating and capital renewal plans

Fire and Paramedic Optimization Report
Page 164
Station Costs
Appropriately aligning the number of stations, vehicles and equipment with community needs, and
without reducing service levels, allows Fire and Paramedic Services to avoid costs associated with
maintaining and replacing these aging capital assets.
An optimized model reduces the number of stations by ten, from 27 to 17 as shown in the diagram
below. This transformation of stations would require $92 million in funding to renovate and/or build
new stations. Staff engaged the City’s Real Estate Section who provided an estimate of $3.3 million from
the sale of surplus property. This would result in a net funding requirement of $92 million. Operating
costs for building maintenance and repair would increase by approximately $250,000 each year to
ensure the assets remained in a state of good repair.
If no additional investment is made into repairs and maintenance for stations, they would continue to
deteriorate and face the possibility of being rendered unusable. Further, not investing in stations would
leave the service unable to address issues related to legislative requirements of workplaces under the
Occupational Health and Safety Act. Ignoring requirements as made under the OHSA is not an option
and any Ministry of Labour order written must be addressed. A proactive approach where the City
controls the assignment of funds would be a superior solution than allowing an external legislative
branch from making that decision.
1
1
8
9
16
5
2
2
0 5 10 15 20 25 30
Status Quo
Optimized
Emergency Response Stations
Headquarters Fire & Paramedic Stations (cohabitated)
Fire Stations (stand-alone)
Paramedic Stations (stand-alone)

Fire and Paramedic Optimization Report
Page 165
Vehicles and Equipment Costs
The optimization of stations would also significantly reduce the need for front-line vehicles and major
equipment from 73 to 48. Furthermore, the plan recommends an overall reduction in the number of
personnel which would also reduce the number of major equipment pieces from 6,994 to 5,265 units.
The cost to replace the number of vehicles and major equipment over a full 20 year lifecycle would thus
be reduced from $47.2 million to $36.2 million.
If no changes are made to the capital budget, the reductions in cost to repair and/or replace stations
and equipment would reduce the current capital gap from $16.1 million to $5.1 million.
To eliminate this gap altogether, $271,000 would be added to the annual operating budget to ensure
that sufficient funds were available to meet the new replacement requirements and ensure
sustainability of the service’s needs.
Staffing Costs
The Optimized Plan would significantly reduce the overall number of personnel working within the
Community Safety Department from 613 to 463 as shown in the diagram below. The net reduction of
150 personnel would be phased in through attrition over 7 to 10 years. The reduction of staffing is
solely associated with Fire Services, and has positive impact on the management to staff ratio reducing it
from 1:160 to 1:109. The focus of the reduction is in part-time volunteer firefighters, however every
employee represents an equivalent exposure to demand for human resources. Furthermore, with an
annual attrition rate of 18%, recruiting and retention of volunteers accounts for a significant investment
of management time and resources. All other management to staff ratios remains unchanged (see
Appendix #F7).
$47,251,059 $47,251,059
$36,159,614
$31,125,814
$16,125,245
$0 $0 $0
$5,000,000
$10,000,000
$15,000,000
$20,000,000
$25,000,000
$30,000,000
$35,000,000
$40,000,000
$45,000,000
$50,000,000
Status Quo Status Quo - Fully Funded Optimized
Capital Funding
Capital Requirements (over full 20 year lifecycle)
Capital Funding Gap

Fire and Paramedic Optimization Report
Page 166
By increasing composite response and reducing the overall number of stations, Fire Services would
increase the career firefighter complement by 58 and reduce the number of budgeted volunteers from
350 to 135.
Although this represents a budget reduction of 215 volunteers, only 265 were employed as of December
31, 2016. Since 2007, the number of volunteer firefighters employed has steadily increased from 142 to
a high of 317 in 2013. The actual physical reduction in the number of volunteers would be 130 over the
next seven to 10 years. Historically, the service experiences a natural reduction of about 40 volunteers
per year through resignations or dismissals which is in line with provincial norms. Therefore, the nature
of the changes proposed in this plan would not affect those current volunteers who want to continue to
meaningfully participate in the Fire Service.
Under the adjusted optimized staffing model, 422 personnel would be protected by presumptive
legislation under the Workplace Safety and Insurance Act (WSIA). As mentioned in the analysis of
current operating budget, it is recommended that employers put aside $2.20 for every $100 in wages to
cover costs that may arise if a claim is made through this legislation. It is important to reiterate that
both career and volunteer firefighters are subject to this legislation.
Furthermore, the employer is liable not only for wages associated with work as a firefighter, but for
other wages as well if they are employed outside of this role. The adjusted staffing levels would reduce
the annual funding requirement for presumptive legislation from $1.6 million to $1.2 million
representing a cost avoidance of $400,000 per year (see Appendix #F7). Currently, this fund is
insufficiently supported with only $252,000 per year allocated in the annual operating budget. Reducing
the overall number of employees, as recommended above, will decrease the shortfall of the fund,
however, it would continue to be underfunded if additional dollars are not allocated as recommended.
An additional $951,000 per year is required to fund the anticipated needs for these types of WSIA claims
in the future.
0
100
200
300
400
500
600
700
First Responders Career Fire
First Responders Volunteer Fire
First Responders Paramedics
Services
Administration Operational
Support
Management TOTAL
Community Safety Department Staffing Compliment
(status quo is based on 2016 approved budget)
Status Quo
Optimized

Fire and Paramedic Optimization Report
Page 167
As mentioned previously, it is estimated that 54% of firefighters will be diagnosed with any one of the
prescribed cancers outlined in the legislation. Furthermore, the occurrence of claims resulting from
post-traumatic stress disorder (PTSD) experienced by emergency responders, including firefighters and
paramedics, is expected to be significant although few studies exists given the relative newness of this
legislation. These are costs that the City, as an employer, must be prepared for to avoid additional
future tax increases or funding pressures on other essential services provided by the municipality.
Seven new positions have been included in the Optimized Plan to provide sufficient administrative and
operational support for Fire and Paramedic Services, none of which are management roles. Although
these changes to both firefighter and administrative staffing require an additional $8.4 million per year
for salaries and benefits, there is a significant long-term cost avoidance related to the proposed
reduction in the number of stations, vehicles and equipment.
$0
$200,000
$400,000
$600,000
$800,000
$1,000,000
$1,200,000
$1,400,000
$1,600,000
$1,800,000
Status Quo Status Quo - Fully Funded Optimized
Presumptive Legislation
Total Annual Contribution to Reserve
Funded
Unfunded
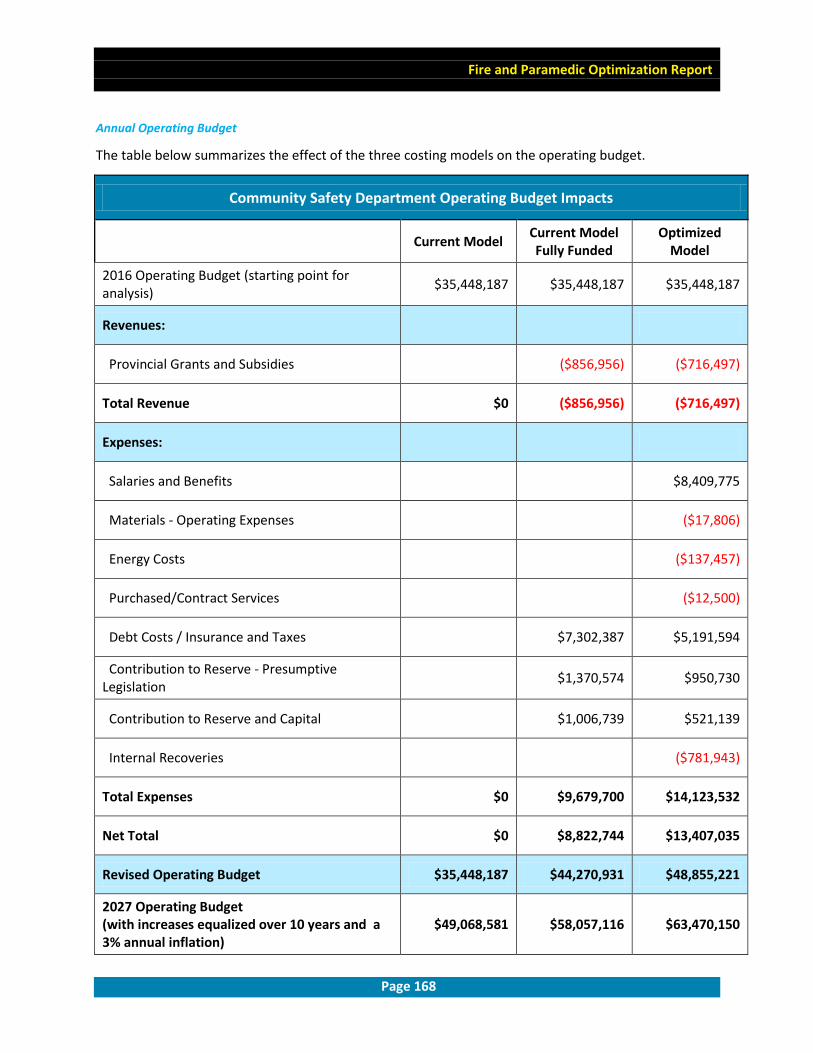
Fire and Paramedic Optimization Report
Page 168
Annual Operating Budget
The table below summarizes the effect of the three costing models on the operating budget.
Community Safety Department Operating Budget Impacts
Current Model Current Model Fully Funded
Optimized Model
2016 Operating Budget (starting point for analysis)
$35,448,187 $35,448,187 $35,448,187
Revenues:
Provincial Grants and Subsidies
($856,956) ($716,497)
Total Revenue $0 ($856,956) ($716,497)
Expenses:
Salaries and Benefits
$8,409,775
Materials - Operating Expenses
($17,806)
Energy Costs
($137,457)
Purchased/Contract Services
($12,500)
Debt Costs / Insurance and Taxes
$7,302,387 $5,191,594
Contribution to Reserve - Presumptive Legislation
$1,370,574 $950,730
Contribution to Reserve and Capital
$1,006,739 $521,139
Internal Recoveries
($781,943)
Total Expenses $0 $9,679,700 $14,123,532
Net Total $0 $8,822,744 $13,407,035
Revised Operating Budget $35,448,187 $44,270,931 $48,855,221
2027 Operating Budget (with increases equalized over 10 years and a 3% annual inflation)
$49,068,581 $58,057,116 $63,470,150

Fire and Paramedic Optimization Report
Page 169
Current Model (Status Quo)
Status Quo represents the starting point for the financial analysis and is based on the 2016 approved
budget for the Community Safety Department (formerly Emergency Services). Under this model there
are no changes to the current delivery models, staffing or funding. There are no service level
improvements to address community risks. The department remains significantly underfunded for
presumptive legislation and the replacement of existing front-line vehicles and major equipment, and
there is no funding to complete major repairs and/or replace stations. This funding model doesn’t
sustain Fire and Paramedic Services operations. Even without addressing the significant funding gaps
outlined above, the current operating budget would increase to just over $49 million by 2027 (based on
a 3% annual inflation rate).
Current Model – Fully Funded
Under this model there are no changes to the current delivery models or staffing and no service level
improvements are made to address community risks. Funding shortfalls related to presumptive
legislation and capital requirements for stations, vehicles and major equipment are addressed for a total
of $9.7 million in the annual budget. This includes:
$1.37 million to properly fund the estimated liability related to presumptive legislation,
$7.3 million to fund the annual debt repayment related to the cost of borrowing $135 million to
repair and/or replace the current stations based on a recommended 50-year lifecycle
$1 million to eliminate the funding gap to replace existing front-line vehicles and major
equipment over a full 20-year life cycle.
This model also includes an $856,000 increase of the provincial grant for land ambulance services
related to paramedic’s portion of the annual debt repayment related to the cost borrowing. If the
current delivery model (status quo) was to be fully funded, the operating budget would increase to just
over $58 million by 2027 (with increases equalized over 10 years and a 3% annual inflation rate).

Fire and Paramedic Optimization Report
Page 170
Optimized
A fully funded, One City One Service delivery model would have an expected annual operating budget of
nearly $64 million per year once the plan is fully implemented, expected by 2027. This amount includes
annual inflation of 3% and debt repayment costs on the $92 million required to repair or rebuild
stations. This optimized model improves service levels to align with community risks including enhanced
guaranteed response and improved technical, hazardous material and medical tiered response. It also
addresses capital and operating shortfalls in the budget.
Of this increase, $6.7 million is to address the adjusted funding shortfalls that would exist within the
Service. This includes:
$951,000 to properly fund the adjusted liability related to presumptive legislation;
$5.3 million would be required incrementally over the life of the implementation, to fund the
annual debt repayment related to the cost of borrowing $92 million for repairs and/or new
construction of the 17 stations; and
$521,000 to cover an adjusted funding gap of $5.1 million for replacement of 48 front-line
vehicles and a reduced number of major equipment over a full 20 year life cycle.
In an optimized model, the amount needed to address funding shortfalls related to presumptive
legislation, stations and capital gap for vehicles and major equipment is $3 million less than in the
Current Model – Fully Funded model due to a reduction in the number of stations, vehicles, major
equipment and overall staffing
Changes to the staffing complement results in an increase to the operating budget of $8.4 million per
year. This includes a reduction of 215 volunteers from a budgeted 350 to 135, an increase of 58 career
firefighters from 108 to 166, and an increase of seven administrative/operational support staff.
The above noted increases have been off-set by a $950,000 reduction in other operating costs such as
materials, energy costs, purchased services and internal recoveries. As well, an additional $716,000
would be received from the provincial grant for land ambulance services related to Paramedic Service’s
portion of any annual debt repayment.

Fire and Paramedic Optimization Report
Page 171
Optimized Taxation
Current Model (Status Quo) Fully Funded – Resource Allocation
If an area rated model is to continue to be used, the rates should be adjusted to reflect actual resource
utilization as shown in the table below. In this scenario, Fire Services is fully funded to meet the needs
of its existing service delivery model and the area rated taxation model is adjusted to reflect the actual
use of resources by each service level area. No service level improvements are made. This diagram
demonstrates that volunteer rated areas would actually pay higher taxation than the career and
composite areas within ten years, an increase of nearly $400. In fact, residents in the career rated area
would see their taxes remain nearly unchanged in the first four years.

Fire and Paramedic Optimization Report
Page 172
Current Model (Status Quo) Fully Funded - Flat Rate
In this scenario, Fire Services is fully funded to meet the needs of its existing service delivery model;
however flat rate taxation would be applied for all residents regardless of the service-level provided.
Flat rate taxation is used for Police and Paramedic Services. This would result in an annual fire service
taxation amount of $461.21 per year for all residents regardless of where they live within the city and no
improvements would be made to the service levels. In this case, both the career and composite rated
areas would pay about $30 more per year in taxes over an area rated model and no improvements to
service levels would be achieved. Volunteer rated areas would pay about $70 less than the example
above, but nearly $300 more than they do today again without any improvements to service levels.
While utilizing a flat tax model balances the costs, in any scenario where services are not aligned a flat
rate model would be unfair as services and costs (in the way of taxes) are not aligned.

Fire and Paramedic Optimization Report
Page 173
Optimized Model Taxation
If the optimized model is adopted, a flat rate taxation model could be implemented. This is reflective of
a One City One Service model and aligns with taxation for other emergency services provided in the
community such as Police and Paramedic Services.
Under this scenario there would be an estimated annual Fire Service taxation amount of $521.60 per
year for the average homeowner to be realized over the lifespan of the implementation plan estimated
to be seven to 10 years. In an optimized state, residents in volunteer rated areas would pay less than
what they would under an adjusted area rating model where the Fire Service is fully funded, but no
changes are made to service levels. The diagram below depicts that career and composite rated areas
would pay $18.16 and $28.78 respectively more per year to realize the service level improvements over
an estimated implementation of 10 years.
If the optimized model is not implemented, the operating and capital budgets along with the total
taxation levels should appropriately fund Fire Services at the expected and Council approved service
levels. As above, the following calculations for estimated annual fire services taxation are for
illustration purposes only and are based on an average 2016 home assessment value of $230,000 at
2016 tax rates for fire services. Additionally the figures include inflation using a historical rate of 3%.
The changes to taxation are also phased in so as to reduce significant increases or decreases in a single
year. The full calculations can be found in Appendix #F6.
The table below summarizes the effects on taxation for the average resident. Each scenario shows the
annual increase (decrease) to taxation based on the current area rated service delivery areas. If the
optimized model were to be implemented, taxation in the career rated area would result in a total
increase of $88.90 incrementally over the next 10 years when compared to taxation under the current
(status quo) model. A similar increase of $88.48 would be experienced in the composite rated area.
However, when examining the volunteer rated area, residents would actually pay more to maintain the
status quo model. Calculations demonstrating changes to taxation on a per $100,000 of assessment

Fire and Paramedic Optimization Report
Page 174
value can be found in Appendix #F6 for those who own a home that is higher or lower than the average
assessment of $230,000.
Annual Change to Taxation when
Compared to Current Taxation Paid
Career
Rated Area
Composite
Rated Area
Volunteer
Rated Area
Current (Status Quo) – Fully Funded and
Resource Allocation $ 9.27 $20.30 $ 39.60
One City, One Service
Optimized Model $ 18.16 $ 28.78 $ 38.73
Difference per year $ 8.89 $ 8.48 - $ 0.87
*based on $230,000 home assessment at 2016 taxation rates plus 3% inflation

Fire and Paramedic Optimization Report
Page 175
Key messages of this section:
- Maintaining the current service delivery model will incur higher costs in the long term, and
may not address the risks and needs of the community.
- The optimized model is a deeply interconnected system that focuses on community safety and
where solutions work together to create a highly functional and effective system that is
recommended to be phased in over an implementation period of seven to 10 years. It
includes:
o Establishment of service level standards that address the needs of the community and
existence of risks.
o Reduction of the number of stations from 27 to 17 through mergers and integration of
services at a lower cost of $92 million versus $135 for current infrastructure
arrangement.
o Construction of new stations in the right location that best service residents and
businesses throughout the entire City of Greater Sudbury, and that are configured to
meet the needs of modern fire and paramedic service operations.
o Reduction of vehicle and equipment needs by 25 units which eliminates the funding
shortfall over the next 20 years.
o Hiring of career firefighters to institute composite response at stations in Chelmsford,
Garson, Lively and Valley East.
o Improvement of fire response within nine minutes to 90% of the property valuation
from current coverage of 69% in the current service delivery model. This also improves
the immediate minimum four-person response from 48% to 80% within nine minutes.
o An appropriately funded service that is taxed under a flat rate model similar to
paramedic and police services, that eliminates funding shortfalls for station repairs
and maintenance, fleet and major equipment replacement, and presumptive
legislation.
o Achievement of a One City One Service delivery model that balances the three pillars
of service, risk and cost, and that aligns with the guiding principles for emergency
service delivery.

Fire and Paramedic Optimization Report
Page 176
IMPLEMENTATION
As identified in this report, it must be recognized that all stations, staffing and, ultimately, services are
an interconnected response model. Implementation of the plan requires a phased in reorganization of
stations and in some cases, a relocation of some stations. Implementation further requires: an
alignment, and in some cases an enhancement, of services to best respond to community risk, and an
alteration of the staffing model to achieve a safer community. As a general concept, the
implementation of the Optimization Plan would be carried out using a priority based approach, with an
aim to implement those components of the plan that have the best return on investment.
It is imperative that any change to a service level, service type, or station location would be predicated
based on key considerations as follows:
station condition (age, assessment of repairs required, other)
call volume
cost/funding
demographics of area including population density
service needs based on risks and hazards that exist in the areas of response
training implications
volunteer From Home Response availability
established fire and paramedic response standards

Fire and Paramedic Optimization Report
Page 177
Implementation Decision Points for Council’s Consideration
The following decision points will be brought forward to Council for consideration, and where there is a funding implication, a business case will be presented during the annual budget process. Ultimately, City Council will decide if and when each stage will proceed based on the priorities, issues and risks identified.
2017
- Second Quarter:
o Direct the General Manager of Community Safety to prepare a report for the
establishment of performance standards for Fire Services to be recommended for
adoption by Council by the end of the third quarter 2017 with the intent to report on
service performance on an annual basis.
o Provide direction to permanently close Red Deer Lake station immediately.
- Third Quarter: Business cases will be brought forward through the regular budget process in Fall
2017
o Provide direction to undertake planning stages to identify site for new Headquarters in
consultation with other city departments (roads, water/wastewater, police) to explore
the feasibility of a joint complex to meet multiple departmental needs.
o Authorize funding for site selection, design and planning for the new Headquarters,
Garson Station and New Sudbury Paramedic Post. Return with conceptual drawings and
costing for Council’s consideration and approval.
o Authorize funding for a contract Project Manager to manage infrastructure
improvements associated with optimization.
o Authorize funding for renovations of Wahnapitae Station.
o Provide direction and authorize funding to implement enhanced HAZMat response.
2018
- Authorize funding and provide direction to establish service enhancements for:
o Medical tiered response (MTR) for all areas of the city
o Water and ice water rescue for all areas of the city
2019
- Approve staffing enhancements and authorize funding for:
o Increase staffing at Val Therese station to implement four-person career response.
o Paramedic Services Scheduler
o Emergency Vehicle Technician (EVT)
- Authorize funding for renovation of Capreol Fire Station for cohabitation of Paramedic And Fire
Services followed by closure/repurpose/sale of Capreol Paramedic Station.

Fire and Paramedic Optimization Report
Page 178
2020
- Authorize funding to eliminate the funding gap for fire service vehicles and major equipment.
- Approve staffing enhancements and authorize funding for:
o two Fire Training Officers should the seven-day training model not be adopted based on
the Val Therese pilot,
o two additional Fire Prevention Officers,
o one additional Public Safety Fire Educator,
o Fire Service Clerk,
o Generalist.
- Authorize funding to implement volunteer firefighter involvement in public fire safety education
and fire prevention in volunteer response areas.
- Authorize funding for site selection and planning for new builds at: Waters, Chelmsford, Val
Caron, Hanmer, Elm West, Garson, Minnow Lake (17E) and Downtown paramedic post.
- Authorize funding to renovate/rebuild the following stations: Whitefish, Dowling, Skead,
Levack, and Capreol.
2020-2026
- Direct the closure/repurpose/sale of the following stations:
o Leon
o Minnow Lake (Second Avenue)
o Val Therese
o Van Horne
- Direct the consolidation of the following stations:
o Azilda
o Beaver Lake
o Coniston
o Copper Cliff
o Falconbridge
o Lively
o Vermillion Lake
- Approve staffing enhancements and authorize funding for:
o Implementation of composite response at Garson, Waters and Chelmsford/Azilda
Stations

Fire Optimization Report

Fire Optimization Report
Page 179
SUMMARY
The recommended optimized model achieves a balance of the three pillars of service, risk and cost
which were identified as the outset of this analysis. Furthermore, the optimized model follows all
of the guiding principles aimed to achieve a vision of being a highly effective service that has the
confidence of the public it serves. This optimized model is a highly interconnected system where
the solutions work together to create “something that is as fully perfect, functional or effective as
possible” achieving the direction that was laid out by Council.
It is important to understand the consequences to both the community and the organization of the
City of Greater Sudbury if a choice is made to leave the delivery model of Fire and Paramedic
Services unchanged.
By not making changes to the delivery model, Fire and Paramedic Services will continue to
experience growth of the capital gap resulting in continued aging of buildings, vehicles and
equipment. The risk would increase so that stations may need to be decommissioned with no
replacement available to fill the resultant gaps. Further, the City could be subject to a number of
complaints being filed against City of Greater Sudbury workplaces that do not meet Ontario Health
and Safety Regulations.
By not thoughtfully locating the service’s emergency stations, residents and businesses will
continue to experience longer response times in the outlying areas. Fire Services will continue to
only be able to provide a five minute response time to 42% of the city and a nine minute response
to 69% of the city. In some cases, there is no guarantee that a minimum of four firefighters will
respond initially within established industry (NFPA 1710 and 1720) guidelines and a considerable
time delay could be experienced for those waiting on the arrival of additional crews.
Maintaining status quo will also mean that identified risks remain unaddressed. The cost of
litigation, if the risks become real and claims are made against the City, could include high
settlement costs, substantial legal fees, and increased insurance premiums.
If taxation is unaddressed, residents living in career rated areas will continue to subsidize volunteer
rated areas unless or career rated area surpluses are solely invested in the career rated area. Some
residents will continue to receive enhanced services without paying for them and all residents
outside of the career rated area will continue to have a guaranteed four person career service level
backup to their volunteer service with no additional costs reflected in their taxation.
Avoiding tax increases to improve the service and bring it up to an expected level for a city of our
size could result in an increase of others costs paid by residents and business owners. Without
improvements to the service delivery as outlined in this report, FUS ratings may continue to decline
and could adversely affect insurance premiums.

Fire Optimization Report
Page 180
City Council’s Corporate Strategic Plan recognizes that Greater Sudbury is a growing community. It
outlines an aim to provide, “quality municipal services and leadership in social, environmental and
economic development.” The plan values acting today in the interest of tomorrow, providing
quality service with a citizen focus, and managing resources efficiently, responsibly and effectively.
It is strongly believed that the Fire and Paramedic Services Optimization Plan, as presented in this
report, achieves these desires and the direction provided by Council.

Fire Optimization Report

City of Greater Sudbury April 2016