Embed Size (px)
Citation preview
Greater
Sudbury Statistics
Updated December 2013
“A Secondary Research Toolkit”


TABLE OF CONTENTS
2011 CENSUS COMMUNITY PROFILE ................................................................................................................................... 1
GREATER SUDBURY CMA ..................................................................................................................................................... 1
POPULATION ........................................................................................................................................ 1 AGE CHARACTERISTICS ........................................................................................................................... 2 HOUSEHOLD CHARACTERISTICS ................................................................................................................ 3 MARITAL STATUS .................................................................................................................................. 3 FAMILY CHARACTERISTICS ....................................................................................................................... 4
2011 NATIONAL HOUSEHOLD SURVEY ................................................................................................................................. 5
GREATER SUDBURY CMA ..................................................................................................................................................... 5
EDUCATION .......................................................................................................................................... 5 LABOUR FORCE ..................................................................................................................................... 6 LANGUAGE ........................................................................................................................................... 8 ABORIGINAL POPULATION ....................................................................................................................... 8 CITIZENSHIP .......................................................................................................................................... 8 IMMIGRANTS ........................................................................................................................................ 9 ETHNIC ORIGIN ..................................................................................................................................... 9 RELIGION ........................................................................................................................................... 10 HOUSEHOLD INCOME 2010 .................................................................................................................. 11
SURVEY OF HOUSEHOLD SPENDING 2011 .......................................................................................................................... 12
VITAL STATISTICS ............................................................................................................................................................... 13
BIRTHS .............................................................................................................................................. 13 DEATHS ............................................................................................................................................. 13 MARRIAGES ....................................................................................................................................... 13
NUMBER OF PETS REGISTERED IN SUDBURY 2011 ............................................................................................................. 14
NUMBER OF BUSINESS ESTABLISHMENTS BY INDUSTRY.................................................................................................... 15
AVERAGE DAILY TRAFFIC ON ROADS ................................................................................................................................. 16
RETAIL SALES BY TYPE OF GOODS ...................................................................................................................................... 18
VEHICLES (DECEMBER 2010) .............................................................................................................................................. 18
NEWSPAPER CIRCULATION ................................................................................................................................................ 19
RADIO STATIONS ............................................................................................................................................................... 19
GREATER DOWNTOWN KEY FACTS .................................................................................................................................... 20
COMMUNITY DEMOGRAPHIC REPORTS: ............................................................................................................................ 22
CANADA POST MAPS ......................................................................................................................................................... 24
GREATER SUDBURY ZONING MAP ..................................................................................................................................... 26
GREATER SUDBURY ROAD MAP ......................................................................................................................................... 27
GREATER SUDBURY WARD MAP ........................................................................................................................................ 28
RESOURCES ....................................................................................................................................................................... 29
USEFUL INTERNET SITES..................................................................................................................................................... 34
Updated December 2013


1 | P a g e
2011 CENSUS COMMUNITY PROFILE GREATER SUDBURY CMA
Includes Wanapitei 11 and Whitefish Lake 6 Indian Reserves Population Total Male Female 2011 Census 160,770 78,480 82,290 2006 Census 158,258 76,880 81,385 Change 1.6% 2.1% 1.1% Land Area 3,410.62 km2 Population Density 47.1 per km2
2 | P a g e
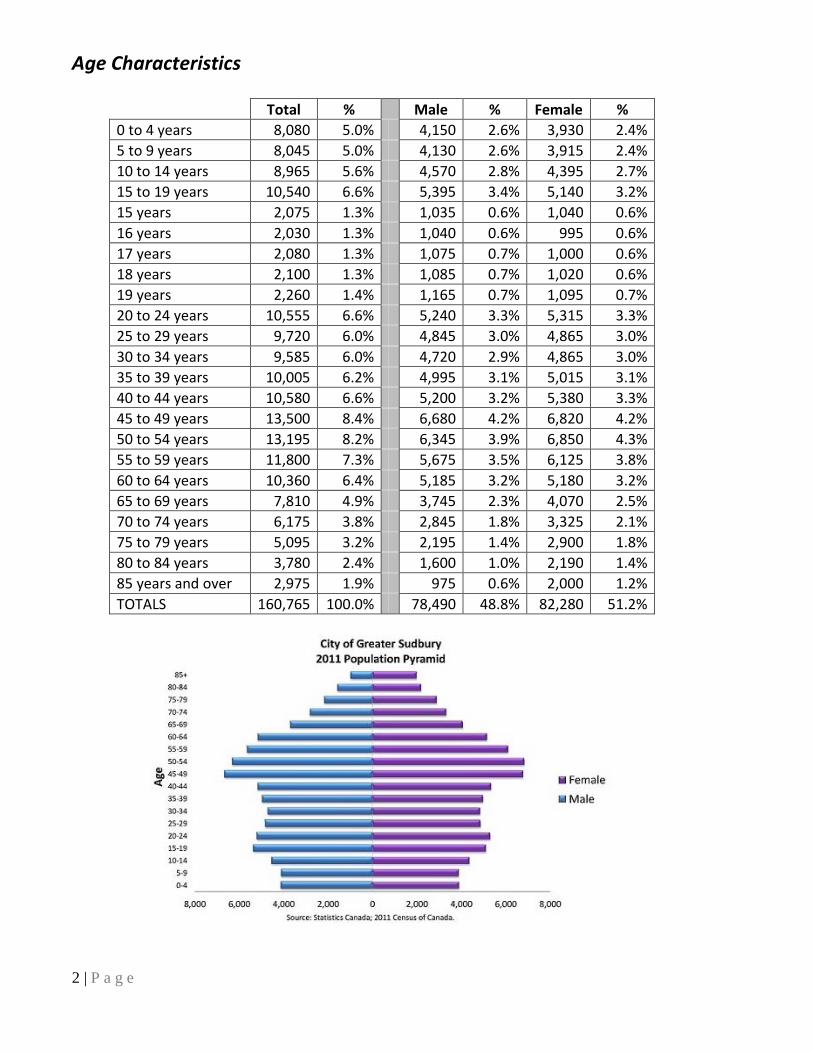
Age Characteristics
Total %
Male % Female %
0 to 4 years 8,080 5.0% 4,150 2.6% 3,930 2.4% 5 to 9 years 8,045 5.0% 4,130 2.6% 3,915 2.4% 10 to 14 years 8,965 5.6% 4,570 2.8% 4,395 2.7% 15 to 19 years 10,540 6.6% 5,395 3.4% 5,140 3.2% 15 years 2,075 1.3% 1,035 0.6% 1,040 0.6% 16 years 2,030 1.3% 1,040 0.6% 995 0.6% 17 years 2,080 1.3% 1,075 0.7% 1,000 0.6% 18 years 2,100 1.3% 1,085 0.7% 1,020 0.6% 19 years 2,260 1.4% 1,165 0.7% 1,095 0.7% 20 to 24 years 10,555 6.6% 5,240 3.3% 5,315 3.3% 25 to 29 years 9,720 6.0% 4,845 3.0% 4,865 3.0% 30 to 34 years 9,585 6.0% 4,720 2.9% 4,865 3.0% 35 to 39 years 10,005 6.2% 4,995 3.1% 5,015 3.1% 40 to 44 years 10,580 6.6% 5,200 3.2% 5,380 3.3% 45 to 49 years 13,500 8.4% 6,680 4.2% 6,820 4.2% 50 to 54 years 13,195 8.2% 6,345 3.9% 6,850 4.3% 55 to 59 years 11,800 7.3% 5,675 3.5% 6,125 3.8% 60 to 64 years 10,360 6.4% 5,185 3.2% 5,180 3.2% 65 to 69 years 7,810 4.9% 3,745 2.3% 4,070 2.5% 70 to 74 years 6,175 3.8% 2,845 1.8% 3,325 2.1% 75 to 79 years 5,095 3.2% 2,195 1.4% 2,900 1.8% 80 to 84 years 3,780 2.4% 1,600 1.0% 2,190 1.4% 85 years and over 2,975 1.9% 975 0.6% 2,000 1.2% TOTALS 160,765 100.0% 78,490 48.8% 82,280 51.2%

3 | P a g e
Household Characteristics Total private dwellings 72,736 Total number of occupied private dwellings by structural type of dwelling 67,770 By Type of Dwelling
By Household Size
Single-detached house 42,215 1 person 19,195 Apartment, building that has five or more storeys 4,465
2 persons 24,730 3 persons 10,765
Movable dwelling 575 4 persons 9,335 Semi-detached house 3,180 5 persons 2,795 Row house 2,860 6 or more persons 945 Apartment, duplex 3,830 Apartment, building that has fewer than five storeys 10,445
Other single-attached house 195
Marital Status
Total population 15 years and over 135,675 Married (and not separated) 64,075 Living common law 15,180 Single (never legally married) 34,890 Separated 4,665 Divorced 7,550 Widowed 9,330
Single-detached
house
1 person
2 person
3 person
Married Single
(never legally married)
Common Law
4 | P a g e
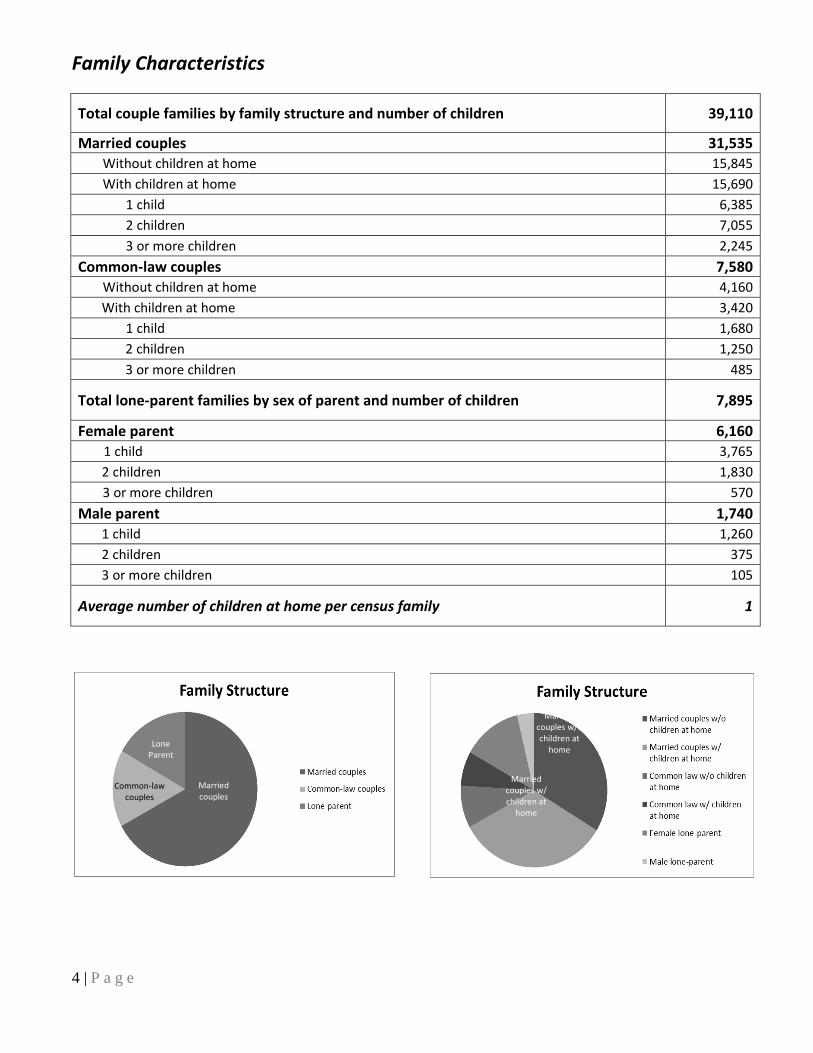
Family Characteristics
Total couple families by family structure and number of children 39,110
Married couples 31,535 Without children at home 15,845 With children at home 15,690
1 child 6,385 2 children 7,055 3 or more children 2,245
Common-law couples 7,580 Without children at home 4,160 With children at home 3,420
1 child 1,680 2 children 1,250 3 or more children 485
Total lone-parent families by sex of parent and number of children 7,895
Female parent 6,160 1 child 3,765 2 children 1,830 3 or more children 570
Male parent 1,740 1 child 1,260 2 children 375 3 or more children 105
Average number of children at home per census family 1
Married couples
Lone Parent
Common-law couples
Married couples w/o children at
home
Married couples w/ children at
home

5 | P a g e
2011 NATIONAL HOUSEHOLD SURVEY GREATER SUDBURY CMA
Education
Total Male Female
Total population aged 15 years and over 132,985 64,590 68,395 No certificate, diploma or degree 28,240 13,770 14,470 High school diploma or equivalent 32,630 15,295 17,335 Post-secondary certificate, diploma or degree 72,115 35,530 36,585 Apprenticeship or trades certificate or diploma 14,110 10,115 3,995 College, CEGEP or other non-university certificate or diploma 34,140 15,235 18,905 University certificate or diploma below bachelor level 3,075 1,125 1,945 University certificate, diploma or degree at bachelor level or above 20,790 9,055 11,740 Bachelor's degree 13,235 5,635 7,600 University certificate, diplima or degree above bachelor level 7,560 3,420 4,140
Post-secondary certificate, diploma or
degree
No certificate, diploma or
degree
High school diploma or equivalent

6 | P a g e
Labour Force Status
Total Male Female
Total population aged 15 years and over 132,990 64,595 68,395 In the labour force 83,855 43,055 40,800
Employed 77,275 39,535 37,745 Unemployed 6,575 3,520 3,055
Not in the labour force 49,130 21,540 27,590 Participation rate 63.1% 66.7% 59.7% Employment rate 58.1% 61.2% 55.2% Unemployment rate 7.8% 8.2% 7.5%
Source: 2011 National Household Survey
Source: Labour Force Survey
7 | P a g e
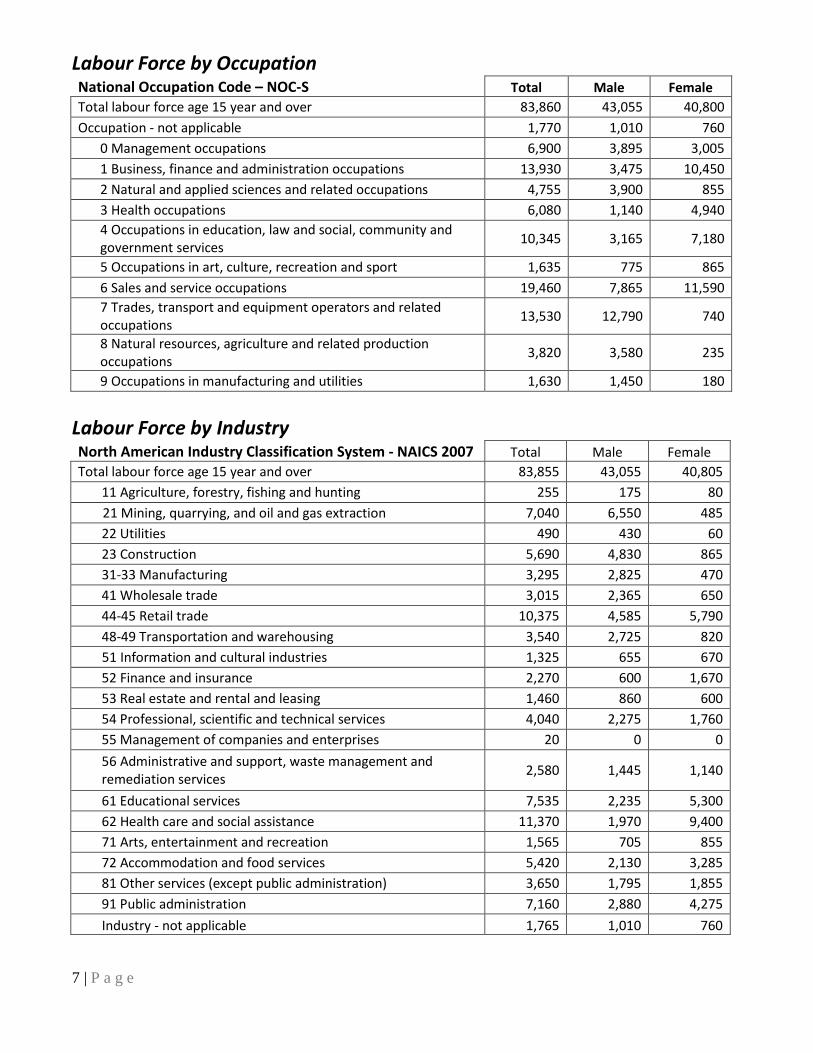
Labour Force by Occupation National Occupation Code – NOC-S Total Male Female Total labour force age 15 year and over 83,860 43,055 40,800 Occupation - not applicable 1,770 1,010 760
0 Management occupations 6,900 3,895 3,005 1 Business, finance and administration occupations 13,930 3,475 10,450 2 Natural and applied sciences and related occupations 4,755 3,900 855 3 Health occupations 6,080 1,140 4,940 4 Occupations in education, law and social, community and government services 10,345 3,165 7,180
5 Occupations in art, culture, recreation and sport 1,635 775 865 6 Sales and service occupations 19,460 7,865 11,590 7 Trades, transport and equipment operators and related occupations 13,530 12,790 740
8 Natural resources, agriculture and related production occupations 3,820 3,580 235
9 Occupations in manufacturing and utilities 1,630 1,450 180
Labour Force by Industry North American Industry Classification System - NAICS 2007 Total Male Female Total labour force age 15 year and over 83,855 43,055 40,805
11 Agriculture, forestry, fishing and hunting 255 175 80 21 Mining, quarrying, and oil and gas extraction 7,040 6,550 485 22 Utilities 490 430 60 23 Construction 5,690 4,830 865 31-33 Manufacturing 3,295 2,825 470 41 Wholesale trade 3,015 2,365 650 44-45 Retail trade 10,375 4,585 5,790 48-49 Transportation and warehousing 3,540 2,725 820 51 Information and cultural industries 1,325 655 670 52 Finance and insurance 2,270 600 1,670 53 Real estate and rental and leasing 1,460 860 600 54 Professional, scientific and technical services 4,040 2,275 1,760 55 Management of companies and enterprises 20 0 0 56 Administrative and support, waste management and remediation services 2,580 1,445 1,140
61 Educational services 7,535 2,235 5,300 62 Health care and social assistance 11,370 1,970 9,400 71 Arts, entertainment and recreation 1,565 705 855 72 Accommodation and food services 5,420 2,130 3,285 81 Other services (except public administration) 3,650 1,795 1,855 91 Public administration 7,160 2,880 4,275 Industry - not applicable 1,765 1,010 760

8 | P a g e
Language Mother-Tongue Language Total % Male Female English 102,755 65.9% 51,150 51,605 French 42,815 27.5% 20,295 22,520 Aboriginal 290 0.2% 100 190 Non-official languages 10,050 6.4% 4,815 5,235
Knowledge of Language Total % Male Female English only 95,390 59.9% 48,245 47,140 French only 1,665 1.0% 715 950 English and French 61,795 38.8% 28,845 32,955 Neither English nor French 345 0.2% 120 230
Aboriginal Population Total Male Female Total Population 160,770 78,480 82,290 Aboriginal Identify 13,405 6,495 6,915
First Nations (North American Indian) 6,490 3,140 3,350 Métis single identity 6,455 3,100 3,355 Inuk (Inuit) single identity 40 0 25 Multiple Aboriginal Identities 90 55 40 Aboriginal identities not included elsewhere 335 190 145
Citizenship Total Male Female Canadian Citizen 156,115 76,405 79,705 Not Canadian Citizen 2,145 1,030 1,120
9 | P a g e
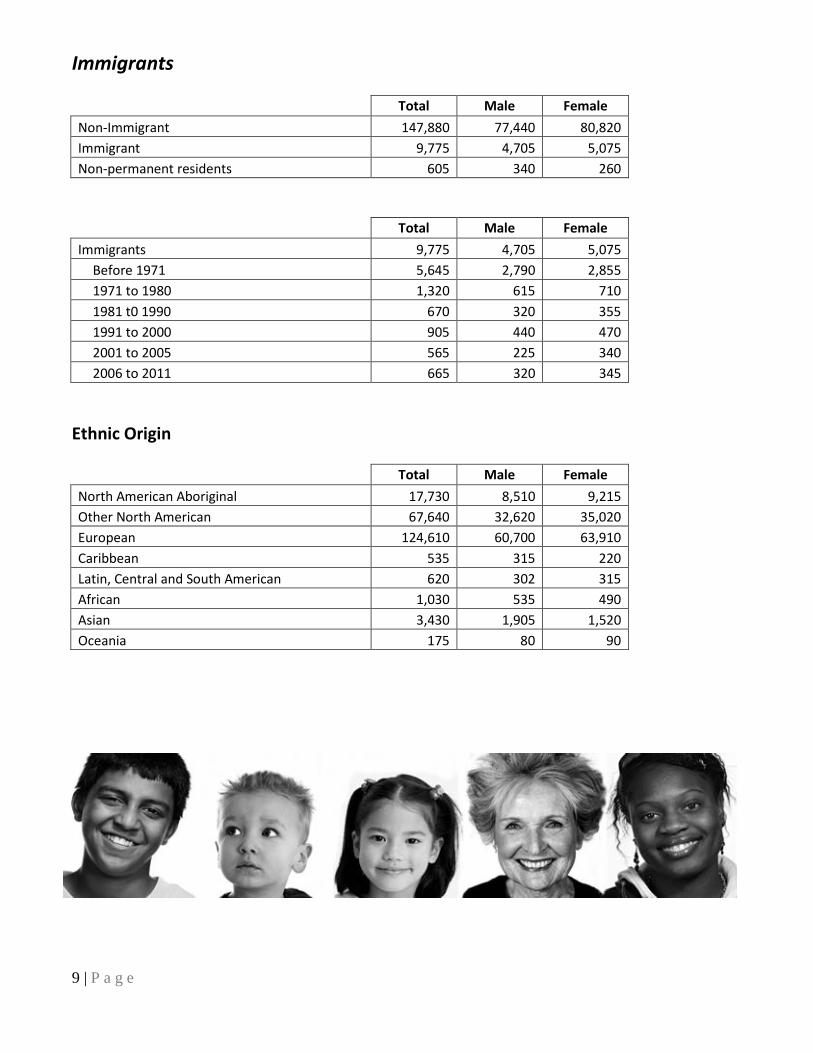
Immigrants Total Male Female Non-Immigrant 147,880 77,440 80,820 Immigrant 9,775 4,705 5,075 Non-permanent residents 605 340 260
Total Male Female Immigrants 9,775 4,705 5,075
Before 1971 5,645 2,790 2,855 1971 to 1980 1,320 615 710 1981 t0 1990 670 320 355 1991 to 2000 905 440 470 2001 to 2005 565 225 340 2006 to 2011 665 320 345
Ethnic Origin
Total Male Female
North American Aboriginal 17,730 8,510 9,215 Other North American 67,640 32,620 35,020 European 124,610 60,700 63,910 Caribbean 535 315 220 Latin, Central and South American 620 302 315 African 1,030 535 490 Asian 3,430 1,905 1,520 Oceania 175 80 90

10 | P a g e
Religion
Total Male Female
Christian 127,450 60,295 67,155 Catholic 92,820 44,410 48,410 No religious affiliation 28,550 15,840 12,715 United Church 9,790 4,420 5,375 Other Christian 8,560 3,695 4,865 Anglican 6,810 3,275 3,535 Lutheran 3,040 1,405 1,635 Baptist 2,080 1,055 1,025 Pentecostal 1,895 815 1,080 Presbyterian 1,530 735 795 Christian Orthodox 930 490 440 Muslim 650 375 275 Other religions 410 200 210 Traditional (Aboriginal) Spirituality 375 230 145 Hindu 345 190 155 Buddhist 295 190 105 Jewish 120 75 40 Sikh 75 45 25

11 | P a g e
Household Income 2010 Before tax After tax
# of households
# of households
Under $5,000 1,390 Under $5,000 1.395 $5,000 to $9,999 1,050 $5,000 to $9,999 1,055 $10,000 to $14,999 2,830 $10,000 to $14,999 2,845 $15,000 to $19,999 3,420 $15,000 to $19,999 3,520 $20,000 to $29,999 6,140 $20,000 to $29,999 6,770 $30,000 to $39,999 5,520 $30,000 to $39,999 7.035 $40,000 to $49,999 6,350 $40,000 to $49,999 7,245 $50,000 to $59,999 5,690 $50,000 to $59,999 6,950 $60,000 to $79,999 9,855 $60,000 to $79,999 11,305 $80,000 to $99,999 7,980 $80,000 to $99,999 8,030 $100,000 to $124,999 6,950 $100,000 to $124,999 5,565 $125,000 to $149,999 4,240 $125,000 and over 6,065 $150,000 and over 6,355 Median Household Income $ 62,472 Median Household Income $ 55,437 Average Household Income $ 76,731 Average Household Income $ 64,768

12 | P a g e
SURVEY OF HOUSEHOLD SPENDING 2011
CANADA
ONTARIO
2010 2011 2010 2011 TOTAL EXPENDITURE $ 71,282 $ 73,457 $ 75,163 $ 77,554 TOTAL CURRENT CONSUMPTION $ 53,724 $ 55,151 $ 55,803 $ 57,514 Food expenditures 7,823 7,795 7,709 7,832 Shelter 14,997 15,198 16,760 16,960 Household operations 3,846 4,135 3,934 4,458 Household furnishings and equipment 1,957 2,027 2,090 2,123 Clothing and accessories 3,455 3,360 3,658 3,624 Transportation 11,059 11,229 11,506 11,290 Health care 2,214 2,211 1,828 1,859 Personal care 936 1,082 867 1,090 Recreation 3,576 3,711 3,428 3,706 Education 1,152 1,216 1,456 1,575 Reading materials and other printed matter 198 221 177 217 Tobacco products and alcoholic beverages 1,198 1,199 1,088 980 Games of chance 147 166 131 159 Miscellaneous expenditures 1,167 1,602 1,172 1,641 Gifts of money, alimony and contributions to charity 1,609 1,673 1,874 2,037
Survey of Household Spending 2011, Ontario Top 5 categories

13 | P a g e
VITAL STATISTICS Births Registrations of births to mothers residing in Greater Sudbury at the time at which they gave birth.
2012 2011 2010 2009 2008 2007 2006 1,482 1,534 1,607 1,445* 1,669 1,710
Source: Sudbury & District Health Unit, 2009 – 2012; City of Greater Sudbury Vital Statistics 2006-2007 *Note: Vital Statistics at the City of Greater Sudbury stopped registering births after September 2008
Deaths
Jan Feb Mar Apr May Jun Jul Aug Sep Oct Nov Dec Total 2013 2012 2011 142 157 150 130 135 129 155 113 129 146 133 139 1,658 2010 139 120 122 132 133 133 135 146 142 147 139 130 1,618 2009 157 138 153 146 149 136 134 135 144 140 129 127 1,688 2008 131 153 145 151 111 135 135 133 118 137 139 145 1,633 2007 151 164 156 131 122 131 125 117 121 136 147 144 1,645 2006 124 119 164 143 128 138 138 131 117 126 124 135 1,583
Source: Vital Statistics, City of Greater Sudbury, December 2013 Note: Numbers do not include still births
Marriages
2013 2012 2011 2010 2009 2008 2007 2006 2005
Jan 24 25 16 31 24 26 22 26 Feb 22 23 26 25 25 17 24 17 Mar 42 37 33 56 24 33 42 34 Apr 59 46 37 71 71 54 49 62 May 107 92 92 89 110 96 98 98 Jun 144 126 122 117 120 124 106 127 Jul 135 130 126 133 148 152 175 142 Aug 112 126 103 109 109 114 116 99 Sep 65 67 70 57 67 54 69 64 Oct 38 27 29 36 26 30 35 30 Nov 34 21 16 19 12 26 25 21 Dec 26 30 27 21 34 14 16 23 Total 808 750 697 764 770 740 777 743
Source: City of Greater Sudbury Vital Statistics, December 2013

14 | P a g e
NUMBER OF PETS REGISTERED IN SUDBURY 2011 2012 2011 2010 2009 2008 2007
Number of Tags Sold to Cats 1051 1077 1115 1451 1100 1000
Number of Tags Sold to Dogs 5425 5596 5770 5888 5500 5200
Number of Tags Sold to Cats and Dogs 6476 6673 6885 7339 6600 6200 *These numbers are approximate since not everyone decides to register their pets Source: Compliance and Enforcement Services of the City of Greater Sudbury A dwelling can contain a maximum of 2 dogs maximum and a maximum of 4 pets in total. Therefore a dwelling could have 2 dogs and 2 cats for a total of 4 pets or 4 cats and no dogs for a total of 4 pets.
15 | P a g e
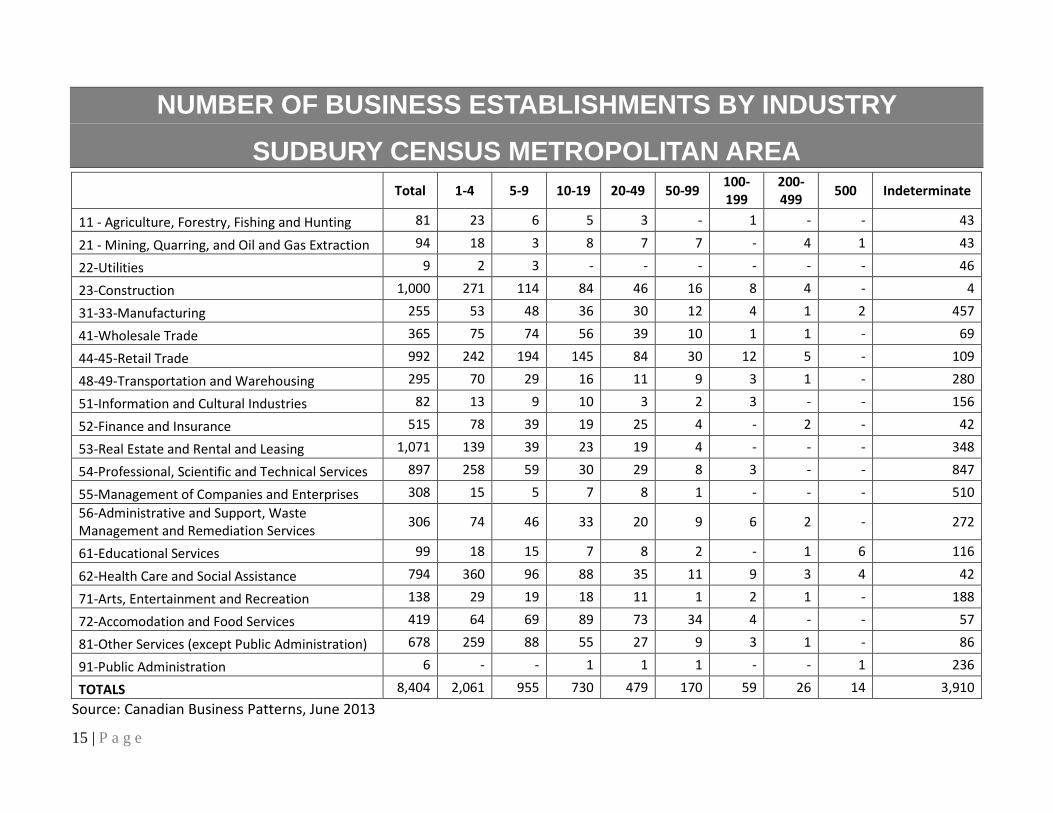
NUMBER OF BUSINESS ESTABLISHMENTS BY INDUSTRY
SUDBURY CENSUS METROPOLITAN AREA
Total 1-4 5-9 10-19 20-49 50-99 100-199
200-499 500 Indeterminate
11 - Agriculture, Forestry, Fishing and Hunting 81 23 6 5 3 - 1 - - 43
21 - Mining, Quarring, and Oil and Gas Extraction 94 18 3 8 7 7 - 4 1 43
22-Utilities 9 2 3 - - - - - - 46
23-Construction 1,000 271 114 84 46 16 8 4 - 4
31-33-Manufacturing 255 53 48 36 30 12 4 1 2 457
41-Wholesale Trade 365 75 74 56 39 10 1 1 - 69
44-45-Retail Trade 992 242 194 145 84 30 12 5 - 109
48-49-Transportation and Warehousing 295 70 29 16 11 9 3 1 - 280
51-Information and Cultural Industries 82 13 9 10 3 2 3 - - 156
52-Finance and Insurance 515 78 39 19 25 4 - 2 - 42
53-Real Estate and Rental and Leasing 1,071 139 39 23 19 4 - - - 348
54-Professional, Scientific and Technical Services 897 258 59 30 29 8 3 - - 847
55-Management of Companies and Enterprises 308 15 5 7 8 1 - - - 510 56-Administrative and Support, Waste Management and Remediation Services 306 74 46 33 20 9 6 2 - 272
61-Educational Services 99 18 15 7 8 2 - 1 6 116
62-Health Care and Social Assistance 794 360 96 88 35 11 9 3 4 42
71-Arts, Entertainment and Recreation 138 29 19 18 11 1 2 1 - 188
72-Accomodation and Food Services 419 64 69 89 73 34 4 - - 57
81-Other Services (except Public Administration) 678 259 88 55 27 9 3 1 - 86
91-Public Administration 6 - - 1 1 1 - - 1 236
TOTALS 8,404 2,061 955 730 479 170 59 26 14 3,910 Source: Canadian Business Patterns, June 2013

16 | P a g e
AVERAGE DAILY TRAFFIC ON ROADS Local Roads Location 2012 2011 2010 Kingsway (at Bancroft Drive) 45,000 Kingsway (at RioCan Centre) 42,000 Paris St overpass 35,000 Paris St (at St. Joseph's Hospital) 33,000 Paris St (at Ramsey Lake Rd) 30,000 Paris St (at Four Corners) 25,000 Lasalle Blvd (at Notre Dame Ave) 35,000 Lasalle Blvd (at Barry Downe Rd) 28,000 Lasalle Blvd (at Falconbridge Hwy) 17,000 Notre Dame Ave (at Taxation Centre) 28,000 Notre Dame Ave (at Elm St) 28,000 Regent St (at Bouchard St) 24,000 Regent St (at Four Corners) 29,000 Barry Downe Rd (at Kingsway) 33,000 Barry Downe Rd (at Cambrian College) 9,500 Falconbridge Hwy (at Kingsway) 27,000 Brady St underpass 21,000 Brady St (at Lloyd St) 25,500 Elm St (at Durham St) 16,000 Ramsey Lake Rd (at Science North) 18,500 Lorne St (at Walnut St) 13,000 Lorne St (at Martindale Rd) 23,000 Municipal Rd 55 (between Sudbury and Copper Cliff) 22,500 Municipal Rd 55 (between Copper Cliff and Lively) 16,500 Municipal Rd 80 (between Sudbury and Val Caron) 20,000 Municipal Rd 80 (north of Main St., Val Caron) 25,000 Municipal Rd 86 (between Sudbury and Garson) 19,000 Municipal Rd 35 (between Sudbury and Azilda) 18,000 Hwy 144 - Chelmsford * (at Municipal Rd 15) 21,200 Municipal Rd 84 (between Hanmer and Capreol) 5,500 Source: Traffic & Transportation Section, Public Works Dept., City of Greater Sudbury. * data supplied by the Ontario Ministry of Transportation, 2007.
17 | P a g e
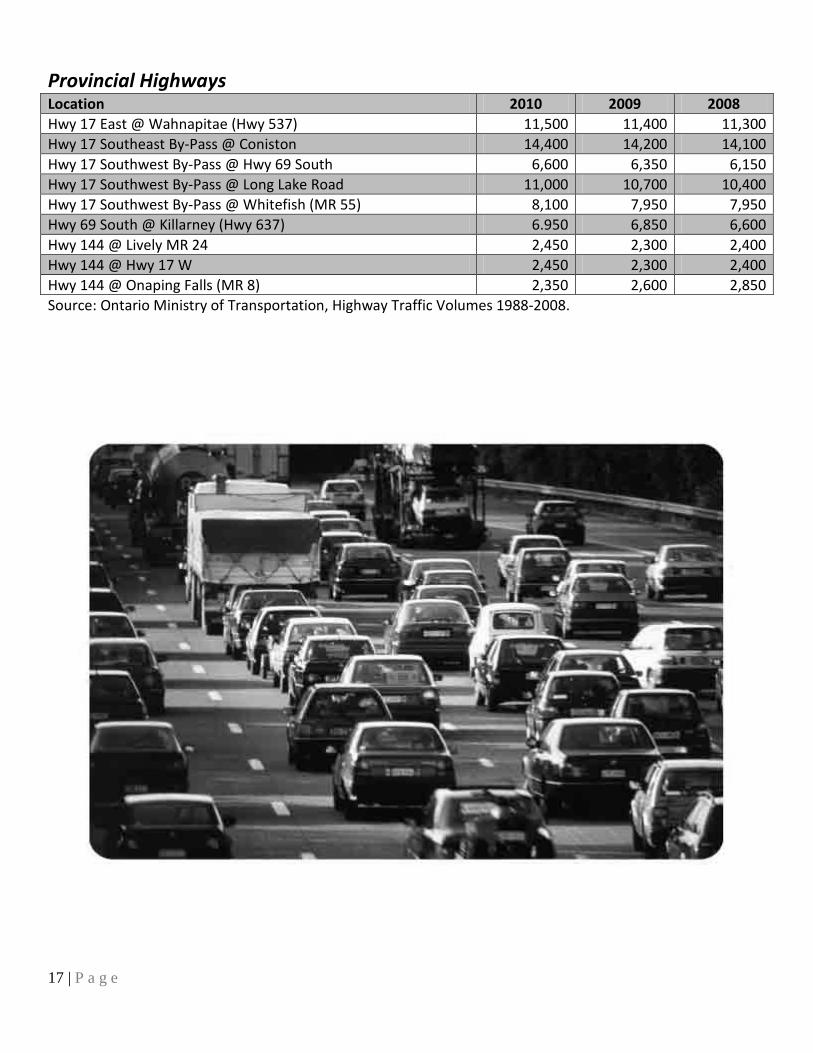
Provincial Highways Location 2010 2009 2008 Hwy 17 East @ Wahnapitae (Hwy 537) 11,500 11,400 11,300 Hwy 17 Southeast By-Pass @ Coniston 14,400 14,200 14,100 Hwy 17 Southwest By-Pass @ Hwy 69 South 6,600 6,350 6,150 Hwy 17 Southwest By-Pass @ Long Lake Road 11,000 10,700 10,400 Hwy 17 Southwest By-Pass @ Whitefish (MR 55) 8,100 7,950 7,950 Hwy 69 South @ Killarney (Hwy 637) 6.950 6,850 6,600 Hwy 144 @ Lively MR 24 2,450 2,300 2,400 Hwy 144 @ Hwy 17 W 2,450 2,300 2,400 Hwy 144 @ Onaping Falls (MR 8) 2,350 2,600 2,850 Source: Ontario Ministry of Transportation, Highway Traffic Volumes 1988-2008.

18 | P a g e
RETAIL SALES BY TYPE OF GOODS Greater Sudbury - 2012 Estimates (million $) New/Used Cars, Rec. Vehicles, Parts 619.9
Gas Stations 476.1
Furniture 41.2
Home Furnishings 30.2
Home Electronics & Appliances 56.1
Building Material, Garden Equipment & Supplies 115.9
Supermarkets 488.8
Convenience & Specialty Foods 75.5
Beer, Wine, Liquor 106.6
Pharmacies, Personal Care 609.1
Clothing & Clothing Accessories 127.0
General Merchandise 306.1
Sporting, Hobby, Music & Book 46.5
Misc 109.9
Total $ 3,208.7 million
per Capita $ 19,366
per Household $ 45,791 Source: FP Markets Canadian Demographics 2012; Greater Sudbury CMA. Total may not sum due to rounding.
VEHICLES (DECEMBER 2010)
2010 NVR (’10 Year End) 7,574 ’09-’11 Model Years VIO 16,075 % ’09-’11 MY of total VIO 13% ’81-’08 Model Years VIO 107,614 % ’81-’08 MY of total VIO 87% Total VIO (’81-’11) 123,689
NVR = New Vehicle Registrations VIO = Vehicles in Operation Source: FP Markets – Canadian Demographics 2012 – Financial Post
19 | P a g e
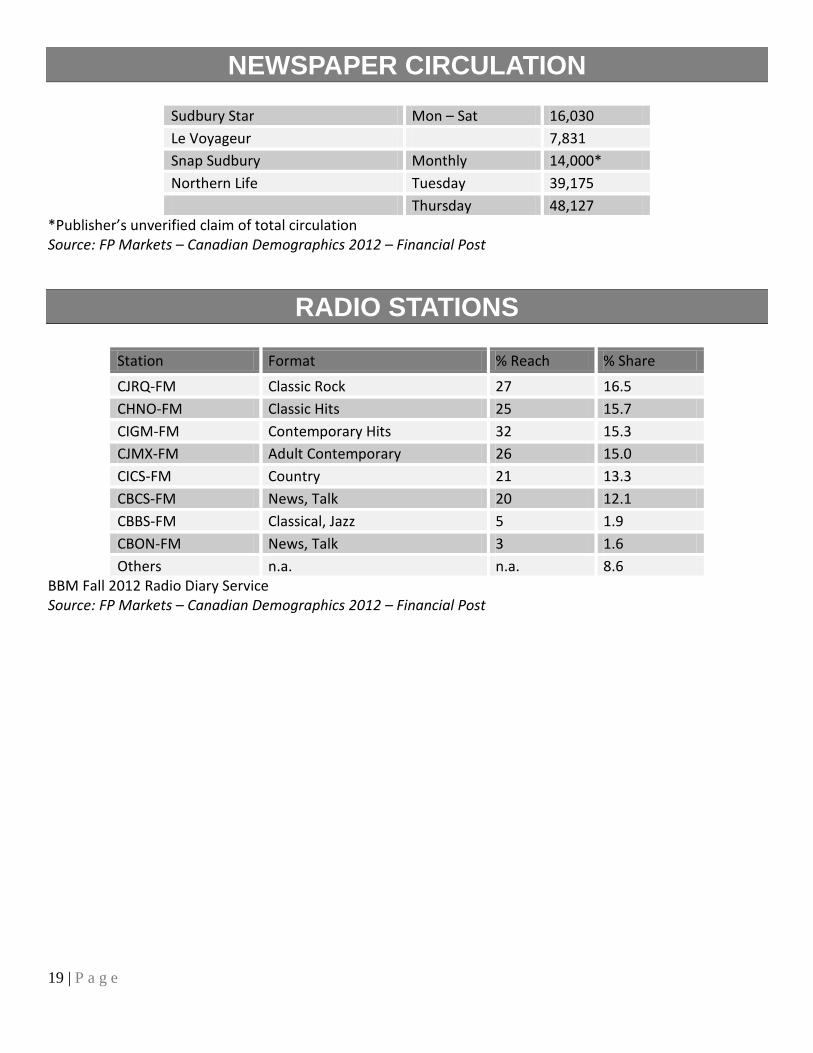
NEWSPAPER CIRCULATION
Sudbury Star Mon – Sat 16,030 Le Voyageur 7,831 Snap Sudbury Monthly 14,000* Northern Life Tuesday 39,175 Thursday 48,127
*Publisher’s unverified claim of total circulation Source: FP Markets – Canadian Demographics 2012 – Financial Post
RADIO STATIONS
Station Format % Reach % Share
CJRQ-FM Classic Rock 27 16.5 CHNO-FM Classic Hits 25 15.7 CIGM-FM Contemporary Hits 32 15.3 CJMX-FM Adult Contemporary 26 15.0 CICS-FM Country 21 13.3 CBCS-FM News, Talk 20 12.1 CBBS-FM Classical, Jazz 5 1.9 CBON-FM News, Talk 3 1.6 Others n.a. n.a. 8.6
BBM Fall 2012 Radio Diary Service Source: FP Markets – Canadian Demographics 2012 – Financial Post

20 | P a g e
GREATER DOWNTOWN KEY FACTS
21 | P a g e
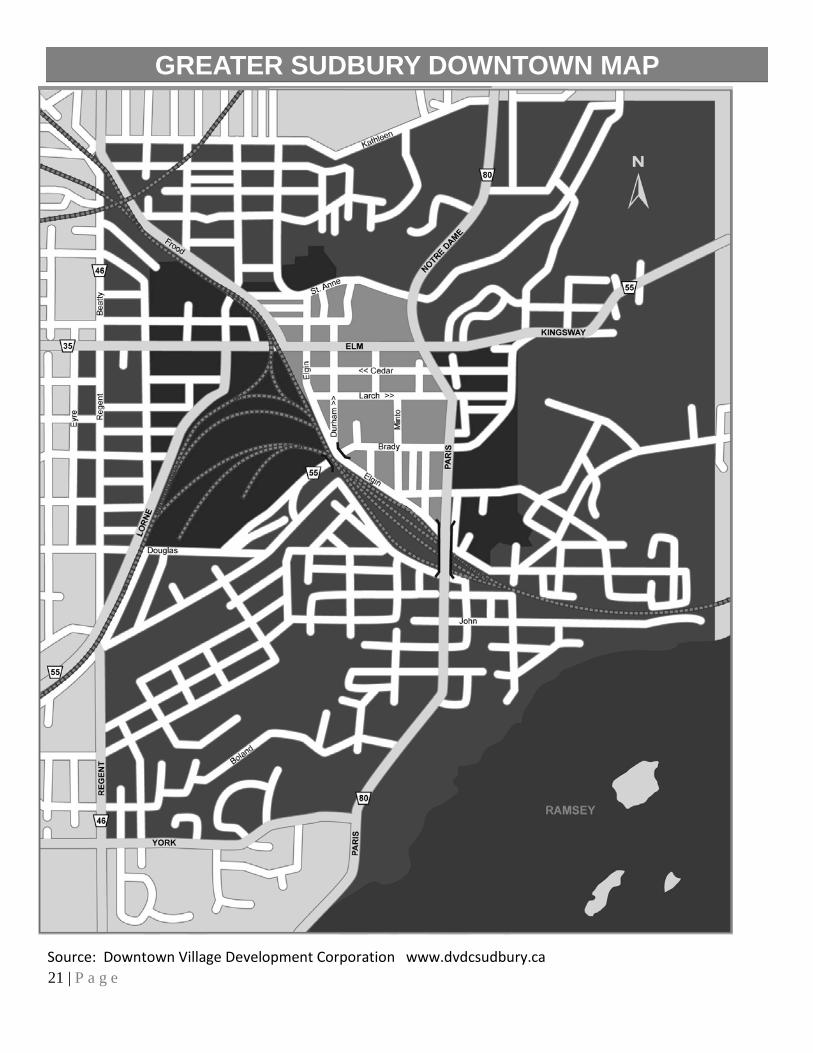
GREATER SUDBURY DOWNTOWN MAP
Source: Downtown Village Development Corporation www.dvdcsudbury.caS

22 | P a g e
COMMUNITY DEMOGRAPHIC REPORTS: GREATER SUDBURY
Looking for Community Specific Information? Contact our Research Officer, Jacinda McLean Tel: (705)674-4455 Ext 4635 Email: [email protected]
1. Downtown Sudbury 9. Coniston-Wahnapitae-Wanup
2. Onaping - Levack 10. South End
3. Lively 11. New Sudbury – Minnow Lake
4. Copper Cliff 12. Donovan – Flour Mill – Cambrian Heights
5. Chelmsford-Azilda 13. Whitefish – BeaverLake
6. Capreol 14. French River
7. Valley East - Blezard Valley - Hanmer 15. Markstay – Warren – St Charles
8. Garson-Falconbridge - Skead 16. North Bay

23 | P a g e
COMMUNITY DEMOGRAPHIC REPORTS: OTHER Looking for Outside of Sudbury?
23. Little Current 28. Manitowaning
24. M’Chigeeng 29. Providence Bay – Spring Bay
25. Mindemoya 30. South Baymouth
26. Wikwemikong 31. Espanola
27. Gore Bay 32. Elliot Lake Looking for someplace else? Contact our Research Officer, Jacinda McLean Tel: (705)674-4455 Ext 4635 Email: [email protected]

24 | P a g e
CANADA POST PROVINCIAL MAP

25 | P a g e
CANADA POST GREATER SUDBURY MAP
26 | P a g e
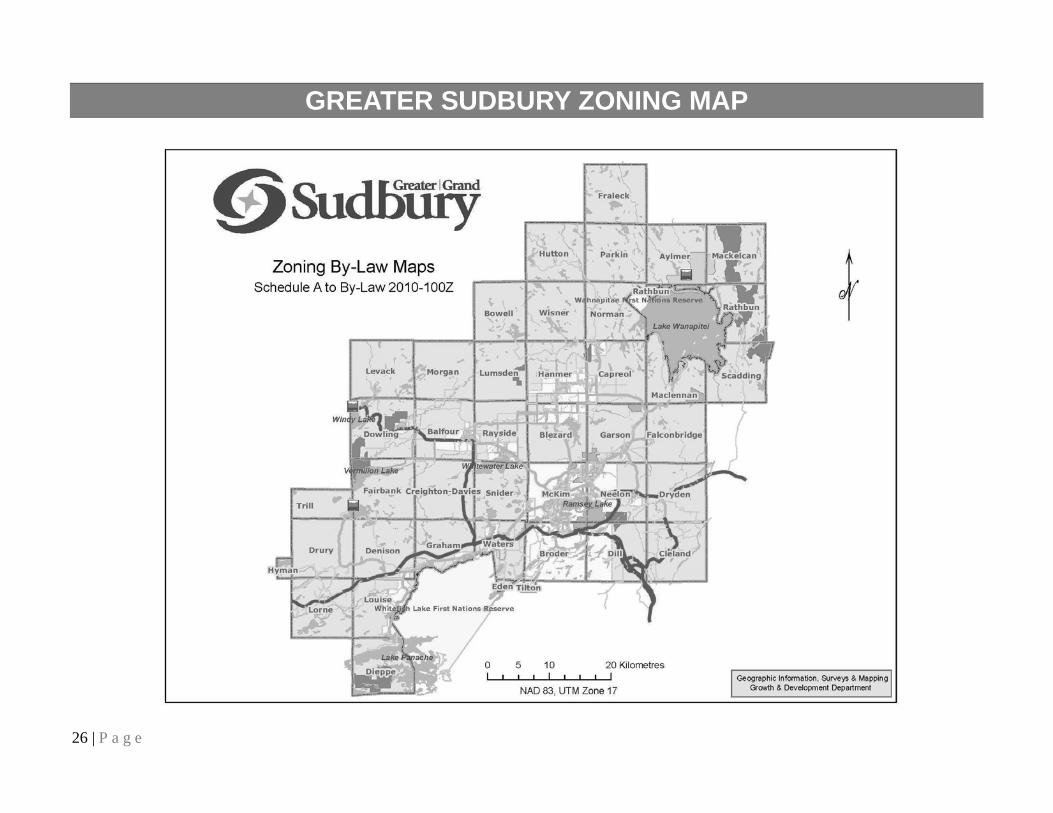
GREATER SUDBURY ZONING MAP
27 | P a g e
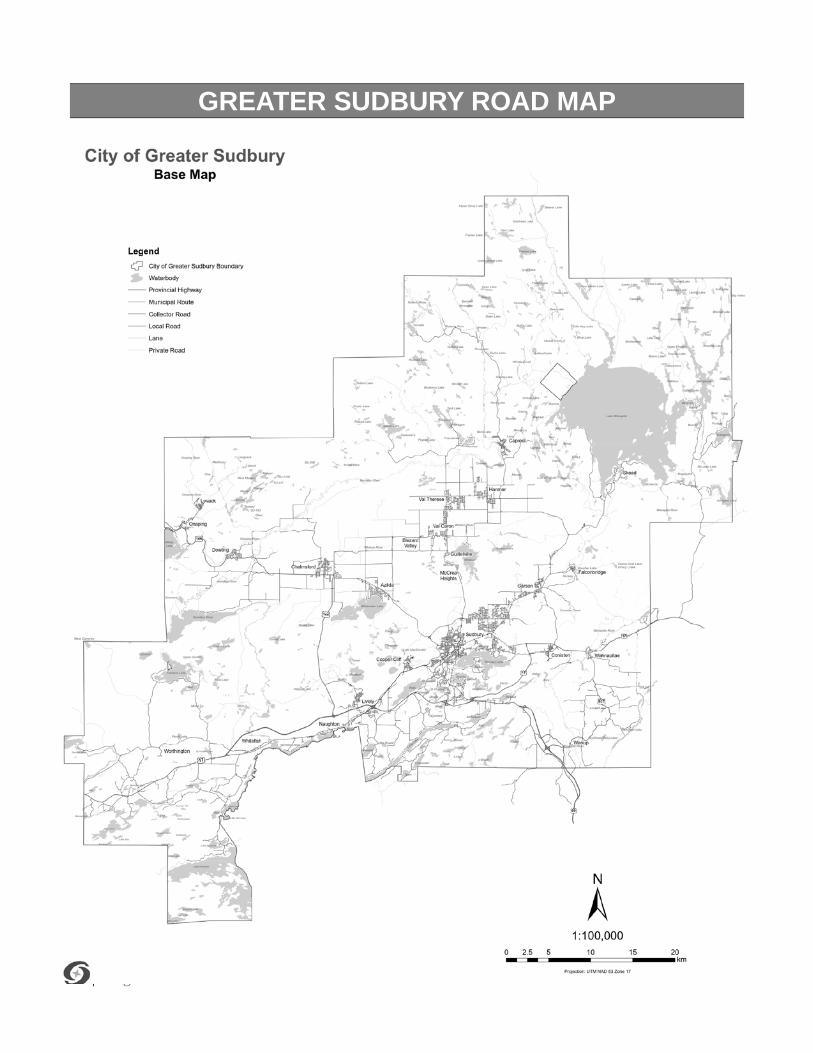
GREATER SUDBURY ROAD MAP

28 | P a g e
GREATER SUDBURY WARD MAP
29 | P a g e
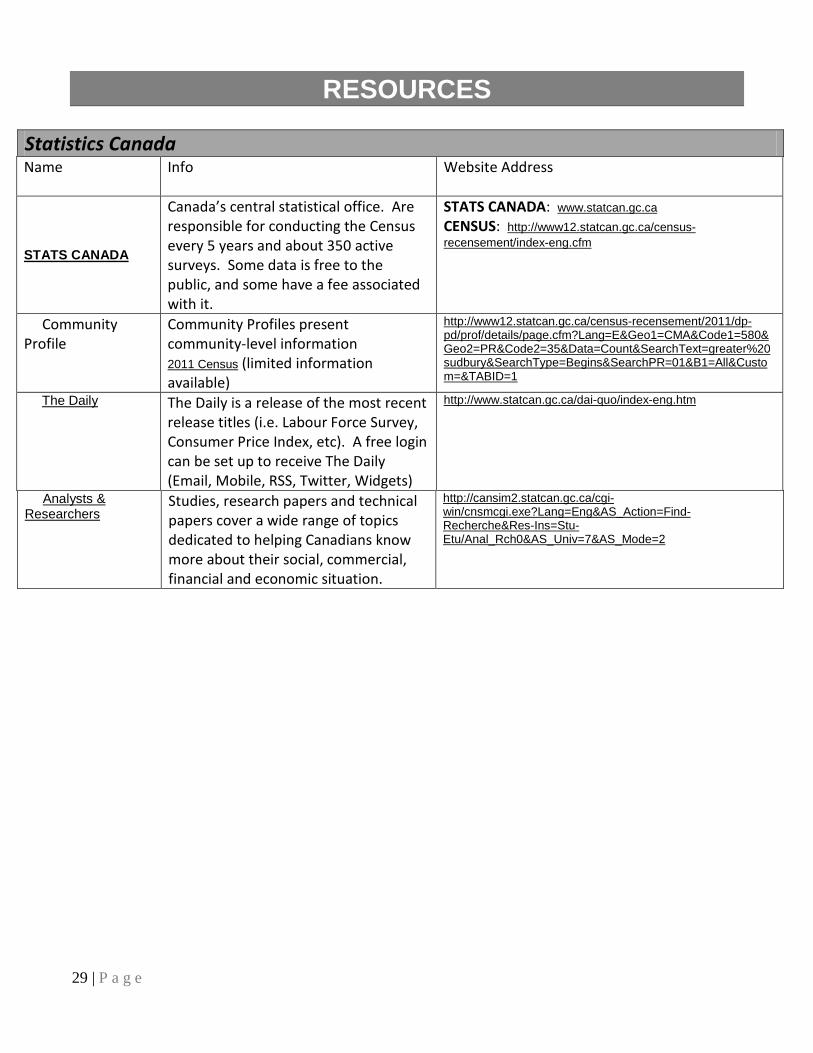
RESOURCES
Statistics Canada Name
Info Website Address
STATS CANADA
Canada’s central statistical office. Are responsible for conducting the Census every 5 years and about 350 active surveys. Some data is free to the public, and some have a fee associated with it.
STATS CANADA: www.statcan.gc.ca CENSUS: http://www12.statcan.gc.ca/census-recensement/index-eng.cfm
Community Profile
Community Profiles present community-level information 2011 Census (limited information available)
http://www12.statcan.gc.ca/census-recensement/2011/dp-pd/prof/details/page.cfm?Lang=E&Geo1=CMA&Code1=580&Geo2=PR&Code2=35&Data=Count&SearchText=greater%20sudbury&SearchType=Begins&SearchPR=01&B1=All&Custom=&TABID=1
The Daily
The Daily is a release of the most recent release titles (i.e. Labour Force Survey, Consumer Price Index, etc). A free login can be set up to receive The Daily (Email, Mobile, RSS, Twitter, Widgets)
http://www.statcan.gc.ca/dai-quo/index-eng.htm
Analysts & Researchers
Studies, research papers and technical papers cover a wide range of topics dedicated to helping Canadians know more about their social, commercial, financial and economic situation.
http://cansim2.statcan.gc.ca/cgi-win/cnsmcgi.exe?Lang=Eng&AS_Action=Find-Recherche&Res-Ins=Stu-Etu/Anal_Rch0&AS_Univ=7&AS_Mode=2
30 | P a g e
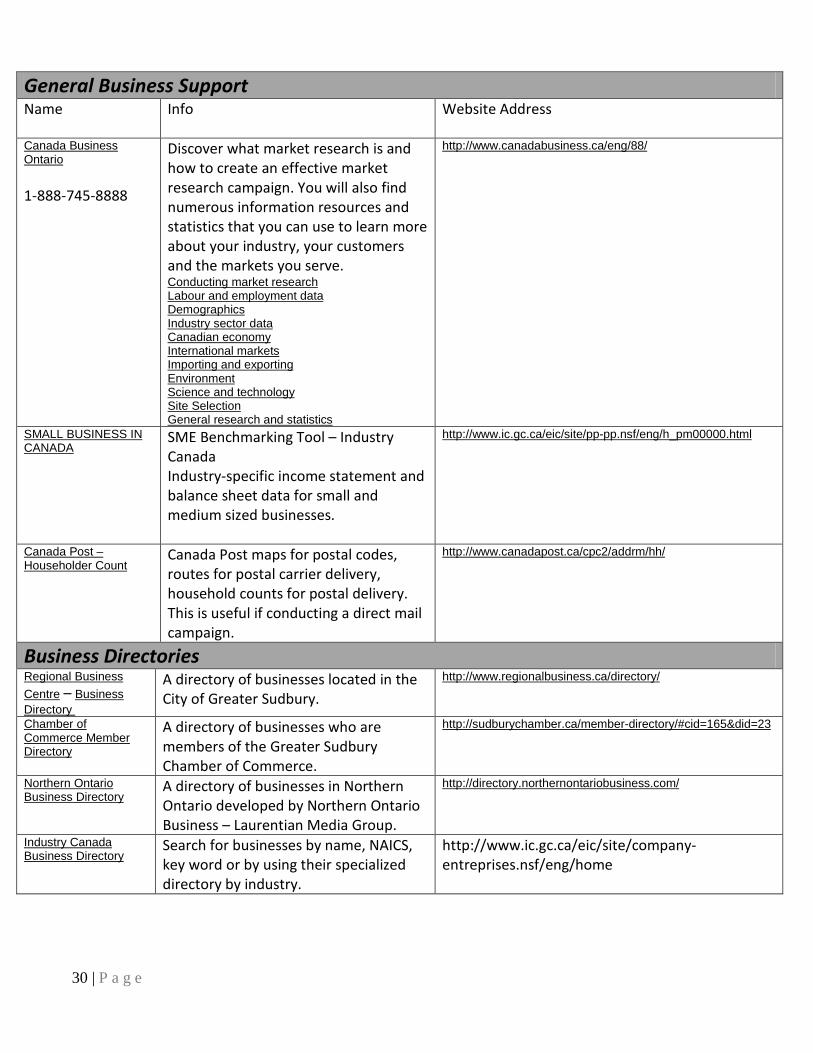
General Business Support Name
Info Website Address
Canada Business Ontario 1-888-745-8888
Discover what market research is and how to create an effective market research campaign. You will also find numerous information resources and statistics that you can use to learn more about your industry, your customers and the markets you serve. Conducting market research Labour and employment data Demographics Industry sector data Canadian economy International markets Importing and exporting Environment Science and technology Site Selection General research and statistics
http://www.canadabusiness.ca/eng/88/
SMALL BUSINESS IN CANADA SME Benchmarking Tool – Industry
Canada Industry-specific income statement and balance sheet data for small and medium sized businesses.
http://www.ic.gc.ca/eic/site/pp-pp.nsf/eng/h_pm00000.html
Canada Post – Householder Count Canada Post maps for postal codes,
routes for postal carrier delivery, household counts for postal delivery. This is useful if conducting a direct mail campaign.
http://www.canadapost.ca/cpc2/addrm/hh/
Business Directories Regional Business Centre – Business Directory
A directory of businesses located in the City of Greater Sudbury.
http://www.regionalbusiness.ca/directory/
Chamber of Commerce Member Directory
A directory of businesses who are members of the Greater Sudbury Chamber of Commerce.
http://sudburychamber.ca/member-directory/#cid=165&did=23
Northern Ontario Business Directory A directory of businesses in Northern
Ontario developed by Northern Ontario Business – Laurentian Media Group.
http://directory.northernontariobusiness.com/
Industry Canada Business Directory Search for businesses by name, NAICS,
key word or by using their specialized directory by industry.
http://www.ic.gc.ca/eic/site/company-entreprises.nsf/eng/home

31 | P a g e
Market Specific Resources Name Info Website Address AGRICULTIURE Agriculture & Agri-Food Canada
Economic & Market Information on crops, dairy, fish& seafood, horticulture, livestock & red meat, oilseeds, cereals & grains, poultry & eggs, pulses & special crops. Agri-Food Trade Service: Market Information by product
http://www4.agr.gc.ca/AAFC-AAC/display-afficher.do?id=1177676316971&lang=eng http://www.ats-sea.agr.gc.ca/info/prod-eng.htm
CONSTRUCTION Construction Sector Council Provides construction organizations with forecast data on residential and non-residential construction investment activity and labour supply and demand at the national, provincial and regional levels.
http://www.constructionforecasts.ca/
Canadian Construction Association Information & statistics on construction industry in Canada
http://www.cca-acc.com/en
Canadian Homebuilders’ Association Information on the Housing Industry Canadian Housing Industry - Performance and Trends (October 2010) Economic Impacts of the Housing Industry - Canada (2010) (Fact Sheet / Full Report)
http://www.chba.ca/about/information.aspx
EUROPEAN MARKETS
Euro Indicators Browse the latest European economic indicators or search for statistics in Eurostat's latest publications and datasets
http://epp.eurostat.ec.europa.eu/portal/page/portal/eurostat/home
FINANCIAL – STOCKS / MARKETS
TD Waterhouse Information on stock markets, commodities, sectors/industries and business news.
http://www.tdwaterhouse.ca/markets-research/markets/index.jsp
FISHERIES & OCEANS
Fisheries & Oceans Canada Statistics related to aquaculture, commercial fisheries, recreational fishing and trade (imports/exports).
http://www.dfo-mpo.gc.ca/stats/stats-eng.htm
GLOBAL ECONOMY
OECD - Organization for Economic Co-operation and Development OECD Fact Book – 2012: a global overview of today’s major economic, social and environmental indicators
http://stats.oecd.org/BrandedView.aspx?oecd_bv_id=factbook-data-en&doi=data-00589-en http://stats.oecd.org/index.aspx?lang=en#

32 | P a g e
OECD.Stat includes data and metadata for OECD countries and selected non-member economies UN Statistical Database Variety of global statistical data
http://unstats.un.org/unsd/databases.htm
World Bank National and international data & research
http://www.worldbank.org/
GOVERNMENT SPENDING
Canada - Department of Finance Information on government spending and revenue performance, as well as an analysis of the factors affecting these results.
http://www.fin.gc.ca/pub/index-eng.asp
HOUSING Canadian Mortgage and Housing Corporation (CMHC) Free and priced reports on housing market (purchased and rental) and other housing research. Can sign up for FREE email notification of various reports.
www.cmhc.ca HOUSING MARKET INFO: http://www.cmhc.ca/en/hoficlincl/homain/index.cfm
INFORMATION & TECHNOLOGY
Industry Canada Industry specific information on Canadian Business. Information & Communications Technologies
http://www.ic.gc.ca/eic/site/ic1.nsf/eng/h_00066.html http://www.ic.gc.ca/eic/site/ict-tic.nsf/eng/h_it06143.html
Name Info Website Address NATURAL RESOURCES
Ministry of Natural Resources Stats and information on natural resources in Canada Earth Sciences Energy Forests Minerals & Metals
http://www.nrcan.gc.ca/home http://www.nrcan.gc.ca/earth-sciences/home http://www.nrcan.gc.ca/energy/home http://cfs.nrcan.gc.ca/ http://www.nrcan.gc.ca/minerals-metals/home
RETAIL PRICE Consumer Price Index A descriptive summary of retail price movements, inflation rates and the factors underlying them.
http://www.statcan.gc.ca/bsolc/olc-cel/olc-cel?lang=eng&catno=62-001-XWE
TOURISM Canadian Tourism Commission Information on data, market intelligence, industry analysis and e-business initiatives related to the Tourism market in Canada.
http://en-corporate.canada.travel/research
Canadian Tourism Human Resource http://cthrc.ca/en/research_publications

33 | P a g e
Council Research & publications about tourism jobs and the people who work in the tourism sector. FedNor – Industry Canada Report: Tourism in Northern Ontario 2006-2007
http://www.ic.gc.ca/eic/site/ic1.nsf/eng/05319.html
Ontario Ministry of Tourism Market reports, medium-term forecasts, Economic impact studies, Newsletters (quarterly and monthly), Seasonal travel intentions, Historical statistics, Performance indicators, Resources that include maps, definitions and questionnaires Regional Tourism Profile - 2009
http://www.mtc.gov.on.ca/en/tourism/research.shtml http://www.mtc.gov.on.ca/en/research/rtp/2009/CMA580/index.htm
TRANSPORTATION
Ontario Ministry of Transportation Information on transportation in Ontario Traffic Volumes – Provincial Highways 1988-2008
http://www.mto.gov.on.ca http://www.mto.gov.on.ca/english/pubs/trafficvolumes.shtml
Transport Canada Information on transportation in Canada
http://www.tc.gc.ca/eng/research-menu.htm
UNITED STATES FedStats Access official U.S. government statistics
http://www.fedstats.gov/cgi-bin/A2Z.cgi
US Census Bureau Get a snapshot of the most recent economic indicators published by the U.S. Census Bureau, including data on trade, manufacturing, spending and housing
http://www.census.gov/cgi-bin/briefroom/BriefRm
US Department of Commerce – Bureau of Economic Analysis U.S. economy using data produced by the Bureau of Economic Analysis
http://www.bea.gov/newsreleases/glance.htm
UNITED STATES - LABOUR
US Department of Labour – Foreign Labour Trends View labor market information, such as recent labor developments in key foreign countries, as offered by the United States Department of Labor
http://www.dol.gov/ilab/media/reports/flt/main.htm

34 | P a g e
USEFUL INTERNET SITES
General Information
Regional Business Centre www.regionalbusiness.ca Regional Business Centre – Market Research Guide (Resource List)
Canada Business www.canadabusiness.ca
Market Research
Canada 411 Directory www.canada411.ca CHMC- Canada Mortgage and Housing Corporation www.cmhc-schl.gc.ca City of Greater Sudbury – Key Facts www.greatersudbury.ca/keyfacts Downtown Village Development Corporation http://www.dvdcsudbury.ca/ Esource Suppliers Directory www.esourcecanada.com Frasers www.frasers.com Greater Sudbury Development Corporation www.mysudbury.ca/invest Industry Canada www.ic.gc.ca Industry Canada Benchmarking Tool search “SME Benchmarking Tool” www.strategis.ic.gc.ca
Labour Market Information www.labourmarketinformation.ca Statistics Canada www.statcan.gc.ca Sudbury & Manitoulin Workforce Planning Board www.planningourworkforce.ca Others
Provincial: www.ontario.ca Ministry of Economic Development & Innovation www.ontariocanada.com Ministry of Finance www.fin.gov.on.ca Ministry of Revenue www.rev.gov.on.ca Northern Ontario Heritage Fund Corporation www.nohfc.com E-laws www.e-laws.gov.on.ca Federal: www.canada.gc.ca Service Canada www.servicecanada.gc.ca Canada Revenue Agency (GST, payroll, etc.) www.cra-arc.gc.ca Canadian Intellectual Property Office (patents, trademarks, etc.) www.cipo.ic.gc.ca
Canadian Boarder Services Agency (Import, Export) www.cbsa.gc.ca Industry Canada www.ic.gc.ca FedNor- Industry Canada www.fednor.ic.gc.ca

35 | P a g e

Thank you to our partnersMerci à nos partenaires