Embed Size (px)
Citation preview

1
RESEARCH PROGRAMME
BELGIAN SCIENCE POLICY
Bilateral Cooperation
Bilateral Agreement with Vietnam
FINAL ACTIVITY REPORT
Proposal’s title:
Production of chitin and chitosan oligomers and their use as bioprotective agents in vegetable
cultivation
Proposal’s acronym:
CHITOLIGOS
Contract no:
BL/12/V23
For the PARTNERSHIP: the coordinator
Professor Jacques DOMMES
DATE: 31/01/2013

2
ADMINISTRATIVE REPORT
For partner 1, University of Liège (Belgium):
Modifications to the contract: avenant n°1 (24/10/2010) ; avenant n°2 (28/03/2012).
List of personnel working on the project (in charge of the project or not):
Personnel working on the project, funded by the budget:
DETHIER François
15/10/2010 – 14/10/2011
Phone : 04/366 38 82
Email : [email protected]
Personnel working on the project, not funded by the budget :
DOMMES Jacques
Phone : 04/366 38 99
Email : [email protected]
VERSALI Marie-France
Phone : 04/366 38 74
Email : [email protected]
CLERISSE Fabienne
Phone : 04/366 38 73
Email : [email protected]
Overview of performed tasks regarding each workpackage:
WP1: Project coordination and management ULG missions in Vietnam : May 2010 ; April 2011 ; May 2012 Belspo meeting : 05/17/2012 Workshop in Hanoi : 05/08/2012 Training Vietnamese staff : Sept – Nov 2010 ; Sept – Dec 2011. Writing protocols and transfer to the Vietnamese partner Writing reports
WP2: Screening of the Vietnam Type Culture collection for micro-organisms secreting chitinases or chitin deacetylases Screening of Actinomyces and Fungi strains for chitinase and chitin deacetylase activity Identification of best producers Systematic determination of best producer strains WP3: Development of microbial preparations with high chitinase activity or high chitin
deacetylase activity

3
Analysis of chitinase and chitin deacetylase activities from native Vietnamese Streptomyces and fungal strains Analysis of chitinase and chitin deacetylase activities from native or recombinant Pichia strains Development of fermentation conditions of best producers Chitinase and chitin deacetylase purification
WP4: Decalcification and deproteinisation of shrimp shells
Chitin purification from Vietnamese shrimp shells and from squid pen (β-chitin) Evaluation of method efficiency and yield WP5: Preparation of chitin and chitosan oligomers Test and comparison of various enzyme (specific and non-specific) activities for chitin and chitosan oligomer production WP6: Characterization of produced oligomers Separation and analysis of polymerization degree (TLC and HPLC techniques) Molecular weight analysis by viscosity method Deacetylation/Acetylation measure through different methods WP7:Determination of biological activity in planta
Evaluation of fungicide activity through in vitro bioassays using Botrytis cinerea as pathogen
Evaluation of protective effect on vegetables infected with different pathogens
List of field missions (dates, location, objectifs/resulst):
• 07/05 – 14/05/2010 ; Institute of Microbiology and Biotechnology, Vietnam National University, Hanoi (Vietnam).
Objectives: preliminary contacts with the staff people from the Institute of Microbiology and Biotechnology (Hanoi) ; exchange of scientific information and literature ; transfer of technical and scientific know how ; demonstration and explanation of some analytical methods and protocols.
• 06/04 – 14/04/2011 ; Institute of Microbiology and Biotechnology, Vietnam National University, Hanoi (Vietnam).
Objectives : discussion with the Vietnamese scientific staff and evaluation of project progress ; discussion about the scientific and technical program to be carried out by Vietnamese scientists in Liege ; exchange of scientific information and literature and transfer of technical and scientific know how ; demonstration and explanation of some analytical methods and protocols.
• 17/05/2012 : Vietnam R&D cooperation – Progress meeting organized by Belspo (Brussels)
Communication : Production of chitin and chitosan oligomers and their use as bioprotective agents in vegetable cultivation
• 05/05 – 13/05/2012 : Institute of Microbiology and Biotechnology, Vietnam National University, Hanoi (Vietnam).
Objectives : discussion with the Vietnamese scientific staff and evaluation of project progress ; exchange of scientific information and literature, and transfer of technical and scientific know how ; Workshop on “Chitin and Chitosan Study and Applications” ; visit of a company producing chitin, chitosan and glucosamine (Suntze Lifescience Co., Ltd, Can Tho).

4
SCIENTIFIC REPORT
Period : 01/12/2009 – 30/11/2012
INTRODUCTION
Vietnam is now being considered as an emerging country and the number of inhabitants is increasing rapidly. This high rate of development has however some negative consequences, more especially in rural zones where there are more and more problems of poverty. Farmers are facing the biggest difficulties and they still represent today 60% of the total population.
Rather than focusing on the production of a single staple crop (rice), the production of high quality vegetables would offer these farmers a more appropriate income. This could improve their socio-economical situation in a durable way. Many problems are linked to inappropriate use of chemical pesticides. The vegetables on the market are often contaminated with high levels of pesticides considered as very toxic to humans.
The objective of this project was to develop an alternative range of natural low cost pesticides based on mixtures of chitin and/or chitosan oligomers produced from shrimp shells. These materials are indeed already known as being able to induce systemic defence reactions in plants. It was proposed to develop a process to produce mixtures of chitin/chitosan oligomers using enzymes purified from micro-organisms selected in the Vietnam Type Culture Collection held by the Vietnamese partner. The substrate was waste products from local shrimp production industry. Shrimp shells was treated to obtain a preparation enriched in chitin. The biological activity of oligomers obtained by enzymatic hydrolysis of chitinous substrate was evaluated on a model system involving tomato plants and fungal pathogens. Preliminary tests were also carried out in fields to evaluate the capacity of oligomers to protect vegetables.
RESULTS
WP1 : Project coordination and management
ULg partner was the project coordinator. The coordinator established a system of periodic exchange of news about the progress of the project. At the beginning of each month, both partners exchanged by email a short progress report.
ULg experts (2) carried out 3 missions in Vietnam: 05/07 – 05/14/2010 ; 04/06 – 04/14/2011 ; 05/05 – 05/13/2012. The aims of these missions were: discussion with the staff from the Institute of Microbiology and Biotechnology (Hanoi) about the progresses of the project; exchange of scientific information and literature; transfer of technical and scientific knowhow; demonstration and explanation of some analytical methods and protocols. During the third mission, a workshop was organized on “Chitin and Chitosan Study and Applications”. The workshop was held on May 8, 2012 in Hanoi. This meeting brought together around 40 scientists and representatives of the Vietnam Ministry of Science and Technology.
The results presented during this workshop summarized the major research advancements of the project. The slides of the communications are attached to this report. The program is detailed below.

5
Programm of Joint Workshop between the Institute of Microbiology and Biotechnology,
Vietnam National University (Hanoi, Vietnam) and the Plant Molecular and
Biotechnology Unit, University of Liège (Belgium).
9.00-9.05 Welcome address
Director of IMBT
9.05-9.20 Overview of the project
Assoc. Prof. Duong Van Hop (IMBT)
9.20-9.35 Screening, optimizing the culture conditions for the production of chitinases from fungi isolated in Vietnam Collection and purification of these chitinases
Msc. Le Thi Hoang Yen (IMBT)
9.35-9.50 Phenotypic and genotypic characteristics of chitin deacetylase and chitinase produced by Streptomyces xylophagus I2
Dr. Dao Thi Luong (IMBT)
9.50-10.10 Chitin and chitosan oligomers as biocontrol agents
Prof. J. Dommes and Dr. M.F. Versali (ULG)
10.10-10.30 The fermentation and technology laboratory
Dr. Phi Quyet Tien (invited scientist from the Institute of Biotechnology, VAST, Hanoi)
10.30-11.0 Coffe break
11.00-11.15 Recovery of chitin and chitosan from shrimp waste by chemical methods
Mr. Mguyen Anh Tuan (IMBT)
11.15-11.45 Oligomer characterization and biological activities
Prof. J. Dommes and Dr. M.F. Versali (ULG).
11.45-13.00 General discussion
WP2: Screening of the Vietnam Type Culture Collection for micro-organisms secreting
chitinases or chitin deacetylases
A total of 1246 Actinomycetes strains and 1100 fungal strains from VTCC were subjected to the screening.
Chitinase The first screening was based on agar plate medium containing chitin for detecting good chitinase producers. All the cultures were grown on appropriate liquid media* at 30°C with orbital shaking at 150 rpm during 4 days. Culture supernatants were collected by centrifugation and 50 µl of each supernatant were used for chitinase activity test on agar plate containing 0.1% chitin. The samples were put into wells made in agar plates, kept at 4°C for 4 h, incubated at 40°C for 3h and then stained with red Congo 1% to visualize clearing zones (fig. 1). The diameter of clear zones was measured for rating the chitinase activity.

6
A second screening was done to confirm the first selection. The experiment was performed in the same conditions as described above. The final selection was based on the determination of N-acetyl glucosamine and/or of reducing ends released during the incubation of samples with chitin substrate. * Culture media
+ For chitinase production from Actinomyces: Liquid culture: 0.3% colloidal chitin, 0.1% NaNO3, 0.1% K2HPO4, 0.1% KCl, 0.005% MgSO4, 0.005% yeast extract, 1% glucose . Solid cultures: 20 Rice brand and husk (2:1 ratio) and 1 gram chitin are moistened with 25 ml salt solution (% w/v): KH2PO4 (0.1%) ; MgSO4x7H2O (0.05%) ; Urea (0.3%) ; FeSO4.7H2O (0.005% ); Colloidal chitin (2%). + For chitinase production from Fungi: Liquid culture : 1% colloidal chitin, 0.1% K2HPO4, 0.3% urea:, 0.05% MgSO4, 0.005% FeSO4, 0.005% Yeast extract, 0.5%glucose .
Solid cultures: 20 Rice brand and husk (2:1 ratio) and 1 gram chitin are moistened with 25 ml salt solution(%, w/v): 0.1% NaNO3 ; 0.5% KNO3 ; 0.5% (NH4)2SO4 ; 0.1% MgSO4.7H2O ; 0.1% NaCl and 0.1% (v/v) trace element solution containing (%,w/v) 0.8 % MnSO4, 0.17% ZnSO4.7H2O and 0.25% FeSO4.7H2O.
After screening, we identified 82 Actinomyces strains and 184 Fungi strains (fig. 2) showing chitinase activity (around 15-35 U/ml in Actinomyces and 30-50 U/ml in Fungi).
Fig. 2. Example of Fungi strains showing chitinase activity (culture on solid medium)
Fig. 1. Screening of chitinolytic strains on agar medium containing chitin and stained with red
Congo.

7
Additional analysis was then carried out to identify best chitinase producers.
We selected 2 Actinomyces strains, VN08-5085 and VN06-0233, and 2 Fungi strains, VN10-1109 and VN09-0060, that exhibited high chitinolytic activity (table I and fig. 3).
Strain Chitinase activity
(U/mL)
Actinomyces
VN08-5085 48
VN06-0233 46
Fungi
VN10-1103 40
VN09-0060 42
As VN06-0233 strain (also named I2 strain) exhibited high chitinase activity in conjunction with high CDA activity (see below), this strain was selected for the production of both enzymes. Analysis of this strain will be presented later.
VN10-1103 and VN09-0060 fungal strains, and Streptomyces VN08-5085 were selected as high chitinase producers. The three strains were taxonomically identified on the basis of morphological observations of spores and colonies (fig. 4 A and B ; fig. 5 A and B), and of the 16S rDNA gene sequencing and the comparison of the partial D1-D2 regions. Sequences
Table I. Chitinase activity measured in the culture supernatant of Actinomyces and Fungi strains
Fig. 3. Zymogram in native conditions (10% acrylamide gel ; 0.05% glycolchitin ; coloration with calcofluor ; visualization under UV illumination). 1: VN08-5085 cultivated in YG medium ; 2: VN08-5085 in S1 medium ; 3: VN08-5085 in S2 medium ; 4: VN06-0233 cultivated in YG medium ; 5: VN06-0233 in S1 medium ; 6: VN06-0233 in S2 medium → : chitinase
YG medium: 1% glucose ; 1% yeast extract S1 medium: 5% peptone ; 1% yeast extract ; 0.5% chitin ; 1% K2HPO4 ; 0.2% MgSO4 S2 medium: 0.2% CaCO3 ; 0.2% NH4SO4 ; 0.1% K2HPO4; 0.1% MgSO4; 0.1% NaCl ; 0.5% chitin
1 2 3 4 5 6

8
were aligned with reference sequences of related species by using the CLUSTAL X computer program1 and used to construct a phylogenetic tree (fig. 6, 7 and 8).
Fig.4. Colony (A) and spores (B) of VN10-1103 strain.
1 Thompson et al. (1997). The CLUSTAL_X windows interface: flexible strategies for multiple sequence alignment aided by quality analysis tolls. Nucleic Acids Res., 25, 4876-4882.
A B
A B

9
Fig.5. Colony (A) and spores (B) of VN08-5085 strain.
Fig. 6. Phylogenetic tree inferred from the analysis of D1-D2 region sequences in 16S rDNA of the VN09-0060 strain. The tree is rooted with Aspergillus niger. Bootstrap values of these data based on
1000 replications are shown at the internal nodes. The scale bar indicated the distance that corresponds to 0.02 sequence divergences.
Fig. 7. Phylogenetic tree inferred from the analysis of D1-D2 region sequences in 16S rDNA of the VN10-1103 strain. The tree is rooted with Aspergillus ibericus. Bootstrap values of these data based

10
on 1000 replications are shown at the internal nodes. The scale bar indicated the distance that corresponds to 0.05 sequence divergences.
Fig. 8. Phylogenetic tree inferred from the analysis of D1-D2 region sequences in 16S rDNA of the VN08-5085 strain. Bootstrap values of these data based on 1000 replications are shown at the internal
nodes. The scale bar indicated the distance that corresponds to 0.01 sequence divergences.
The culture of VN08-5085 strain on different carbon sources was also analyzed. The strain formed abundant mycelium on medium containing D-fructose, D-glucose, D-xylose, D-mannitol, L-rhamnose or inositol. No growth was observed with other carbon sources as D-raffinose, ribose, D-sorbitol, sucrose, lactose, melibiose, maltose, etc. The best culture conditions are pH 6-7, 30-35°C and NaCl 1-2% max.
On the basis of all these observations, the strain VN09-0060 was proposed as belonging to the species Trichoderma reesei, the strain VN10-1103 to Beauvaria bassiana and the strain VN08-5085 to Streptomyces chromofuscus.
.
Chitin deacetylase (CDA)
The coordinator laboratory developed strains and methods for the production and purification of recombinant CDA in the methylotrophic yeast Pichia pastoris
2. The produced CDA is a poly-His tagged protein that can be purified through IMAC (fig. 9). This protein was characterized :
• Optimum pH: 6 2 Jaspar-Versali M. F. & Clérisse F. (1998). Expression and characterization of recombinant chitin deacetylase, in: A. Domard (Ed.), Advances in Chitin Sciences, 7th ICCC, pp. 273-278 ; Gauthier C. et al. (2008). Characterization and cloning of chitin deacetylases from Rhizopus circinans. Protein Expression and Purification, 59, 127-137.
VN08-5085

• Optimum temperature: 37°C
• Good thermal and pH stability
• Strongly inhibited by Cu
• High activity on glycolchitin (100%), fungal chitosan (78%), shrimp chitosan (83%), partially deacetylated chitin (77%) and chitohexaose (120%).
Vietnamese strains were screened to identify native CDA. measure of released acetate during enzymatic incubation with glycolchitin as substrateusing Bergmeyer assay3 via 3 coupl
Among all tested strains, Actinomycete
CDA production was analyzed in liquid and in solid cultureproduction of the Pichia pastoris
production by I2 strain is ~ 250 mU/mL what is recombinant strain (~ 210 mU/mL). On solid medium, the CDA production by I2 strain reached ~ 1100 mU/g.
Considering the high production ofanalysis and tests with this Actinomycete
Taxonomic determination of this strain was carried out observations (fig. 10 A and B) and 16S rDNA sequencing (fig.
Fig.
3 Bergmeyer, H.U. (1974). In: Methods of Enzymatic Analysis
Weinheim/Academic Press, Inc. New York and London.
11
: 37°C
Good thermal and pH stability
ted by Cu2+
High activity on glycolchitin (100%), fungal chitosan (78%), shrimp chitosan (83%), partially deacetylated chitin (77%) and chitohexaose (120%).
Vietnamese strains were screened to identify native CDA. The screening was based on the e of released acetate during enzymatic incubation with glycolchitin as substrate
via 3 coupled enzymatic reactions or using HPLC method.
Actinomycete I2 strain was selected for its high CDA activity.CDA production was analyzed in liquid and in solid culture, and compared with the
Pichia pastoris strain expressing recombinant CDA. In liquid is ~ 250 mU/mL what is slightly higher than in P. pa
recombinant strain (~ 210 mU/mL). On solid medium, the CDA production by I2 strain
Considering the high production of native chitinase and CDA, it was decided to continue Actinomycete I2 strain.
nomic determination of this strain was carried out on the basis of morphological A and B) and 16S rDNA sequencing (fig. 11).
Fig. 10. Colony (A) and spores of I2 strain
Methods of Enzymatic Analysis, 2nd ed., vol. 1, pp. 112-117. Verlag Chemie,
New York and London.
A
Fig. 9. Purified recombinant CDA after SDSacrylamide). (a) Protein bands visualized by staining with silver nitrate. Lane 1: molecular marker ; lane 2: crude supernatant ; lanfraction ; lane 4: elution fraction (b) Immunodetection of purified recombinant CDA on a Western
blot with anti-his antibodies
High activity on glycolchitin (100%), fungal chitosan (78%), shrimp chitosan (83%),
The screening was based on the e of released acetate during enzymatic incubation with glycolchitin as substrate, either
HPLC method.
high CDA activity. The , and compared with the
liquid culture, the P. pastoris
recombinant strain (~ 210 mU/mL). On solid medium, the CDA production by I2 strain
t was decided to continue
on the basis of morphological
117. Verlag Chemie,
B
Purified recombinant CDA after SDS-PAGE (10%
(a) Protein bands visualized by staining with silver nitrate. Lane 1: molecular marker ; lane 2: crude supernatant ; lane 3: flow-through
(b) Immunodetection of purified recombinant CDA on a Western

12
Fig. 11. Phylogenetic tree inferred from the analysis of D1-D2 region sequences in 16S rDNA of the I2 strain. Bootstrap values of these data based on 1000 replications are shown at the internal nodes.
The scale bar indicated the distance that corresponds to 0.005 sequence divergences.
This strain was also characterized for some physiological and biochemical properties (table II).
Characteristics Characteristics
Aerial mycelium colour Light grey Carbohydrate sources
Substrate mycelium colour
Light yellowish brown
• D-glucose +
Spore chain morphology Spiral, 10-30 spores
• D-cellobiose +
Culture conditions • D-fructose +
• pH 6-8 • D-mannitol +
• temperature 18-32 • D-xylose +
• NaCl (%) 0-5 • Myo-inositol +
Melanoid pigment - • L-arabinose +
• Rhamnose +
• Raffinose -
• Sucrose -
• Ribose -
• D-salicin -
Kitasatosporia setalba_U93332
Streptomyces coelicolor_ AB184196
Streptomyces sampsonii_D63871
Streptomyces thermocarboxydus_ U94490
I2
Streptomyces xylophagus_ AB184526
Streptomyces althioticus_ AY999808
100
Streptomyces matensis_AB184221
71
Streptomyces collinus_AB184123
Streptomyces ambofaciens_ AB184182
Streptomyces griseoflavus_ AJ781322
Streptomyces griseorubens_ AB184139
64
61
Streptomyces tendae_D63873
Streptomyces violaceorubidus_ AJ781374
Streptomyces eurythermus_D63870
100
69
60
88
57
Streptomyces paradoxus_ AB184628
50
Streptomyces glaucescens_ AB184843
55
Streptomyces caelestis_X80824
Streptomyces lavendulocolor_DQ442516
Streptomyces cellulosae_DQ442495
Streptomyces capillispiralis_ AB184577
Streptomyces gancidicus_AB184660
Streptomyces rubiginosus_AY999810
Streptomyces pseudogriseolus_ DQ442541 775665
5651
58
79
54
100
67
0.005
13
• D-sorbitol -
• D-trehalose -
• Melibiose -
• Lactose -
• Maltose -
• Sodium acetate -
Table II. Morphological, physiological end biochemical characteristics of Actinomycete I2 strain
On the basis of all these observations, the I2 strain was identified as belonging to the species Streptomyces xylophagus.
WP3: Development of microbial preparations with high chitinase activity or high chitin
deacetylase activity Chitinase 3 strains were analyzed for their high capacity of chitinase production: T. reesei (VN09-0060), B. bassiana (VN10-1103 strain) and S. chromofuscus (VN08-5085).
• T. reesei
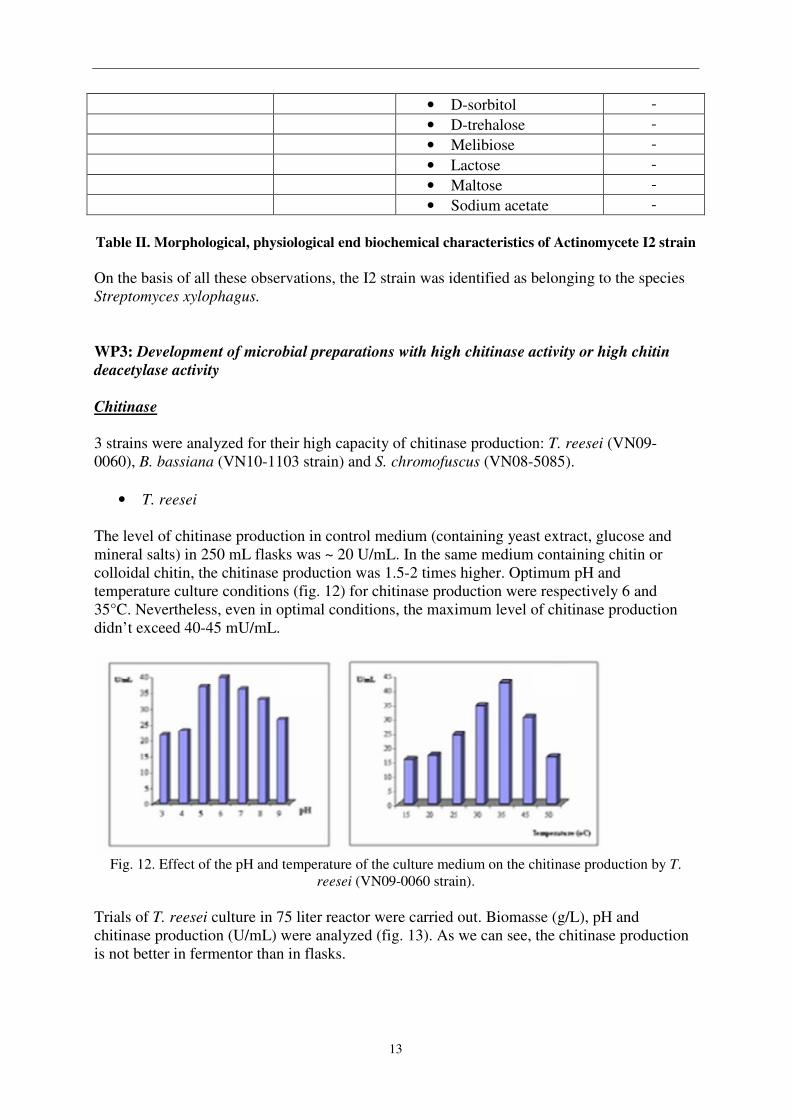
The level of chitinase production in control medium (containing yeast extract, glucose and mineral salts) in 250 mL flasks was ~ 20 U/mL. In the same medium containing chitin or colloidal chitin, the chitinase production was 1.5-2 times higher. Optimum pH and temperature culture conditions (fig. 12) for chitinase production were respectively 6 and 35°C. Nevertheless, even in optimal conditions, the maximum level of chitinase production didn’t exceed 40-45 mU/mL.
Fig. 12. Effect of the pH and temperature of the culture medium on the chitinase production by T.
reesei (VN09-0060 strain).
Trials of T. reesei culture in 75 liter reactor were carried out. Biomasse (g/L), pH and chitinase production (U/mL) were analyzed (fig. 13). As we can see, the chitinase production is not better in fermentor than in flasks.

14
Fig. 13. Time course of chitinase production by T. reesei in pilot scale (75 liter fermentor)
• B. bassiana
We analyzed the medium composition and conditions of culture of B. bassiana (VN10-1103 strain), in 250 mL flasks, to optimize the chitinase production (Fig. 14 A-B-C-D).
Fig. 14. Time course of chitinase production by B. bassiana in different culture conditions. A:
Temperature ; B: pH ; C: carbon and nitrogen sources (chitin, chitosan, colloidal chitin, GlcNAc,
-1
0
1
2
3
4
5
6
7
8
0 2 4 6 8 10
Biomasse (g/L)
pH
Chitinase (10 U/mL)
A B
C D

15
carboxymethyl cellulose, soluble starch, sucrose, glucose, fructose) ; D: time course of chitinase production in optimal culture conditions
Optimal culture conditions for chitinase production were selected:
• Medium composition: 4 g/l yeast extract ; 6 g/l chitin ; 2 g/l NaNO3 ; 1 g/l KH2PO4 ; 0.5 g/l MgSO4·7H2O ; 0.5 g/l KCl ; 0.01 g/l FeSO4·7H2O ; 3 g/l sucrose.
• Temperature: 25°C ; pH : 7
• Time course: 7 days. In these optimal conditions, the chitinase level production reached ~ 60 U/ml in 250 ml flasks containing 50 ml medium. Cultures were also run in 75 l fermentor using the same medium and conditions (fig. 15). Under these conditions, the chitinase production reached ~ 65 U/ml.
Fig. 15. Time course of chitinase production by B. bassiana in 75 liter reactor
This chitinase was purified on CM-Sepharose after ultrafiltration (10 kd cut off) of the crude culture supernatant (table III).
Purification
steps
Total
protein (mg)
Total
chitinase (U)
Specific
activity
(U/mg
protein)
Purification
Yield (%)
Fold
purification
Crude supernatant
29.2 1815 62.2 100 1
Ultrafiltration (10 kD cut off)
28.7 1782 62.1 98.2 1
CM-Sepharose
2.2 1945 884.1 100 14
Table II. Purification of chitinase
The samples were analyzed on SDS-PAGE (fig. 16)
0
1
2
3
4
5
6
7
1 2 3 4 5 6 7 8 9
Carbon source (g/l)
pH
Biomasse (g/l)
Chitinase (10 U/ml)
Time course (days)

16
After CM-Sepharose, the chitinase appeared pure to homogeneity and it exhibited an apparent molecular weight of 45 kDa.
The purified chitinase was then characterized for the optimal pH and temperature, and the stability (fig 17 A-B-C-D).
Fig. 17. Effect of pH and temperature on B. bassiana chitinase activity (A-B) and stability (C-D).
The purified chitinase showed optimal activity at pH5.5 and 50°C. Residual activity was assayed after incubation for 10 – 60 min at different temperatures or pH values. We observed that the chitinase didn’t display good thermal and pH stability except at pH 5.0.
As the process of oligosaccharide production by enzymatic way doesn’t need purified enzymes we decided to use crude supernatant just filtered and dried. The yield of this chitinase process was evaluated after production in 75 l fermentor (table III).
0
50
100
150
30 40 50 60 70Re
lati
ve
act
ivit
y (
%)
Température (°C)
0
50
100
150
3 5 7Re
lati
ve
act
ivit
y (
%)
pH
0
50
100
150
0 50 100Re
sid
ua
l a
ctiv
ity
(%
)
Time (h)
40°C
50°C
60°C
70°C0
50
100
150
0 50 100Re
sid
ua
l a
ctiv
ity
(%
)
Time (h)
pH5
pH6
pH7
pH8
66000 Da
45000 Da
24000 Da
18400 Da
14300 Da
1 2 3 4
Fig. 16. Purified B. bassiana chitinase after SDS-PAGE: lane 1, MW ; lane 2, crude supernatant ; lane 3, CM-Sepharose after semi-denaturing zymogram: lane 4, purified chitinase after CM-Sepharose
→ : chitinase
A B
C D

17
Steps Volume (l) Chitinase
(U/ml)
Total chitinase
(103
U)
Recovery yield
(%)
Crude supernatant (after centrifugation)
46
61
2806
100
Ultrafiltration (300 kD cut off)
45 56 2520 90
Ultrafiltration (cut off 10 kD)
3.2 720 2304 82
Addition of a carrier* and drying at 40°C
3 kg
645 U/g
1935
69
Table III. Process of chitinase production. *Fine rice bran powder was used as carrier during the drying of chitinase
• S. chromofuscus
The production of chitinase by S. chromofuscus (VN08-A0438) was analyzed. The study focused on the following growth parameters: temperature, pH, culture aeration, culture time, and carbon and nitrogen sources. All experiments were performed in 250 ml flasks containing 50 ml of medium. After inoculation, the cultures were shaken at 150 rpm, 30°C for 5 days. In these experiments, a basal mineral medium was used: yeast extract 0.5 g/ l; KH2PO4 1g/l ; KCl 0,5g/l. The sources of carbon and nitrogen were added as indicated in the table IV below.
Carbon source
Nitrogen source
Glucose (3g/l) Chitin (2g/l) Glucose (1g)
Colloidal chitin (3g/l)
Pepton (3g/l) Medium 1
Medium 2
Medium 3
(NH4)2SO4 (1g/l)
Medium 4
Medium 5
Medium 6
KNO3 (0.7g/l)
Medium 7
Medium 8
Medium 9
Table IV. Composition of media used for the culture of VN08-A0438 strain and the production of chitinase
Chitinase activity was measured in the culture supernatant and the results obtained in the different media are shown in figure 18.

18
Fig. 18. Chitinase activity measured in the culture supernatant of S. chromofuscus cultivated in
media containing different sources of carbon and nitrogen.
From these results, we can conclude that: 1. The highest chitinase activity (42 U/ml) was obtained in the medium 3 containing
peptone and colloidal chitin 2. Pepton (media 1, 2 and 3) was the best nitrogen source and colloidal chitin (medium
3) the best carbon source to obtain high chitinase activity in the culture supernatant.
The study of culture parameters (temperature, pH, time, etc) showed that the best conditions to obtain high production of chitinase are the following: 30°C; pH 7.0; 3% inoculum; fermentation time of 6 days. Nevertheless the maximum level of chitinase production didn’t exceed 40-45 U/ml which is lower than the production by B. bassiana. A culture was run in a 5 litre fermenter (Sartorius) containing 3.5 litres of the medium 3 (see above) in the optimal conditions. The fermentation was run at an aeration rate of ~ 1 v/v and an agitation speed of 150 rpm. During the fermentation the time course of total carbon level (measured as reducing sugars), biomass (dry), pH and chitinase activity were assayed. The results are shown in figure 19.
Fig. 19. Kinetics of strain VNA08-438 fermentation.
0
1
2
3
4
5
6
7
8
1 2 3 4 5 6 7 8 9
Tim course x12 hrs
Va
lue
s o
f s
eri
es
32 36
42
2428
30
17
23 25
0
5
10
15
20
25
30
35
40
45
50
1 2 3 4 5 6 7 8 9
Medium No
Chitinase activity (U/ml)
Carbon source (g/l)
pH
Biomasse (g/l)
Chitinase (10 U/ml)

We observed that the biomass and the chitinase acvalue was reached after 5 days with values of 5g/l for dried biomass and chitinase activity which is still The chitinase from S. chromofuscus
and then characterized (fig. 21
Table V. Purification of
Fig. 20. Chromatogram of chitinase purification on Sephadex G150 (A) and
19
that the biomass and the chitinase activity increased in parallel. value was reached after 5 days with values of 5g/l for dried biomass and ~ 44 U/ ml for
ty which is still lower than the chitinase production by B. bassiana
S. chromofuscus was purified nearly to homogeneity (table 21).
Table V. Purification of S. chromofuscus
chitinase purification on Sephadex G150 (A) and SDS
B
tivity increased in parallel. The maximum 44 U/ ml for
B. bassiana.
to homogeneity (table V and fig. 20)
SDS-Page analysis (B)
chitinase

20
Fig. 21. Effect of temperature and pH on S. chromofuscus chitinase activity (A-C) and stability (B-D)
The purified chitinase showed optimal activity at pH 5.0-5.5 and 50-55°C. Residual activity was assayed after incubation for 30 min at different temperatures or pH values. We observed that the chitinase didn’t display good thermal and pH stability except at pH 5.0.
Chitin deacetylase (CDA) S. xylophagus (I2 strain) was selected as a good producer of chitinase and CDA. This last observation is very interesting because this is the first time to our knowledge that the presence of CDA in Streptomyces was reported.
The level of chitinase and CDA production by S. xylophagus in different solid media was compared (fig. 22).

21
We observed that, in media containing chitin, the production of CDA is higher reaching a level of ~ 170 mU/g as for example in the medium “rice bran + chitin”. In the same medium, the production of chitinase is also highest: ~ 100 U/g.
The conditions for CDA production in liquid or solid fermentation were optimized and in these conditions, the level of CDA reached 400 mU/ml in liquid culture and 2700 mU/g in solid culture. This last process was selected and tested at a pilot scale.
The pilot trial was carried out as follow: 10 bags of 3 kg medium (total 30 kg) inoculated with S. xylophagus spores and cultivated at 30°C during 96 h (fig. 23).
Fig. 23. Solid fermentation (in bags) of S. xylophagus strain for CDA production
After fermentation, 60 l of deionized water were added to the culture. The whole was well mixed at 4°C during 4-6 h, then centrifuged and filtrated. The yield of CDA production by solid fermentation is summarized in table VI.
Steps Volume (l) CDA activity
(U/ml)
Total CDA
activity (103 U)
Recovery yield
Crude CDA extracted from solid fermentation
55
1.4
77
100
Fig. 22. Production of chitinase and CDA by S. xylophagus in media containing different
substrates

22
Ultrafiltration (cut off 300 kD)
54.5
1.3
70.85
92
Ultrafiltration (cut off 10 kD) and concentration
2
27
54
70
Table VI. Process of CDA production by solid fermentation of S. xylophagus
The proposed process is simple and efficient for the production of CDA. After concentration, the enzyme can be kept at 4°C. WP4 : Decalcification and deproteinisation of shrimp shells
Aquaculture and shrimp farming are in development in Vietnam. Between January and September 2012, total shrimp exports from Vietnam reached more than USD 1.63 billion (EUR 1.3 billion), dropping 3.9 percent from the same time period in 2011. In 2010, Vietnam exported nearly 241.000 metric tons of shrimp. Commercial processing of shrimps requires the removal of heads and exoskeletons that can be exploited to extract chitin, chitosan, glucosamine, pigments, enzymes, etc.
Our objective here was to develop a simple process to remove calcium minerals and proteins from shrimp shells in order to obtain chitin. The treatment was the following:
• Drying the shrimp shells
• Decalcification in 1N HCl, with agitation, during 24-36 h
• Washing in water until neutrality
• Deproteinisation in 1N NaOH at 100°C during 6 h ; washing ; eventually a second treatment in 1N NaOH at 100°C during 4 h ; washing until neutrality
• Drying chitin The obtained material is white – slightly yellow and it does not require bleaching treatment. After that, chitin can be used for the production of oligomers by enzymatic process or for the production of high molecular weight chitosan by chemical deacetylation (in presence of concentrated NaOH at high temperature). The result is shown in fig. 24.
Fig. 24. Shrimp shells (A), purified chitin (B) and chitosan (C) from shrimp shells
A B C

23
The yield of chitin extraction from shrimp shells is ~ 10-14% of the total dry weight.
Chitin produced from Vietnamese shrimp shells was used for high MW chitosan preparation. Different conditions (NaOH concentration, temperature, time) were applied and the obtained chitosans were characterized (table VII) for their deacetylation degree4 (DDA %) and viscosity (in °Engler5). This last parameter depends on the size of the dissolved polymer and thus provides an indirect measure of the molecular weight of the polymer.
Table VII. Characterization of chitosans produced by chemical deacetylation from shrimp shell chitin
As we can see, optimal deacetylation conditions to obtain chitosan with high DDA (≥ 75%) and high viscosity (≥ 11 °E) were: 100°C, 40-50% NaOH, 5-5.5 h.
WP5 : Preparation of chitin and chitosan oligomers
Our investigations for oligomers production are based on the use of different soluble or insoluble chitin/chitosan substrates and various enzymes like chitinases and non-specific enzymes. Indeed it has been shown that chitosan could be hydrolyzed by many kinds of enzymes (cellulases, proteinases, lipases, pectinases, ...)6. These enzymes can degrade chitosan to the same extent as specific chitosanases. The interest is that these enzymes are commercial enzymes, usually food grade enzymes, that are safe and relatively inexpensive.
4 The method is based on chitosan titration with an alkali. Chitosan is dissolved in an organic acid and the chitosan solution (NH3+) is titrated with a dilute alcaline solution. The variation of pH and the volume of added alkali are plotted. The graphic shows 2 inflection points. The difference between the alkali volumes corresponding to the 2 inflection points equals the volume consumed for the conversion of the amine groups into ammonium salts. The deacetylation degree is determined from the amount of alkali necessary for the conversion. 5 The value of the Engler degree is established by dividing the discharge time (in sec) of 200 cm3 of the fluid being tested, at a given temperature, through a CV (Engler) viscometer by the time of discharge (in sec) of 200 cm3 of distilled water through the same viscometer at standard temperature (20° C). 6 Wenshui Xia and Ping Lu (2010). Chitosan hydrolysis by non-specific enzymes. Nova Science Publishers, Inc. New-York.

24
It was decided that our Vietnamese partner would use chitinases and CDA produced by strains selected from the VTCC. In comparison we would use available enzymes in our laboratory: commercial enzymes (specific and non-specific enzymes) and P. pastoris chitinase (home-made preparation). To measure the chitinase and/or chitosanase activity of these enzymes, we developed an assay as described below.
The enzyme was incubated during 1 h at optimal temperature (previously determined for each enzyme) and optimal pH (previously determined) in presence of either glycolchitin (home-made soluble chitin) or solubilized chitosan. The reaction was stopped by heating at 100°C and if necessary unhydrolyzed chitosan was precipitated. The reducing ends formed during hydrolysis of the polymer were assayed by MBTH method with NAG or Gluc as standard. Chitinase and chitosanase activities were quantified through the amount of released reducing ends during enzymatic incubation in standard conditions.
To optimize the conditions of hydrolysis, the optimal pH and temperature of these enzymes were analyzed (table VIII).
Enzyme Optimal pH Optimal temperature
Trichoderma viride cellulase 7 37
Papaya latex papain 8 50
Hen egg lysozyme 7 50
Mucor javanicus lipase 5 50
P.pastoris chitinase 5 et 8 37
S.griseus Chitinase 5 et 8 37
Aspergillus niger pectinase 5 50
Table VIII. Optimal pH and temperature of specific and unspecific enzymes showing chitinolytic and chitosanolytic activity
Chitin and chitosan were used as substrates to obtain respectively chitin or chitosan oligosaccharides. To characterize the produced oligomers we used TLC (Thin Layer Chromatography) and HPLC (High Pressure Liquid Chromatography) techniques (see WP6).
Chitin oligosaccharides
Enzymatic hydrolysis of raw or colloidal chitin by chitinases (from Streptomyces griseus and from Pichia pastoris) produced predominantly monomers and dimers of N-Acetylglucosamine (GlcNAc). In some cases, as for example with P. Pastoris chitinase, we observed the production of longer oligomers but the yield is generally low even after long incubation times (table IX).
The activity of non-specific enzymes, like pectinase, lysozyme, pectolyase and papain, was also tested on chitin. As in the case of chitinases, the production of oligomers of DP > 2 was low.
Enzymes Incubation
time
GlcNAc
Monomer
GlcNAc
Dimer
GlcNAc
Trimer
GlcNAc
Pentamer
Chitinase (Streptomyces griseus)
0.5h X
1h X

25
2h X
3h X
6h X X
24h X X
36h X X
48h X X
144h X X
Chitinase (Pichia pastoris)
3h X
6h X X
12h X X
66h X X X X
90h X X X X
144h X X X X
Lysozyme (egg white)
1h
3h X
6h X
66h
90h X X X
144h X X X
Pectinase (Aspergillus niger)
1h X
3h X ?
6h X X
66h X
90h X X
144h X X
Pectolyase (Aspergillus
japonicus)
1h X X
3h X X
6h X X
66h X
90h X X X X
144h X X X
Lysozyme/Pectinase Mix
1h X
3h X
6h X
66h X
90h X X X X
Papain (Papaya latex)
6h
12h
24h X X
48h X X
Table IX. Oligomers produced during hydrolysis of colloidal chitin by specific and non specific enzymes. Oligomers were analyzed by TLC (see details of the technique in WP6).
A possible explanation for these results is based both on the low accessibility of cristalline chitin and on the enzymatic mechanism. The enzymes may bind in an exo- (chain ends) or endo- (random internal binding) fashion and these binding modes may be combined with some degree of processive mechanism7 (the enzyme remains attached to the substrate between 7 Davies, G. and Henrissat, B. (1995) Structures and mechanisms of glycosyl hydrolases. Structure 3, 853–859.

26
subsequent hydrolytic reactions). Some chitinases exhibited a processive mechanism and they are thought to bind in an exo-mode on cristalline chitin providing essentially dimers. But they can bind in an endo-fashion when they act on soluble substrate as for example chitosan8.
In a second time, we compared the products obtained after hydrolysis of chitin with chitinases
from some Vietnamese strains and from P. pastoris strain. We used purified α-chitin (from
shrimp), β-chitin (from squid pen) and colloidal chitin (acid pre-treated chitin). The results are shown in table X.
Strains Hydrolysis products obtained after incubation with
Colloidal chitin Squid pen chitin Shrimp chitin
Aspergillus oryzae N37
Mono-, dimer(±) Mono-, dimer(±) Mono-, dimer(±)
Collectotrichum sp. Mono-, di-, trimer(±)
Mono-, di-, trimer(±) ---
Pichia pastoris Mono-(±), di-, tri-, tetramer
Mono-, di-, trimer Mono-, dimer
Streptomyces sp. 36
Mono-(±), dimer Mono-(±), dimer Dimer(±)
Streptomyces sp. 438 Mono-, di-, trimer(±)
Mono-, di-, trimer(±) Mono-, trimer(±)
Streptomyces sp. 556 Mono-(±), di-, trimer
Mono-(±), dimer ---
Streptomyces xylophagus Mono-(±), di-, trimer
Mono-(±), dimer Dimer(±)
Table X. Results of TLC analysis of hydrolysis of chitin substrates in presence of culture supernatants from Vietnamese and Pichia strains.
In all cases, we observed generally small oligosaccharides (generally mono-, di- and trimers).This is in agreement with our previous trials.
It is also important to identify the type of enzyme activity, exo or endo, because this can have an impact on the hydrolysis of the polymer chain, and therefore on the polymerization degree of the produced oligomers. To determine the type of chitinase activity, the best approach is to use oligomers as substrates and to analyze the hydrolysis products.
Table XI shows the oligomers obtained after hydrolysis of di-, tri- and hexamers in the presence of culture supernatant from different strains (from VTCC), and analyzed by the TLC technique.
8 Hult, E.L., Katouno, F., Uchiyama, T., Watanabe, T. and Sugiyama, J. (2005). Molecular directionality in crystalline beta-chitin: hydrolysis by chitinases A and B from Serratia marcescens 2170. Biochem. J. 388, 851–856 ; Sikorski, P., Sørbotten, A., Horn, S.J., Eijsink, V.G.H. and Vårum, K.M. (2006). Serratia marcescens chitinases with tunnel-shaped substrate-binding grooves show endo activity and different degrees of processivity during enzymatic hydrolysis of chitosan. Biochemistry 45, 9566–9574.

27
Strains Hydrolysis products from
Chitobiose (dimer) Chitotriose (trimer) Chitohexaose
(hexamer)
Aspergillus oryzae N37 Monomer Mono-, dimer Mono-, di-, tri-, tetra-, pentamer
Collectotrichum sp. Monomer Mono-, dimer Mono-, di-, tri-, (tetra-), pentamer
Pichia pastoris - Mono-, dimer Mono-, di-, tri-, tetramer
Streptomyces sp. 36 Monomer Mono-, dimer Mono-, tri-, tetra-, pentamer
Streptomyces sp. 438 Monomer Mono-, dimer Mono-, di-, tri-, tetra-, pentamer
Streptomyces sp. 556 Monomer Mono-, dimer Mono-, di-, tri-, tetra-, pentamer
Streptomyces xylophagus Monomer Mono-, dimer Mono-, di-, tri-, tetra-, pentamer
Streptomyces griseus - Mono-, dimer Mono-, di-, trimer
Table XI. Results of TLC analysis of oligosaccharide hydrolysis in culture supernatants
Except for P. pastoris, all strains exhibited a β-N-Acetyl glucosaminidase activity (hydrolysis of dimer into monomer). All strains showed also exochitinase activity as we observed in every case the hydrolysis of the trimers into di- and monomers. Endochitinase activity needs oligomers of DP ≥ 4. Hydrolysis of chitohexaose into di-, tri- and tetramers suggests the presence of an endochitinase activity in Streptomyces sp. 556, 438, 36 and S. xylophagus, in A. oryzae, in P. pastoris and in Colletotrichum sp.
In conclusion of these tests, we can say that whatever the chitin source, the chitinase source or type, the hydrolysis of insoluble crystalline chitin still provided mainly oligosaccharides of low DP (the production of higher DP oligosaccharides was still low). This is in accordance with the observations of other authors concerning different chitinases and their efficiency towards crystalline substrate. We observed that non-specific enzymes have the same behaviour on crystalline chitin.
It should be noted that GlcNAc mono- and dimer offer opportunities of applications due to their unique properties and non toxicity. Thus they can be used in dietary supplements and for therapeutic applications in the treatment of a wide variety of diseases9. Industry needs and asks for high efficiency processes for GlcNAc production and enzymatic process is a promising way to produce GlcNAc under mild conditions.
Chitosan oligosaccharides
It is well known that chitinases can be used to hydrolyze chitosan substrates to produce oligosaccharides of various sizes. It is also the case of non specific enzymes like cellulase, papain, lysozyme, lipase, …, that either are bifunctional enzymes or contain contaminant chitinase (or chitosanase). Glucosamine (GlcN) oligosaccharides showed a great interest for
9 Jeen-Kuan Chen, Chia-Rui Shen and Chao-Lin Liu (2010). N-Acetylglucosamine : Production and
Applications. Mar. Drugs, 8, 2493-2516; doi:10.3390/md8092493.

28
various industrial applications in medicine, cosmetics, bioactive food supplements, agriculture. This last aspect is particularly relevant in this project.
We decided to test the activity of different enzymatic preparations on chitosan and to analyze hydrolysis products.
We used high molecular weight chitosan showing a degree of deacetylation of 75%. This chitosan was hydrolyzed by the different enzymes under optimal reaction conditions. The rate of viscosity change and the release of reducing ends during enzymatic hydrolysis were determined. From these results, enzymes can be divided into 2 groups.
According to the viscosimetry assays, lysozyme, cellulase and P. pastoris chitinase showed a comparable reaction rate (fig. 25) during the first hour of hydrolysis: a slow decrease and a viscosity reaching ~ 60% of initial viscosity in the case of lysozyme and cellulase, ~30% in the case of P. pastoris chitinase. Between 1 and 2 hours of hydrolysis, the viscosity didn’t change much except for cellulase causing a viscosity decrease up to 15% of initial viscosity.
The other enzymes, papain and S. griseus chitinase, showed a very different behaviour (fig. 26): a very fast decrease at the beginning of hydrolysis reaching ~20% of initial viscosity after 30 sec with papain and after 2-3 min with S. griseus chitinase.
The rate of reducing end formation (fig. 27) was also different between the two enzyme groups. Papain and S. griseus chitinase showed higher initial rates: after 5 min hydrolysis, the rate was ~ 3-15 times higher than that measured with the enzymes of the first group. After the first 5 min, the rate did not vary with papain while with S. griseus chitinase the rate was after 60 min up to 20 times higher than that of the first enzyme group. The assays showed that the best activity was measured with Streptomyces chitinase and papain. Pectinase, cellulase and lipase showed nor or very little activity. By comparison, the tests carried out with insoluble colloidal chitin showed similar results.
Incubations of chitosan with cellulase, papain or chitinases were carried out during 6 h, 12 h, 24 h and 48 h and the production of oligosaccharides was analyzed by TLC. Trials with Streptomyces chitinase showed Gluc oligosaccharides of DP 2- 6 (and probably DP > 6) from 6 h of incubation. The production of these oligosaccharides increased over time. With papain, we observed mainly di- and tetramers and with cellulase only dimers. These observations have been be confirmed by HPLC.
In conclusion, papain and chitinase seem to be efficient enzymes to produce oligosaccharides from chitosan.
0
50
100
150
200
250
300
0'
10
'
20
'
30
'
40
'
50
'
60
'
70
'
80
'
90
'
10
0'
11
0'
12
0'
Vis
cosi
ty (
cP)
Time (min)
Lysozyme
Cellulase
Pichia pastoris

29
Fig. 25. Time course of the viscosity decrease of a chitosan solution (1.275%) in the presence of lysozyme, cellulase and P. pastoris chitinase. All enzymes were assayed in optimal conditions of activity.
Fig. 26. Time course of the viscosity decrease of a chitosan solution (1.275%) in the presence of papain and S.
griseus chitinase. All enzymes were assayed in optimal conditions of activity.
Fig. 27. Time course of reducing end formation from a chitosan solution (1.275%) treated with different enzymes. All the enzymes were assayed in optimal conditions of activity.
The soluble fraction obtained after 5 and 60 min hydrolysis of chitosan with different enzymes was analyzed by HPLC. Profiles showed also differences between the two groups of enzymes:
• First group: after first 5 min, the soluble fraction contained mainly mono- and dimer. Oligomers of higher DP (tetra-, penta- and hexamer) were obtained from 60 min hydrolysis but the yield was low (fig. 28).
0
50
100
150
200
250
300
0' 1' 2' 3' 4' 5' 6'
Vis
cosi
ty (
cP)
time (min)
papaïne
Streptomyces griseus

30
Tétramère – Pentamère – Hexamère
• Second group: in addition to monomer, oligosaccharides of DP 2-6 were obtained early during chitosan hydrolysis as shown in fig. 29. The yield of COS is also higher than with enzymes from the first group.
Minutes
0,0 2,5 5,0 7,5 10,0 12,5 15,0 17,5 20,0 22,5 25,0 27,5 30,0 32,5 35,0 37,5 40,0
mA
U
0
200
400
600
800
1000
1200
1400
1600
1800
2000
mA
U
0
200
400
600
800
1000
1200
1400
1600
1800
2000
0,0
60
1
14
84
0,3
93
4
63
0,4
87
1
15
4
0
,58
0
18
63
0,6
80
1
94
1
0
,99
3
44
32
4
1
,48
7
26
56
1,5
47
3
32
8
1
,74
0
10
73
8
2
,01
3
12
39
77
2,3
87
8
06
86
5
2
,58
7
93
56
3
2
,98
0
38
62
2
3
,20
7
44
59
9
3
,37
3
15
99
48
3,4
80
1
95
72
3,7
33
1
46
82
3,9
13
1
28
49
4,1
47
5
97
6
4
,30
0
20
57
7,8
60
7
53
12
7
8,5
93
6
44
99
00
20
,33
3
29
98
33
2
23
,42
7
18
97
79
8
25
,90
0
70
53
98
27
,51
3
29
17
15
3
30
,71
3
38
26
95
5
32
,88
0
93
68
06
5
34
,48
7
44
40
79
36
,66
0
43
19
0
38
,20
7
60
23
1
Spectrum Max Plot
naim270612009
Retention Time
Area
Name
Spectrum Max Plot
naim270612016
Minutes
13 14 15 16 17 18 19 20 21 22 23 24 25 26 27 28 29
mA
U
0
50
100
150
200
250
300
350
400
450
mA
U
0
50
100
150
200
250
300
350
400
450
20
,33
3
29
98
33
2
23
,42
7
18
97
79
8
25
,90
0
70
53
98
27
,51
3
29
17
15
3
Spectrum Max Plotnaim270612009
Retention Time
Area
Name
Spectrum Max Plotnaim270612016
GlcN
GlcNAc
Fig. 28. HPLC profile of the soluble fraction obtained after 5 min (─) and 60 min (─) of chitosan hydrolysis with
lysozyme
Dimer

31
All these results indicated a different lytic behavior between the two enzyme groups.
The slow viscosity decrease and the predominant generation of mono- and dimers would indicate an exo-type action of the enzymes of the first group (lysozyme, cellulase and P.
pastoris chitinase), at least in the early stages of hydrolysis. The formation of oligomers of higher DP (>2) later could indicate the presence of additional endo- chitinase/chitosanase activities in the unpurified preparations used here.
Conversely, the very fast decrease of viscosity and the generation of oligomers of higher DP (>2) at the beginning of hydrolysis would suggest that papain and S. griseus chitinase (second group) are endo-acting enzymes. The presence of low DP oligomers (mostly dimers) in combination with higher DP oligomers at the initial stage of hydrolysis is usually characteristic of processive type enzymes.
On the other hand, the reducing end measurements were not in full agreement since, by comparison with endo-acting enzymes, exo-enzymes should release higher reducing end concentration during the initial stage of hydrolysis (which was not the case in our trials). The higher rate observed with the enzymes of the second group could be explained by a higher hydrolytic activity of these enzymes and/or maybe a higher cleavage specificity for the glycosidic linkages found in chitosan.
This aspect is currently being further investigated.
The rate of chitosan hydrolysis with the different enzymes was studied for longer periods (until 96 h). The release of reducing ends (fig. 30) and the hydrolysis products were analyzed (fig. 31).
S. griseus chitinase was the most active enzyme to hydrolyze chitosan reaching a maximum after 48 h of incubation. Afterwards, the reaction rate slowly decreased. Interestingly, cellulase showed also a high chitosan hydrolyzing activity with a maximum at 72 h. The three
Minutes
0,0 2,5 5,0 7,5 10,0 12,5 15,0 17,5 20,0 22,5 25,0 27,5 30,0 32,5 35,0 37,5 40,0
mA
U
0
200
400
600
800
1000
1200
1400
1600
1800
2000
mA
U
0
200
400
600
800
1000
1200
1400
1600
1800
2000
0,1
20
6
71
3
0
,36
7
49
2
0
,56
7
61
1
0
,66
7
87
1
0
,74
7
83
1
0
,84
7
14
07
1,0
27
1
98
4
1
,18
0
16
56
1,2
60
6
92
1,3
47
1
70
4
1
,44
7
11
15
1,5
20
1
94
1
1
,82
7
36
00
1
1
,98
7
18
95
67
2,1
20
8
06
04
2,2
60
2
60
46
2,6
13
1
16
36
2
3
,00
0
27
69
1
3
,09
3
31
78
9
3
,22
0
37
61
0
3
,40
0
57
78
89
3,7
67
8
90
3
3
,94
0
11
33
6
4
,18
7
57
00
16
,72
0
10
16
86
61
18
,98
0
85
89
74
7
21
,72
0
43
50
23
4
23
,40
7
73
15
11
0
25
,30
7
15
39
98
4
26
,64
7
94
58
40
27
,99
3
60
77
69
32
,86
7
38
52
64
6
34
,49
3
52
36
47
Spectrum Max Plot
naim270612011
Retention Time
Area
Name
Spectrum Max Plot
naim270612017
Fig. 29. HPLC profile of the soluble fraction obtained after 5 min (─) and 60 min (─) of chitosan hydrolysis with S.
griseus chitinase
GlcN
GlcN
Dimer
Trimer Tetramer
Pentamer
Hexamer

32
other enzymes (papain, lysozyme and P. pastoris chitinase) showed very low rates even after prolonged incubation.
0
500
1000
1500
2000
2500
3000
3500
6 14 24 48 72 96Red
ucin
g e
nd
co
ncen
trati
on
(µ
M)
Time (hours)
Cellulase
Lysozyme
P. pastoris chitinase
Papain
S. griseus chitinase
Minutes
0,0 2,5 5,0 7,5 10,0 12,5 15,0 17,5 20,0 22,5 25,0 27,5 30,0 32,5 35,0 37,5 40,0
mA
U
0
200
400
600
800
1000
1200
1400
mA
U
0
200
400
600
800
1000
1200
1400
0,2
60
0,0
02
0,4
53
0,0
01
0,7
87
0,0
05
0,8
80
0,0
01
0,9
33
0,0
00
1,1
80
0,0
02
1,3
07
0,0
01
1,3
53
0,0
00
1,6
00
0,0
37
2,2
27
0,0
95
2,4
60
6,0
90
2,7
80
1,0
50
2,9
73
0,4
53
3,0
53
0,4
22
3,5
07
2,5
17
3,6
53
1,3
50
6,2
53
0,9
92
8,9
53
28
,26
9
10
,15
3
0
,03
9
11
,31
3
2
,63
2
12
,12
0
5
,20
2
13
,56
0
0
,12
2
15
,08
7
2
1,3
16
15
,69
3
1
,71
9
16
,70
0
7
,62
4
18
,26
7
0
,62
4
20
,01
3
4
,67
9
21
,08
7
5
,17
2
22
,44
7
0
,63
9
24
,08
0
0
,77
5
25
,70
0
1
,46
1
26
,46
0
0
,46
02
6,8
80
0,6
14
28
,02
0
0
,70
4
28
,61
3
0
,05
62
8,6
73
0,0
42
28
,72
7
0
,04
2
29
,77
3
1
,13
13
0,1
80
0,5
04
30
,67
3
0
,83
1
31
,97
3
0
,86
0
32
,82
7
0
,74
6
34
,45
3
0
,64
2
36
,19
3
0
,02
3
37
,02
0
0
,00
23
7,1
07
0,0
01
37
,46
7
0
,01
2
38
,01
3
0
,00
53
8,1
53
0,0
02
38
,22
7
0
,00
13
8,5
53
0,0
21
39
,21
3
0
,01
03
9,5
93
0,0
00
39
,64
0
0
,00
0
Spectrum Max Plot
Naim27032012027
Retention Time
Name
Area Percent
Spectrum Max Plot
Naim27032012029
Spectrum Max Plot
Naïm03042012014
Fig. 30. Time course of the reducing end release from a chitosan solution (0.5%) hydrolyzed with different
enzymes
Monomer
Dimer
Trimer
Fig. 31. HPLC analysis of hydrolysis products from a chitosan solution (0.5%) incubated during 96 h with P. pastoris chitinase(─) ; S.
griseus
chitinase (─) and
cellulase (─)

33
After 96 h of hydrolysis with different enzymes, the soluble fraction obtained from chitosan was analyzed by HPLC (fig. 31). The most interesting results were obtained with S. griseus chitinase, P. pastoris chitinase and T. viride cellulase. The soluble fraction was composed of a mixture of oligosaccharides and monomers. In addition to monomer peaks (absent in the fraction obtained with cellulase), we observed 2 major peaks corresponding to dimers and trimers and several minor peaks corresponding to oligomers of DP 3-6. Probably the most interesting was the production of oligomers of DP>6 with cellulase suggesting that this common enzyme, widely distributed in microorganisms, may constitue a potential alternative to the chitinases.
The vietnamese partner used chitinase and CDA isolated respectively from B. bassiana and from S. xylophagus to produce chitosan oligosaccharides. The process was the following :
• Purification of chitin from shrimp shells and preparation of colloidal chitin (partially hydrolyzed chitin by acid treatment)
• Enzymatic hydrolysis of colloidal chitin in presence of B. bassiana chitinase to obtain chitin oligosaccharides
Conditions of enzymatic hydrolysis of colloidal chitin were optimized, leading to the following conditions: 5% colloidal chitin in 50 mM citrate buffer ; 200 U chitinase/g substrate ; incubation at 50°C during 12h (fig. 32). In these conditions, the production of chitin oligosaccharides reached ~0.25% (2.5 g/l).
Minutes
17 18 19 20 21 22 23 24 25 26 27 28 29 30 31 32 33 34 35
mA
U
0
50
100
150
200
250
mA
U
0
50
100
150
200
250
16
,70
0
7
,62
4
18
,26
7
0
,62
4
20
,01
3
4
,67
9
21
,08
7
5
,17
2
22
,44
7
0
,63
9
24
,08
0
0
,77
5
25
,70
0
1
,46
1
26
,46
0
0
,46
0
26
,88
0
0
,61
4
28
,02
0
0
,70
4
28
,61
3
0
,05
62
8,6
73
0,0
42
28
,72
7
0
,04
2
29
,77
3
1
,13
1
30
,18
0
0
,50
4
30
,67
3
0
,83
1
31
,97
3
0
,86
0
32
,82
7
0
,74
6
34
,45
3
0
,64
2
Spectrum Max Plot
Naim27032012027
Retention Time
Name
Area Percent
Spectrum Max Plot
Naim27032012029
Spectrum Max Plot
Naïm03042012014
Trimer
TetramerPentamer
Hexamer
DP > 6

34
Fig. 32. Time course of chitin oligosaccharide production in the following conditions: 0.5% colloidal chitin, 200 U chitinase/g chitin, 50°C
• Enzymatic deacetylation of chitin oligosaccharides in presence of S. xylophagus CDA to obtain chitosan oligosaccharides. The best conditions (fig. 33 and 34) were determined as follow: 30% chitin oligosaccharides in citrate buffer at pH 5.5, 25-27 U CDA/ml, incubation with gentle agitation at 40°C during 18h. The deacetylation degree (DDA) of oligosaccharides was measured by potentiometric titration.
Fig. 33. Evolution of the DDA of oligosaccharides Fig. 34. Time-course of oligosaccharide as a function of oligosaccharide concentration deacetylation in presence of CDA (the reaction (the reaction conditions are mentioned above) conditions are mentioned above)
WP6 : Characterization of produced oligomers
Oligosaccharide size To analyze the oligosaccharide polymerization degree (DP), we used TLC (thin layer chromatography) technique which is a fast and easy method, and HPLC technique which is more accurate. GlcNAc and GlcN oligomers from DP 1-6 were used as standards.
The molecular weight of chitosan can be also indirectly determined by measuring viscosity. This is a simple and easy method that allows in addition to follow the change of viscosity (reflecting the change of polymer length) during hydrolytic incubation. The equipment was a Brookfield LVT Dial viscosimeter. All the measurements were made with 0.5% chitosan in 1% acetic acid at room temperature.
0
0,05
0,1
0,15
0,2
0,25
0,3
0 5 10 15 20 25Ch
itin
oli
go
sacc
ha
rid
es
(%)
Time (h)
0
20
40
60
80
20 25 30 40 50
DD
A (
%)
Concentration of chitin …
0
20
40
60
80
100
0 6 12 18 24 30
DD
A (
%)
Time (h)

35
TLC technique The procedure is the following :
• Material: plate of silica gel 60F254 (Merck)
• Solvent:
- for chitin OS: n-butanol / Acetic acid / H2O (2/1/1 ; v/v/l)) - for chitosan OS: n-butanol / 30% ammoniac (2/1 ; v/v)
• Detection:
- for chitin OS: Diphenylamine / Aniline / Phosphoric acid + heating at 100°C for 15 min
- for chitosan OS: 0.1% ninhydrin in water-saturated butanol
• Standards:
- for chitin OS: mono-, di-, tri-, penta- and hexamer of GlcNAc (2.5-10 µM) - for chitosan OS: mono-, di-, tri-, tetra- and hexamer of GlcN (5-10 µM)
• Spot 5 µl of each standard and 50 µl of sample on a TLC plate; dry the spots and place the plate in a chamber containing the solvent; run until the front of the solvent is about half a cm below the top of the plate; dry the plate; spray the detection reagent; dry again and heat at 100°C for 10 min. The reaction gives light red (or pink) spots. The spots in the samples are compared with the standards.
The figure 35 showed an example of TLC analysis.
GlcNAc1
GlcNAc2
GlcNAc3
GlcNAc5
GlcNAc6
1 2 3 4
Fig. 35. TLC analysis of products obtained during hydrolysis of chitin oligosaccharides in presence of S.
xylophagus chitinase 1: OS standards 2: Products of GlcNAc2 hydrolysis by chitinase 3: Products of GlcNAc3 hydrolysis by chitinase 4: Products of GlcNAc6 hydrolysis by chitinase

36
HPLC technique HPLC analysis were performed on a PREVAIL Carbohydrate ES column (4,6x250 mm) at room temperature with a flow rate of 0.5-1 ml/min. The elution was carried out with a mobile phase of acetonitrile-water 60:40 (v/v) and absorbance was measured at 195 nm. The figure 36 showed an example of HPLC chromatogram obtained with a mixture of chitin oligomers of DP 1-6:
Fig. 36. HPLC chromatogram of chitin oligomers of DP 1-6.
Oligosaccharide deacetylation degree (DDA)
To measure the deacetylation degree of chitosan polymer and oligosaccharides, we tested several techniques:
- potentiometric titration: acid titration of chitosan in alcaline solution10 - first derivative UV method11 - colorimetric determination of free amino groups using genipin12 - measure of free amino groups with fluorescamine on microplates
Genipin method gave inconsistent results for oligosaccharides. By comparison with the standard, the values were largely overestimated: ~700 times more glucosamine than the amount of oligosaccharides used for the assay ! Moreover the method had additional drawbacks: the high cost of genipin and the limited use of this method to water-soluble
10 R. Ling et al. (1992). Chemistry Bulletin, 3, 39-42. 11 Tao Wu and Svetlana Zivanovic (2008). Determination of the degree of acetylation (DA) of chitin and chitosan by an improved first derivative UV method. Carbohydrate Polymers, 73, 248-253. 12 L.M. Ramos-Ponce et al. (2010). Food Sci. Biotechnol. 19(3), 683-689.

37
products (the method is inconvenient for chitosan polymers even for low MW chitosan). We decided to abandon this method.
Fluorescamine method uses a non-fluorescent molecule that gives a fluorescent product after reaction with a primary amine. The method is generally used to measure proteins and we decided to test it to measure the amount of glucosamine in chitosan. With glucosamine standards the method provided consistent results but with chitosan our results showed a complete failure of the method providing lower Gluc concentrations than other methods. We decided to abandon this method also. However the method could be used for the DDA measure of oligosaccharides.
The two other methods gave consistent and comparable results (table XII).
Sample DDA by potentiometric method (%)
DDA by first UV derivative method (%)
Marinard chitosan 78 80
Primex chitosan 82 To be determined
Squid chitosan 86 To be determined
Shrimp chitosan 50 52
Crab chitosan 77 72
Table XII. Comparison of potentiometric method and first UV derivative method. Determination of the DDA (%) of various chitosans.
WP7 : Determination of biological activity in planta
Antifungal activity
To evaluate the fungicide effect of chitin oligomers, bioassays were performed against the pathogenic fungus Botrytis cinerea.
The bioassay was realized on TLC of oligomers covered after running with fungal spores. After incubation we observed zones corresponding to the inhibition of fungal growth. For the tests we used crab colloidal chitin and shrimp crude chitin hydrolyzed during 120 or 200 h in presence of chitinase. Samples were loaded on TLC. After running TLC was sprayed with fungal spores and incubated. We observed (fig. 37) the inhibition of fungal growth only in extracts corresponding to 120 h hydrolysis. Results were similar with extracts from hydrolysis of both types of chitin. The experiment was repeated and the results were similar. To determine the size of oligomers in the samples, TLC were also realized in parallel without fungus. We concluded that the inhibition zone observed on the plate corresponded to GlcNAc pentamer.

38
Tests with mixtures of chitosan oligosaccharides obtained by enzymatic hydrolysis / deacetylation of chitin (see the process described p.33) were also performed on solid medium. Antifungal activity of oligosaccharides against Fusarium sp. was studied by agar well diffusion method. A suspension of spores of Fusarium sp. was spread onto the plate of culture medium. Samples of chitooligosaccharides (different concentrations) were placed in wells of the plate. After incubation, areas of inhibition of fungal growth were observed. An example is shown in fig. 38.
Chitooligosaccharides obtained by enzymatic hydrolysis and deacetylation of shrimp chitin showed inhibitory activity against Fusarium from concentration of 1.5 mg/ml.
Tests of bioactivity on tomato plants
Preliminary tests of bioactivity were carried out with mixtures of chitin oligosaccharides. Crab colloidal chitin and shrimp crude chitin were hydrolyzed with chitinase during 96 h and 200 h. The hydrolysates were used to treat four week-old tomato plants. By comparison, plants were also treated with a commercial mixture of chitosan oligosaccharides (Facos).
One day after treatment, we didn’t observe necrosis on the plants. To quantify the resistance induced by each treatment, plants were infected by the pathogenic fungus Botrytis cinerea.
1 3 4 5 6 7 8
Fig. 37. Bioassay on TLC. 1 : 20 µl of crab colloidal chitin hydrolyzed with chitinase during 120h 2: 20 µl of crab colloidal chitin hydrolyzed with chitinase during 200h 3: 20 µl of shrimp crude chitin hydrolyzed with chitinase during 120h 4: 20 µl of shrimp crude chitin hydrolyzed with chitinase during 200h 5: 50 µl of crab colloidal chitin hydrolyzed with chitinase during 120h 6: 50 µl of crab colloidal chitin hydrolyzed with chitinase during 200h 7: 50 µl of shrimp crude chitin hydrolyzed with chitinase during 120h 8: 50 µl of shrimp crude chitin hydrolyzed with chitinase during
200h
Fig. 38. Bioassay in solid medium. The plate was seeded with spores of Fusarium sp. Samples of chitooligosaccharide mixture (300 mg/ml) was placed in wells : 61 (dil. 1000 x) ; 60 (dil. 600 x) ; 63 (dil. 400 x) ; 64 (dil. 200 x). Inhibition growth (clear zone) was observed after 3-5
days.

39
Figure 39. Infection rate and reduction of disease in the first test of induction resistance. V: shrimp crude chitin, C: crab colloidal chitin, 120: 120 hours of hydrolysis, 200: 200 hours of hydrolysis.
In this experiment, plants treated with samples from 120 h hydrolysis of shrimp crude chitin showed the highest rate of resistance to the disease. The lower protective effect was observed with 120 h hydrolysates from crab colloidal chitin (figure 39). To determine if the reduction of disease was caused by a direct effect of chitin oligomers on the pathogen (direct effect), or/and by the induction of a systemic resistance (ISR) in plants (indirect effect), we assayed the enzymatic activity of lipoxygenase (LOX), a key enzyme of the defense pathway of oxylipins, in tomato leaves. Five days after treatment of leaves by spraying chitin oligomers and before infection, LOX activity was 10-fold higher in treated plants than in control. Two days after infection, the activity increased in each treatment, but the increase was higher in plants treated with 96 h hydrolysates and in plants treated with chitosan oligomers (Facos) than in control (figure 8). Plants treated with crab colloidal chitin hydrolysates showed a higher LOX activity than plants treated with shrimp chitin hydrolysates (obtained after 96 h hydrolysis). Therefore, it seems that the reduction of disease rate was caused by both direct inhibition of the pathogen and stimulation of defense mechanisms in the plant. The difference observed between colloidal and crude chitin may be due to differences of oligomer composition in hydrolysis mixture obtained from both substrates. Indeed colloidal chitin is more accessible for chitinase than crystalline chitin (shrimp crude chitin).

40
Figure 40. LOX activity of plants treated with different chitin hydrolysates. V: shrimp crude chitin ; C: crab colloidal chitin ; 96: 96 hours of digestion ; 200: 200 hours of digestion. Samples were collected before (0), two days (2) and 4 days (4) after infection (dpi).
In the first induction assay in tomato, we observed that plants treated with chitin hydrolysates from 120 h incubation showed a better resistance rate than plants treated with hydrolysates from 200 h. Our next experiment was to determine the chitin hydrolysis duration providing the best protective effect. In this experiment, plants were treated with samples from chitin hydrolysis during 48, 72, 96, 120 and 144 h in presence of chitinase.
We observed that - Tomato plants treated with chitin 72 and 120 h hydrolysates showed the highest
resistance rate (approximatively 40% of symptom reduction compared to control). - Plants treated with chitin 48 and 144 h hydrolysates showed the lowest resistance rate
(approximatively 10% of reduction of disease). - Plants treated with chitin 96 h hydrolysates showed a reduction of symptom of 18%
(figure 41).
Figure 41. Symptom reduction rate of plants treated with chitin digested during 48, 72, 96, 120 and 144 hours, or not treated (control).
Chitosan oligosaccharides were also tested for their bioactivity on tomato plants. They were obtained by chitosan hydrolysis with cellulase, S. griseus chitinase or P. pastoris chitinase during 96h. Mixtures were characterized by HPLC analysis and the oligosaccharide content was measured by MBTH method (reducing end assay). Oligosaccharide mixtures were sprayed on the third leaf. Tests were made in triplicate on batchs of 10 tomato plants.
Three days after treatment, plants were infected by the pathogenic fungus Botrytis cinerea (10 drops of a suspension containing 105 spores/ml applied on the third leaf). Two days after treatment, we observed the presence of necrotic zones (fig. 42) on the third leaf and we calculated the infection rate.

41
As shown on fig. 43, we observed a partial protection of tomato plants against B. cinerea after treatment with oligosaccharide mixtures: 30-40% protection. Oligosaccharides obtained by chitosan hydrolysis with P. pastoris chitinase showed the lowest protection rate. This may due to a lower oligosaccharide total content (in fact this mixture contained 10 times less oligosaccharides than both other hydrolysis mixtures) or to a lower content of oligosaccharides of DP>2 (as revealed by HPLC analysis).
Fig. 43. Protection rate in tomato plants treated with oligosaccharide mixtures and challenged with B. cinerea spores
Tests of bioactivity in fields
Field tests were carried out by the Vietnamese partner in collaboration with the Institute for Agricultural Environment in Hanoi. Vegetables tested were: tomato, cucumber, cabbage and bean. Plants were treated with chitosan oligomers produced according to the process described p.33. Different concentrations of oligomers (3, 1 and 0.5 mg/ml) were sprayed either on leaves every 10 days or on leaves and on the soil surface every 15 days. Positive
05
101520253035404550
OS/Chitinase P.
pastoris
OS/Chitinase S.
griseus
OS/Cellulase T.
viride
% protection
% protection
Fig. 42. Tomato leaf treated with oligosaccharide mixture and infected with B. cinerea spores. Brown
spots are necrotic zones.

42
controls were also carried out with chemical protective agents (validacin, kasugamycin, bordo, ridomil, propiconazole, difenoconazole). The size of each field was 60 m2.
The best results were obtained with 3 mg/ml concentration of oligomers (table XII). Except in the case of tomatoes infected with Phytophtora, chitosan oligomers showed better protection than chemical protective agents (positive controls). In general, best pathogen inhibition rates were obtained when vegetables are sprayed with chitosan oligomers on leaves and on soil surface. Pathogen inhibition rates reached 75-90%.
These preliminary observations are very promising. Nevertheless experiments must be repeated to confirm these results.

43
Vegetable Disease and/or
Pathogen
agents
Biocontrol
agent
Conditions of
application
Pathogen
inhibition rate
(%)
Tomato
Damping off / Pythium sp. – Rhizoctonia sp.
Validacin
Sprayed every 5 days
46.0
Chitosan oligomers
Sprayed on leaves and soil every 15 days
89.5
Sprayed on leaves every 10 days
56.6
Ralstonia
solanacearum
Kasugamycin Sprayed every 7 days
43.8
Chitosan oligomers
Sprayed on leaves and soil every 15 days
80.0
Sprayed on leaves every 10 days
53.8
Phytophtora
Combination of bordo and ridomil
Sprayed every 7 days
74.4
Chitosan oligomers
Sprayed on leaves and soil every 15 days
59.5
Sprayed on leaves every 10 days
56.9
Cucumber
Damping off / Fusarium sp. – Pythium sp.
Validacin
Sprayed every 5 days
46.3
Chitosan oligomers
Sprayed on leaves and soil every 15 days
81.7
Sprayed on leaves every 10 days
56.1
Powdery mildew / Erysiphe
cichoarcearum
Validacin Sprayed every 5 days
67.9
Chitosan Sprayed on leaves and soil

44
oligomers every 15 days 47.0
Sprayed on leaves every 10 days
78.9
Bean
Damping off / Fusarium sp. / Pythium sp.
Validacin
Sprayed every 5 days
46.8
Chitosan oligomers
Sprayed on leaves and soil every 15 days
74.9
Sprayed on leaves every 10 days
54.8
Brown rust disease / Uromyces viciae – U. fabae
Propiconazole / Difenoconazole
Sprayed every 5 days
75.1
Chitosan oligomers
Sprayed on leaves and soil every 15 days
54.4
Sprayed on leaves every 10 days
76.8
Cabbage
Damping off / Fusarium sp. – Pythium sp.
Validacin
Sprayed every 5 days
49.6
Chitosan oligomers
Sprayed on leaves and soil every 15 days
74.8
Sprayed on leaves every 10 days
59.0
Root rot disease/ Plasmodiophora
sclerotinia
Validacin
Sprayed every 5 days
38.7
Chitosan oligomers
Sprayed on leaves and soil every 15 days
74.8
Sprayed on leaves every 10 days
46.1
Table XII. Tests of vegetable protection in field conditions
CONCLUSIONS

45
• A total of ~ 1250 Actinomycetes and ~1100 Fungi from the Vietnam Type Culture Collection were screened for their chitinase and chitin deacetylase activity. 2 Fungi (VN10-1103 and VN09-0060) and 1 Streptomyces (VN08-5085) strains were selected as high producers of chitinase. They were taxonomically identified as Trichoderma reesei (VN09-0060), Beauvaria bassiana (VN10-1103) and Streptomyces chromofuscus (VN08-5085). 1 Streptomyces strain (I2) was selected as good producer of chitin deacteylase and was identified as Streptomyces xylophagus.
• These strains were studied for their capacity of chitinase and chitin deacetylase production. Their conditions of culture were optimized (pH, temperature, medium composition, …) and the time-course of enzyme production was analyzed. B. bassiana was selected as the best producer of chitinase and S. xylophagus as the best producer of chitin deacetylase. The conditions of culture in fermentor, the process of production of chitinase and chitin deacetylase and the downstream treatment were developed.
• A process of chitin extraction from shrimp shells was developed. This process is simple and yields ~ 10-14% chitin of the total dry weight. Chitin can be used either for the production of high molecular weight chitosan or for the production of oligomers by enzymatic process.
• Chitin and chitosan oligomers were produced by enzymatic way. Two protocols were studied: one using low-cost non-specific enzymes (cellulase, pectinase, proteinases, …) and the other using chitinase and chitin deacetylase produced by the selected vietnamese strains. The obtained oligosaccharides were characterized (polymerization degree and deacetylation degree). For that purpose, techniques of characterization were developed and validated.
• The bioactivity of chitin and chitosan oligomers was evaluated on plants. Antifungal activity against 2 plant pathogens, Botrytis cinerea and Fusarium sp., was analyzed. Tests of bioactivity were carried out on whole plants at laboratory scale and in fields. At the laboratory scale, tomato plants were treated with mixtures of oligosaccharides after which plants were infected by the pathogenic fungus B. cinerea. Plants treated with oligosaccharides showed a disease reduction up to 40%. Preliminary tests were also carried out in fields (in Hanoi) on vegetables (tomato, cucumber, bean and cabbage). In general, chitosan oligomers showed better protection than traditional chemical protective agents and best protection was obtained when the treatment was applied on leaves and on soil surface. Pathogen inhibition rates reached ~75-90%.

46
SCIENTIFIC PRODUCTION
International Conferences
Luong Thi Dao. Screening and 16S rRNA analysis of the Actinomycetes producing chitin deacetylase and chitinase. 9th Asia-Pacific Chitin and Chitosan Symposium, Nha Trang, Vietnam, August 3-6, 2011.
Thi Hoang Yen Le. Screening and optimizing of cultural conditions for production of chitinase by fungi isolated in Vietnam and recognition of this chitinase by zymogram. 9th Asia-Pacific Chitin and Chitosan Symposium, Nha Trang, Vietnam, August 3-6, 2011.
M. F. Versali, N. Bouazza, F. Clérisse, M. Twizeye, D. V. Hop and J. Dommes. Production of Chitosan Oligosaccharides and their Potentiality as Bioprotective Agents in Agriculture. 11th International Conference of the European Chitin Society, Porto, Portugal, May 5-8, 2013.
Publications
Dao Thi Luong, Nguyen Anh Tuan, Nguyen Thi Van, Le Thi Hoang Yen, Marie-France Jaspar-Versali, Jacques Dommes and Duong Van Hop. Study in an Actinomycetes producing chitinase and chitin deacetylase. ICBiotech Annual report Journal Osaka University, Japan (submitted).
Le Thi Hoang Yen, Nguyen Anh Tuan, Le Viet Hung, Nguyen Thi Hong Nhung and Duong Van Hop. Screening for chitinolytic fungi isolated in Vietnam and optimizing cultural conditions for the production of chitinase by Trichoderma reesei VN09-F0060. ICBiotech Annual report Journal Osaka University, Japan (submitted).
Jaspar-Versali Marie-France, Bouazza Naïm, Duong Van Hop and Jacques Dommes. Preparation of chitosan oligomers by non-specific enzymes (in preparation).
Master thesis
Nguyen Thanh Huong. Study on characterization of chitinase from Streptomyces. Master thesis Major Biotechnology, Vietnam National University of Hanoi and Liège University, 2011.
Bouazza Naïm. Production d’oligosaccharides de chitine et chitosane par voie enzymatique et leur activité antifongique. Thèse de Master en Biochimie, Biologie Moléculaire et Cellulaire à finalité approfondie, Université de Liège, 2012.