Embed Size (px)
Citation preview

[6741-01-P]
FEDERAL DEPOSIT INSURANCE CORPORATION
12 CFR Part 327
RIN 3064-AD66
ASSESSMENTS
AGENCY: Federal Deposit Insurance Corporation (FDIC).
ACTION: Notice of proposed rulemaking and request for comment.
SUMMARY: The FDIC proposes to amend 12 C.F.R. part 327 to revise the assessment
system applicable to large insured depository institutions (IDIs or institutions) to better
differentiate IDIs and take a more forward-looking view of risk; to better take into
account the losses that the FDIC may incur if such an IDI fails; and to make technical and
other changes to the rules governing the risk-based assessment system.
DATES: Comments must be received on or before [Insert date 45 days after publication
in the Federal Register.]
ADDRESSES: You may submit comments on the notice of proposed rulemaking,
identified by RIN number and the words “Assessments, Large Bank Pricing NPR,” by
any of the following methods:
• Agency Web Site: http://www.FDIC.gov/regulations/laws/federal/propose.html.
Follow the instructions for submitting comments on the Agency Web Site.
• E-mail: [email protected]. Include the RIN number in the subject line of
2
the message.
• Mail: Robert E. Feldman, Executive Secretary, Attention: Comments, Federal
Deposit Insurance Corporation, 550 17th Street, N.W., Washington, DC 20429.
• Hand Delivery: Guard station at the rear of the 550 17th Street Building (located
on F Street) on business days between 7 a.m. and 5 p.m.
Instructions: All submissions received must include the agency name and RIN for this
rulemaking. Comments will be posted to the extent practicable and, in some instances,
the FDIC may post summaries of categories of comments, with the comments themselves
available in the FDIC’s reading room. Comments will be posted at:
http://www.fdic.gov/regulations/laws/federal/propose.html, including any personal
information provided with the comment.
FOR FURTHER INFORMATION CONTACT:
Lisa Ryu, Chief, Large Bank Pricing Section, Division of Insurance and Research, (202)
898-3538; Christine Bradley, Senior Policy Analyst, Banking and Regulatory Policy
Section, Division of Insurance and Research, (202) 898-8951; Brenda Bruno, Senior
Financial Analyst, Division of Insurance and Research, (630)241-0359 x 8312; Robert L.
Burns, Chief, Exam Support and Analysis, Division of Supervision and Consumer
Protection (704) 333-3132 x 4215; Christopher Bellotto, Counsel, Legal Division, (202)
898-3801; Sheikha Kapoor, Counsel, Legal Division, (202) 898-3960.

3
SUPPLEMENTARY INFORMATION:
I. Background
Legal Authority
The Federal Deposit Insurance Act (the FDI Act) requires that the deposit
insurance assessment system be risk-based and allows the FDIC to define risk broadly.1
It defines a risk-based system as one based on an institution’s probability of causing a
loss to the Deposit Insurance Fund (the Fund or the DIF) due to the composition and
concentration of the IDI’s assets and liabilities, the likely amount of any such loss, and
the revenue needs of the DIF. The FDI Act allows the FDIC to “establish separate risk-
based assessment systems for large and small members of the Deposit Insurance Fund.”2
2009 Assessments Rule
Effective April 1, 2009, the FDIC amended its assessments rule to create the
current assessment system. Under this system, the initial base assessment rate for a large
Risk Category I institution is determined by either the financial ratios method (which is
also applicable to all small IDIs) or, for IDIs with at least one long-term debt rating, by
the large bank method.3 The financial ratios method uses a weighted average of
CAMELS component ratings and certain financial ratios.4 The large bank method
1 Section 7(b)(1)of the Federal Deposit Insurance Act (12 U.S.C. 1817(b)). 2 Section 7(b)(1)(D) of the Federal Deposit Insurance Act (12 U.S.C. 1817(b)(1)(D)). 3 In 2006, the FDIC adopted by regulation an assessment system that placed IDIs into risk categories (Risk Category I, II, III or IV) depending on supervisory ratings and capital levels. 71 FR 69282 (Nov. 30, 2006). 4 The financial ratios method applies to large institutions without at least one long-term debt rating (and all small IDIs). The 2009 assessments rule added a new measure—the adjusted brokered deposit ratio—to the financial ratios that were considered under the previous assessments rule. The adjusted brokered deposit ratio measures the extent to which certain brokered deposits are used to fund rapid asset growth. The

4
incorporates the financial ratios method into a financial ratios score and combines this
score with the IDI’s weighted average CAMELS component rating and its average long-
term debt issuer rating to produce an assessment rate (the large bank method). Under the
2009 assessments rule, the FDIC may adjust initial assessment rates for large Risk
Category I institutions up to 1 basis point to ensure that the relative levels of risk posed
by these institutions are consistently reflected in assessment rates; the adjustment is
known as the large bank adjustment.5
The April 2010 Proposed Rule (April NPR)
On April 13, 2010, the FDIC, using its statutory powers under section 7(b) of the
FDI Act (12 U.S.C. 1817(b)), adopted a notice of proposed rulemaking with request for
comment to revise the assessment system applicable to large IDIs to better capture risk at
the time an IDI assumes the risk, to better differentiate IDIs during periods of good
economic and banking conditions based on how they would fare during periods of stress
or economic downturns, and to better take into account the losses that the FDIC may
incur if an IDI fails (the April NPR).6 The FDIC sought comments on every aspect of the
April NPR and specifically requested comment on several issues. The FDIC received 18
written comments on the April NPR. Most commenters requested that the FDIC delay
adjusted brokered deposit ratio excludes deposits that a Risk Category I institution receives through a deposit placement network on a reciprocal basis, such that: (1) for any deposit received, the institution (as agent for depositors) places the same amount with other insured depository institutions through the network; and (2) each member of the network sets the interest rate to be paid on the entire amount of funds it places with other network members (reciprocal deposits). 5 12 CFR 327.9(d)(4). 74 FR 9525, 9535-9536 (Mar. 4, 2009). 6 75 FR 23516 (May 3, 2010).

5
the implementation of the rulemaking until the effects of then pending comprehensive
financial regulation bills were known.
Congress subsequently adopted comprehensive financial regulation legislation in
the Dodd-Frank Wall Street Reform and Consumer Protection Act (Dodd-Frank), which
includes a provision directing the FDIC to amend its regulatory definition of “assessment
base” for purposes of setting assessments for IDIs. As a result of Dodd-Frank, an IDI’s
assessment base will be calculated using its average consolidated total assets less its
average tangible equity during the assessment period.7 The FDIC believes that the recent
statutory change to the assessment base constitutes a substantial revision to the deposit
insurance system and, under the FDI Act (12 U.S.C. 1817(b)(1)(F)), such changes must
be made after notice and opportunity to comment. Accordingly, the FDIC is issuing a
separate notice of proposed rulemaking with request for comment on the Notice of
Proposed Rulemaking on the Implementation of the Deposit Insurance Assessment (the
Assessment Base NPR), which is being published concurrently with this NPR. Largely
as a result of Dodd-Frank and the Assessment Base NPR, the FDIC is issuing this second
proposal for public comment on large bank assessments, taking into account the
comments received on the April NPR. The attached regulatory text includes proposed
changes for this NPR, as well as the Assessment Base NPR.
7 Pub. L. No. 111-203, §331(b), 124 Stat. 1376, 1539 (to be codified at 12 USC 1817(b)). The Act will substitute the new assessment base for the current assessment base, which is closely related to domestic deposits. 12 CFR 327.5 (2010).

6
II. Risk-based Assessment System for Large Insured Depository Institutions
In this rulemaking, the FDIC proposes revising the assessment system applicable
to large IDIs to better capture risk at the time an IDI assumes the risk, to better
differentiate IDIs during periods of good economic and banking conditions based on how
they would fare during periods of stress or economic downturns, and to better take into
account the losses that the FDIC may incur if such an IDI fails.
As in the April NPR, the FDIC proposes eliminating risk categories and the use of
long-term debt issuer ratings in calculating risk-based assessments for large IDIs.8 The
FDIC proposes using a scorecard method to calculate assessment rates for all large IDIs.
The scorecard method combines CAMELS ratings and certain forward-looking financial
measures to assess the risk a large IDI poses to the DIF. The scorecard uses quantitative
measures that are readily available and useful in predicting a large IDI’s long-term
performance.9 Two separate scorecards are used: one for most large IDIs and another for
institutions that are structurally and operationally complex or that pose unique challenges
and risk in the case of failure (highly complex IDIs).
The FDIC believes that, since the risk measures used in the scorecards focus on
long-term risk, they should mitigate the pro-cyclicality of the current system. IDIs that
pose higher risk over the long term would pay higher assessments when they assume
8 Dodd-Frank requires all federal agencies to review and modify regulations to remove reliance upon credit ratings and substitute an alternative standard of creditworthiness. Pub. L. No. 111-203, §939A, 124 Stat. 1376, 1886 (to be codified at 15 USC78o-7 note). 9 Most of the data are publicly available, but data elements to compute four scorecard measures—higher-risk assets, top 20 counterparty exposures, the largest counterparty exposure, and criticized/classified items—are gathered during the examination process. The FDIC proposes that IDIs provide these data elements in the Consolidated Reports of Condition and Income (Call Report) or the Thrift Financial Report (TFR) beginning with the second quarter of 2011. See Section II, E of this proposal.

7
these risks—rather than paying large assessment rates when conditions deteriorate.
Consequently, the proposed scorecard system should provide incentives for IDIs to avoid
excessive risk during economic expansions.
As shown in Chart 1, the proposed measures over the 2005 to 2008 period were
useful in predicting performance of large IDIs in 2009. The chart contrasts the predictive
values of the proposed measures with weighted-average CAMELS component ratings
and risk measures included in the existing financial ratios method. The proposed
measures predict the proper rank ordering of risk for large IDIs as of the end of 2009
(based on a consensus view of FDIC analysts) significantly better than do the other two
risk measures and, thus, better than the current system used for most large Risk Category
I institutions, which combines weighted-average CAMELS composite scores, the
financial ratios method and long-term debt issuer ratings.10 For example, in 2006, the
proposed measures would have predicted FDIC’s year-end 2009 risk ranking of large
IDIs more than twice as well as the risk measures in the existing financial ratios method,
which applies to large IDIs without debt ratings.
10 Lack of historical debt ratings data for a significant percent of large IDIs makes it difficult to compare the predictive accuracy of proposed measures to risk measures included in the current large bank method. However, for a smaller sample with available debt ratings, adding debt ratings to other risk measures included in the current small bank model does not improve the predictive accuracy of the model.

8
Chart 1
Various Measures’ Ability to Predict Current Expert Judgment Risk Ranking11,12
10%13%
19%
40%
19%21%
32%
48%46% 47%
56%
67%
0%
10%
20%
30%
40%
50%
60%
70%
80%
2005 2006 2007 2008
Weighted Average CAMELS Component Ratings
Risk Measures in Existing Financial Ratios Method
Proposed Measures
Percentage Approximated by Factors (Adjusted R-Square)
A “large institution” would continue to be defined as an IDI that has had $10
billion or more in total assets for at least four consecutive quarters. The proposal would
apply to all large IDIs regardless of whether they are defined as new.13 Insured branches
of foreign banks would not be included within the definition of a large institution.
11 The rank ordering of risk for large institutions as of the end of 2009 (based on a consensus view of staff analysts) is largely based on the information available through the FDIC’s Large Insured Depository Institution (LIDI) program. Large institutions that failed or received significant government support over the period are assigned the worst risk ranking and are included in the statistical analysis. Appendix 1 to the NPR describes the statistical analysis in detail. 12 The percentage approximated by factors is based on the statistical model for that particular year. Actual weights assigned to each scorecard measure are largely based on the average coefficients for 2005 to 2008, and do not equal the weight implied by the coefficient for that particular year (See Appendix 1 to the NPR). 13 In almost all cases, an IDI that has had $10 billion or more in total assets for four consecutive quarters will have a CAMELS rating; however, in the rare event that such an IDI has not yet received CAMELS ratings, it would be given a weighted average CAMELS rating of 2 for assessment purposes until actual CAMELS ratings are assigned.
9
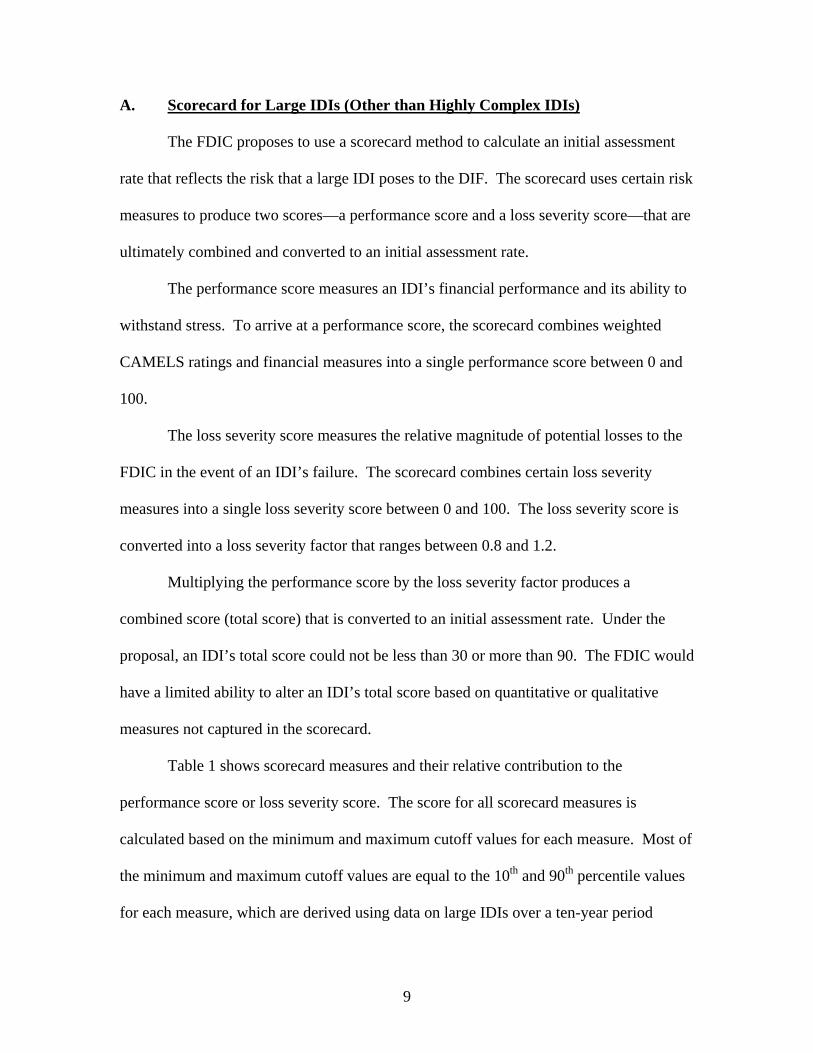
A. Scorecard for Large IDIs (Other than Highly Complex IDIs)
The FDIC proposes to use a scorecard method to calculate an initial assessment
rate that reflects the risk that a large IDI poses to the DIF. The scorecard uses certain risk
measures to produce two scores—a performance score and a loss severity score—that are
ultimately combined and converted to an initial assessment rate.
The performance score measures an IDI’s financial performance and its ability to
withstand stress. To arrive at a performance score, the scorecard combines weighted
CAMELS ratings and financial measures into a single performance score between 0 and
100.
The loss severity score measures the relative magnitude of potential losses to the
FDIC in the event of an IDI’s failure. The scorecard combines certain loss severity
measures into a single loss severity score between 0 and 100. The loss severity score is
converted into a loss severity factor that ranges between 0.8 and 1.2.
Multiplying the performance score by the loss severity factor produces a
combined score (total score) that is converted to an initial assessment rate. Under the
proposal, an IDI’s total score could not be less than 30 or more than 90. The FDIC would
have a limited ability to alter an IDI’s total score based on quantitative or qualitative
measures not captured in the scorecard.
Table 1 shows scorecard measures and their relative contribution to the
performance score or loss severity score. The score for all scorecard measures is
calculated based on the minimum and maximum cutoff values for each measure. Most of
the minimum and maximum cutoff values are equal to the 10th and 90th percentile values
for each measure, which are derived using data on large IDIs over a ten-year period
10
beginning with the first quarter of 2000 through the fourth quarter of 2009—a period that
includes both good and bad economic times.14 Appendix 1 shows selected percentile
values of each scorecard measure over this period.
The score for each measure, other than the weighted average CAMELS rating,
ranges between 0 and 100, where 100 equals the highest risk and 0 equals the lowest risk
for that measure. A value reflecting lower risk than the cutoff value receives a score of 0.
A value reflecting higher risk than the cutoff value receives a score of 100. A risk
measure value between the minimum and maximum cutoff values converts linearly to a
score between 0 and 100, which is rounded to 3 decimal points. The weighted average
CAMELS rating is converted to a score between 25 and 100 where 100 equals the highest
risk and 25 equals the lowest risk.
Appendix B describes in detail how each scorecard measure is converted to a
score.
14 The detailed results of the statistical analysis used to select risk measures and the weights are provided in Appendix 1 and an online calculator will be available on the FDIC’s website to allow insured institutions to determine how their assessment rates would be calculated under this NPR.

11
Table 1
Scorecard for Large IDIs
Scorecard Measures Weights within
Component
ComponentWeights
P Performance Score P.1 Weighted Average CAMELS Rating 100% 30%
P.2 Ability to Withstand Asset-Related Stress: 50%
Tier 1 Leverage Ratio 10% Concentration Measure 35% Core Earnings/Average Quarter-End Total Assets* 20% Credit Quality Measure 35%
P.3 Ability to Withstand Funding-Related Stress 20%
Core Deposits/Total Liabilities 60% Balance Sheet Liquidity Ratio 40% L Loss Severity Score
L.1 Loss Severity 100%
Potential Losses/Total Domestic Deposits (loss severity measure)
75%
Noncore Funding/Total Liabilities 25% * Average of five quarter-end total assets (most recent and four prior quarters)
The FDIC has made simplifying revisions to the scorecard proposed in the April
NPR. These revisions do not materially reduce the scorecard’s ability to differentiate
among IDIs’ risk profiles. Simplifying revisions include refining some risk
measurements, eliminating the outlier add-ons, and allowing for an adjustment of an
IDI’s total score, up or down, a maximum 15 points higher or lower than the total score,
rather than allowing for an adjustment of both the performance score and the loss severity
score by up to 15 points each. The FDIC took these steps partly in response to comments
on the April NPR expressing concerns about the complexity of the proposal. The FDIC

12
recognizes that the scorecard and some risk measures in the scorecard continue to be
somewhat complex; however, this complexity simply reflects the complexity of large
IDIs. Further reducing the complexity would lead to considerably less accuracy in
predicting risk.
As in the April NPR and as shown in Appendix 1, the FDIC has carefully selected
risk measures that best predict how IDIs fared during the period of most recent stress.
Some commenters expressed concern that the factors and assumptions reflect a backward
looking analysis of the 2005 through 2009 period—a time of extraordinary stress—but
the FDIC believes that the scorecard should differentiate risk based on how IDIs would
fare during periods of economic stress. Periods of stress reveal risks that often remain
hidden during periods of prosperity.
1. Performance Score
The first component of the scorecard for large IDIs is the performance score. The
performance score for large IDIs is the weighted average of three inputs: (1) weighted
average CAMELS rating; (2) ability to withstand asset-related stress measures; and (3)
ability to withstand funding-related stress measures. Table 2 shows the weight given to
each of these three inputs.
Table 2
Performance Score Inputs and Weights
Performance Score Inputs Weight
CAMELS Rating 30%
Ability to Withstand Asset-Related Stress 50%
Ability to Withstand Funding-Related Stress 20%
13
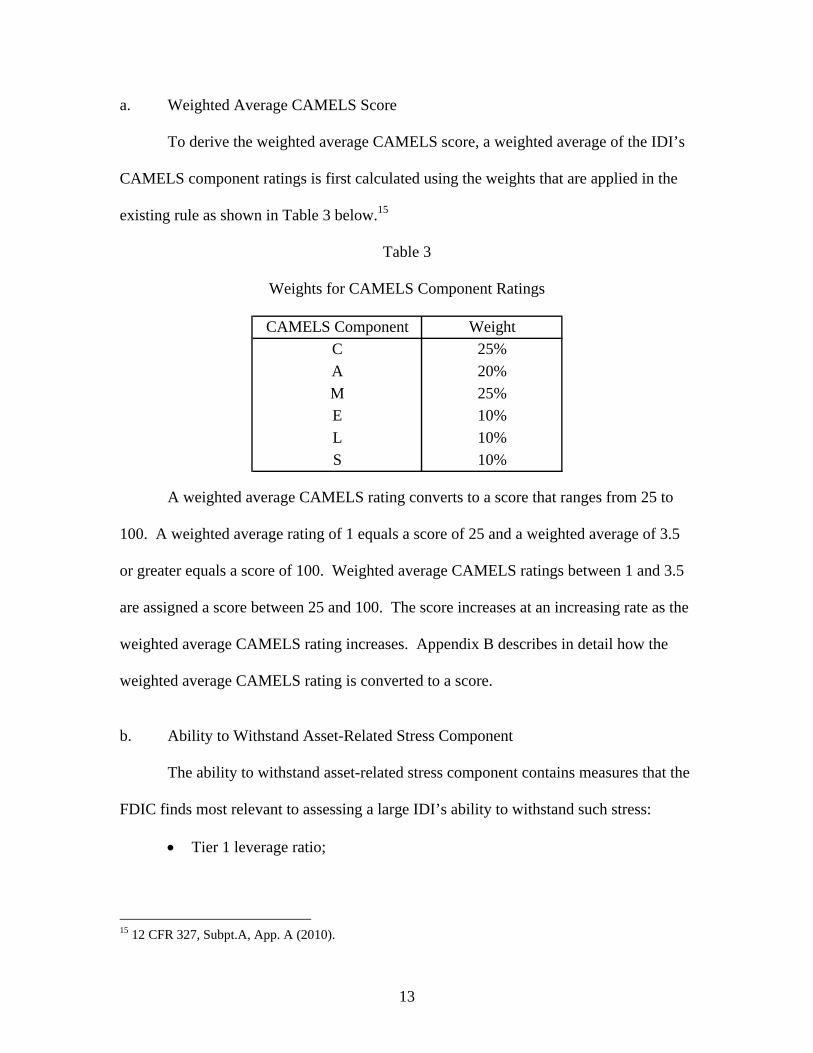
a. Weighted Average CAMELS Score
To derive the weighted average CAMELS score, a weighted average of the IDI’s
CAMELS component ratings is first calculated using the weights that are applied in the
existing rule as shown in Table 3 below.15
Table 3
Weights for CAMELS Component Ratings
CAMELS Component Weight
C 25%
A 20%
M 25%
E 10%
L 10%
S 10%
A weighted average CAMELS rating converts to a score that ranges from 25 to
100. A weighted average rating of 1 equals a score of 25 and a weighted average of 3.5
or greater equals a score of 100. Weighted average CAMELS ratings between 1 and 3.5
are assigned a score between 25 and 100. The score increases at an increasing rate as the
weighted average CAMELS rating increases. Appendix B describes in detail how the
weighted average CAMELS rating is converted to a score.
b. Ability to Withstand Asset-Related Stress Component
The ability to withstand asset-related stress component contains measures that the
FDIC finds most relevant to assessing a large IDI’s ability to withstand such stress:
Tier 1 leverage ratio;
15 12 CFR 327, Subpt.A, App. A (2010).

14
Concentration measure (the higher of the ratio of higher-risk assets to the sum
of Tier 1 capital and reserves or the growth-adjusted portfolio concentrations
measure);
The ratio of core earnings to average quarter-end total assets; and
Credit quality measure (the higher of the ratio of criticized and classified
items to the sum of Tier 1 capital and reserves measure or the ratio of
underperforming assets to the sum of Tier 1 capital and reserves measure).
In general, these measures proved to be the most statistically significant measures
of a large IDI’s ability to withstand asset-related stress, as described in Appendix 1.
Appendix A describes these measures in detail and provides the source of the data used to
determine them.
The FDIC proposes to include the Tier 1 leverage ratio as a risk measure rather
than the Tier 1 common ratio proposed in the April NPR so that capital would be defined
consistently throughout the deposit insurance assessment rules to mean regulatory capital,
whether it is for the calculating the risk-based assessment rate or for the defining the
assessment base. Several commenters stated that the FDIC should delay the
implementation of the rulemaking until the effect of the Basel Committee’s efforts on
changing the definition of Tier 1 capital is better known. The definition of regulatory
capital will remain unchanged without further rulemaking, and the FDIC believes that the
current regulatory capital ratio serves as a reasonable measure of capital adequacy until
the Basel Committee’s efforts are complete and the regulatory definition of Tier 1 capital
has been changed. The FDIC plans to reevaluate the cutoffs for scorecard measures

15
affected by any changes to the definition of regulatory capital once a new capital
regulation is adopted and implemented.
The concentration measure score equals the higher of the two scores that make up
the concentration measure, as does the credit quality score.16 The concentration measure
score is based on the higher of the higher-risk assets to Tier 1 capital and reserves score
or the growth-adjusted portfolio concentrations measure score. Both measures are
described in detail in Appendix C. The credit quality measure score is based upon the
higher of the criticized and classified items to Tier 1 capital and reserves score or the
underperforming assets to Tier 1 capital and reserves score.17
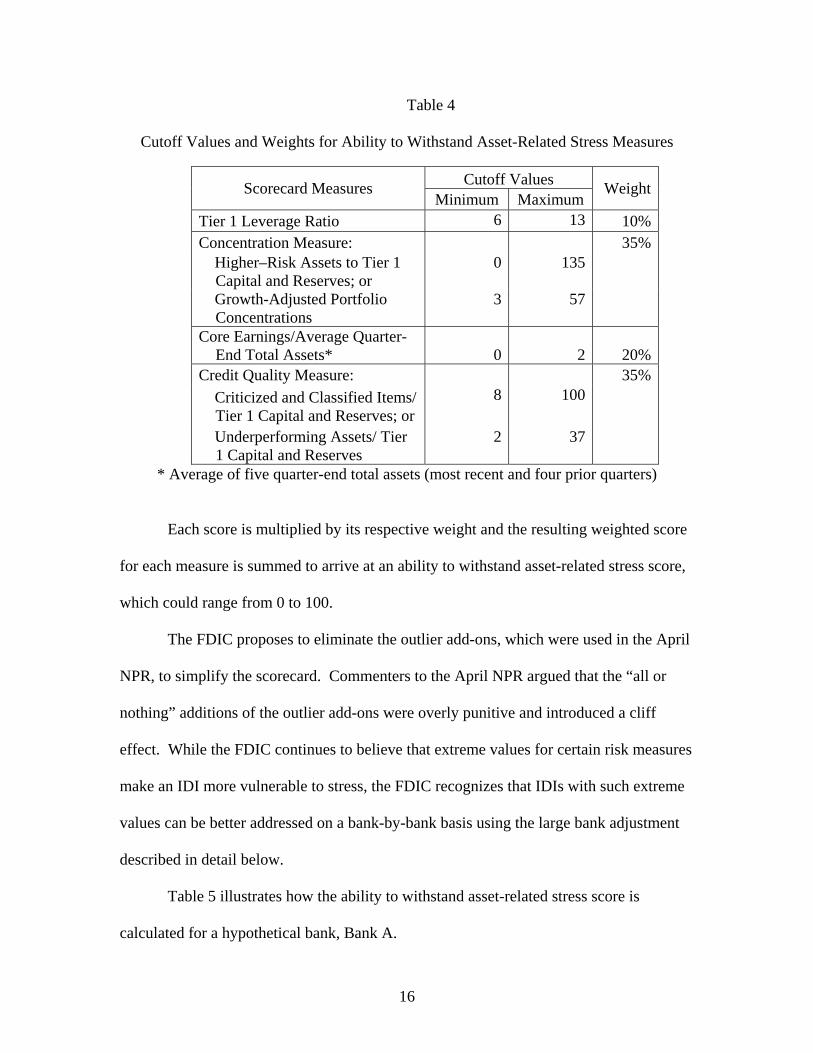
Table 4 shows the ability to withstand asset related stress measures, gives the
cutoff values for each measure and shows the weight assigned to the measure to derive a
score for an IDI’s ability to withstand asset-related stress. Appendix B describes how
each of the risk measures is converted to a score between 0 and 100 based upon the
minimum and maximum cutoff values.18
16 The ratio of higher-risk assets to Tier 1 capital and reserves gauges concentrations that are currently deemed to be high risk. The growth-adjusted portfolio concentration measure does not solely consider high-risk portfolios, but considers most loan portfolio concentrations. 17 The criticized and classified items ratio measures commercial credit quality while the underperforming assets ratio is often a better indicator for consumer portfolios. 18 Cutoff values are rounded to the nearest integer. Most of the minimum and maximum cutoff values for each risk measure equal the 10th and 90th percentile values of the measure among large IDIs based upon data from the period between the first quarter of 2000 and the fourth quarter of 2009. The 10th and 90th percentiles are not used for the higher-risk assets to Tier 1 capital and reserves measure and the criticized and classified items ratio due to data availability. Data on the higher-risk assets to Tier 1 capital and reserves measure are available consistently since second quarter 2008, while criticized and classified items are available consistently since first quarter 2007. The maximum cut off value for the higher-risk assets to Tier 1 capital and reserves measure is close to but does not equal the 75th percentile. The maximum cutoff value for the criticized and classified items ratio is close to but does not equal the 80th percentile value. These alternative cutoff values are partly based on recent experience. Appendix 1 includes information regarding the percentile values for each risk measure.
16
Table 4
Cutoff Values and Weights for Ability to Withstand Asset-Related Stress Measures
Cutoff Values Scorecard Measures
Minimum Maximum Weight
Tier 1 Leverage Ratio 6 13 10% Concentration Measure: 35% Higher–Risk Assets to Tier 1
Capital and Reserves; or 0 135
Growth-Adjusted Portfolio Concentrations
3 57
Core Earnings/Average Quarter-End Total Assets* 0
2
20%
Credit Quality Measure: 35%
Criticized and Classified Items/ Tier 1 Capital and Reserves; or
8 100
Underperforming Assets/ Tier 1 Capital and Reserves
2 37
* Average of five quarter-end total assets (most recent and four prior quarters)
Each score is multiplied by its respective weight and the resulting weighted score
for each measure is summed to arrive at an ability to withstand asset-related stress score,
which could range from 0 to 100.
The FDIC proposes to eliminate the outlier add-ons, which were used in the April
NPR, to simplify the scorecard. Commenters to the April NPR argued that the “all or
nothing” additions of the outlier add-ons were overly punitive and introduced a cliff
effect. While the FDIC continues to believe that extreme values for certain risk measures
make an IDI more vulnerable to stress, the FDIC recognizes that IDIs with such extreme
values can be better addressed on a bank-by-bank basis using the large bank adjustment
described in detail below.
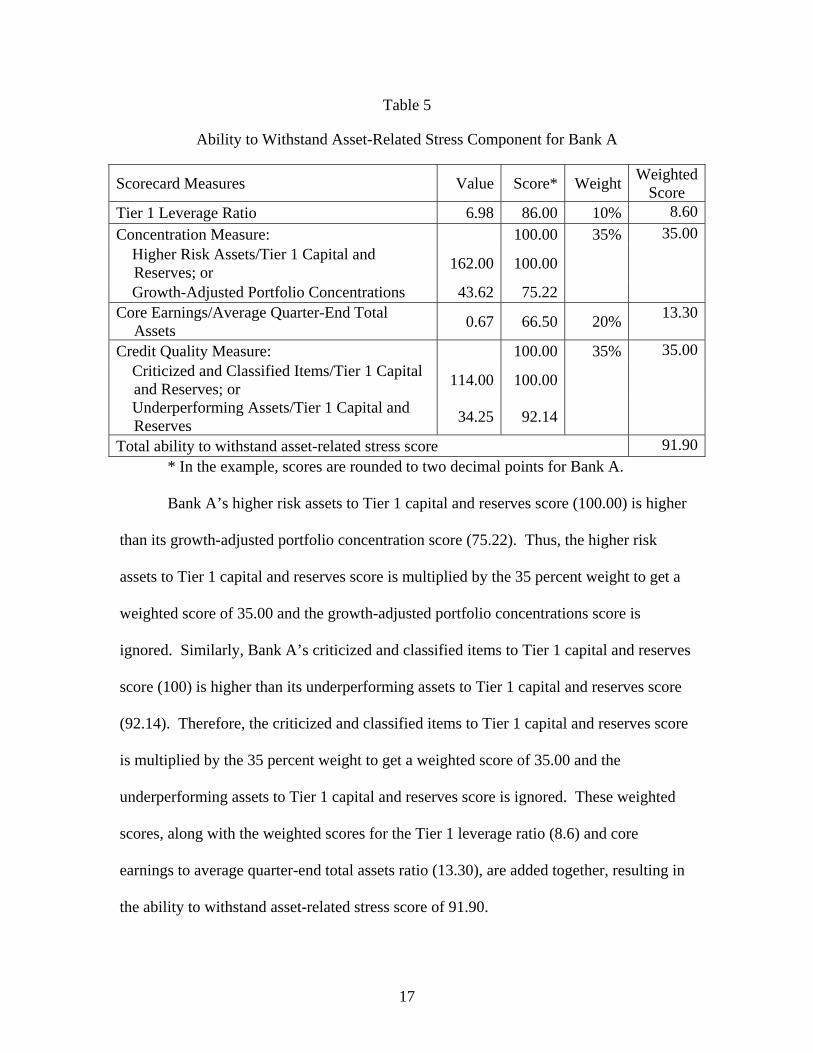
Table 5 illustrates how the ability to withstand asset-related stress score is
calculated for a hypothetical bank, Bank A.
17
Table 5
Ability to Withstand Asset-Related Stress Component for Bank A
Scorecard Measures Value Score* Weight Weighted
Score Tier 1 Leverage Ratio 6.98 86.00 10% 8.60
Concentration Measure: 100.00 35% 35.00 Higher Risk Assets/Tier 1 Capital and
Reserves; or 162.00 100.00
Growth-Adjusted Portfolio Concentrations 43.62 75.22 Core Earnings/Average Quarter-End Total
Assets 0.67 66.50 20%
13.30
Credit Quality Measure: 100.00 35% 35.00 Criticized and Classified Items/Tier 1 Capital
and Reserves; or 114.00 100.00
Underperforming Assets/Tier 1 Capital and
Reserves 34.25 92.14
Total ability to withstand asset-related stress score 91.90 * In the example, scores are rounded to two decimal points for Bank A. Bank A’s higher risk assets to Tier 1 capital and reserves score (100.00) is higher
than its growth-adjusted portfolio concentration score (75.22). Thus, the higher risk
assets to Tier 1 capital and reserves score is multiplied by the 35 percent weight to get a
weighted score of 35.00 and the growth-adjusted portfolio concentrations score is
ignored. Similarly, Bank A’s criticized and classified items to Tier 1 capital and reserves
score (100) is higher than its underperforming assets to Tier 1 capital and reserves score
(92.14). Therefore, the criticized and classified items to Tier 1 capital and reserves score
is multiplied by the 35 percent weight to get a weighted score of 35.00 and the
underperforming assets to Tier 1 capital and reserves score is ignored. These weighted
scores, along with the weighted scores for the Tier 1 leverage ratio (8.6) and core
earnings to average quarter-end total assets ratio (13.30), are added together, resulting in
the ability to withstand asset-related stress score of 91.90.

18
c. Ability to Withstand Funding-Related Stress
The ability to withstand funding-related stress component contains two measures
that are most relevant to assessing a large IDI’s ability to withstand such stress—a core
deposits to total liabilities ratio, and a balance sheet liquidity ratio, which measures the
amount of highly liquid assets to cover potential cash outflows in the event of stress.19
These ratios are significant in predicting a large IDI’s long-term performance in the
statistical test described in Appendix 1. Appendix A describes these ratios in detail and
provides the source of the data used to determine them. Appendix B describes how each
of these measures is converted to a score between 0 and 100.
The ability to withstand funding-related stress component score is the weighted
average of the two measure scores. Table 6 shows the cutoff values and weights for these
measures. Weights assigned to each of these two risk measures are based on statistical
analysis as described in detail in Appendix 1.
Table 6
Cutoff Values and Weights for Ability to Withstand Funding-Related Stress Measures
Cutoff Values Scorecard Measures
Minimum MaximumWeight
Core Deposits/Total Liabilities 3 79
60%
Balance Sheet Liquidity Ratio 7 188
40%
19 The FDIC has modified data elements included in the liquid assets to short-term liability ration proposed in the April NPR, and termed it as the balance sheet liquidity ratio to better reflect what the ratio is designed to capture. See Appendix A for detailed description.

19
Table 7 illustrates how the ability to withstand funding-related stress score is
calculated for a hypothetical bank, Bank A.
Table 7
Ability to Withstand Funding-Related Stress Component for Bank A
Scorecard Measures Value Score* Weight Weighted
Score Core Deposits/Total Liabilities 60.25 24.67 60% 14.80
Balance Sheet Liquidity Ratio 69.58 65.42 40% 26.17
Total ability to withstand funding-related stress score 40.97 * In the example, scores are rounded to 2 decimal points for Bank A
d. Calculation of Performance Score
The weighted average CAMELS score, the ability to withstand asset-related stress
score, and the ability to withstand funding-related stress score are then multiplied by their
respective weights and the results are summed to arrive at the performance score. This
score cannot be less than 0 or more than 100 under the proposal. In the example in Table
8, Bank A’s performance score would be 69.33, assuming that Bank A has a weighted
average CAMELS score of 50.6, which results from a weighed average CAMELS rating
of 2.2.
Table 8
Performance Score for Bank A
Performance Score Components Weight Score Weighted
Score
Weighted Average CAMELS Score 30% 50.60 15.18Ability to Withstand Asset-Related Stress Score 50% 91.90 45.95Ability to Withstand Funding-Related Stress Score 20% 40.97 8.20Total Performance Score 69.33
20
2. Loss Severity Score
The loss severity score measures the relative magnitude of potential losses to the
FDIC in the event of an IDI’s failure. It is based on two measures that are most relevant
to assessing an IDI’s potential losses—a loss severity measure and a ratio of noncore
funding to total liabilities.
The loss severity measure applies a standardized set of assumptions based on
recent failures regarding liability runoffs and the recovery value of asset categories to
calculate possible losses to the FDIC. (Appendix D describes the calculation of this
measure in detail.) Two commenters to the April NPR questioned the liability run-off
rate assumptions and asset loss rate assumptions used in the loss severity model given
that no statistical support was provided in the April NPR. Asset loss rate assumptions are
based on estimates of recovery values for IDIs that either failed or came close to a failure
during the 12 months preceding the issuance of the April NPR. Deposit run-off
assumptions are based on the actual experience of large IDIs that either failed or came
close to a failure during the 2007 through 2009 period.
The FDIC believes that heavy reliance on secured liabilities or other types of
noncore funding reduces an IDI’s potential franchise value, thereby increasing the
FDIC’s potential loss in the event of failure. Under the proposal, the FDIC includes a
ratio of noncore funding to total liabilities as a risk measure in the loss severity scorecard.
Both measures are quantitative measures that are derived from readily available data.
Appendix A defines these measures and provides the source of the data used to calculate
21
them. Appendix B describes how each of these risk measures is converted to a score
between 0 and 100.
The loss severity score is the weighted average of the loss severity measure and
the noncore funding to total liability ratio. Table 9 shows cutoff values and weights for
these measures. The loss severity score cannot be less than 0 or more than 100 under the
proposal.
The FDIC proposes that a 75 percent weight be assigned to the loss severity
measure and a 25 percent weight to the noncore funding to total liability ratio. The April
NPR considered two measures—the ratio of potential losses to total domestic deposits
and the ratio of secured liabilities to total domestic deposits—assigning an equal weight
to each measure to calculate the loss severity score. A commenter on the April NPR
stated that the loss severity measure should have a greater weight in the loss severity
score, arguing that the loss severity measure directly measures the potential effect of an
IDI’s failure on the DIF. The FDIC agrees. This proposal also replaces the secured
liabilities to total domestic deposits ratio with the noncore funding to total liabilities ratio.
The FDIC believes that noncore funding, which, among others, includes brokered
deposits, large time deposits and foreign deposits in addition to secured liabilities, is a
better predictor of potential franchise value than secured liabilities alone.
22
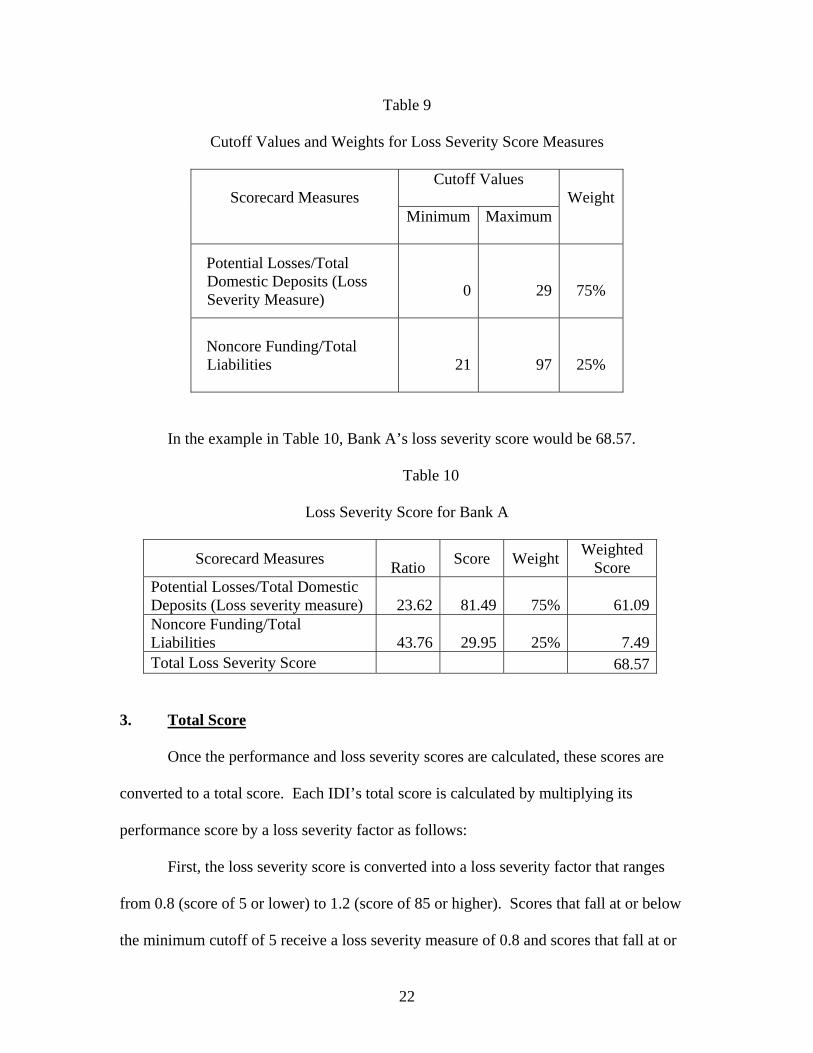
Table 9
Cutoff Values and Weights for Loss Severity Score Measures
Cutoff Values Scorecard Measures
Minimum MaximumWeight
Potential Losses/Total Domestic Deposits (Loss Severity Measure)
0 29
75%
Noncore Funding/Total Liabilities 21 97
25%
In the example in Table 10, Bank A’s loss severity score would be 68.57.
Table 10
Loss Severity Score for Bank A
Scorecard Measures Ratio
Score Weight Weighted
Score Potential Losses/Total Domestic Deposits (Loss severity measure) 23.62 81.49 75% 61.09 Noncore Funding/Total Liabilities 43.76 29.95 25% 7.49 Total Loss Severity Score 68.57
3. Total Score
Once the performance and loss severity scores are calculated, these scores are
converted to a total score. Each IDI’s total score is calculated by multiplying its
performance score by a loss severity factor as follows:
First, the loss severity score is converted into a loss severity factor that ranges
from 0.8 (score of 5 or lower) to 1.2 (score of 85 or higher). Scores that fall at or below
the minimum cutoff of 5 receive a loss severity measure of 0.8 and scores that fall at or
23
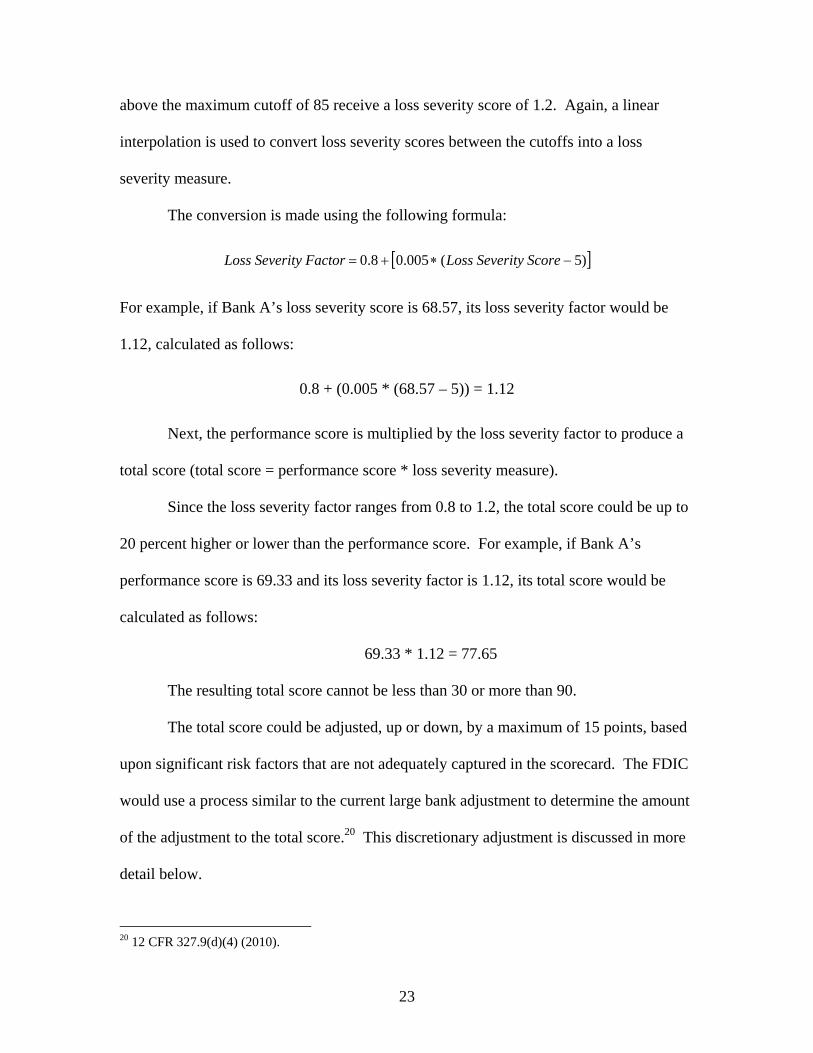
above the maximum cutoff of 85 receive a loss severity score of 1.2. Again, a linear
interpolation is used to convert loss severity scores between the cutoffs into a loss
severity measure.
The conversion is made using the following formula:
)5(005.08.0 Score Severity Loss Factor Severity Loss
For example, if Bank A’s loss severity score is 68.57, its loss severity factor would be
1.12, calculated as follows:
0.8 + (0.005 * (68.57 – 5)) = 1.12
Next, the performance score is multiplied by the loss severity factor to produce a
total score (total score = performance score * loss severity measure).
Since the loss severity factor ranges from 0.8 to 1.2, the total score could be up to
20 percent higher or lower than the performance score. For example, if Bank A’s
performance score is 69.33 and its loss severity factor is 1.12, its total score would be
calculated as follows:
69.33 * 1.12 = 77.65
The resulting total score cannot be less than 30 or more than 90.
The total score could be adjusted, up or down, by a maximum of 15 points, based
upon significant risk factors that are not adequately captured in the scorecard. The FDIC
would use a process similar to the current large bank adjustment to determine the amount
of the adjustment to the total score.20 This discretionary adjustment is discussed in more
detail below.
20 12 CFR 327.9(d)(4) (2010).

24
4. Initial Base Assessment Rate
A large IDI with a total score of 30 would pay the minimum initial base
assessment rate and a large IDI with a total score of 90 would pay the maximum initial
base assessment rate; for total scores between 30 and 90, initial base assessment rates
would rise at an increasing rate as the total score increased.21, 22 The initial base
assessment rate (in basis points) is calculated using the following formula:23
Rate MinimumRate Maximum
ScoreRate MinimumRate 0385.0
1004245.1
3
The calculation of an initial base assessment rate is based on an approximated
statistical relationship between an IDI’s total score and its estimated three-year
cumulative failure probability, as shown in Appendix 2.
Chart 2 illustrates the initial base assessment rate for a range of total scores,
assuming minimum and maximum initial base assessment rates of 5 basis points and 35
basis points, respectively.
21 The score of 30 and 90 equals about the 13th and about the 99th percentile values, respectively, based on scorecard results as of first quarter 2006 through fourth quarter 2007. 22 The rates that the FDIC proposes to apply to large and highly complex IDIs pursuant to the large bank assessment system are set out in the Assessment Base NPR, which is being published concurrently with this NPR. See Federal Register pages ____, Notice of Proposed Rulemaking. 23 The initial base assessment rate would be rounded to two decimal points.

25
Chart 2
Proposed Initial Base Assessment Rates
0
5
10
15
20
25
30
35
30 35 40 45 50 55 60 65 70 75 80 85 90Total Score
Initial Assessment Rate (bps)
The initial base assessment rate could be adjusted as a result of the unsecured debt
adjustment, the depository institution debt adjustment, and the brokered deposit
adjustment, as discussed in the Assessment Base NPR.
B. Scorecard for Highly Complex Institutions
As mentioned above, those institutions that are structurally and operationally
complex or that pose unique challenges and risks in case of failure (highly complex IDI)
have a different scorecard under the proposal. A “highly complex institution” is defined
as: (1) an IDI (excluding a credit card bank) that has had $50 billion or more in total
assets for at least four consecutive quarters that either is controlled by a parent company
that has had $500 billion or more in total assets for four consecutive quarters, or is
controlled by one or more intermediate parent companies that are controlled by a holding
26
company that has had $500 billion or more in assets for four consecutive quarters, or (2)
a processing bank or trust company that has had $10 billion or more in total assets for at
least four consecutive quarters.24 Under the proposal, highly complex IDIs have a
scorecard with measures tailored to the risks they pose.
The scorecard for a highly complex IDI is similar to the scorecard for other large
IDIs. Like the scorecard for other large IDIs, the scorecard for highly complex IDIs
contains a performance score and a loss severity score. Table 11 shows the scorecard
measures and their relative contribution to the performance score or loss severity score.
As with the scorecard for large IDIs, most of the minimum and maximum cutoff values
for each scorecard measure used in the highly complex IDI’s scorecard equal the 10th and
90th percentile values of the particular measure among these IDIs based upon data from
the period between the first quarter of 2000 and the fourth quarter of 2009.25
24 A parent company would have the same meaning as “depository institution holding company” in section 3(w) of the FDI Act. 12 USC 1813(w)(1)(2001). Control would have the same meaning as in section 2 of the Bank Holding Company Act of 1956. See 12 USC 1841(a)(2)(2001). A credit card bank would be defined as a bank for which credit card plus securitized receivables exceed 50 percent of assets plus securitized receivables. A processing bank or trust company would be defined as an institution whose last 3 years’ non-lending interest income plus fiduciary revenues plus investment fees exceed 50 percent of total revenues (and last 3 year’s fiduciary revenues are non-zero). 25 Some measures used in the highly complex IDI scorecard (and that are not used in the scorecard for other large IDIs) do not use the 10th and 90th percentile values as cutoffs due to lack of historical data. These measures include the following: top 20 counterparty exposures to Tier 1 capital and reserves, largest counterparty exposures to Tier 1 capital and reserves, and level 3 trading assets measures. The cutoffs for the top 20 counterparty exposures to Tier 1 capital and reserves, largest counterparty exposures to Tier 1 capital and reserves, and level 3 trading assets measures are based partly upon recent experience, but the minimum cutoffs range from just under the 5th and 10th percentile values and the maximum cutoffs range from the 80th to 85th percentile values of these measures among only highly complex IDIs from the period between the first quarter of 2000 and the fourth quarter of 2009.

27
Table 11
Scorecard for Highly Complex Institutions
Scorecard Measures Weights within
Component
ComponentWeights
P Performance Score P.1 Weighted Average CAMELS Rating 100% 30%
P.2 Ability to Withstand Asset-Related Stress: 50%
Tier 1 Leverage Ratio 10% Concentration Measure 35% Core Earnings/Average Quarter-End Total Assets 20% Credit Quality Measure and Market Risk Measure 35%
P.3 Ability to Withstand Funding-Related Stress 20%
Core Deposits/Total Liabilities 50% Balance Sheet Liquidity Ratio 30% Average Short-Term Funding/Average Total Assets 20% L Loss Severity Score
L.1 Loss Severity 100%
Potential Losses/Total Domestic Deposits (loss severity measure)
75%
Noncore Funding/Total Liabilities 25%
1. Performance Score
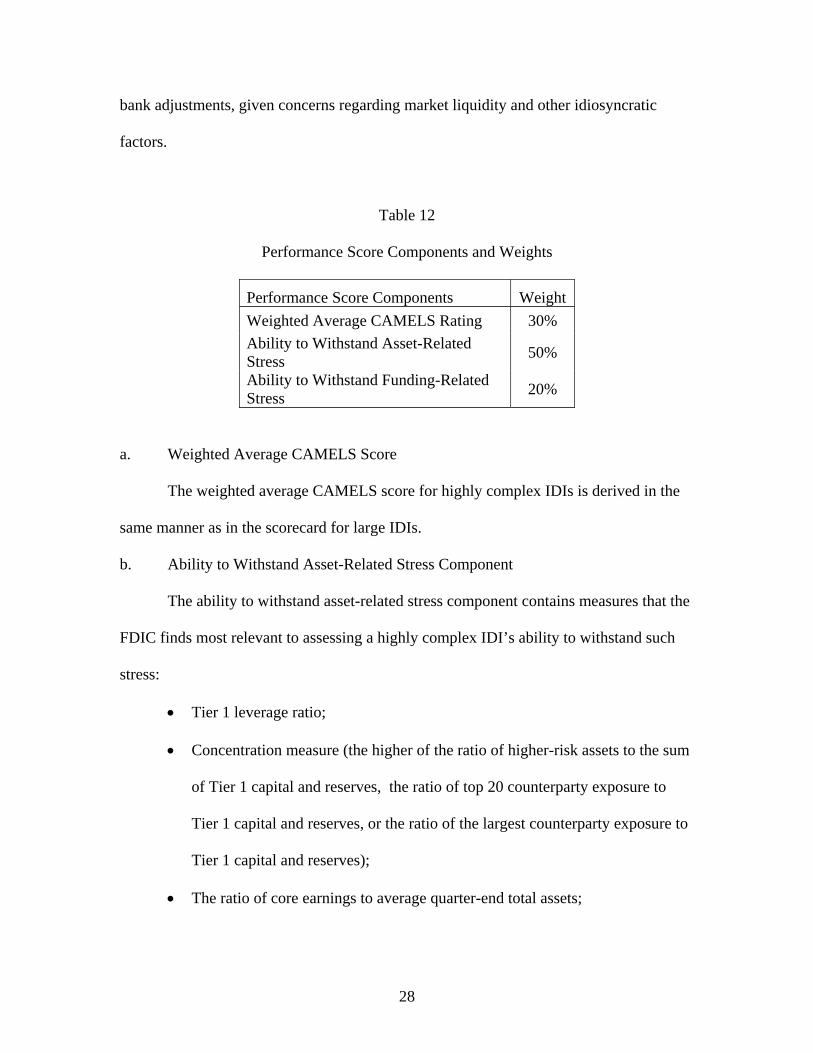
Table 12 gives the weights associated with the three components of the
performance scorecard for highly complex IDIs. The April NPR included a market
indicator—senior bond spreads—as one of the performance score components for highly
complex IDIs. While the FDIC continues to believe that market indicators provide
valuable market perspectives on a highly complex IDI’s performance, the FDIC thinks
that market indicators may be best considered on a bank-by bank case through the large
28
bank adjustments, given concerns regarding market liquidity and other idiosyncratic
factors.
Table 12
Performance Score Components and Weights
Performance Score Components Weight
Weighted Average CAMELS Rating 30%
Ability to Withstand Asset-Related Stress
50%
Ability to Withstand Funding-Related Stress
20%
a. Weighted Average CAMELS Score
The weighted average CAMELS score for highly complex IDIs is derived in the
same manner as in the scorecard for large IDIs.
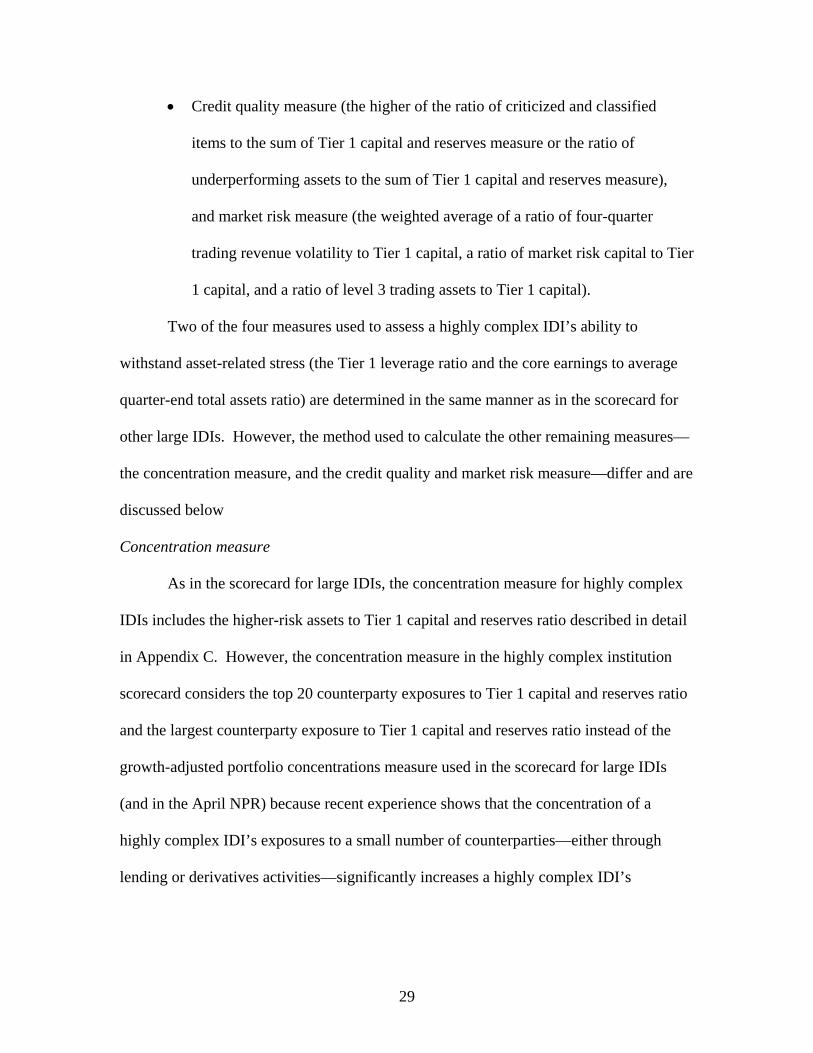
b. Ability to Withstand Asset-Related Stress Component
The ability to withstand asset-related stress component contains measures that the
FDIC finds most relevant to assessing a highly complex IDI’s ability to withstand such
stress:
Tier 1 leverage ratio;
Concentration measure (the higher of the ratio of higher-risk assets to the sum
of Tier 1 capital and reserves, the ratio of top 20 counterparty exposure to
Tier 1 capital and reserves, or the ratio of the largest counterparty exposure to
Tier 1 capital and reserves);
The ratio of core earnings to average quarter-end total assets;
29
Credit quality measure (the higher of the ratio of criticized and classified
items to the sum of Tier 1 capital and reserves measure or the ratio of
underperforming assets to the sum of Tier 1 capital and reserves measure),
and market risk measure (the weighted average of a ratio of four-quarter
trading revenue volatility to Tier 1 capital, a ratio of market risk capital to Tier
1 capital, and a ratio of level 3 trading assets to Tier 1 capital).
Two of the four measures used to assess a highly complex IDI’s ability to
withstand asset-related stress (the Tier 1 leverage ratio and the core earnings to average
quarter-end total assets ratio) are determined in the same manner as in the scorecard for
other large IDIs. However, the method used to calculate the other remaining measures—
the concentration measure, and the credit quality and market risk measure—differ and are
discussed below
Concentration measure
As in the scorecard for large IDIs, the concentration measure for highly complex
IDIs includes the higher-risk assets to Tier 1 capital and reserves ratio described in detail
in Appendix C. However, the concentration measure in the highly complex institution
scorecard considers the top 20 counterparty exposures to Tier 1 capital and reserves ratio
and the largest counterparty exposure to Tier 1 capital and reserves ratio instead of the
growth-adjusted portfolio concentrations measure used in the scorecard for large IDIs
(and in the April NPR) because recent experience shows that the concentration of a
highly complex IDI’s exposures to a small number of counterparties—either through
lending or derivatives activities—significantly increases a highly complex IDI’s

30
vulnerability to unexpected market events. The FDIC uses the top 20 counterparty
exposure and the largest counterparty exposure to capture such risk.
Credit quality measure and market risk measure
As in the scorecard for large IDIs, the ability to withstand asset-related stress
includes a credit quality measure. However, the highly complex institution scorecard
also includes a market risk measure that consists of three risk measures—trading revenue
volatility, market risk capital, and level 3 trading assets. All three risk measures are
calculated relative to a highly complex IDI’s Tier 1 capital and multiplied by their
respective weights to calculate the market risk measure. All three measures can be
calculated using data from an IDI’s quarterly Consolidated Reports of Condition and
Income (Call Reports) and Thrift Financial Reports (TFRs). The FDIC believes that
combining these three risk measures better captures a highly complex IDI’s market risk
than any single measure.
The trading revenue volatility measures the sensitivity of the IDI’s trading
revenue to market volatility. The market risk capital measure is largely based on
regulatory 10-day 99th percentile Value-at-Risk (VaR), but it incorporates specific market
risk and a multiplication factor to determine the capital charge, which accounts for the
number of days actual losses exceeded daily VaR measures, making the measure more
comparable across highly complex IDIs.26, 27, 28 Also, model-based risk metrics such as
26 Regulatory 10-day 99th percentile Value-at-Risk (VaR) is the estimate of the maximum amount that the value of covered positions could decline during a 10-day holding period within a 99th percent confidence level measured in accordance with section 4 of Appendix C of Part 325 of the FDIC Rules and Regulations. . http://www.fdic.gov/regulations/laws/rules/2000-4800.html#fdic2000appendixctopart325. 27 Specific risk as defined in Appendix C of Part 325 of the FDIC Rules and Regulations means changes in the market value of specific positions due to factors other than broad market movements and includes event and default risk as well as idiosyncratic variations. http://www.fdic.gov/regulations/laws/rules/2000-4800.html#fdic2000appendixctopart325.

31
VaR that rely on historical market prices would not be a good measure of market risk if
the IDI holds a large volume of hard-to-value trading assets. The more difficult it is to
value an IDI’s trading assets, the more approximations and substitutes are needed to
calculate the VaR, making the model results much less relevant. The level 3 trading
assets measure is a potential indicator of illiquidity in the trading book.
The FDIC recognizes that the relevance of credit risk and market risk in assessing
a highly complex IDI’s vulnerability to stress depends on the IDI’s asset composition.
An IDI with a significant amount of trading assets could be as risky as an IDI that focuses
on lending even though the primary source of risk may differ. In order to treat both types
of IDIs fairly, the FDIC proposes to assign a combined weight of 35 percent to the credit
risk measure and the market risk measure. The relative weight between the two may vary
depending on the ratio of average trading assets to the sum of average securities, loans,
and trading assets (the trading asset ratio) as follows:
Weight for Credit Quality Measure = (1 – Trading Asset Ratio) * 0.35
Weight for Market Risk Measure = Trading Asset Ratio * 0.35
Table 14 shows cutoff values and weights for the ability to withstand asset-related
stress measures.
28 The multiplication factor is based on the number of exceptions based on backtesting—the number of business days for which the magnitude of the actual daily net trading loss, if any, exceeds the corresponding daily VAR measures. The backtesting compares each of the IDI’s most recent 250 business days' actual net trading profit or loss with the corresponding daily VAR measures generated for internal risk measurement purposes and calibrated to a one-day holding period and a 99 percent, one-tailed confidence level. . http://www.fdic.gov/regulations/laws/rules/2000-4800.html#fdic2000appendixctopart325.

32
Table 14
Cutoff Values and Weights for Ability to Withstand Asset-Related Stress Measures
Cutoff Values
Scorecard Measures Minimum Maximum
Sub-Component
Weight Weight
Tier 1 Leverage Ratio 6 13 10%Concentration Measure: 35%
Higher Risk Assets/Tier 1 Capital and Reserves; 0 135 Top 20 Counterparty Exposure/Tier 1 Capital and Reserves; or 0 125 Largest Counterparty Exposure/Tier 1 Capital and Reserves 0 20
Core Earnings/Average Quarter-end Total Assets 0 2 20%
Credit Quality Measure*:
35% * (1-Trading Asset
Ratio) Criticized and Classified
Items to Tier 1 Capital and Reserves; or 8 100
Underperforming Assets/Tier 1 Capital and Reserves 2 37
Market Risk Measure*: 35% * Trading
Asset RatioTrading Revenue Volatility/Tier 1 Capital 0 2 60%Market Risk Capital/Tier 1 Capital 0 10 20%Level 3 Trading Assets/Tier 1 Capital 0 35 20%
* Combined, the credit quality measure and the market risk measure will be assigned a 35 percent weight. The relative weight between the two measures will depend on the ratio of average trading assets to sum of average securities, loans and trading assets (trading asset ratio).
c. Ability to Withstand Funding-Related Stress Component
The ability to withstand funding-related stress component contains three measures
that are most relevant to assessing a highly complex IDI’s ability to withstand such

33
stress—a core deposits to total liabilities ratio, a balance sheet liquidity ratio, and an
average short-term assets to average total assets ratio.29
Two of the measures (the core deposits to total liabilities ratio and the balance
sheet liquidity ratio) in the ability to withstand funding-related stress component are
determined in the same manner as in the scorecard for large IDIs, although their weights
differ. However, the ability to withstand funding-related stress component in the highly
complex institution scorecard adds an additional measure—the average short-term
funding to average total assets ratio—because experience during the recent crisis shows
that heavy reliance on short-term funding significantly increases a highly complex IDI’s
vulnerability to unexpected adverse developments in the funding market.
Table 15 shows cutoff values and weights for the ability to withstand funding-
related stress measures.
Table 15
Cutoff Values and Weights for Ability to Withstand Funding-Related Stress Measures
Cutoff Values
Scorecard Measures Minimum Maximum
Weight
Core Deposits/Total Liabilities
3 79 50%
Balance Sheet Liquidity Ratio
7 188 30% Average Short-term Funding/Average Total Assets 0 20 20%
29 The FDIC has modified data elements included in the liquid assets to short-term liability ration proposed in the April NPR, and termed it as the balance sheet liquidity ratio to better reflect what the ratio is designed to capture. See Appendix A for detailed description.

34
d. Calculating the Performance Score
To calculate the performance score for a highly complex IDI, the weighted
average CAMELS score, the ability to withstand asset-related stress score, and the ability
to withstand funding-related stress score are multiplied by their respective weights and
the results are summed to arrive at the performance score. The performance score is
capped at 100 under the proposal.
2. The Loss Severity Score
The loss severity score for highly complex IDIs is calculated the same way as the
loss severity score for other large IDIs.
3. Total Score and Initial Base Assessment Rate
The total score and the initial base assessment rate for highly complex IDIs are
calculated in the same manner as for other large IDIs, as described above. As is the case
for other large IDIs, the total score cannot be less than 30 or more than 90. The total
score for highly complex IDIs could be adjusted, up or down, by a maximum of 15
points, based upon significant risk factors that are not adequately captured in the
scorecard. The resulting score, however, cannot be less than 30 or more than 90. The
FDIC would use a process similar to the current large bank adjustment to determine the
amount of any adjustments.30 This discretionary adjustment is discussed in more detail
below.
As in the case of other large IDIs, the initial base assessment rate could also be
adjusted as a result of the unsecured debt adjustment, the depository institution debt
30 12 CFR 327.9(d)(4)(2010).
35
adjustment, and the brokered deposit adjustment as discussed in the Assessment Base
NPR.
C. Large Bank Adjustment to the Total Score
Although the proposed scorecards should improve the relative risk ranking of
large IDIs, the FDIC proposes that it have the ability to adjust the total score for all large
IDIs, up or down, by a maximum of 15 points, based upon significant risk factors that are
not captured in the scorecard. This discretionary adjustment would be similar to the
assessment rate adjustment that large IDIs and insured branches of foreign banks within
Risk Category I are subject to under current rules.31 In the April NPR, the FDIC
proposed that it have the ability to make discretionary adjustments to the performance
score and loss severity score of up to 15 points each. A number of commenters stated
that these potential discretionary adjustments were too large, too subjective, and not
transparent.
The FDIC believes that it is important that it have ability to consider idiosyncratic
factors or other relevant risk factors that are not included in the scorecards when
assessing the probability of failure and potential loss given failure. The FDIC
acknowledges, however, that the discretionary adjustment process could be streamlined
by applying the adjustment to the total score, rather than having potential adjustments to
both the performance score and the loss severity score, while still providing the FDIC
with flexibility to give sufficient weight to the idiosyncratic factors or other risk factors
not included in the scorecard.
31 12 CFR 327.9(d)(4) (2010).
36
In determining whether to make a large bank adjustment, the FDIC may
consider such information as financial performance and condition information and other
market or supervisory information. The FDIC would also consult with an IDI’s primary
federal regulator and, for state chartered institutions, state banking supervisor.
The FDIC acknowledges the need to clarify its processes for making any
adjustments to ensure fair treatment and accountability and plans to propose and seek
comment on updated guidelines for evaluating whether assessment rate adjustments are
warranted and the size of the adjustments. The FDIC will not adjust assessment rates
until the updated guidelines are approved by the FDIC’s Board. In addition, the FDIC
will publish aggregate statistics on adjustments each quarter.
In general, the adjustments to the total score would have a proportionally greater
effect on the assessment rate of those IDIs with a higher total score since the assessment
rate rises at an increasing rate as the total score rises as shown in Chart 1.

37
D. Appeals Process
Notifications involving an upward adjustment to an IDI’s assessment rate would
be made in advance of implementing such an adjustment so that the IDI has an
opportunity to respond to or address the FDIC’s rationale for proposing an upward
adjustment. Adjustments would be implemented after considering the IDI’s response to
the notification and considering any subsequent changes either to the inputs or other risk
factors that relate to the FDIC’s decision. Procedures and timetables for the appeals
process are described in detail on the FDIC’s website and can be found using the
following link:
http://www.fdic.gov/deposit/insurance/assessments/requests_review.html.
E. Data Source
In most cases, the FDIC proposes to use data that are currently publicly available
to compute scorecard measures. Data elements required to compute four scorecard
measures—higher-risk assets, top 20 counterparty exposures, the largest counterparty
exposure and criticized/classified items—are currently gathered during the examination
process. Rather than relying on the examination process as proposed in the April NPR,
the FDIC proposes that the data elements for these four scorecard measures be collected
directly from IDIs. The FDIC anticipates that the necessary changes would be made to
Call Reports and TFRs beginning with second quarter of 2011. The data elements would
remain confidential.
F. Updating the Scorecard
The FDIC would have the flexibility to update the minimum and maximum cutoff
values used in each scorecard annually without further rulemaking as long as the method

38
of selecting cut-off values remains unchanged. As stated earlier, the cutoff values are
generally based on the 10th and 90th percentile values for the ten-year period ending in
2009. In particular, the FDIC could add new data for subsequent years to its analysis and
could, from time to time, exclude some earlier years from its analysis. Updating the
minimum and maximum cutoff values and weights will allow the FDIC to use the most
recent data, thereby improving the accuracy of the scorecard method.
On the other hand, if, as a result of its review and analysis, the FDIC concludes
that additional or alternative measures should be used to determine risk-based
assessments, that the method of selecting cutoff values should be revised, that the weights
assigned to the scorecard measures should be recalibrated, or that a new method should
be used to differentiate risk among large IDIs or highly complex IDIs, these changes
would be made through a future rulemaking.
Financial ratios for any given quarter will continue to be calculated from the Call
Reports and TFRs filed by each IDI as of the last day of the quarter. CAMELS
component rating changes will continue to be effective as of the date that the rating
change is transmitted to the IDI for purposes of determining assessment rates.32
32 Pursuant to existing supervisory practice, the FDIC does not assign a different component rating from that assigned by an institution’s primary federal regulator, even if the FDIC disagrees with a CAMELS component assigned by an institution’s primary federal regulator, unless: (1) the disagreement over the component rating also involves a disagreement over a CAMELS composite rating; and (2) the disagreement over the CAMELS composite rating is not a disagreement over whether the CAMELS composite rating should be a 1 or a 2. The FDIC has no plans to alter this practice.
39
II. Request for Comments
The FDIC seeks comment on every aspect of this proposed rule. In particular, the
FDIC seeks comment on the questions set out below. The FDIC asks that commenters
include reasons for their positions.33
1. Deposit Insurance Pricing System:
(a) Should the risk categories be eliminated as proposed?
(b) Should the two scorecards be combined?
(c) Should highly complex institutions be defined as proposed?
(d) Should the performance score and loss severity score be combined as
proposed?
(e) Should the initial base assessment rate be calculated as proposed?
2. Performance Scorecard:
(a) Are the proposed weights assigned to performance score components and
measures appropriate?
(b) Are the cutoff values for the risk measures appropriate?
(c) The proposal eliminates debt ratings as an input in calculating a large IDI’s
assessment rate. In the April NPR, the FDIC proposed using a senior bond
spread as a component of the highly complex IDI scorecard. The FDIC
decided against retaining that component in this proposal because of
comparability issues among IDIs. The FDIC considered including credit
default swap (CDS) spreads in the highly complex IDI scorecard, but the
proposal does not include them due to the limited number of trades. Is this
33 The FDIC may not address all of the questions posed in the current rulemaking in the final rule, but may consider the information gathered in future actions.
40
concern serious enough not to include the CDS spreads in the scorecard?
What other market-based measures (credit, equity or others), if any, would
enhance the proposed pricing system?Should any other measures be added?
Should any measures be removed or replaced?
(d) Should the growth-adjusted portfolio concentration measure be computed as
proposed? Are the risk weights assigned to each portfolio as described in
Appendix C appropriate?
(e) For the higher-risk concentration measure, should concentrations in other
portfolios be considered?
(f) Should counterparty exposures be defined as proposed?
(g) Should the balance sheet liquidity ratio be computed as proposed?
(h) Should other risk measures be calculated as proposed?
3. Loss Severity Scorecard:
(a) Are asset haircuts and runoff assumptions for the loss severity measure as
described in Appendix D appropriate?
(b) Are asset adjustments due to liability runoff and capital reductions as
described in Appendix D applied appropriately?
(c) Are the proposed weights assigned to loss severity measures appropriate?
(d) Are cut-off values for risk measures appropriate?
(e) Should any other measures be added? Should any measures be removed or
replaced?
(f) Should other risk measures be calculated as proposed?
4. Regulatory Matters:

41
(a) What is the extent of regulatory burden of the proposed large bank deposit
insurance pricing system?
(b) Are the requirements in the proposed regulation clearly stated? If not, how
could the regulation be more clearly stated?
(c) Does the proposed regulation contain language or jargon that is not clear? If
so, which language requires clarification?
III. Regulatory Analysis and Procedure
A. Solicitation of Comments on Use of Plain Language
Section 722 of the Gramm-Leach-Bliley Act, Public Law 106-102, 113 Stat.
1338, 1471 (Nov. 12, 1999), requires the federal banking agencies to use plain language
in all proposed and final rules published after January 1, 2000. The FDIC invites your
comments on how to make this proposal easier to understand. For example:
• Has the FDIC organized the material to suit your needs? If not, how could this
material be better organized?
• Are the requirements in the proposed regulation clearly stated? If not, how could the
regulation be more clearly stated?
• Does the proposed regulation contain language or jargon that is not clear? If so,
which language requires clarification?
• Would a different format (grouping and order of sections, use of headings,
paragraphing) make the regulation easier to understand? If so, what changes to the
format would make the regulation easier to understand?
• What else could the FDIC do to make the regulation easier to understand?
42
B. Regulatory Flexibility Act
The Regulatory Flexibility Act (RFA) requires that each federal agency either
certify that a proposed rule would not, if adopted in final form, have a significant
economic impact on a substantial number of small entities or prepare an initial regulatory
flexibility analysis of the rule and publish the analysis for comment.34 For RFA purposes
a small institution is defined as one with $175 million or less in assets. As of June 30,
2010, of the 7,839 insured commercial banks and savings associations, there were 4,299
small insured depository institutions, as that term is defined for purposes of the RFA.
The proposed rule, however, would apply only to institutions with $10 billion or greater
in total assets. Consequently, small institutions will experience no significant economic
impact should the FDIC implement the proposed large bank assessment system.
C. Paperwork Reduction Act
No collections of information pursuant to the Paperwork Reduction Act of 1995,
44 U.S.C. 3501-3521 (PRA), are contained in the proposed rule.
D. The Treasury and General Government Appropriations Act, 1999 – Assessment of Federal Regulations and Policies on Families The FDIC has determined that the proposed rule will not affect family well-being
within the meaning of section 654 of the Treasury and General Government
Appropriations Act, enacted as part of the Omnibus Consolidated and Emergency
Supplemental Appropriations Act of 1999 (Public Law 105-277, 112 Stat. 2681).
E. List of Subjects in 12 CFR Part 327
Bank deposit insurance, Banks, Banking, Savings associations
34 See 5 U.S.C. 603, 604 and 605.
43
Part 327 – Assessments
1. For the reasons set forth in the preamble and the Assessment Base NPR published
concurrently with this Notice Of Proposed Rulemaking, the FDIC proposes to amend
chapter III of title 12 of the Code of Federal Regulations as follows:
2. The authority citation for Part 327 is amended to read as follows:
12 U.S.C. 1441, 1813, 1815, 1817-19, 1821.
3. Amend § 327.4 of Subpart A by revising paragraph (c) to read as follows:
* * * * *
(c) Requests for review. An institution that believes any assessment risk assignment
provided by the Corporation pursuant to paragraph (a) of this section is incorrect and
seeks to change it must submit a written request for review of that risk assignment. An
institution cannot request review through this process of the CAMELS ratings assigned
by its primary federal regulator or challenge the appropriateness of any such rating; each
federal regulator has established procedures for that purpose. An institution may also
request review of a determination by the FDIC to assess the institution as a large, highly
complex, or a small institution (§ 327.9(d)(9)) or a determination by the FDIC that the
institution is a new institution (§ 327.9(d)(10)). Any request for review must be submitted
within 90 days from the date the assessment risk assignment being challenged pursuant to
paragraph (a) of this section appears on the institution's quarterly certified statement
invoice. The request shall be submitted to the Corporation's Director of the Division of
Insurance and Research in Washington, DC, and shall include documentation sufficient
to support the change sought by the institution. If additional information is requested by
44
the Corporation, such information shall be provided by the institution within 21 days of
the date of the request for additional information. Any institution submitting a timely
request for review will receive written notice from the Corporation regarding the outcome
of its request. Upon completion of a review, the Director of the Division of Insurance and
Research (or designee) or the Director of the Division of Supervision and Consumer
Protection (or designee) or any successor divisions, as appropriate, shall promptly notify
the institution in writing of his or her determination of whether a change is warranted. If
the institution requesting review disagrees with that determination, it may appeal to the
FDIC's Assessment Appeals Committee. Notice of the procedures applicable to appeals
will be included with the written determination.
4. Amend § 327.4 of Subpart A by revising paragraph (f) to read as follows:
* * * * *
(f) Effective date for changes to risk assignment. Changes to an insured institution's
risk assignment resulting from a supervisory ratings change become effective as of the
date of written notification to the institution by its primary federal regulator or state
authority of its supervisory rating (even when the CAMELS component ratings have not
been disclosed to the institution), if the FDIC, after taking into account other information
that could affect the rating, agrees with the rating. If the FDIC does not agree, the FDIC
will notify the institution of the FDIC’s supervisory rating; resulting changes to an
insured institution's risk assignment become effective as of the date of written
notification to the institution by the FDIC.
5. Revise § 327.5 to read as follows:

45
§ 327.5 Assessment base.
(a) Assessment base for all insured depository institutions. Except as provided in
subsections (b), (c), and (d) of this section, the assessment base for an insured depository
institution shall equal the average consolidated total assets of the insured depository
institution during the assessment period minus the average tangible equity of the insured
depository institution during the assessment period.
(1) Average consolidated total assets defined and calculated. Average
consolidated total assets is defined in the schedule of quarterly averages in the
Consolidated Reports of Condition and Income, using a daily averaging method. The
amounts to be reported as daily averages are the sum of the gross amounts of
consolidated total assets for each calendar day during the quarter divided by the number
of calendar days in the quarter. For days that an office of the reporting institution (or any
of its subsidiaries or branches) is closed (e.g., Saturdays, Sundays, or holidays), the
amounts outstanding from the previous business day would be used. An office is
considered closed if there are no transactions posted to the general ledger as of that date.
For institutions that begin operating during the calendar quarter, the amounts to be
reported as daily averages are the sum of the gross amounts of consolidated total assets
for each calendar day the institution was operating during the quarter divided by the
number of calendar days the institution was operating during the quarter.
(2) Average tangible equity defined and calculated. Tangible equity is defined in
the schedule of regulatory capital as Tier 1 capital. The definition of Tier 1 capital is to
be determined pursuant to the definition the Report of Condition or Thrift Financial
46
Report (or any successor reports) instructions as of the assessment period for which the
assessment is being calculated.
(i) Calculation of average tangible equity. Except as provided in paragraph (ii)
below, average tangible equity shall be calculated using monthly averaging. Monthly
averaging means the average of the three month-end balances within the quarter.
(ii) Alternate calculation of average tangible equity. Institutions that reported less
than $1 billion in quarter-end total consolidated assets on their March 31, 2011
Reports of Condition or Thrift Financial Reports may report average tangible equity
using an end-of-quarter balance or may at any time opt permanently to report average
tangible equity using a monthly average balance. An institution that reports average
tangible equity using an end-of-quarter balance and reports average daily
consolidated assets of $1 billion or more for two consecutive quarters shall
permanently report average tangible equity using monthly averaging starting in the
next quarter.
(3) Consolidated subsidiaries.
(i) Data for reporting from consolidated subsidiaries. Insured depository
institutions may use data that are up to 93 days old for consolidated subsidiaries when
reporting daily average consolidated total assets. Insured depository institutions may use
either daily average asset values for the consolidated subsidiary for the current quarter or
for the prior quarter (that is, data that are up to 93 days old), but, once chosen, insured
depository institutions cannot change the reporting method from quarter to quarter.
Similarly, insured depository institutions may use data for the current quarter or data that
are up to 93 days old for consolidated subsidiaries when reporting tangible equity values.

47
Once chosen, however, insured depository institutions cannot change the reporting
method from quarter to quarter.
(ii) Reporting for insured depository institutions with consolidated insured
depository subsidiaries. Insured depository institutions that consolidate other insured
depository institutions for financial reporting purposes shall report daily average
consolidated total assets and tangible equity without consolidating their insured
depository institution subsidiaries into the calculations. Investments in insured
depository institution subsidiaries should be included in total assets using the equity
method of accounting.
(b) Assessment base for banker’s banks.
(1) Bankers bank defined. A banker’s bank for purposes of calculating deposit
insurance assessments shall meet the definition of banker’s bank set forth in 12 U.S.C.
24.
(2) Self-certification. Institutions that meet the requirements of paragraph (b)(1) of
this section shall so certify each quarter on the Consolidated Reports of Condition and
Income or Thrift Financial Report to that effect.
(3) Assessment base calculation for banker’s banks. A banker’s bank shall pay
deposit insurance assessments on its assessment base as calculated in paragraph (a) of
this section provided that it conducts 50 percent or more of its business with entities other
than its parent holding company or entities other than those controlled either directly or
indirectly (under the Bank Holding Company Act or Home Owners’ Loan Act) by its
parent holding company, the FDIC will exclude from that assessment base the daily
average reserve balances passed through to the Federal Reserve, the daily average reserve
48
balances held at the Federal Reserve for its own account, and the daily average amount of
its federal funds sold, but in no case shall the amount excluded exceed the sum of the
bank’s daily average amount of total deposits of commercial banks and other depository
institutions in the United States and the daily average amount of its federal funds
purchased.
(c) Assessment base for custodial banks.
(1) Custodial bank defined. A custodial bank for purposes of calculating deposit
insurance assessments shall be an insured depository institution with previous calendar-
year custody and safekeeping assets of at least $50 billion or an insured depository
institution that derived more than 50 percent of its total revenue from custody and
safekeeping activities over the previous calendar year.
(2) Assessment base calculation for custodial banks. A custodial bank shall pay
deposit insurance assessments on its assessment base as calculated in paragraph (a) of
this section, but the FDIC will exclude from that assessment base the daily average
amount of highly liquid, short-term assets (i.e., assets with a Basel risk weighting of 20
percent or less and a stated maturity date of 30 days or less), subject to the limitation that
the daily average value of these assets cannot exceed the daily average value of the
deposits identified by the institution as being held in a custody and safekeeping account.
(d) Assessment base for insured branches of foreign banks. Average consolidated
total assets for an insured branch of a foreign bank is defined as total assets of the branch
(including net due from related depository institutions) in accordance with the schedule
of assets and liabilities in the Report of Assets and Liabilities of U.S. Branches and
Agencies of Foreign Banks as of the assessment period for which the assessment is being
49
calculated, but measured using the definition for reporting total assets in the schedule of
quarterly averages in the Consolidated Reports of Condition and Income, and calculated
using a daily averaging method. Tangible equity for an insured branch of a foreign bank
is eligible assets (determined in accordance with § 347.210 of the FDIC’s regulations)
less the book value of liabilities (exclusive of liabilities due to the foreign bank’s head
office, other branches, agencies, offices, or wholly owned subsidiaries) calculated on a
monthly or end-of-quarter basis.
(e) Newly insured institutions. A newly insured institution shall pay an assessment
for the assessment period during which it became insured. The FDIC will prorate the
newly insured institution’s assessment amount to reflect the number of days it was
insured during the period.
6. Amend § 327.6 of Subpart A by revising paragraphs (a) and (b) to read as follows:
§ 327.6 Mergers and consolidations; other terminations of insurance.
(a) Final quarterly certified invoice for acquired institution. An institution that is not the
resulting or surviving institution in a merger or consolidation must file a report of
condition for every assessment period prior to the assessment period in which the merger
or consolidation occurs. The surviving or resulting institution shall be responsible for
ensuring that these reports of condition are filed and shall be liable for any unpaid
assessments on the part of the institution that is not the resulting or surviving institution.
(b) Assessment for quarter in which the merger or consolidation occurs. For an
assessment period in which a merger or consolidation occurs, total consolidated assets for
50
the surviving or resulting institution shall include the total consolidated assets of all
insured depository institutions that are parties to the merger or consolidation as if the
merger or consolidation occurred on the first day of the quarter. Tier 1 capital shall be
reported in the same manner.
(c) Other termination. When the insured status of an institution is terminated, and the
deposit liabilities of such institution are not assumed by another insured depository
institution--
(1) Payment of assessments; quarterly certified statement invoices. The depository
institution whose insured status is terminating shall continue to file and certify its
quarterly certified statement invoice and pay assessments for the assessment period its
deposits are insured. Such institution shall not be required to certify its quarterly certified
statement invoice and pay further assessments after it has paid in full its deposit liabilities
and the assessment to the Corporation required to be paid for the assessment period in
which its deposit liabilities are paid in full, and after it, under applicable law, goes out of
business or transfers all or substantially all of its assets and liabilities to other institutions
or otherwise ceases to be obliged to pay subsequent assessments.
(2) Payment of deposits; certification to Corporation. When the deposit liabilities of
the depository institution have been paid in full, the depository institution shall certify to
the Corporation that the deposit liabilities have been paid in full and give the date of the
final payment. When the depository institution has unclaimed deposits, the certification
shall further state the amount of the unclaimed deposits and the disposition made of the

51
funds to be held to meet the claims. For assessment purposes, the following will be
considered as payment of the unclaimed deposits:
(i) The transfer of cash funds in an amount sufficient to pay the unclaimed and unpaid
deposits to the public official authorized by law to receive the same; or
(ii) If no law provides for the transfer of funds to a public official, the transfer of cash
funds or compensatory assets to an insured depository institution in an amount sufficient
to pay the unclaimed and unpaid deposits in consideration for the assumption of the
deposit obligations by the insured depository institution.
(3) Notice to depositors. (i) The depository institution whose insured status is
terminating shall give sufficient advance notice of the intended transfer to the owners of
the unclaimed deposits to enable the depositors to obtain their deposits prior to the
transfer. The notice shall be mailed to each depositor and shall be published in a local
newspaper of general circulation. The notice shall advise the depositors of the liquidation
of the depository institution, request them to call for and accept payment of their deposits,
and state the disposition to be made of their deposits if they fail to promptly claim the
deposits.
(ii) If the unclaimed and unpaid deposits are disposed of as provided in paragraph
(c)(2)(i) of this section, a certified copy of the public official's receipt issued for the funds
shall be furnished to the Corporation.
(iii) If the unclaimed and unpaid deposits are disposed of as provided in paragraph
(c)(2)(ii) of this section, an affidavit of the publication and of the mailing of the notice to

52
the depositors, together with a copy of the notice and a certified copy of the contract of
assumption, shall be furnished to the Corporation.
(4) Notice to Corporation. The depository institution whose insured status is
terminating shall advise the Corporation of the date on which it goes out of business or
transfers all or substantially all of its assets and liabilities to other institutions or
otherwise ceases to be obligated to pay subsequent assessments and the method whereby
the termination has been effected.
(d) Resumption of insured status before insurance of deposits ceases. If a depository
institution whose insured status has been terminated is permitted by the Corporation to
continue or resume its status as an insured depository institution before the insurance of
its deposits has ceased, the institution will be deemed, for assessment purposes, to
continue as an insured depository institution and must thereafter file and certify its
quarterly certified statement invoices and pay assessments as though its insured status
had not been terminated. The procedure for applying for the continuance or resumption of
insured status is set forth in § 303.248 of this chapter.
* * * * *
53
7. Amend § 327.8 of Subpart A by removing paragraphs (e) and (f), and redesignating
paragraphs (g) through (s) as paragraphs (e) through (q), as appropriate. Amend
redesignated paragraphs (e), (f), (g), (k), (l), (m), (n), (o), and (p) as follows, and add new
paragraphs (r), (s), (t), and (u) to read as follows:
§ 327.8 Definitions.
* * * * *
(e) Small Institution. An insured depository institution with assets of less than $10
billion as of December 31, 2006, and an insured branch of a foreign institution shall be
classified as a small institution. If, after December 31, 2006, an institution classified as
large under paragraph (f) of this section (other than an institution classified as large for
purposes of § 327.9(d)(9)) reports assets of less than $10 billion in its quarterly reports of
condition for four consecutive quarters, the FDIC will reclassify the institution as small
beginning the following quarter.
(f) Large Institution. An institution classified as large for purposes of § 327.9(d)(9)
or an insured depository institution with assets of $10 billion or more as of December 31,
2006 (other than an insured branch of a foreign bank or a highly complex institution)
shall be classified as a large institution. If, after December 31, 2006, an institution
classified as small under paragraph (e) of this section reports assets of $10 billion or more
in its quarterly reports of condition for four consecutive quarters, the FDIC will reclassify
the institution as large beginning the following quarter.
(g) Highly Complex Institution. A highly complex institution is an insured depository
institution (excluding a credit card bank) with greater than $50 billion in total assets for at
54
least four consecutive quarters that is controlled by a parent company with more than
$500 billion in total assets for four consecutive quarters, or controlled by one or more
intermediate parent companies that are controlled by a holding company with more than
$500 billion in assets for four consecutive quarters, or a processing bank or trust
company that has had $10 billion or more in total assets for at least four consecutive
quarters. If, after December 31, 2010, an institution classified as highly complex falls
below $50 billion in total assets in its quarterly reports of condition for four consecutive
quarters, or its parent company or companies fall below $500 billion in total assets for
four consecutive quarters, or a processing bank or trust company falls below $10 billion
in total assets in its quarterly reports of condition for four consecutive quarters, the FDIC
will reclassify the institution beginning the following quarter.
* * * * *
(k) Established depository institution. An established insured depository institution is
a bank or savings association that has been federally insured for at least five years as of
the last day of any quarter for which it is being assessed.
(1) Merger or consolidation involving new and established institution(s). Subject to
paragraphs (k)(2), (3), (4), and (5) of this section and § 327.9(d)(10)(iii), (iv), when an
established institution merges into or consolidates with a new institution, the resulting
institution is a new institution unless:
(i) The assets of the established institution, as reported in its report of condition for
the quarter ending immediately before the merger, exceeded the assets of the new
institution, as reported in its report of condition for the quarter ending immediately before
the merger; and

55
(ii) Substantially all of the management of the established institution continued as
management of the resulting or surviving institution.
(2) Consolidation involving established institutions. When established institutions
consolidate, the resulting institution is an established institution.
(3) Grandfather exception. If a new institution merges into an established institution,
and the merger agreement was entered into on or before July 11, 2006, the resulting
institution shall be deemed to be an established institution for purposes of this part.
(4) Subsidiary exception. Subject to paragraph (k)(5) of this section, a new institution
will be considered established if it is a wholly owned subsidiary of:
(i) A company that is a bank holding company under the Bank Holding Company Act
of 1956 or a savings and loan holding company under the Home Owners' Loan Act, and:
(A) At least one eligible depository institution (as defined in 12 CFR 303.2(r)) that is
owned by the holding company has been chartered as a bank or savings association for at
least five years as of the date that the otherwise new institution was established; and
(B) The holding company has a composite rating of at least "2" for bank holding
companies or an above average or "A" rating for savings and loan holding companies and
at least 75 percent of its insured depository institution assets are assets of eligible
depository institutions, as defined in 12 CFR 303.2(r); or
(ii) An eligible depository institution, as defined in 12 CFR 303.2(r), that has been
chartered as a bank or savings association for at least five years as of the date that the
otherwise new institution was established.
(5) Effect of credit union conversion. In determining whether an insured depository

56
institution is new or established, the FDIC will include any period of time that the
institution was a federally insured credit union.
(l) Risk assignment. For all small institutions and insured branches of foreign banks,
risk assignment includes assignment to Risk Category I, II, III, or IV, and, within Risk
Category I, assignment to an assessment rate or rates. For all large institutions and highly
complex institutions, risk assignment includes assignment to an assessment rate or rates.
(m) Unsecured debt - For purposes of the unsecured debt adjustment as set forth in §
327.9(d)(6) and the depository institution debt adjustment as set forth in § 327.9(d)(7),
unsecured debt shall include senior unsecured liabilities and subordinated debt.
(n) Senior unsecured liability – For purposes of the unsecured debt adjustment as set
forth in § 327.9(d)(6) and the depository institution debt adjustment as set forth in §
327.9(d)(7), senior unsecured liabilities shall be the unsecured portion of other borrowed
money as defined in the quarterly report of condition for the reporting period as defined
in paragraph (b) of this section, but shall not include any senior unsecured debt that the
FDIC has guaranteed under the Temporary Liquidity Guarantee Program, 12 CFR Part
370.
(o) Subordinated debt – For purposes of the unsecured debt adjustment as set forth in
§ 327.9(d)(6) and the depository institution debt adjustment as set forth in § 327.9(d)(7),
subordinated debt shall be as defined in the quarterly report of condition for the reporting
period; however, subordinated debt shall also include limited-life preferred stock as
defined in the quarterly report of condition for the reporting period.

57
(p) Long-term unsecured debt – For purposes of the unsecured debt adjustment as set
forth in § 327.9(d)(6) and the depository institution debt adjustment as set forth in §
327.9(d)(7), long-term unsecured debt shall be unsecured debt with at least one year
remaining until maturity.
* * * * *
(r) Parent holding company – A parent holding company is a bank holding company
under the Bank Holding Company Act of 1956 or a savings and loan holding company
under the Home Owners’ Loan Act.
(s) Processing bank or trust company – A processing bank or trust company is an
institution whose non-lending interest income, fiduciary revenues, and investment
banking fees, combined, exceed 50 percent of total revenues (and its fiduciary revenues
are non-zero), and has had $10 billion or more in total assets for at least four consecutive
quarters.
(t) Credit Card Bank – A credit card bank is a bank for which credit card plus
securitized receivables exceed 50 percent of assets plus securitized receivables.
(u) Control – Control has the same meaning as in section 2 of the Bank Holding
Company Act of 1956, 12 U.S.C. 1841(a)(2).
8. Amend § 327.9 of Subpart A to read as follows:
§ 327.9 Assessment risk categories and pricing methods.
(a) Risk Categories.--Each small insured depository institution and each insured

58
branch of a foreign bank shall be assigned to one of the following four Risk Categories
based upon the institution's capital evaluation and supervisory evaluation as defined in
this section.
(1) Risk Category I. Small institutions in Supervisory Group A that are Well
Capitalized;
(2) Risk Category II. Small institutions in Supervisory Group A that are Adequately
Capitalized, and institutions in Supervisory Group B that are either Well Capitalized or
Adequately Capitalized;
(3) Risk Category III. Small institutions in Supervisory Groups A and B that are
Undercapitalized, and institutions in Supervisory Group C that are Well Capitalized or
Adequately Capitalized; and
(4) Risk Category IV. Small institutions in Supervisory Group C that are
Undercapitalized.
(b) Capital evaluations. Each small institution and each insured branch of a foreign
bank will receive one of the following three capital evaluations on the basis of data
reported in the institution's Consolidated Reports of Condition and Income, Report of
Assets and Liabilities of U.S. Branches and Agencies of Foreign Banks, or Thrift
Financial Report dated as of March 31 for the assessment period beginning the preceding
January 1; dated as of June 30 for the assessment period beginning the preceding April 1;
dated as of September 30 for the assessment period beginning the preceding July 1; and
dated as of December 31 for the assessment period beginning the preceding October 1.
(1) Well Capitalized. (i) Except as provided in paragraph (b)(1)(ii) of this section, a
Well Capitalized institution is one that satisfies each of the following capital ratio
59
standards: Total risk-based ratio, 10.0 percent or greater; Tier 1 risk-based ratio, 6.0
percent or greater; and Tier 1 leverage ratio, 5.0 percent or greater.
(ii) For purposes of this section, an insured branch of a foreign bank will be deemed
to be Well Capitalized if the insured branch:
(A) Maintains the pledge of assets required under § 347.209 of this chapter; and
(B) Maintains the eligible assets prescribed under § 347.210 of this chapter at 108
percent or more of the average book value of the insured branch's third-party liabilities
for the quarter ending on the report date specified in paragraph (b) of this section.
(2) Adequately Capitalized. (i) Except as provided in paragraph (b)(2)(ii) of this
section, an Adequately Capitalized institution is one that does not satisfy the standards of
Well Capitalized under this paragraph but satisfies each of the following capital ratio
standards: Total risk-based ratio, 8.0 percent or greater; Tier 1 risk-based ratio, 4.0
percent or greater; and Tier 1 leverage ratio, 4.0 percent or greater.
(ii) For purposes of this section, an insured branch of a foreign bank will be deemed
to be Adequately Capitalized if the insured branch:
(A) Maintains the pledge of assets required under § 347.209 of this chapter; and
(B) Maintains the eligible assets prescribed under § 347.210 of this chapter at 106
percent or more of the average book value of the insured branch's third-party liabilities
for the quarter ending on the report date specified in paragraph (b) of this section; and
(C) Does not meet the definition of a Well Capitalized insured branch of a foreign
bank.
(3) Undercapitalized. An undercapitalized institution is one that does not qualify as
either Well Capitalized or Adequately Capitalized under paragraphs (b)(1) and (b)(2) of

60
this section.
(c) Supervisory evaluations. Each small institution and each insured branch of a
foreign bank will be assigned to one of three Supervisory Groups based on the
Corporation's consideration of supervisory evaluations provided by the institution's
primary federal regulator. The supervisory evaluations include the results of examination
findings by the primary federal regulator, as well as other information that the primary
federal regulator determines to be relevant. In addition, the Corporation will take into
consideration such other information (such as state examination findings, as appropriate)
as it determines to be relevant to the institution's financial condition and the risk posed to
the Deposit Insurance Fund. The three Supervisory Groups are:
(1) Supervisory Group "A." This Supervisory Group consists of financially sound
institutions with only a few minor weaknesses;
(2) Supervisory Group "B." This Supervisory Group consists of institutions that
demonstrate weaknesses which, if not corrected, could result in significant deterioration
of the institution and increased risk of loss to the Deposit Insurance Fund; and
(3) Supervisory Group "C." This Supervisory Group consists of institutions that pose
a substantial probability of loss to the Deposit Insurance Fund unless effective corrective
action is taken.
(d) Determining Assessment Rates for Insured Depository Institutions. A small
insured depository institution in Risk Category I shall have its initial base assessment rate
determined using the financial ratios method set forth in paragraph (d)(1) of this section.
An insured branch of a foreign bank in Risk Category I shall have its assessment rate
determined using the weighted average ROCA component rating method set forth in
61
paragraph (d)(2) of this section. A large insured depository institution shall have its
initial base assessment rate determined using the large institution method set forth in
paragraph (d)(3) of this section. A highly complex insured depository institution shall
have its initial base assessment rate determined using the highly complex institution
method set forth at paragraph (d)(4) of this section.
(1) Financial ratios method. (i) Under the financial ratios method for small Risk
Category I institutions, each of six financial ratios and a weighted average of CAMELS
component ratings will be multiplied by a corresponding pricing multiplier. The sum of
these products will be added to a uniform amount. The resulting sum shall equal the
institution’s initial base assessment rate; provided, however, that no institution’s initial
base assessment rate shall be less than the minimum initial base assessment rate in effect
for Risk Category I institutions for that quarter nor greater than the maximum initial base
assessment rate in effect for Risk Category I institutions for that quarter. An institution’s
initial base assessment rate, subject to adjustment pursuant to paragraphs (d)(6), (7), and
(8) of this section, as appropriate (resulting in the institution’s total base assessment rate,
which in no case can be lower than 50 percent of the institution’s initial base assessment
rate), and adjusted for the actual assessment rates set by the Board under § 327.10(f), will
equal an institution's assessment rate. The six financial ratios are: Tier 1 Leverage Ratio;
Loans past due 30--89 days/gross assets; Nonperforming assets/gross assets; Net loan
charge-offs/gross assets; Net income before taxes/risk-weighted assets; and the Adjusted
brokered deposit ratio. The ratios are defined in Table A.1 of Appendix A to this subpart.
The ratios will be determined for an assessment period based upon information contained
in an institution's report of condition filed as of the last day of the assessment period as

62
set out in § 327.9(b). The weighted average of CAMELS component ratings is created by
multiplying each component by the following percentages and adding the products:
Capital adequacy--25%, Asset quality--20%, Management--25%, Earnings--10%,
Liquidity--10%, and Sensitivity to market risk--10%. The following table sets forth the
initial values of the pricing multipliers:
Risk Measures* Pricing Multipliers**
Tier 1 Leverage Ratio (0.056) Loans Past Due 30 – 89 Days/Gross Assets 0.575 Nonperforming Assets/Gross Assets 1.074 Net Loan Charge-Offs/Gross Assets 1.210 Net Income before Taxes/Risk-Weighted Assets (0.764) Adjusted brokered deposit ratio Weighted Average CAMELS Component Rating
0.065 1.095
* Ratios are expressed as percentages. ** Multipliers are rounded to three decimal places.
(ii) The six financial ratios and the weighted average CAMELS component rating will be
multiplied by the respective pricing multiplier, and the products will be summed. To this
result will be added the uniform amount. The resulting sum shall equal the institution’s
initial base assessment rate; provided, however, that no institution’s initial base
assessment rate shall be less than the minimum initial base assessment rate in effect for
Risk Category I institutions for that quarter nor greater than the maximum initial base
assessment rate in effect for Risk Category I institutions for that quarter.
(iii) Uniform amount and pricing multipliers. Except as adjusted for the actual
assessment rates set by the Board under §327.10(f), the uniform amount shall be:
(A) 4.861 whenever the assessment rate schedule set forth in § 327.10(a) is in effect;
(B) 2.861 whenever the assessment rate schedule set forth in § 327.10(b) is in effect;
(C) 1.861 whenever the assessment rate schedule set forth in § 327.10(c) is in effect; or
63
(D) 0.861 whenever the assessment rate schedule set forth in § 327.10(d) is in effect.
(iv) Implementation of CAMELS rating changes--(A) Changes between risk
categories. If, during a quarter, a CAMELS composite rating change occurs that results in
an institution whose Risk Category I assessment rate is determined using the financial
ratios method moving from Risk Category I to Risk Category II, III or IV, the institution's
initial base assessment rate for the portion of the quarter that it was in Risk Category I
shall be determined using the supervisory ratings in effect before the change and the
financial ratios as of the end of the quarter, subject to adjustment pursuant to paragraphs
(d)(6), (7), and (8) of this section, as appropriate, and adjusted for the actual assessment
rates set by the Board under §327.10(f). For the portion of the quarter that the institution
was not in Risk Category I, the institution's initial base assessment rate, which shall be
subject to adjustment pursuant to paragraphs (d)(6), (7), and (8), shall be determined
under the assessment schedule for the appropriate Risk Category. If, during a quarter, a
CAMELS composite rating change occurs that results in an institution moving from Risk
Category II, III or IV to Risk Category I, and its initial base assessment rate will be
determined using the financial ratios method, then that method shall apply for the portion
of the quarter that it was in Risk Category I, subject to adjustment pursuant to paragraphs
(d)(6), (7) and (8) of this section, as appropriate, and adjusted for the actual assessment
rates set by the Board under § 327.10(f). For the portion of the quarter that the institution
was not in Risk Category I, the institution's initial base assessment rate, which shall be
subject to adjustment pursuant to paragraphs (d)(6), (7), and (8) of this section shall be
determined under the assessment schedule for the appropriate Risk Category.
64
(B) Changes within Risk Category I. If, during a quarter, an institution’s CAMELS
component ratings change in a way that will change the institution's initial base
assessment rate within Risk Category I, the initial base assessment rate for the period
before the change shall be determined under the financial ratios method using the
CAMELS component ratings in effect before the change, subject to adjustment pursuant
to paragraphs (d)(6), (7), and (8) of this section, as appropriate. Beginning on the date of
the CAMELS component ratings change, the initial base assessment rate for the
remainder of the quarter shall be determined using the CAMELS component ratings in
effect after the change, again subject to adjustment pursuant to paragraphs (d)(6), (7), and
(8) of this section, as appropriate.
(2) Assessment rate for insured branches of foreign banks--(i) Insured branches of
foreign banks in Risk Category I. Insured branches of foreign banks in Risk Category I
shall be assessed using the weighted average ROCA component rating.
(ii) Weighted average ROCA component rating. The weighted average ROCA
component rating shall equal the sum of the products that result from multiplying ROCA
component ratings by the following percentages: Risk Management--35%, Operational
Controls--25%, Compliance--25%, and Asset Quality--15%. The weighted average
ROCA rating will be multiplied by 5.076 (which shall be the pricing multiplier). To this
result will be added a uniform amount. The resulting sum - the initial base assessment
rate - will equal an institution's total base assessment rate; provided, however, that no
institution's total base assessment rate will be less than the minimum total base
assessment rate in effect for Risk Category I institutions for that quarter nor greater than
65
the maximum total base assessment rate in effect for Risk Category I institutions for that
quarter.
(iii) Uniform amount. Except as adjusted for the actual assessment rates set by the
Board under §327.10(f), the uniform amount for all insured branches of foreign banks
shall be:
(A) -3.127 whenever the assessment rate schedule set forth in § 327.10(a) is in effect;
(B) -5.127 whenever the assessment rate schedule set forth in § 327.10(b) is in effect;
(C) -6.127 whenever the assessment rate schedule set forth in § 327.10(c) is in effect; or
(D) -7.127 whenever the assessment rate schedule set forth in § 327.10(d) is in effect.
(iv) No insured branch of a foreign bank in any risk category shall be subject to the
adjustments in paragraphs (d)(5), (d)(6), or (d)(8) of this section.
(v) Implementation of changes between Risk Categories for insured branches of
foreign banks. If, during a quarter, a ROCA rating change occurs that results in an
insured branch of a foreign bank moving from Risk Category I to Risk Category II, III or
IV, the institution's initial base assessment rate for the portion of the quarter that it was in
Risk Category I shall be determined using the weighted average ROCA component
rating. For the portion of the quarter that the institution was not in Risk Category I, the
institution's initial base assessment rate shall be determined under the assessment
schedule for the appropriate Risk Category. If, during a quarter, a ROCA rating change
occurs that results in an insured branch of a foreign bank moving from Risk Category II,
III or IV to Risk Category I, the institution's assessment rate for the portion of the quarter
that it was in Risk Category I shall equal the rate determined as provided using the

66
weighted average ROCA component rating. For the portion of the quarter that the
institution was not in Risk Category I, the institution's initial base assessment rate shall be
determined under the assessment schedule for the appropriate Risk Category.
(vi) Implementation of changes within Risk Category I for insured branches of
foreign banks. If, during a quarter, an insured branch of a foreign bank remains in Risk
Category I, but a ROCA component rating changes that will affect the institution's initial
base assessment rate, separate assessment rates for the portion(s) of the quarter before
and after the change(s) shall be determined under this paragraph (d)(2) of this section.
(3) Assessment scorecard for large institutions (other than highly complex
institutions). (i) All large institutions other than highly complex institutions shall have
their quarterly assessments determined using the scorecard for large institutions.
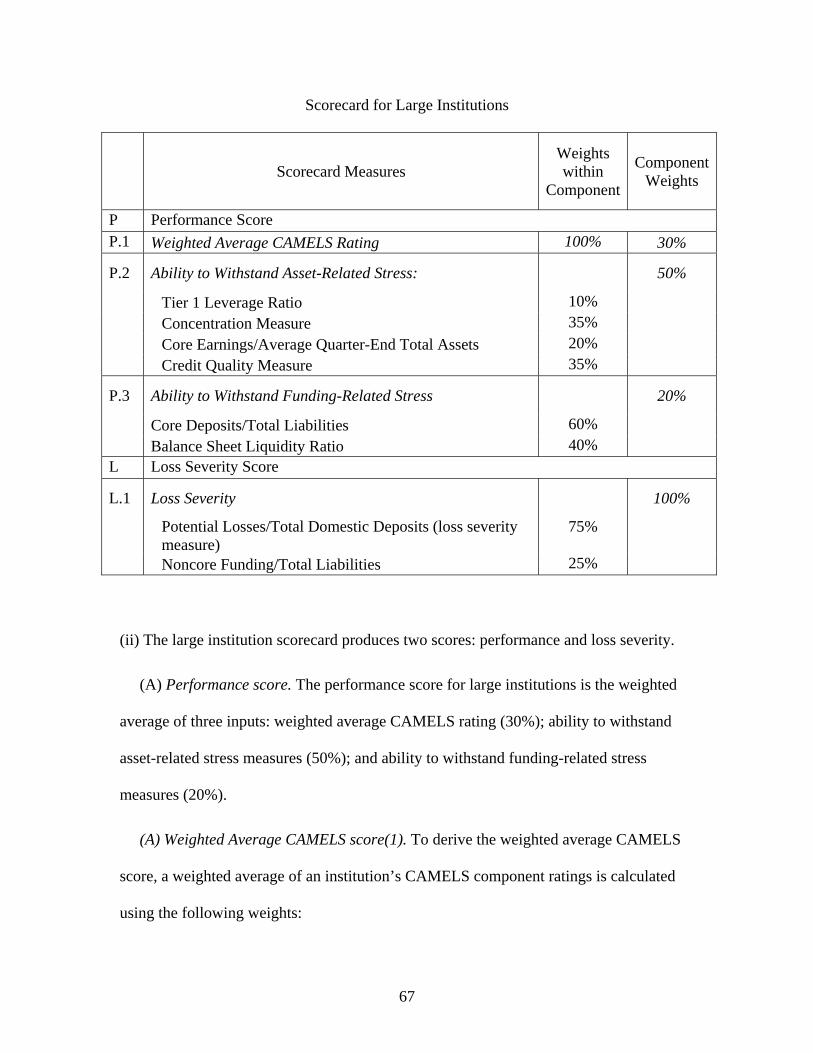
67
Scorecard for Large Institutions
Scorecard Measures Weights within
Component
ComponentWeights
P Performance Score P.1 Weighted Average CAMELS Rating 100% 30%
P.2 Ability to Withstand Asset-Related Stress: 50%
Tier 1 Leverage Ratio 10% Concentration Measure 35% Core Earnings/Average Quarter-End Total Assets 20% Credit Quality Measure 35%
P.3 Ability to Withstand Funding-Related Stress 20%
Core Deposits/Total Liabilities 60% Balance Sheet Liquidity Ratio 40% L Loss Severity Score
L.1 Loss Severity 100%
Potential Losses/Total Domestic Deposits (loss severity measure)
75%
Noncore Funding/Total Liabilities 25%
(ii) The large institution scorecard produces two scores: performance and loss severity.
(A) Performance score. The performance score for large institutions is the weighted
average of three inputs: weighted average CAMELS rating (30%); ability to withstand
asset-related stress measures (50%); and ability to withstand funding-related stress
measures (20%).
(A) Weighted Average CAMELS score(1). To derive the weighted average CAMELS
score, a weighted average of an institution’s CAMELS component ratings is calculated
using the following weights:

68
CAMELS Component Weight
C 25%
A 20%
M 25%
E 10%
L 10%
S 10%
(2) A weighted average CAMELS rating is converted to a score that ranges from 25 to
100. A weighted average rating of 1 equals a score of 25 and a weighted average of 3.5
or greater equals a score of 100. Weighted average CAMELS ratings between 1 and 3.5
are assigned a score between 25 and 100 according to the following equation:
)]1(*)3/20[(25 2 CS ,
where:
S = the weighted average CAMELS score and
C = the weighted average CAMELS rating.
(B) Ability to Withstand Asset-Related Stress. (1) The ability to withstand asset-
related stress component contains four measures: Tier 1 leverage ratio; Concentration
measure (the higher of the higher-risk assets to Tier 1 capital and reserves or growth-
adjusted portfolio concentrations measures); Core earnings to average quarter-end total
assets; and Credit quality measure (the higher of the criticized and classified assets to
Tier 1 capital and reserves or underperforming assets to Tier 1 capital and reserves).
Appendices A and C define these measures in detail and give the source of the data used
to determine them.
The concentration measure score is the higher of the scores of the two measures that
make up the concentration measure score (higher-risk assets to Tier 1 capital and reserves

69
measure or growth-adjusted portfolio concentrations measure). The credit quality
measure score is the higher of the criticized and classified items ratio score or the
underperforming assets ratio score. Each asset related stress measure is assigned the
following cutoff values and weights to derive a score for an institution’s ability to
withstand asset-related stress:
Cutoff Values and Weights for Ability to Withstand Asset-Related Stress Measures
Cutoff Values Scorecard Measures
Minimum Maximum
Weight
Tier 1 Leverage Ratio 6 13 10% Concentration Measure: 35% Higher-Risk Assets to Tier
1 capital and Reserves; or 0 135
Growth-Adjusted Portfolio Concentrations
3 57
Core Earnings/Average Quarter-End Total Assets
0 2 20%
Credit Quality Measure: 35% Criticized and Classified
Items/Tier 1 capital and Reserves; or
8 100
Underperforming Assets/ Tier 1 capital and Reserves
2 37
(2) For each of the risk measures within the ability to withstand asset-related stress
portion of the scorecard, a value reflecting lower risk than the cutoff value that results in
a score of 0 will also receive a score of 0, where 0 equals the lowest risk for that measure.
A value reflecting higher risk than the cutoff value that results in a score of 100 will also
receive a score of 100, where 100 equals the highest risk for that measure. A risk
measure value between the minimum and maximum cutoff values is converted linearly to
a score between 0 and 100 as shown in Appendix B.

70
Each score is multiplied by a respective weight and the resulting weighted score for each
measure is summed to arrive at an ability to withstand asset-related stress score, which
ranges from 0 to 100.
(C) Ability to Withstand Funding-Related Stress. The ability to withstand
funding-related stress component contains two risk measures: a core deposits to liabilities
ratio, and a balance sheet liquidity ratio. Appendix A describes these ratios in detail and
gives the source of the data used to determine them. Appendix B describes in detail how
each of these measures is converted to a score. The ability to withstand funding-related
stress component score is the weighted average of the two measure scores. Each measure
is assigned the following cutoff values and weights to derive a score for an institution’s
ability to withstand funding-related stress:
Cutoff Values and Weights for Ability to Withstand Funding-Related Stress Measures
Cutoff Values Scorecard Measures
Minimum MaximumWeight
Core Deposits/Total Liabilities
3 79 60%
Balance Sheet Liquidity Ratio 7 188 40%
(D) Calculation of Performance Score. The weighted average CAMELS score, the
ability to withstand asset-related stress score, and the ability to withstand funding-related

71
stress score are multiplied by their weights and the results are summed to arrive at the
performance score. The performance score cannot exceed 100.
(ii) Loss severity score. The loss severity score is based on two measures: the loss
severity measure and noncore funding to total liabilities ratio. Appendices A and D
describe these measures in detail and Appendix B describes how each of these measures
is converted to a score between 0 and 100. The loss severity score is the weighted
average of these two scores. Each measure is assigned the following cutoff values and
weights to derive a score for an institution’s loss severity score:
Cutoff Values and Weights for Loss Severity Score Measures
Cutoff Values Scorecard Measures
Minimum MaximumWeight
Potential Losses/Total Domestic Deposits (loss severity measure)
0 29 75%
Noncore Funding/Total Liabilities
21 97 25%
(iii) Total Score. The performance and loss severity scores are combined to produce a
total score. The loss severity score is converted into a loss severity factor that ranges
from 0.8 (score of 5 or lower) to 1.2 (score of 85 or higher). Scores that fall at or below
the minimum cutoff of 5 receive a loss severity measure of 0.8 and scores that fall at or
above the maximum cutoff of 85 receive a loss severity score of 1.2. The following
linear interpolation converts loss severity scores between the cutoffs into a loss severity
factor: ( )5(005.08.0 Score Severity Loss Factor Severity Loss . The performance
score is multiplied by the loss severity factor to produce a total score (total score =

72
performance score * loss severity factor). The total score cannot be less than 30 or more
than 90. The total score is subject to adjustment, up or down, by a maximum of 15
points, as set forth in section (d)(5). The resulting total score cannot be less than 30 or
more than 90.
(iv) Initial base assessment rate. A large institution with a total score of 30 pays the
minimum initial base assessment rate and an institution with a total score of 90 pays the
maximum initial base assessment rate. For total scores between 30 and 90, initial base
assessment rates rise at an increasing rate as the total score increases, calculated
according to the following formula:
Rate MinimumRate Maximum
ScoreRate MinimumRate 0385.0
1004245.1
3
where Rate is the initial base assessment rate (expressed in basis points), Maximum Rate
is the maximum initial base assessment rate then in effect (expressed in basis points), and
Minimum Rate is the minimum initial base assessment rate then in effect (expressed in
basis points). Initial base assessment rates are subject to adjustment pursuant to
paragraphs (d)(5), (d)(6), (d)(7), and (d)(8) of this section, resulting in the institution’s
total base assessment rate, which in no case can be lower than 50 percent of the
institution’s initial base assessment rate.
(4) Assessment scorecard for highly complex institutions – (i) All highly complex
institutions shall have their quarterly assessments determined using the scorecard for
highly complex institutions.
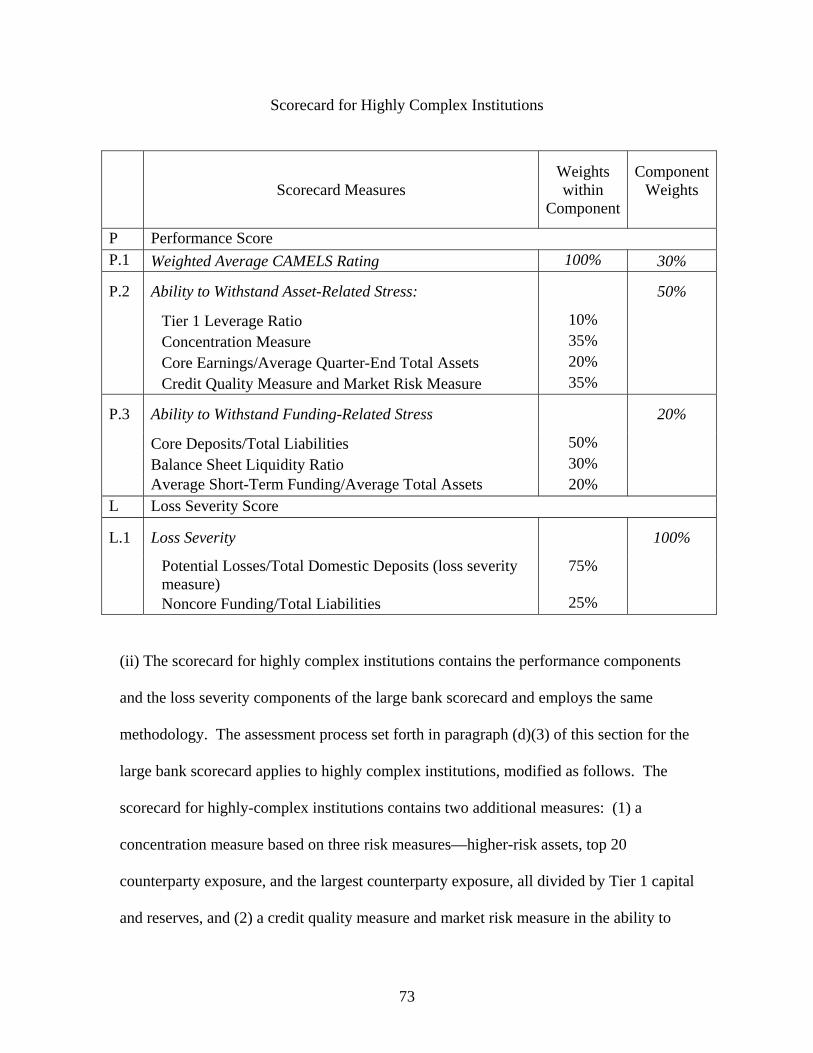
73
Scorecard for Highly Complex Institutions
Scorecard Measures Weights within
Component
ComponentWeights
P Performance Score P.1 Weighted Average CAMELS Rating 100% 30%
P.2 Ability to Withstand Asset-Related Stress: 50%
Tier 1 Leverage Ratio 10% Concentration Measure 35% Core Earnings/Average Quarter-End Total Assets 20% Credit Quality Measure and Market Risk Measure 35%
P.3 Ability to Withstand Funding-Related Stress 20%
Core Deposits/Total Liabilities 50% Balance Sheet Liquidity Ratio 30% Average Short-Term Funding/Average Total Assets 20% L Loss Severity Score
L.1 Loss Severity 100%
Potential Losses/Total Domestic Deposits (loss severity measure)
75%
Noncore Funding/Total Liabilities 25%
(ii) The scorecard for highly complex institutions contains the performance components
and the loss severity components of the large bank scorecard and employs the same
methodology. The assessment process set forth in paragraph (d)(3) of this section for the
large bank scorecard applies to highly complex institutions, modified as follows. The
scorecard for highly-complex institutions contains two additional measures: (1) a
concentration measure based on three risk measures—higher-risk assets, top 20
counterparty exposure, and the largest counterparty exposure, all divided by Tier 1 capital
and reserves, and (2) a credit quality measure and market risk measure in the ability to
74
withstand asset-related stress; and an additional component—average short-term funding
to average total assets ratio—in the ability to withstand funding-related stress.
(A) Performance score for highly complex institutions. A performance score for
highly complex institutions is the weighted average of three inputs: weighted average
CAMELS rating (30%); ability to withstand asset-related stress score (50%); and ability
to withstand funding-related stress score (20%). To calculate the performance score for
highly complex institutions, the weighted average CAMELS score, the ability to
withstand asset-related stress score, and the ability to withstand funding-related stress
score are multiplied by their weights and the results are summed to arrive at the
performance score. The resulting score cannot exceed 100.
(B) Ability to withstand asset-related stress. (1) The scorecard for highly complex
institutions substitutes the growth-adjusted concentration measure with the top 20
counterparty exposure and the largest counterparty exposure, adds one additional factor
to the ability to withstand asset-related stress component—the market risk measure—and
one additional factor to the ability to withstand funding-related stress component—the
average short-term funding to average total assets ratio. The cutoff values and weights
for ability to withstand asset-related stress measures are set forth below.
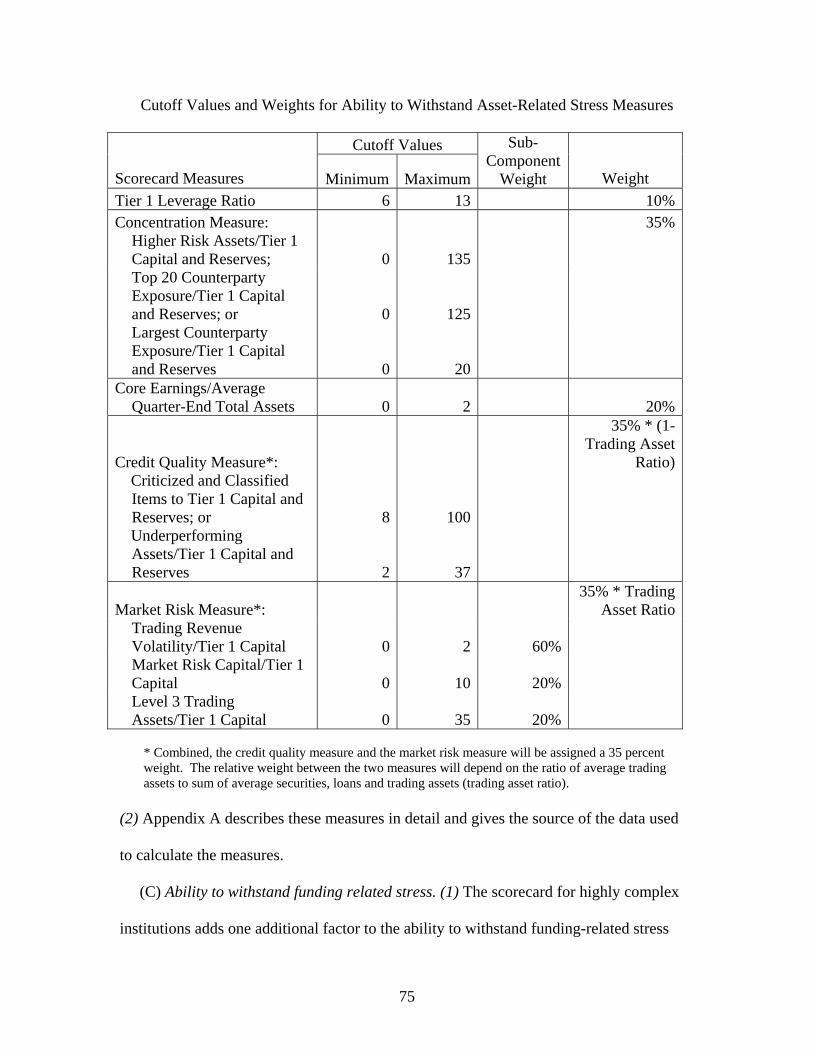
75
Cutoff Values and Weights for Ability to Withstand Asset-Related Stress Measures
Cutoff Values
Scorecard Measures Minimum Maximum
Sub-Component
Weight Weight
Tier 1 Leverage Ratio 6 13 10%Concentration Measure: 35%
Higher Risk Assets/Tier 1 Capital and Reserves; 0 135 Top 20 Counterparty Exposure/Tier 1 Capital and Reserves; or 0 125 Largest Counterparty Exposure/Tier 1 Capital and Reserves 0 20
Core Earnings/Average Quarter-End Total Assets 0 2 20%
Credit Quality Measure*:
35% * (1-Trading Asset
Ratio) Criticized and Classified
Items to Tier 1 Capital and Reserves; or 8 100
Underperforming Assets/Tier 1 Capital and Reserves 2 37
Market Risk Measure*: 35% * Trading
Asset RatioTrading Revenue Volatility/Tier 1 Capital 0 2 60%Market Risk Capital/Tier 1 Capital 0 10 20%Level 3 Trading Assets/Tier 1 Capital 0 35 20%
* Combined, the credit quality measure and the market risk measure will be assigned a 35 percent weight. The relative weight between the two measures will depend on the ratio of average trading assets to sum of average securities, loans and trading assets (trading asset ratio).
(2) Appendix A describes these measures in detail and gives the source of the data used
to calculate the measures.
(C) Ability to withstand funding related stress. (1) The scorecard for highly complex
institutions adds one additional factor to the ability to withstand funding-related stress

76
component—the average short-term funding to average total assets ratio. The cutoff
values and weights for ability to withstand funding-related stress measures for highly
complex institutions are set forth below.
Cutoff Values and Weights for Ability to Withstand Funding-Related Stress Measures
Cutoff Values Scorecard Measures
Minimum MaximumWeight
Core Deposits/Total Liabilities 3 79 50%
Balance Sheet Liquidity Ratio 7 188 30% Average Short-term Funding/Average Total Assets 0 20 20%
(2) Appendix A describes these measures in detail and gives the source of the data used
to calculate the measures.
(iv) Loss severity score for highly complex institutions. The loss severity score for
highly complex institutions is calculated as provided for the loss severity score for large
institutions in paragraph (d)(3)(ii) (of this section).
(vi) The performance score and the loss severity score are combined in the same
manner to calculate the total score as for large institutions as set forth in paragraph (d)(3)
of this section.
(vi) The initial base assessment rate for highly complex institutions is calculated from
the total score in the same manner as for large institutions as set forth in paragraph (d)(3)
of this section. Initial base assessment rates are subject to adjustment pursuant to
paragraphs (d)(5), (d)(6), (d)(7), and (d)(8) of this section, resulting in the institution’s
total base assessment rate, which in no case can be lower than 50 percent of the
institution’s initial base assessment rate.

77
(5) Adjustment to total score for large institutions and highly complex institutions.
The total score for large institutions and highly complex institutions is subject to
adjustment, up or down, by a maximum of 15 points, based upon significant risk factors
that are not adequately captured in the appropriate scorecard. In making such
adjustments, the FDIC may consider such information as financial performance and
condition information and other market or supervisory information.
(i) Prior notice of adjustments--(A) Prior notice of upward adjustment. Prior to
making any upward adjustment to an institution's total score because of considerations of
additional risk information, the FDIC will formally notify the institution and its primary
federal regulator and provide an opportunity to respond. This notification will include
the reasons for the adjustment(s) and when the adjustment(s) will take effect.
(B) Prior notice of downward adjustment. Prior to making any downward adjustment
to an institution's total score because of considerations of additional risk information, the
FDIC will formally notify the institution's primary federal regulator and provide an
opportunity to respond.
(ii) Determination whether to adjust upward; effective period of adjustment. After
considering an institution's and the primary federal regulator's responses to the notice, the
FDIC will determine whether the adjustment to an institution's total score is warranted,
taking into account any revisions to scorecard measures, as well as any actions taken by
the institution to address the FDIC's concerns described in the notice. The FDIC will
evaluate the need for the adjustment each subsequent assessment period. Except as
provided in paragraph (d)(5)(iv) of this section, the amount of adjustment cannot exceed
the proposed adjustment amount contained in the initial notice unless additional notice is
78
provided so that the primary federal regulator and the institution may respond.
(iii) Determination whether to adjust downward; effective period of adjustment. After
considering the primary federal regulator's responses to the notice, the FDIC will
determine whether the adjustment to total score is warranted, taking into account any
revisions to scorecard measures, as well as any actions taken by the institution to address
the FDIC's concerns described in the notice. Any downward adjustment in an institution's
total score will remain in effect for subsequent assessment periods until the FDIC
determines that an adjustment is no longer warranted. Downward adjustments will be
made without notification to the institution. However, the FDIC will provide advance
notice to an institution and its primary federal regulator and give them an opportunity to
respond before removing a downward adjustment.
(iv) Adjustment without notice. Notwithstanding the notice provisions set forth above,
the FDIC may change an institution’s total score without advance notice under this
paragraph, if the institution's supervisory ratings or the scorecard measures deteriorate.
(6) Unsecured debt adjustment to initial base assessment rate for all institutions. All
institutions, except new institutions as provided under paragraph (d)(10)(i)(C) of this
section and insured branches of foreign banks as provided under paragraph (d)(2)(iii) of
this section, are subject to an adjustment of assessment rates for unsecured debt. Any
unsecured debt adjustment shall be made after any adjustment under paragraph (d)(5) of
this section.
(i) Application of unsecured debt adjustment. The unsecured debt adjustment shall be
determined as the sum of the initial base assessment rate plus 40 basis points; that sum
shall be multiplied by the ratio of an insured depository institution’s long-term unsecured

79
debt to its assessment base. The amount of the reduction in the assessment rate due to the
adjustment is equal to the dollar amount of the adjustment divided by the amount of the
assessment base.
(ii) Limitation – No unsecured debt adjustment that provides a benefit for any
institution shall exceed the lesser of 5 basis points or 50 percent of the institution’s initial
base assessment rate.
(iii) Applicable quarterly reports of condition – Unsecured debt adjustment ratios for
any given quarter shall be calculated from quarterly reports of condition (Call Reports
and Thrift Financial Reports, or any successor reports, as appropriate) filed by each
institution as of the last day of the quarter.
(7) Depository institution debt adjustment to initial base assessment rate for all
institutions. All institutions shall be subject to an adjustment of assessment rates for
unsecured debt held that is issued by another depository institution. Any such depository
institution debt adjustment shall be made after any adjustment under paragraphs (d)(5)
and (d)(6) of this section.
(i) Application of depository institution debt adjustment. The depository institution
debt adjustment shall equal 50 basis points multiplied by the ratio of the long-term
unsecured debt an institution holds that was issued by another insured depository
institution to its assessment base.
(ii) Applicable quarterly reports of condition. Depository institution debt
adjustment ratios for any given quarter shall be calculated from quarterly reports of
condition (Call Reports and Thrift Financial Reports, or any successor reports, as
appropriate) filed by each institution as of the last day of the quarter.
80
(8) Brokered Deposit Adjustment. All small institutions in Risk Categories II, III, and
IV, all large institutions, and all highly complex institutions shall be subject to an
assessment rate adjustment for brokered deposits. Any such brokered deposit adjustment
shall be made after any adjustment under paragraphs (d)(5), (d)(6), and (d)(7) of this
section. The brokered deposit adjustment includes all brokered deposits as defined in
Section 29 of the Federal Deposit Insurance Act (12 U.S.C. 1831f), and 12 CFR 337.6,
including reciprocal deposits as defined in § 327.8(p), and brokered deposits that consist
of balances swept into an insured institution by another institution. The adjustment under
this paragraph is limited to those institutions whose ratio of brokered deposits to domestic
deposits is greater than 10 percent; asset growth rates do not affect the adjustment.
Insured branches of foreign banks are not subject to the brokered deposit adjustment as
provided in paragraph (d)(2)(iii) of this section.
(i) Application of brokered deposit adjustment. The brokered deposit adjustment
shall be determined by multiplying 25 basis points by the ratio of the difference between
an insured depository institution’s brokered deposits and 10 percent of its domestic
deposits to its assessment base.
(ii) Limitation. The maximum brokered deposit adjustment will be 10 basis points;
the minimum brokered deposit adjustment will be 0.
(iii) Applicable quarterly reports of condition. Brokered deposit ratios for any given
quarter shall be calculated from the quarterly reports of condition (Call Reports and
Thrift Financial Reports, or any successor reports, as appropriate) filed by each institution
as of the last day of the quarter.

81
(9) Request to be treated as a large institution--(i) Procedure. Any institution with
assets of between $5 billion and $10 billion may request that the FDIC determine its
assessment rate as a large institution. The FDIC will consider such a request provided
that it has sufficient information to do so. Any such request must be made to the FDIC's
Division of Insurance and Research. Any approved change will become effective within
one year from the date of the request. If an institution whose request has been granted
subsequently reports assets of less than $5 billion in its report of condition for four
consecutive quarters, the FDIC will consider such institution to be a small institution
subject to the financial ratios method.
(ii) Time limit on subsequent request for alternate method. An institution whose
request to be assessed as a large institution is granted by the FDIC shall not be eligible to
request that it be assessed as a small institution for a period of three years from the first
quarter in which its approved request to be assessed as a large institution became
effective. Any request to be assessed as a small institution must be made to the FDIC's
Division of Insurance and Research.
(iii) An institution that disagrees with the FDIC's determination that it is a large,
highly complex, or small institution may request review of that determination pursuant to
§ 327.4(c).
(10) New and established institutions and exceptions--(i) New small institutions. A
new small Risk Category I institution shall be assessed the Risk Category I maximum
initial base assessment rate for the relevant assessment period. No new small institution
in any risk category shall be subject to the unsecured debt adjustment as determined
under paragraph (d)(6) of this section. All new small institutions in any Risk Category

82
shall be subject to the depository institution debt adjustment as determined under
paragraph (d)(7) of this section. All new small institutions in Risk Categories II, III, and
IV shall be subject to the brokered deposit adjustment as determined under paragraph
(d)(8) of this section.
(ii) New large institutions and new highly complex institutions. All new large
institutions and all new highly complex institutions shall be assessed under the
appropriate method provided at paragraph (d)(3) or (d)(4) and subject to the adjustments
provided at paragraphs (d)(5), (d)(7), and (d)(8). No new highly complex or large
institutions are entitled to adjustment under paragraph (d)(6). If a large or highly
complex institution has not yet received CAMELS ratings, it will be given a weighted
CAMELS rating of 2 for assessment purposes until actual CAMELS ratings are assigned.
(iii) CAMELS ratings for the surviving institution in a merger or consolidation. When
an established institution merges with or consolidates into a new institution, if the FDIC
determines the resulting institution to be an established institution under § 327.8(k)(1), its
CAMELS ratings for assessment purposes will be based upon the established institution's
ratings prior to the merger or consolidation until new ratings become available.
(iv) Rate applicable to institutions subject to subsidiary or credit union exception. A
small Risk Category I institution that is established under § 327.8(k)(4) and (5), but does
not have CAMELS component ratings, shall be assessed at 2 basis points above the
minimum initial base assessment rate applicable to Risk Category I institutions until it
receives CAMELS component ratings. Thereafter, the assessment rate will be determined
by annualizing, where appropriate, financial ratios obtained from all quarterly reports of

83
condition that have been filed, until the institution files four quarterly reports of condition
If a large or highly complex institution is considered established under § 327.8(k)(4) and
(5), but does not have CAMELS component ratings, it will be given a weighted
CAMELS rating of 2 for assessment purposes until actual CAMELS ratings are assigned.
(v) Request for review. An institution that disagrees with the FDIC's determination
that it is a new institution may request review of that determination pursuant to
§ 327.4(c).
(11) Assessment rates for bridge depository institutions and conservatorships
Institutions that are bridge depository institutions under 12 U.S.C. 1821(n) and
institutions for which the Corporation has been appointed or serves as conservator shall,
in all cases, be assessed at the Risk Category I minimum initial base assessment rate,
which shall not be subject to adjustment under paragraphs (d)(5), (6), (7) or (8) of this
section.
9. Revise section 327.10 to read as follows:
§ 327.10 Assessment rate schedules.
(a) Assessment rate schedules if, after September 30, 2010, the reserve ratio of the DIF
has not reached 1.15 percent.
(1) Applicability. The assessment rate schedules in paragraph (a) of this section will
cease to be applicable when the reserve ratio of the DIF first reaches 1.15 percent after
September 30, 2010.
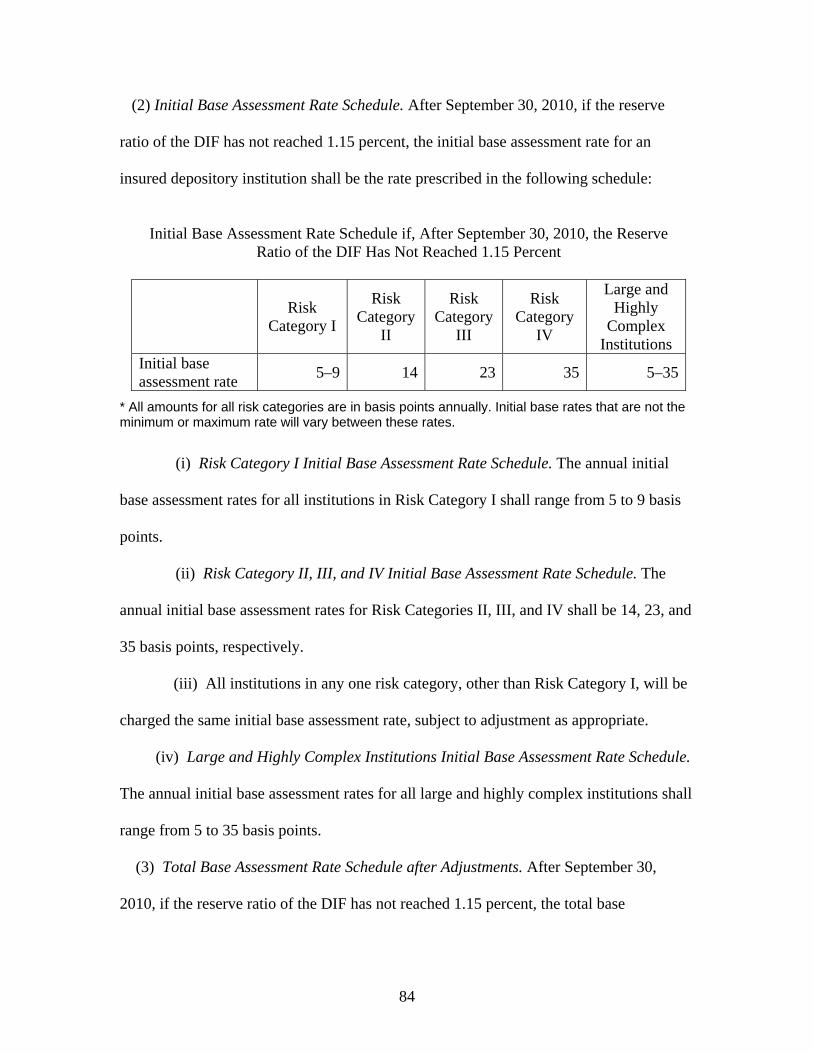
84
(2) Initial Base Assessment Rate Schedule. After September 30, 2010, if the reserve
ratio of the DIF has not reached 1.15 percent, the initial base assessment rate for an
insured depository institution shall be the rate prescribed in the following schedule:
Initial Base Assessment Rate Schedule if, After September 30, 2010, the Reserve
Ratio of the DIF Has Not Reached 1.15 Percent
Risk
Category I
Risk Category
II
Risk Category
III
Risk Category
IV
Large and Highly
Complex Institutions
Initial base assessment rate
5–9 14 23 35 5–35
* All amounts for all risk categories are in basis points annually. Initial base rates that are not the minimum or maximum rate will vary between these rates.
(i) Risk Category I Initial Base Assessment Rate Schedule. The annual initial
base assessment rates for all institutions in Risk Category I shall range from 5 to 9 basis
points.
(ii) Risk Category II, III, and IV Initial Base Assessment Rate Schedule. The
annual initial base assessment rates for Risk Categories II, III, and IV shall be 14, 23, and
35 basis points, respectively.
(iii) All institutions in any one risk category, other than Risk Category I, will be
charged the same initial base assessment rate, subject to adjustment as appropriate.
(iv) Large and Highly Complex Institutions Initial Base Assessment Rate Schedule.
The annual initial base assessment rates for all large and highly complex institutions shall
range from 5 to 35 basis points.
(3) Total Base Assessment Rate Schedule after Adjustments. After September 30,
2010, if the reserve ratio of the DIF has not reached 1.15 percent, the total base

85
assessment rates after adjustments for an insured depository institution shall be the rate
prescribed in the following schedule.
Total Base Assessment Rate Schedule (after Adjustments)* if, After September 30,
2010, the Reserve Ratio of the DIF Has Not Reached 1.15 Percent**
Risk
Category I
Risk Category
II
Risk Category
III
Risk Category
IV
Large and Highly
Complex Institutions
Initial base assessment rate
5–9 14 23 35 5–35
Unsecured debt adjustment
(4.5)–0 (5)–0 (5)–0 (5)–0 (5)–0
Brokered deposit adjustment
…… 0–10 0–10 0–10 0–10
TOTAL BASE ASSESSMENT RATE
2.5–9 9-24 18-33 30-45 2.5–45
* All amounts for all risk categories are in basis points annually. Total base rates that are not the minimum or maximum rate will vary between these rates. ** Total base assessment rates do not include the depository institution debt adjustment.
(i) Risk Category I Total Base Assessment Rate Schedule. The annual total base
assessment rates for all institutions in Risk Category I shall range from 2.5 to 9 basis
points.
(ii) Risk Category II Total Base Assessment Rate Schedule. The annual total base
assessment rates for Risk Category II shall range from 9 to 24 basis points.
(iii) Risk Category III Total Base Assessment Rate Schedule. The annual total base
assessment rates for Risk Category III shall range from 18 to 33 basis points.
(iv) Risk Category IV Total Base Assessment Rate Schedule. The annual total base
assessment rates for Risk Category IV shall range from 30 to 45 basis points.

86
(v) Large and Highly Complex Institutions Total Base Assessment Rate Schedule.
The annual total base assessment rates for all large and highly complex institutions shall
range from 2.5 to 45 basis points.
(b) Assessment rate schedules once the reserve ratio of the DIF first reaches 1.15 percent
after September 30, 2010, and the reserve ratio for the immediately prior assessment
period is less than 2 percent.
(1) Initial Base Assessment Rate Schedule. After September 30, 2010, once the
reserve ratio of the DIF first reaches 1.15 percent, and the reserve ratio for the
immediately prior assessment period is less than 2 percent, the initial base assessment
rate for an insured depository institution shall be the rate prescribed in the following
schedule:
Initial Base Assessment Rate Schedule Once the Reserve Ratio of the DIF Reaches 1.15 Percent After September 30, 2010, and the Reserve Ratio for the Immediately
Prior Assessment Period is Less than 2 Percent
Risk
Category I
Risk Category
II
Risk Category
III
Risk Category
IV
Large and Highly
Complex Institutions
Initial base assessment rate
3–7 12 19 30 3–30
* All amounts for all risk categories are in basis points annually. Initial base rates that are not the minimum or maximum rate will vary between these rates.
(i) Risk Category I Initial Base Assessment Rate Schedule. The annual initial base
assessment rates for all institutions in Risk Category I shall range from 3 to 7 basis
points.
(ii) Risk Category II, III, and IV Initial Base Assessment Rate Schedule. The annual
initial base assessment rates for Risk Categories II, III, and IV shall be 12, 19, and 30

87
basis points, respectively.
(iii) All institutions in any one risk category, other than Risk Category I, will be
charged the same initial base assessment rate, subject to adjustment as appropriate.
(iv) Large and Highly Complex Institutions Initial Base Assessment Rate Schedule.
The annual initial base assessment rates for all large and highly complex institutions shall
range from 3 to 30 basis points.
(2) Total Base Assessment Rate Schedule after Adjustments. After September 30, 2010,
once the reserve ratio of the DIF first reaches 1.15 percent, and the reserve ratio for the
immediately prior assessment period is less than 2 percent, the total base assessment rates
after adjustments for an insured depository institution shall be the rate prescribed in the
following schedule.
Total Base Assessment Rate Schedule (after Adjustments)* Once the Reserve Ratio of the DIF reaches 1.15 Percent After September 30, 2010, and the Reserve Ratio for the
Immediately Prior Assessment Period is Less than 2 Percent**
Risk
Category I
Risk Category
II
Risk Category
III
Risk Category
IV
Large and Highly
Complex Institutions
Initial base assessment rate
3–7 12 19 30 3–30
Unsecured debt adjustment
(3.5)–0 (5)–0 (5)–0 (5)–0 (5)–0
Brokered deposit adjustment
…… 0–10 0–10 0–10 0–10
TOTAL BASE ASSESSMENT
RATE 1.5–7 7-22 14-29 29-40 1.5–40
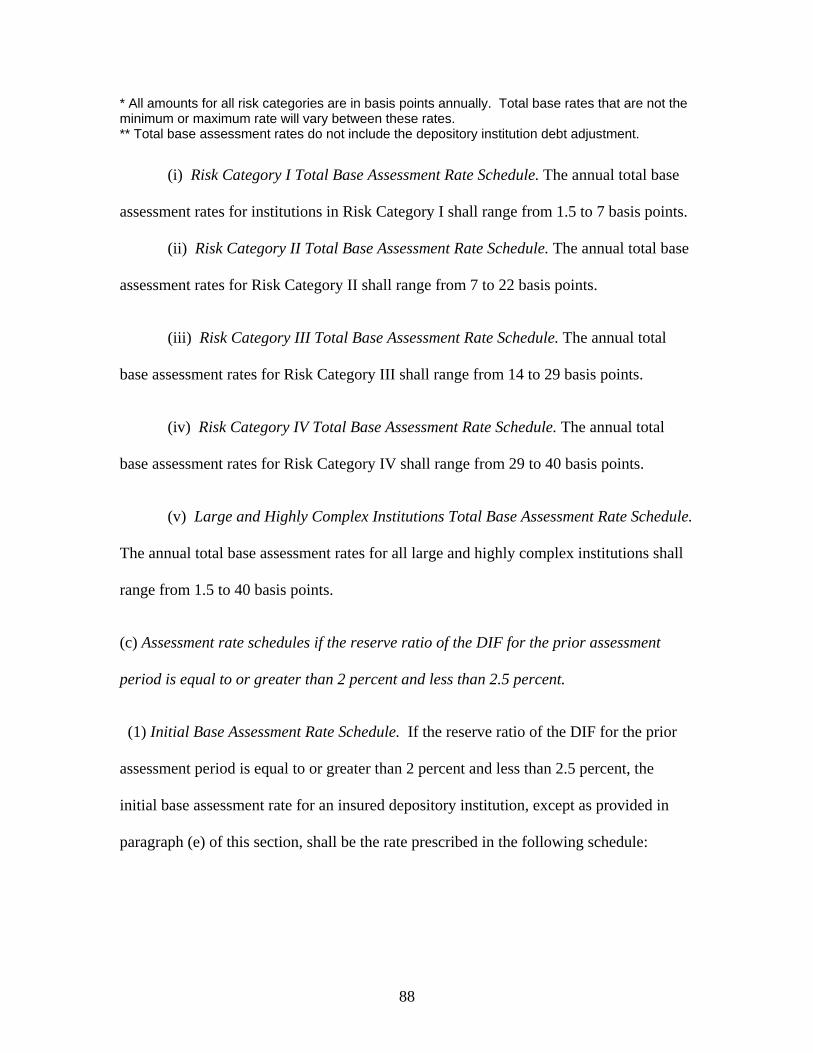
88
* All amounts for all risk categories are in basis points annually. Total base rates that are not the minimum or maximum rate will vary between these rates. ** Total base assessment rates do not include the depository institution debt adjustment.
(i) Risk Category I Total Base Assessment Rate Schedule. The annual total base
assessment rates for institutions in Risk Category I shall range from 1.5 to 7 basis points.
(ii) Risk Category II Total Base Assessment Rate Schedule. The annual total base
assessment rates for Risk Category II shall range from 7 to 22 basis points.
(iii) Risk Category III Total Base Assessment Rate Schedule. The annual total
base assessment rates for Risk Category III shall range from 14 to 29 basis points.
(iv) Risk Category IV Total Base Assessment Rate Schedule. The annual total
base assessment rates for Risk Category IV shall range from 29 to 40 basis points.
(v) Large and Highly Complex Institutions Total Base Assessment Rate Schedule.
The annual total base assessment rates for all large and highly complex institutions shall
range from 1.5 to 40 basis points.
(c) Assessment rate schedules if the reserve ratio of the DIF for the prior assessment
period is equal to or greater than 2 percent and less than 2.5 percent.
(1) Initial Base Assessment Rate Schedule. If the reserve ratio of the DIF for the prior
assessment period is equal to or greater than 2 percent and less than 2.5 percent, the
initial base assessment rate for an insured depository institution, except as provided in
paragraph (e) of this section, shall be the rate prescribed in the following schedule:

89
Initial Base Assessment Rate Schedule if Reserve Ratio for Prior Assessment Period is
Equal to or Greater than 2 percent but Less than 2.5 percent
Risk
Category I
Risk Category
II
Risk Category
III
Risk Category
IV
Large and Highly
Complex Institutions
Initial base assessment rate
2–6 10 17 28 2–28
* All amounts for all risk categories are in basis points annually. Initial base rates that are not the minimum or maximum rate will vary between these rates.
(i) Risk Category I Initial Base Assessment Rate Schedule. The annual initial base
assessment rates for all institutions in Risk Category I shall range from 2 to 6 basis
points.
(ii) Risk Category II, III, and IV Initial Base Assessment Rate Schedule. The annual
initial base assessment rates for Risk Categories II, III, and IV shall be 10, 17, and 28
basis points, respectively.
(iii) All institutions in any one risk category, other than Risk Category I, will be
charged the same initial base assessment rate, subject to adjustment as appropriate.
(iv) Large and Highly Complex Institutions Initial Base Assessment Rate Schedule.
The annual initial base assessment rates for all large and highly complex institutions shall
range from 2 to 28 basis points.
(2) Total Base Assessment Rate Schedule after Adjustments. If the reserve ratio of the
DIF for the prior assessment period is equal to or greater than 2 percent and less than 2.5
percent, the total base assessment rates after adjustments for an insured depository
institution, except as provided in paragraph (e) of this section, shall be the rate prescribed
in the following schedule.

90
Total Base Assessment Rate Schedule (after Adjustments)* if Reserve Ratio for Prior
Assessment Period is Equal to or Greater than 2 Percent but Less than 2.5 Percent**
Risk
Category I
Risk Category
II
Risk Category
III
Risk Category
IV
Large and Highly
Complex Institutions
Initial base assessment rate
2–6 10 17 28 2–38
Unsecured debt adjustment
(3)–0 (5)–0 (5)–0 (5)–0 (5)–0
Brokered deposit adjustment
…… 0–10 0–10 0–10 0–10
TOTAL BASE ASSESSMENT RATE
1–6 5-20 12-27 23-38 1–38
* All amounts for all risk categories are in basis points annually. Total base rates that are not the minimum or maximum rate will vary between these rates. ** Total base assessment rates do not include the depository institution debt adjustment.
(i) Risk Category I Total Base Assessment Rate Schedule. The annual total base
assessment rates for institutions in Risk Category I shall range from 1 to 6 basis points.
(ii) Risk Category II Total Base Assessment Rate Schedule. The annual total base
assessment rates for Risk Category II shall range from 5 to 20 basis points.
(iii) Risk Category III Total Base Assessment Rate Schedule. The annual total
base assessment rates for Risk Category III shall range from 12 to 27 basis points.
(iv) Risk Category IV Total Base Assessment Rate Schedule. The annual total
base assessment rates for Risk Category IV shall range from 23 to 38 basis points.
(v) Large and Highly Complex Institutions Total Base Assessment Rate Schedule.
The annual total base assessment rates for all large and highly complex institutions shall
range from 1 to 38 basis points.
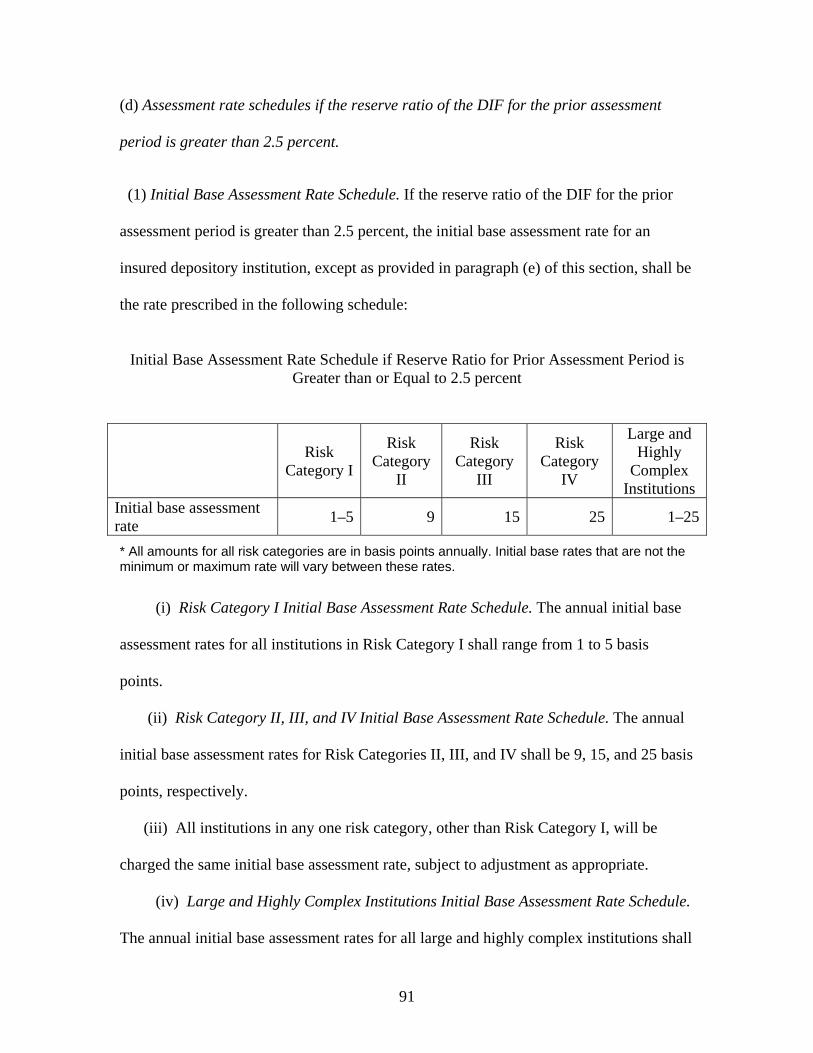
91
(d) Assessment rate schedules if the reserve ratio of the DIF for the prior assessment
period is greater than 2.5 percent.
(1) Initial Base Assessment Rate Schedule. If the reserve ratio of the DIF for the prior
assessment period is greater than 2.5 percent, the initial base assessment rate for an
insured depository institution, except as provided in paragraph (e) of this section, shall be
the rate prescribed in the following schedule:
Initial Base Assessment Rate Schedule if Reserve Ratio for Prior Assessment Period is
Greater than or Equal to 2.5 percent
Risk
Category I
Risk Category
II
Risk Category
III
Risk Category
IV
Large and Highly
Complex Institutions
Initial base assessment rate
1–5 9 15 25 1–25
* All amounts for all risk categories are in basis points annually. Initial base rates that are not the minimum or maximum rate will vary between these rates.
(i) Risk Category I Initial Base Assessment Rate Schedule. The annual initial base
assessment rates for all institutions in Risk Category I shall range from 1 to 5 basis
points.
(ii) Risk Category II, III, and IV Initial Base Assessment Rate Schedule. The annual
initial base assessment rates for Risk Categories II, III, and IV shall be 9, 15, and 25 basis
points, respectively.
(iii) All institutions in any one risk category, other than Risk Category I, will be
charged the same initial base assessment rate, subject to adjustment as appropriate.
(iv) Large and Highly Complex Institutions Initial Base Assessment Rate Schedule.
The annual initial base assessment rates for all large and highly complex institutions shall
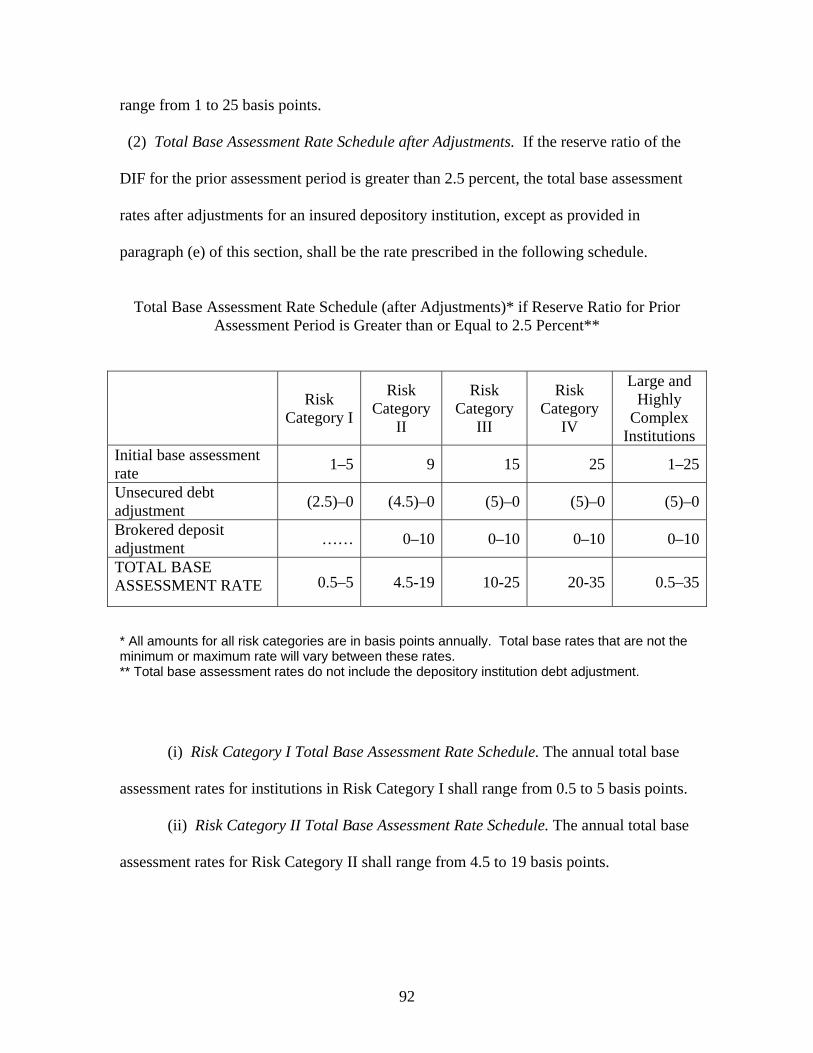
92
range from 1 to 25 basis points.
(2) Total Base Assessment Rate Schedule after Adjustments. If the reserve ratio of the
DIF for the prior assessment period is greater than 2.5 percent, the total base assessment
rates after adjustments for an insured depository institution, except as provided in
paragraph (e) of this section, shall be the rate prescribed in the following schedule.
Total Base Assessment Rate Schedule (after Adjustments)* if Reserve Ratio for Prior
Assessment Period is Greater than or Equal to 2.5 Percent**
Risk Category I
Risk Category
II
Risk Category
III
Risk Category
IV
Large and Highly
Complex Institutions
Initial base assessment rate
1–5 9 15 25 1–25
Unsecured debt adjustment
(2.5)–0 (4.5)–0 (5)–0 (5)–0 (5)–0
Brokered deposit adjustment
…… 0–10 0–10 0–10 0–10
TOTAL BASE ASSESSMENT RATE 0.5–5 4.5-19 10-25 20-35 0.5–35
* All amounts for all risk categories are in basis points annually. Total base rates that are not the minimum or maximum rate will vary between these rates. ** Total base assessment rates do not include the depository institution debt adjustment.
(i) Risk Category I Total Base Assessment Rate Schedule. The annual total base
assessment rates for institutions in Risk Category I shall range from 0.5 to 5 basis points.
(ii) Risk Category II Total Base Assessment Rate Schedule. The annual total base
assessment rates for Risk Category II shall range from 4.5 to 19 basis points.
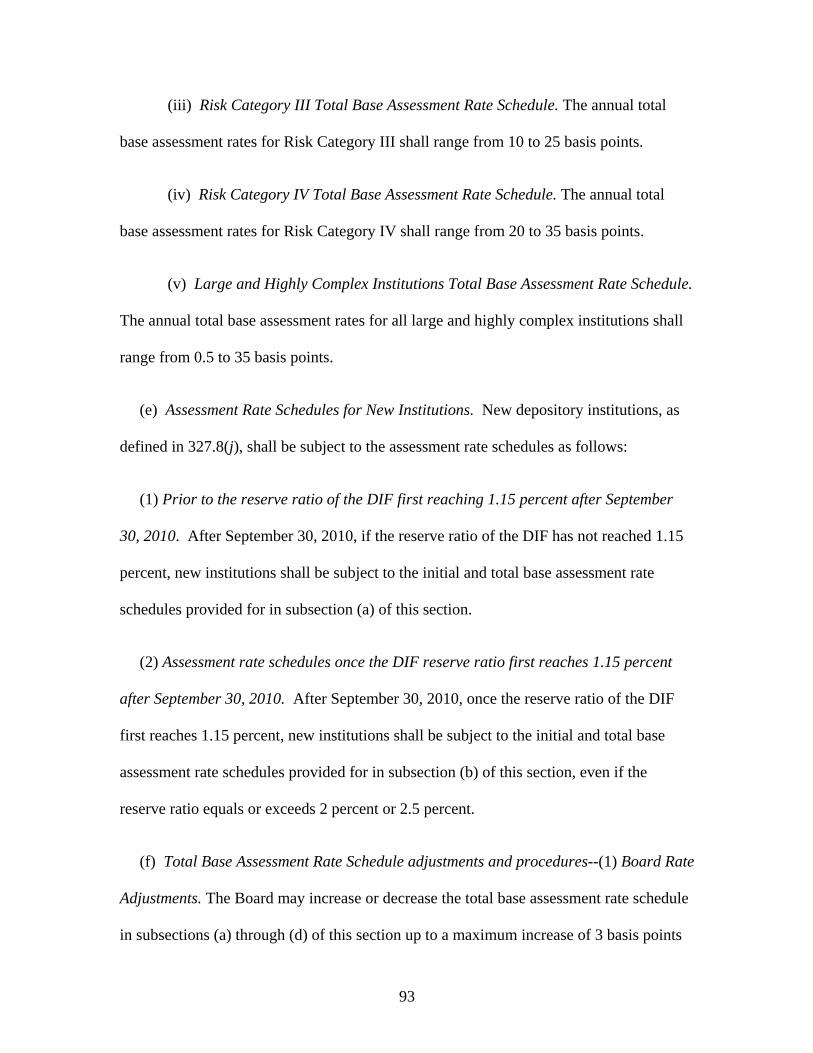
93
(iii) Risk Category III Total Base Assessment Rate Schedule. The annual total
base assessment rates for Risk Category III shall range from 10 to 25 basis points.
(iv) Risk Category IV Total Base Assessment Rate Schedule. The annual total
base assessment rates for Risk Category IV shall range from 20 to 35 basis points.
(v) Large and Highly Complex Institutions Total Base Assessment Rate Schedule.
The annual total base assessment rates for all large and highly complex institutions shall
range from 0.5 to 35 basis points.
(e) Assessment Rate Schedules for New Institutions. New depository institutions, as
defined in 327.8(j), shall be subject to the assessment rate schedules as follows:
(1) Prior to the reserve ratio of the DIF first reaching 1.15 percent after September
30, 2010. After September 30, 2010, if the reserve ratio of the DIF has not reached 1.15
percent, new institutions shall be subject to the initial and total base assessment rate
schedules provided for in subsection (a) of this section.
(2) Assessment rate schedules once the DIF reserve ratio first reaches 1.15 percent
after September 30, 2010. After September 30, 2010, once the reserve ratio of the DIF
first reaches 1.15 percent, new institutions shall be subject to the initial and total base
assessment rate schedules provided for in subsection (b) of this section, even if the
reserve ratio equals or exceeds 2 percent or 2.5 percent.
(f) Total Base Assessment Rate Schedule adjustments and procedures--(1) Board Rate
Adjustments. The Board may increase or decrease the total base assessment rate schedule
in subsections (a) through (d) of this section up to a maximum increase of 3 basis points
94
or a fraction thereof or a maximum decrease of 3 basis points or a fraction thereof (after
aggregating increases and decreases), as the Board deems necessary. Any such
adjustment shall apply uniformly to each rate in the total base assessment rate schedule.
In no case may such Board rate adjustments result in a total base assessment rate that is
mathematically less than zero or in a total base assessment rate schedule that, at any time,
is more than 3 basis points above or below the total base assessment schedule for the
Deposit Insurance Fund in effect pursuant to subsection (b) of this section, nor may any
one such Board adjustment constitute an increase or decrease of more than 3 basis points.
(2) Amount of revenue. In setting assessment rates, the Board shall take into
consideration the following:
(i) Estimated operating expenses of the Deposit Insurance Fund;
(ii) Case resolution expenditures and income of the Deposit Insurance Fund;
(iii) The projected effects of assessments on the capital and earnings of the
institutions paying assessments to the Deposit Insurance Fund;
(iv) The risk factors and other factors taken into account pursuant to 12 USC
1817(b)(1); and
(v) Any other factors the Board may deem appropriate.
(3) Adjustment procedure. Any adjustment adopted by the Board pursuant to this
paragraph will be adopted by rulemaking, except that the Corporation may set assessment
rates as necessary to manage the reserve ratio, within set parameters not exceeding
cumulatively 3 basis points, pursuant to paragraph (c)(1) of this section, without further
rulemaking.
(4) Announcement. The Board shall announce the assessment schedules and the

95
amount and basis for any adjustment thereto not later than 30 days before the quarterly
certified statement invoice date specified in § 327.3(b) of this part for the first assessment
period for which the adjustment shall be effective. Once set, rates will remain in effect
until changed by the Board.

96
Appendix A to Subpart A
Description of Scorecard Measures
Scorecard Measures Description Tier 1 Leverage Ratio
Tier 1 capital for Prompt Corrective Action (PCA) divided by adjusted average assets based on the definition for prompt corrective action.
Concentration Measure for Large IDIs (excluding Highly Complex Institutions)
Concentration score for large institutions takes the higher score of the following two:
(1) Higher-Risk Assets/Tier 1 Capital and Reserves
Sum of construction and land development (C&D) loans (funded and unfunded), leveraged loans (funded and unfunded), nontraditional mortgages, and subprime consumer loans divided by Tier 1 capital and reserves. See Appendix C for the detailed description of the ratio.
(2) Growth-Adjusted Portfolio Concentrations
The measure is calculated in following steps:
(1) Concentration levels (as a ratio to Tier 1 capital and reserves) are calculated for each broad portfolio category (C&D, other commercial real estate loans, first lien residential mortgages (including non-agency mortgage-backed securities), and junior lien residential mortgages, commercial and industrial loans, credit card, and other consumer loans).
(2) Three-year merger-adjusted portfolio growth rates are then scaled to a growth factor of 1 to 1.2 where a 3-year cumulated growth rate of 20 percent or less equals a factor of 1 and a growth rate of 80 percent or greater equals a factor of 1.2. If three years of data are not available, a growth factor of 1 will be assigned.
(3) Risk weights are assigned to each category based on historical loss rates.
(4) Concentration levels are multiplied by risk weights and squared to produce a risk-adjusted concentration ratio for each portfolio.
(5) The risk-adjusted concentration ratio for each portfolio is multiplied by the growth factor and resulting values are summed.
See Appendix C for the detail description of the measure.
Concentration Measure for Highly Complex Institutions
Concentration score for highly complex institutions takes the highest score of the following three:
(1) Higher-Risk Assets/Tier 1 Capital and Sum of C&D loans (funded and unfunded),
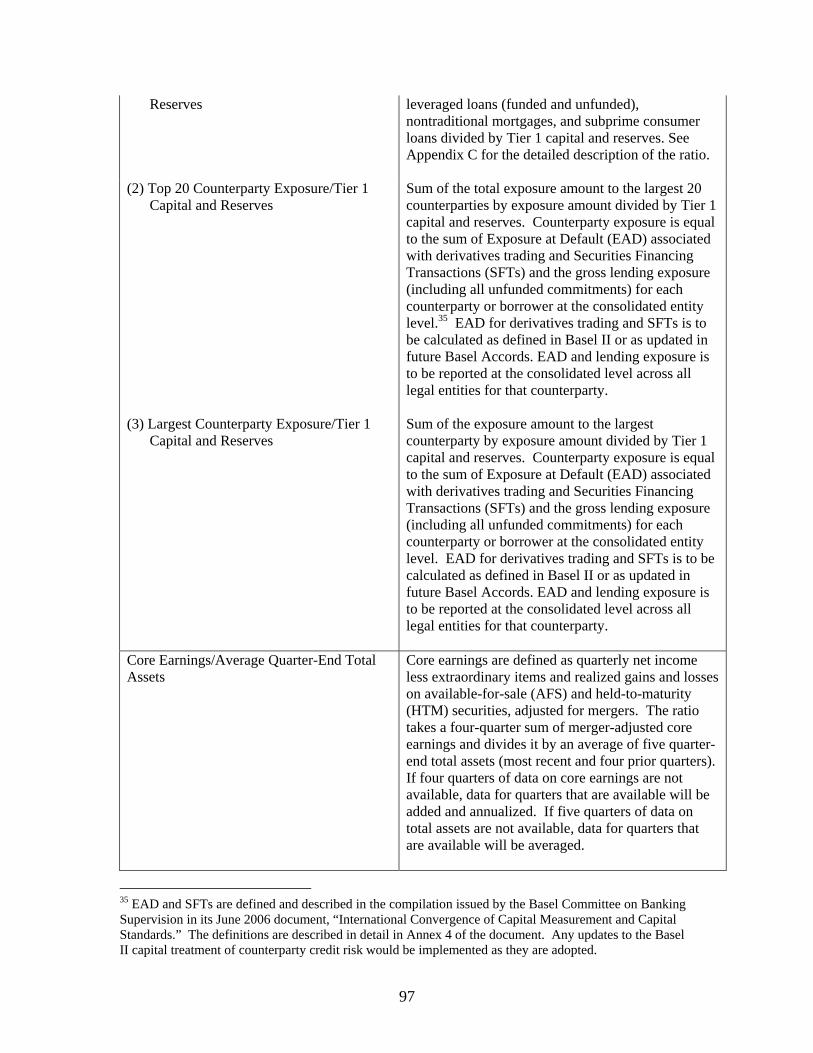
97
Reserves
leveraged loans (funded and unfunded), nontraditional mortgages, and subprime consumer loans divided by Tier 1 capital and reserves. See Appendix C for the detailed description of the ratio.
(2) Top 20 Counterparty Exposure/Tier 1 Capital and Reserves
Sum of the total exposure amount to the largest 20 counterparties by exposure amount divided by Tier 1 capital and reserves. Counterparty exposure is equal to the sum of Exposure at Default (EAD) associated with derivatives trading and Securities Financing Transactions (SFTs) and the gross lending exposure (including all unfunded commitments) for each counterparty or borrower at the consolidated entity level.35 EAD for derivatives trading and SFTs is to be calculated as defined in Basel II or as updated in future Basel Accords. EAD and lending exposure is to be reported at the consolidated level across all legal entities for that counterparty.
(3) Largest Counterparty Exposure/Tier 1 Capital and Reserves
Sum of the exposure amount to the largest counterparty by exposure amount divided by Tier 1 capital and reserves. Counterparty exposure is equal to the sum of Exposure at Default (EAD) associated with derivatives trading and Securities Financing Transactions (SFTs) and the gross lending exposure (including all unfunded commitments) for each counterparty or borrower at the consolidated entity level. EAD for derivatives trading and SFTs is to be calculated as defined in Basel II or as updated in future Basel Accords. EAD and lending exposure is to be reported at the consolidated level across all legal entities for that counterparty.
Core Earnings/Average Quarter-End Total Assets
Core earnings are defined as quarterly net income less extraordinary items and realized gains and losses on available-for-sale (AFS) and held-to-maturity (HTM) securities, adjusted for mergers. The ratio takes a four-quarter sum of merger-adjusted core earnings and divides it by an average of five quarter-end total assets (most recent and four prior quarters). If four quarters of data on core earnings are not available, data for quarters that are available will be added and annualized. If five quarters of data on total assets are not available, data for quarters that are available will be averaged.
35 EAD and SFTs are defined and described in the compilation issued by the Basel Committee on Banking Supervision in its June 2006 document, “International Convergence of Capital Measurement and Capital Standards.” The definitions are described in detail in Annex 4 of the document. Any updates to the Basel II capital treatment of counterparty credit risk would be implemented as they are adopted.

98
Credit Quality Measure: Asset quality score takes a higher score of the following two:
(1) Criticized and Classified Items/Tier 1 Capital and Reserves
Sum of criticized and classified items divided by the sum of Tier 1 capital and reserves. Criticized and classified items include items with an internal grade of “Special Mention” or worse and include retail items under Uniform Retail Classification Guidelines, securities that are internally rated the regulatory equivalent of “Special Mention” or worse, and marked-to-market counterparty positions that are internally rated the regulatory equivalent of “Special Mention” or worse, less credit valuation adjustments. Criticized and classified items exclude loans and securities in trading books, and the maximum amount recoverable from the U.S. government, its agencies, or government-sponsored agencies, under guarantee or insurance provisions.
(2) Underperforming Assets/Tier 1 Capital and Reserves
Sum of loans that are 30-89 day past due, loans that are 90 days or more past due, nonaccrual loans, restructured loans (including restructured 1-4 family loans), and ORE, excluding the maximum amount recoverable from the U.S. government, its agencies, or government-sponsored agencies, under guarantee or insurance provisions, divided by a sum of Tier 1 capital and reserves.
Core Deposits/Total Liabilities
Sum of demand deposits, NOW accounts, MMDA, other savings deposits, CDs under $250,000 less insured brokered deposits under $250,000 divided by total liabilities.
Balance Sheet Liquidity Ratio
Sum of cash and balances due from depository institutions, federal funds sold and securities purchased under agreements to resell, and agency securities (excludes agency mortgage-backed securities but includes securities issued by the US Treasury, US government agencies, and US government-sponsored enterprises) divided by the sum of federal funds purchased and repurchase agreements, other borrowings (including FHLB) with a remaining maturity of one year or less, 7.5 percent of insured domestic deposits, and 15 percent of uninsured domestic and foreign deposits.
Potential Losses/Total Domestic Deposits (Loss Severity Measure)
Potential losses to the DIF in the event of failure divided by total domestic deposits. Appendix D describes the calculation of the loss severity measure in detail.
Noncore Funding/Total Liabilities
Noncore liabilities divided by total liabilities. Noncore liabilities generally consist of total time deposits of $250,000 or more, other borrowed money
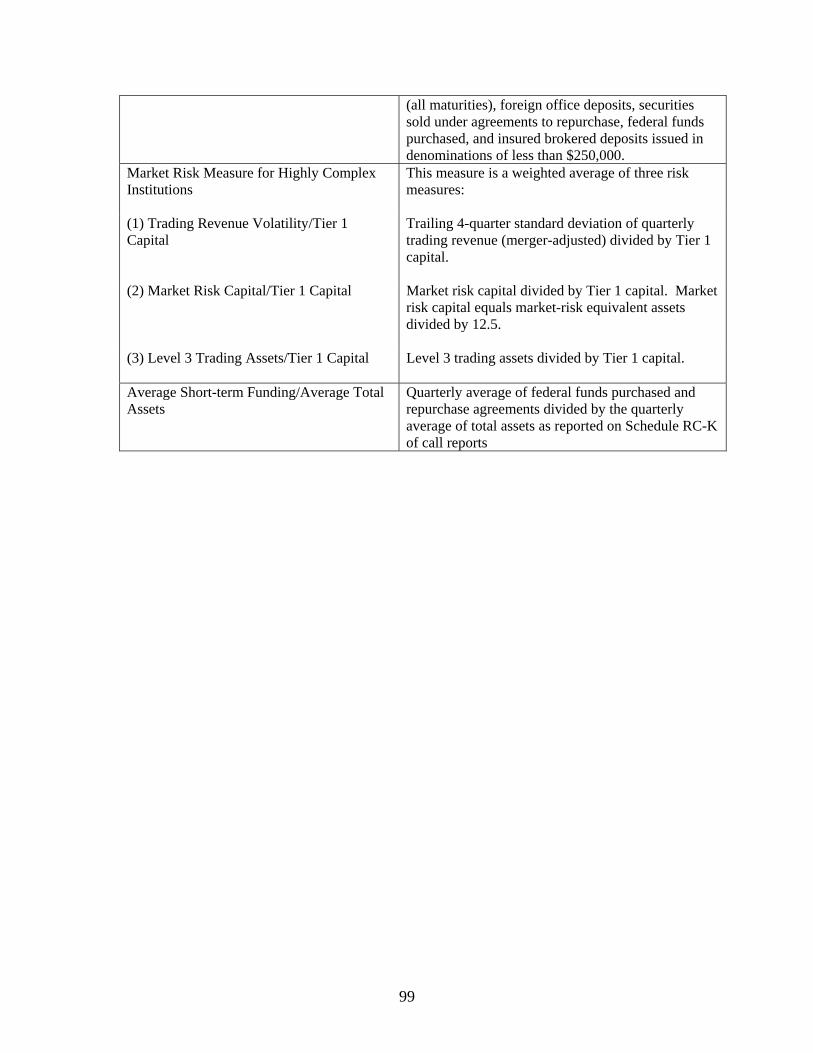
99
(all maturities), foreign office deposits, securities sold under agreements to repurchase, federal funds purchased, and insured brokered deposits issued in denominations of less than $250,000.
Market Risk Measure for Highly Complex Institutions
This measure is a weighted average of three risk measures:
(1) Trading Revenue Volatility/Tier 1 Capital
Trailing 4-quarter standard deviation of quarterly trading revenue (merger-adjusted) divided by Tier 1 capital.
(2) Market Risk Capital/Tier 1 Capital Market risk capital divided by Tier 1 capital. Market risk capital equals market-risk equivalent assets divided by 12.5.
(3) Level 3 Trading Assets/Tier 1 Capital Level 3 trading assets divided by Tier 1 capital.
Average Short-term Funding/Average Total Assets
Quarterly average of federal funds purchased and repurchase agreements divided by the quarterly average of total assets as reported on Schedule RC-K of call reports
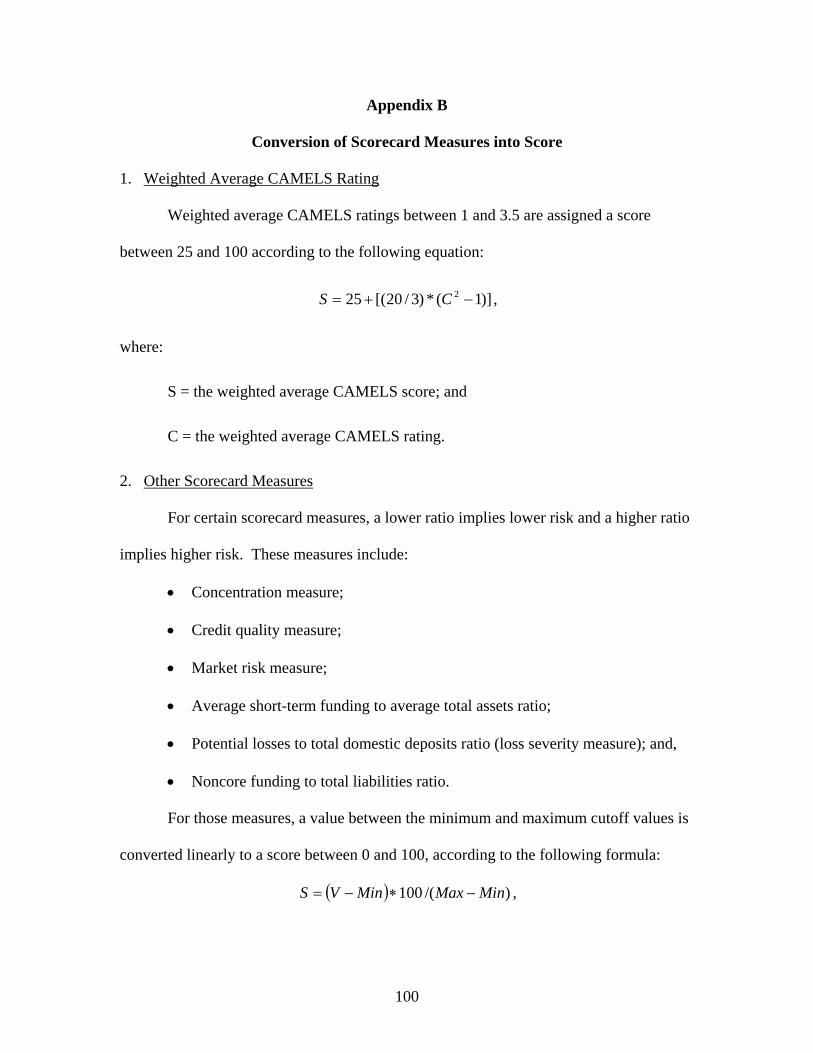
100
Appendix B
Conversion of Scorecard Measures into Score
1. Weighted Average CAMELS Rating
Weighted average CAMELS ratings between 1 and 3.5 are assigned a score
between 25 and 100 according to the following equation:
)]1(*)3/20[(25 2 CS ,
where:
S = the weighted average CAMELS score; and
C = the weighted average CAMELS rating.
2. Other Scorecard Measures
For certain scorecard measures, a lower ratio implies lower risk and a higher ratio
implies higher risk. These measures include:
Concentration measure;
Credit quality measure;
Market risk measure;
Average short-term funding to average total assets ratio;
Potential losses to total domestic deposits ratio (loss severity measure); and,
Noncore funding to total liabilities ratio.
For those measures, a value between the minimum and maximum cutoff values is
converted linearly to a score between 0 and 100, according to the following formula:
)/(100 MinMaxMinVS ,
101
where S is score (rounded to three decimal points), V is the value of the measure, Min is
the minimum cutoff value and Max is the maximum cutoff value.
For other scorecard measures, a lower value represents higher risk and a higher
value represents lower risk. These measures include:
Tier 1 leverage ratio;
Core earnings to average quarter-end total assets ratio;
Core deposits to total liabilities ratio; and,
Balance sheet liquidity ratio.
For those measures, a value between the minimum and maximum cutoff values is
converted linearly to a score between 0 and 100, according to the following formula:
)/(100 MinMaxVMaxS ,
where S is score (rounded to three decimal points), V is the value of the measure, Max is
the maximum cutoff value and Min is the minimum cutoff value.
102
Appendix C
Concentration Measures
The concentration measure score for large institutions is the higher of the two
concentration scores: a higher-risk assets to Tier 1 capital and reserves ratio and a
growth-adjusted portfolio concentration measure. The concentration measure score for
highly complex institutions takes a higher of the three concentration scores: a higher-risk
assets to Tier 1 capital and reserve ratio, a Top 20 counterparty exposure to Tier 1 capital
and reserves ratio, a largest counterparty to Tier 1 capital and reserves ratio. The higher-
risk assets to Tier 1 capital and reserve ratio and the growth-adjusted portfolio
concentration measure are described below.
1. Higher-risk assets/Tier 1 capital and reserves
The higher-risk assets to Tier 1 capital and reserves ratio is the sum of the
concentrations in each of four risk areas described below and is calculated as:
4
1
ki,
Reserves Capital 1Tier
Exposure ofAmount
k ii
where
H is institution i’s higher-risk concentration measure and
k is a risk area.36 The four risk areas (k) are defined as:
Construction and land development loans (funded and unfunded);
Leveraged loans (funded and unfunded);
Nontraditional mortgage loans; and
36 The high-risk concentration measure is rounded to two decimal points.
103
Subprime consumer loans. 37,38
The risk areas are defined according to the interagency guidance for a given
product with specific modifications made to minimize reporting discrepancies. The
definitions for each risk area are as follows:
1. Construction and Land Development Loans: Construction and development loans
include construction and land development loans outstanding and unfunded
commitments.
2. Leveraged Loans: Leveraged loans include all commercial loans—funded and
unfunded and securities (e.g., high yield bonds meeting any of the criteria below),
excluding those securities classified as trading book, that meet any one of the
following conditions:
Loans or securities where proceeds are used for buyout, acquisition, and
recapitalization;
Loans or securities with a balance sheet leverage ratio (total liabilities/total
assets) higher than 50 percent or where a transaction resulted in an
increase in the leverage ratio of more than 75 percent. Loans or securities
where borrower’s operating leverage ratio ((total debt/trailing twelve
month EBITDA (earnings before interest, taxes, depreciation, and
amortization) or senior debt/trailing twelve month EBITDA)) are above
4.0X EBITDA or 3.0X EBITDA, respectively. For purposes of this
calculation, the only permitted EBITDA adjustments are those
37 All loan concentrations should include purchased credit impaired loans. 38 Each loan concentration category should exclude the maximum amount of loans recoverable from the U.S. government, its agencies, or government-sponsored agencies, under guarantee or insurance provisions.

104
adjustments specifically permitted for that borrower in its credit
agreement; or
Loans or securities that are designated as highly leveraged transactions
(HLT) by syndication agent.39
For purposes of the concentration measure, leveraged loans include all loans
and/or securitizations that may not have been considered leveraged at the time of
origination, but subsequent to origination, meet the characteristics of a leveraged
loan. Leveraged loans include all securitizations where greater than 50 percent of
the assets backing the securitization meet one or more of the preceding criteria of
leveraged loans (e.g., CLOs), with the exception of those securities classified as
trading book.
3. Nontraditional Mortgage Loans: Nontraditional mortgage loans includes all
residential loan products that allow the borrower to defer repayment of principal
or interest and includes all interest-only products, teaser rate mortgages, and
negative amortizing mortgages, with the exception of home equity lines of credit
(HELOCs) or reverse mortgages.40
For purposes of the concentration measure, nontraditional mortgage loans include
securitizations where greater than 50 percent of the assets backing the
securitization meet one or more of the preceding criteria for nontraditional
mortgage loans, with the exception of those securities classified as trading book.
39 http://www.fdic.gov/news/news/press/2001/pr2801.html 40 http://www.fdic.gov/regulations/laws/federal/2006/06noticeFINAL.html
105
4. Subprime Consumer Loans: Subprime loans include loans made to borrowers that
display one or more of the following credit risk characteristics (excluding
subprime loans that are previously included as nontraditional mortgage loans):
Two or more 30-day delinquencies in the last 12 months, or one or more
60-day delinquencies in the last 24 months;
Judgment, foreclosure, repossession, or charge-off in the prior 24 months;
Bankruptcy in the last 5 years;
Credit bureau risk score (FICO) of 660 or below (depending on the
product/collateral), or other bureau or proprietary scores with an
equivalent default probability likelihood; and/or
Debt service-to-income ratio of 50 percent or greater, or otherwise limited
ability to cover family living expenses after deducting total monthly debt-
service requirements from monthly income.41
For purposes of the concentration measure, subprime loans include loans that
were not considered subprime at origination, but meet the characteristics of
subprime subsequent to origination. Subprime loans also include securitizations
where more than 50 percent of assets backing the securitization meet one or more
of the preceding criteria for subprime loans, excluding those securities classified
as trading book.
2. Growth-adjusted portfolio concentration measure
The growth-adjusted concentration measure is the sum of the values of
concentrations in each of the seven portfolios, each of the values being first adjusted for
41 http://www.fdic.gov/news/news/press/2001/pr0901a.html.
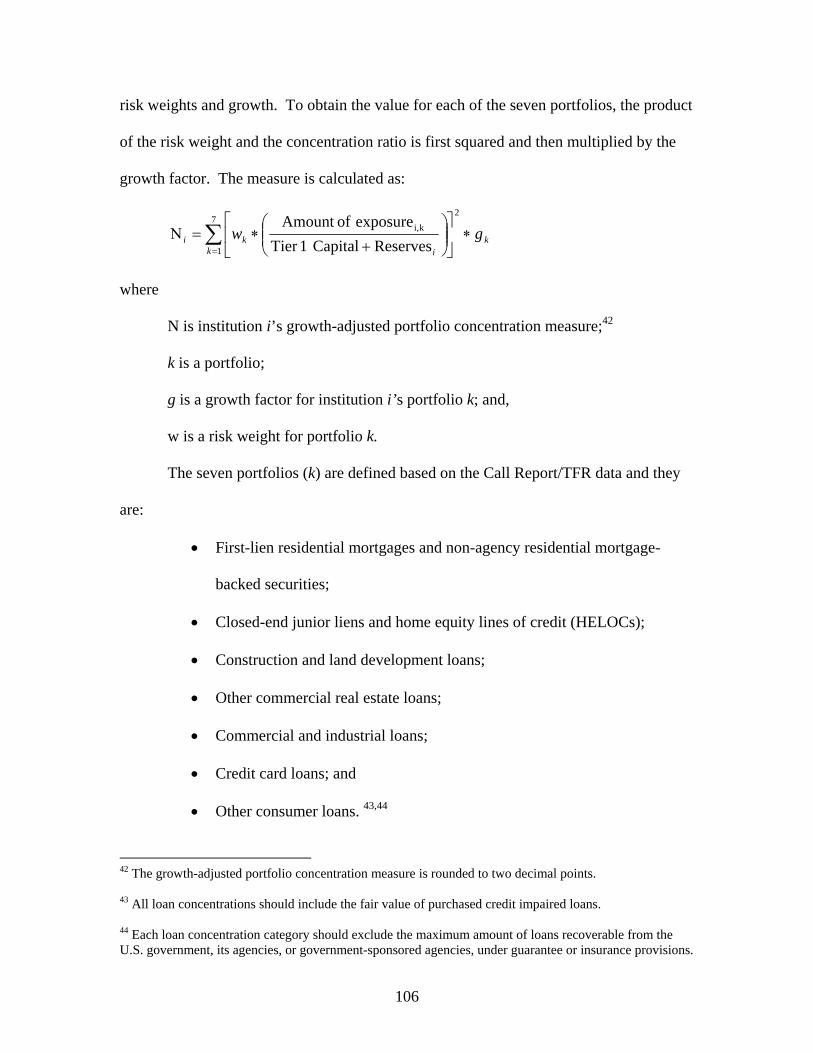
106
risk weights and growth. To obtain the value for each of the seven portfolios, the product
of the risk weight and the concentration ratio is first squared and then multiplied by the
growth factor. The measure is calculated as:
kk i
ki gw
27
1
ki,
Reserves Capital 1Tier
exposure ofAmount
where
N is institution i’s growth-adjusted portfolio concentration measure;42
k is a portfolio;
g is a growth factor for institution i’s portfolio k; and,
w is a risk weight for portfolio k.
The seven portfolios (k) are defined based on the Call Report/TFR data and they
are:
First-lien residential mortgages and non-agency residential mortgage-
backed securities;
Closed-end junior liens and home equity lines of credit (HELOCs);
Construction and land development loans;
Other commercial real estate loans;
Commercial and industrial loans;
Credit card loans; and
Other consumer loans. 43,44
42 The growth-adjusted portfolio concentration measure is rounded to two decimal points. 43 All loan concentrations should include the fair value of purchased credit impaired loans. 44 Each loan concentration category should exclude the maximum amount of loans recoverable from the U.S. government, its agencies, or government-sponsored agencies, under guarantee or insurance provisions.

107
The growth factor, g, is based on a three-year merger-adjusted growth rate for a
given portfolio; g ranges from 1 to 1.2 where a 20 percent growth rate equals a factor of 1
and an 80 percent growth rate equals a factor of 1.2.45,46 For growth rates less than 20
percent, g is 1; for growth rates greater than 80 percent, g is 1.2. For growth rates
between 20 percent and 80 percent, the growth factor is calculated as:
20.03
11 ,, kiki Gg
where 112,,
,,,
tki
tkiki V
VG , V is the portfolio amount as reported on the Call
Report/TFR and t is the quarter for which the assessment is being determined.
The risk weight for each portfolio reflects relative peak loss rates for banks at the
90th percentile during the 1990-2009 period.47 These loss rates were converted into
equivalent risk weights as shown in Table C.1.
45 The cut-off values of 0.2 and 0.8 correspond to about 45th percentile and 80th percentile among the large institutions, respectively, based on the data from 2000 to 2009. 46 The growth factor is rounded to two decimal points. 47 The risk weights are based on loss rates for each portfolio relative to the loss rate for C&I loans, which is given a risk weight of 1. The peak loss rates were derived as follows. The loss rate for each loan category for each bank with over $5 billion in total assets was calculated for each of the last twenty calendar years (1990-2009). The highest value of the 90th percentile of each loan category over the twenty year period was selected as the peak loss rate.

108
Table C.1
90th percentile Annual Loss rates for 1990-2009 Period and Corresponding Risk Weights
Portfolio
Loss Rates
(90th
percentile)
Risk
Weights
First-Lien Mortgages 2.3% 0.5
Second/Junior Lien Mortgages 4.6% 0.9
Commercial and Industrial (C&I) Loans 5.0% 1.0
Construction and Development (C&D) Loans 15.0% 3.0
Commercial Real Estate Loans, excluding C&D 4.3% 0.9
Credit Card Loans 11.8% 2.4
Other Consumer Loans 5.9% 1.2

109
Appendix D
Description of the Loss Severity Measure
The loss severity measure applies a standardized set of assumptions to an
institution’s balance sheet for a given quarter to measure possible losses to the FDIC in
the event of an institution’s failure. To determine an institution’s loss severity rate, the
FDIC first uses assumptions about uninsured deposit and other unsecured liability runoff
and growth in insured deposits to adjust the size and composition of the institution’s
liabilities. Assets are then reduced to match any reduction in liabilities.48 The
institution’s asset values are then further reduced so that the Tier 1 leverage ratio reaches
2 percent.49 Asset adjustments are made pro rata to asset categories to preserve the
institution’s asset composition. Assumptions regarding loss rates at failure for a given
asset category and the extent of secured liabilities are then applied to estimated assets and
liabilities at failure to determine whether the institution has enough unencumbered assets
to cover domestic deposits. Any projected shortfall is divided by current domestic
deposits to obtain an end-of-period loss severity ratio. The loss severity measure is an
average loss severity ratio for the three most recent quarters.
Runoff and Capital Adjustment Assumptions
Table D.1 contains run-off assumptions.
48 In most cases, the model would yield reductions in liabilities and assets prior to failure. Exceptions may occur for institutions primarily funded through insured deposits, which the model assumes to grow prior to failure. 49 Of course, in reality, runoff and capital declines occur more or less simultaneously as an institution approaches failure. The loss severity measure assumptions simplify this process for ease of modeling.

110
Table D.1
Runoff Rate Assumptions
Liability Type Runoff Rate*
Insured Deposits -32.0%
Uninsured Deposits 28.6%
Foreign Deposits 80.0%
Federal Funds Purchased 40.0%
Repurchase Agreements 25.0%
Trading Liabilities 50.0%
Unsecured Borrowings <= 1 Year 75.0%
Unsecured Borrowing > 1 Year 0.0%
Secured Borrowings <= 1 Year 25.0%
Secured Borrowings > 1 Year 0.0%
Subordinated Debt and Limited Liability Preferred Stock
15.0%
Other Liabilities 0.0% * A negative rate implies growth.
Given the resulting total liabilities after runoff, assets are then reduced pro rata to
preserve the relative amount of assets in each of the following asset categories and to
achieve a Tier 1 leverage ratio of 2 percent:
Cash and Interest Bearing Balances;
Trading Account Assets;
Federal Funds Sold and Repurchase Agreements;
Treasury and Agency Securities;
Municipal Securities;
Other Securities;
Construction and Development Loans;
Nonresidential Real Estate Loans;
Multifamily Real Estate Loans;
1-4 Family Closed-End First Liens;
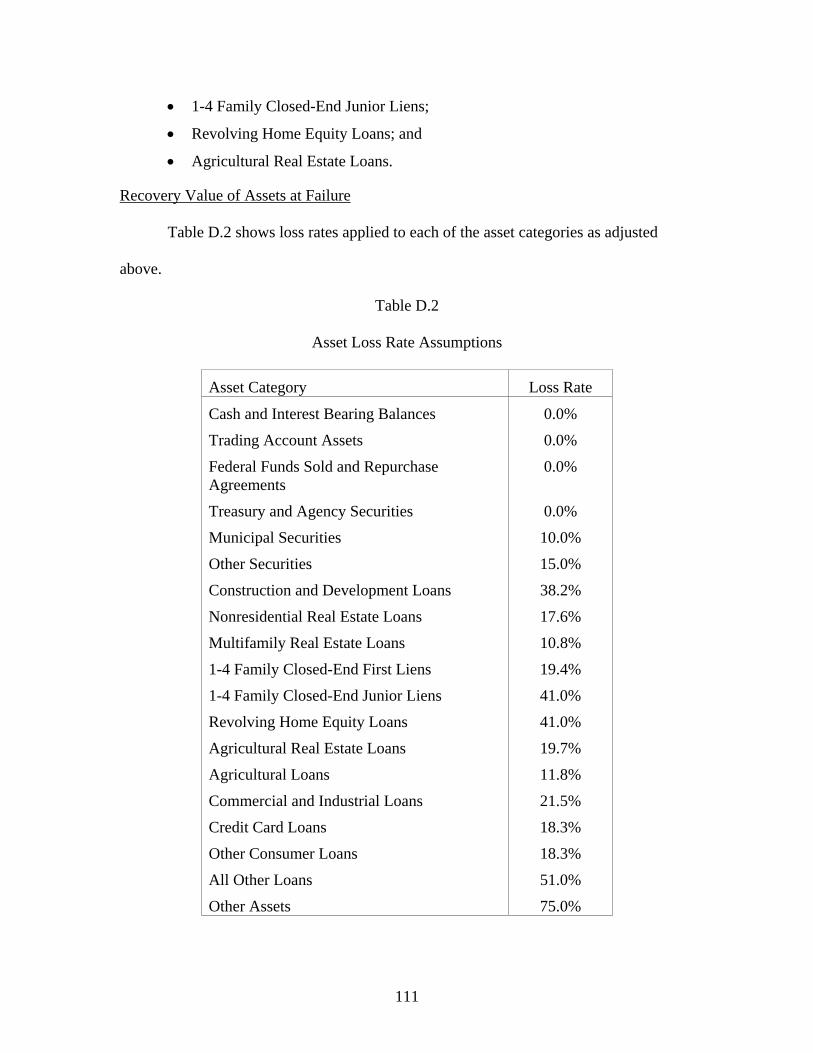
111
1-4 Family Closed-End Junior Liens;
Revolving Home Equity Loans; and
Agricultural Real Estate Loans.
Recovery Value of Assets at Failure
Table D.2 shows loss rates applied to each of the asset categories as adjusted
above.
Table D.2
Asset Loss Rate Assumptions
Asset Category Loss Rate
Cash and Interest Bearing Balances 0.0%
Trading Account Assets 0.0%
Federal Funds Sold and Repurchase Agreements
0.0%
Treasury and Agency Securities 0.0%
Municipal Securities 10.0%
Other Securities 15.0%
Construction and Development Loans 38.2%
Nonresidential Real Estate Loans 17.6%
Multifamily Real Estate Loans 10.8%
1-4 Family Closed-End First Liens 19.4%
1-4 Family Closed-End Junior Liens 41.0%
Revolving Home Equity Loans 41.0%
Agricultural Real Estate Loans 19.7%
Agricultural Loans 11.8%
Commercial and Industrial Loans 21.5%
Credit Card Loans 18.3%
Other Consumer Loans 18.3%
All Other Loans 51.0%
Other Assets 75.0%

112
Secured liabilities at failure
Federal home loan bank advances, secured federal funds purchased, foreign
deposits and repurchase agreements are assumed to be fully secured.
Loss Severity Ratio Calculation
The FDIC’s loss given failure (LGD) is calculated as:
FailureFailureFailure bilitiesSecuredLiaslueofAssetRecoveryVapositsDomesticDe Failure
Failure
positsDomesticDe
ositsInsuredDepLGD
An end-of-quarter loss severity ratio is LGD divided by total domestic deposits at
quarter-end and the loss severity measure for the scorecard is an average of end-of-period
loss severity ratio for three most recent quarters.

113
Appendix 1
Statistical Analysis of Measures
The risk measures included in the performance score and the weights assigned to
those measures are generally based on the results of an ordinary least square (OLS)
model, and in some cases, a logistic regression model. The OLS model estimates how
well a set of risk measures in 2005 through 2008 can predict the FDIC’s view, based on
its experience and judgment, of the proper rank ordering of risk (the expert judgment
ranking) for large institutions as of year-end 2009.
The OLS model is specified as:
tki
n
kki ScoreRankingE ,,
102009, )(
where
k is a risk measure;
n is the number of risk measures; and
t is the quarter that is being assessed
The logistic regression model estimates how well the same set of risk measures in
2005 through 2008 can predict whether a large bank fails and it is specified as:
)( ,,1
0
1
1)Pr(
tki
n
kk Score
i
e
Fail
where
Fail is whether an institution i failed on or prior to year-end 2009 or not.50
50 For the purpose of regression analysis, large institutions that received significant government support or merged with another entity with government support.
114
To select the risk measures for the scorecard, the FDIC first considered those
measures deemed to be most relevant in assessing large institutions’ ability to withstand
stress. These candidate risk measures were converted to a score between 0 and 100,
using specified minimum and maximum cutoff values, and then tested for statistical
significance in both the expert judgment ranking and failure prediction models.
Table 1.1 provides descriptive statistics for all risk measures used in the large
institution scorecard and highly complex institution scorecard. As noted in Section II. A.
1., most but not all of the minimum and maximum cutoff values for each scorecard
measure equal the 10th and 90th percentile values among large institutions based upon
data from 2000 through 2009.
Table 1.1
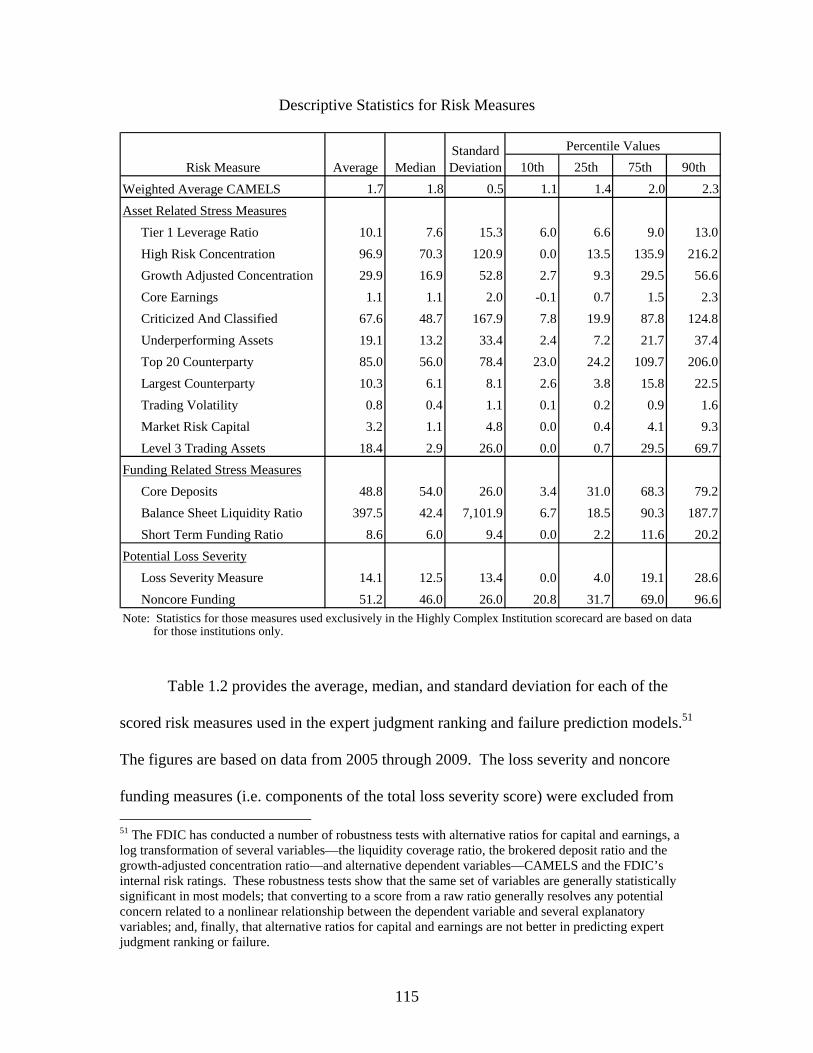
115
Descriptive Statistics for Risk Measures
10th 25th 75th 90th
Weighted Average CAMELS 1.7 1.8 0.5 1.1 1.4 2.0 2.3
Asset Related Stress Measures
Tier 1 Leverage Ratio 10.1 7.6 15.3 6.0 6.6 9.0 13.0
High Risk Concentration 96.9 70.3 120.9 0.0 13.5 135.9 216.2
Growth Adjusted Concentration 29.9 16.9 52.8 2.7 9.3 29.5 56.6
Core Earnings 1.1 1.1 2.0 -0.1 0.7 1.5 2.3
Criticized And Classified 67.6 48.7 167.9 7.8 19.9 87.8 124.8
Underperforming Assets 19.1 13.2 33.4 2.4 7.2 21.7 37.4
Top 20 Counterparty 85.0 56.0 78.4 23.0 24.2 109.7 206.0
Largest Counterparty 10.3 6.1 8.1 2.6 3.8 15.8 22.5
Trading Volatility 0.8 0.4 1.1 0.1 0.2 0.9 1.6
Market Risk Capital 3.2 1.1 4.8 0.0 0.4 4.1 9.3
Level 3 Trading Assets 18.4 2.9 26.0 0.0 0.7 29.5 69.7
Funding Related Stress Measures
Core Deposits 48.8 54.0 26.0 3.4 31.0 68.3 79.2
Balance Sheet Liquidity Ratio 397.5 42.4 7,101.9 6.7 18.5 90.3 187.7
Short Term Funding Ratio 8.6 6.0 9.4 0.0 2.2 11.6 20.2
Potential Loss Severity
Loss Severity Measure 14.1 12.5 13.4 0.0 4.0 19.1 28.6
Noncore Funding 51.2 46.0 26.0 20.8 31.7 69.0 96.6
Note: Statistics for those measures used exclusively in the Highly Complex Institution scorecard are based on data for those institutions only.
Risk Measure
Percentile ValuesStandard DeviationMedianAverage
Table 1.2 provides the average, median, and standard deviation for each of the
scored risk measures used in the expert judgment ranking and failure prediction models.51
The figures are based on data from 2005 through 2009. The loss severity and noncore
funding measures (i.e. components of the total loss severity score) were excluded from 51 The FDIC has conducted a number of robustness tests with alternative ratios for capital and earnings, a log transformation of several variables—the liquidity coverage ratio, the brokered deposit ratio and the growth-adjusted concentration ratio—and alternative dependent variables—CAMELS and the FDIC’s internal risk ratings. These robustness tests show that the same set of variables are generally statistically significant in most models; that converting to a score from a raw ratio generally resolves any potential concern related to a nonlinear relationship between the dependent variable and several explanatory variables; and, finally, that alternative ratios for capital and earnings are not better in predicting expert judgment ranking or failure.

116
the analysis, since neither of the dependent variables in the two regressions reflect the
expected (or actual) loss given failure. Most of the performance measures, other than
concentration and credit quality measures, are based on Call Report or TFR data and
defined in Appendix A. The concentration measure is described in detail in Appendix C.
Table 1.2 Descriptive Statistics for Risk Measure Scores
Weighted Average CAMELS 39.5 38.8 13.5
Tier 1 Leverage Ratio 68.0 77.6 30.8Concentration Measure 63.0 69.7 36.7Core Earnings / Average Total Assets 45.7 43.2 31.0Credit Quality Measure 39.9 32.6 31.2Core Deposits / Total Liabilities 40.3 32.8 32.3Balance Sheet Liquidity Ratio 68.9 80.4 31.8
Risk Measure Average MedianStandard Deviation
OLS Model Results and Derivation of Weights
Table 1.3 shows the results of the OLS model using the above measures for years
2005 through 2008. The dependent variable for the model is an expert judgment ranking
as of year-end 2009. All of the measures are statistically significant in several years at
the 10 percent level. Four of the seven measures—the weighted average CAMELS
rating, concentration measure, credit quality measure, and core deposits ratio—are
significant at the 5 percent level in all years.

117
Table 1.3 OLS Regression Results: Proposed Measures
Dependent Variable = Expert Judgment Ranking as of Year-end 2009
Scorecard Measures 2005 2006 2007 2008
Weighted Average CAMELS 0.60 *** 0.54 *** 0.54 *** 0.42 ***(0.13) ### (0.13) ### (0.12) ### (0.08) ###
Tier 1 Leverage Ratio 0.16 *** 0.14 *** 0.06 0.04(0.04) ### (0.04) ### (0.04) ### (0.03) ###
Concentration Measure 0.39 *** 0.38 *** 0.40 *** 0.25 ***
(0.04) ### (0.04) ### (0.04) ### (0.03) ###Core Earnings / Average Assets 0.06 0.13 *** 0.21 *** 0.20 ***
(0.05) ### (0.05) ### (0.04) ### (0.03) ###
Credit Quality Measure 0.15 ** 0.19 *** 0.29 *** 0.35 ***(0.06) ### (0.05) ### (0.04) ### (0.04) ###
Core Deposits / Total Liabilities 0.34 *** 0.28 *** 0.11 *** 0.20 ***(0.04) ### (0.04) ### (0.03) ### (0.03) ###
Balance Sheet Liquidity Ratio 0.12 *** 0.12 *** 0.11 *** 0.04(0.04) ### (0.04) ### (0.04) ### (0.03) ###
No. Obs 450 452 452 447Adjust. R2 0.46 0.47 0.56 0.67
Note: Standard error in parenthesis
* Significant at the 10% level ** Significant at the 5% Level *** Significant at the 1% Level
The weight for each scorecard measure was generally based on the weight implied
by coefficients for 2005 to 2008, with some adjustments to account for more recent
experience. The implied weights are computed by dividing the average of scorecard
measure coefficients for 2005 to 2008 by the sum of the average coefficients. For
example, the average coefficient on the weighted average CAMELS rating was 0.52,
which is about 31 percent of the coefficient sum for all measures (1.7). The current
proposal assigns a weight of 30 percent to this measure. Similarly, the average
coefficient of 0.36 on the concentration measure implies a weight of 21 percent (0.36/1.7
= 0.21). The proposal effectively assigns a weight of 17.5 percent (50 percent weight on

118
the ability to withstand asset-related stress score x 35 percent weight on the concentration
measure). Table 1.4 shows the average coefficients and implied and actual weights.
Table 1.4 Derivation of Scorecard Weights
Scorecard MeasuresAverage
CoefficientsImplied Weights
Scorecard Weights
Weighted Average CAMELS 0.52 31% 30.0%Tier 1 Leverage Ratio 0.10 6% 5.0%Concentration Measure 0.36 21% 17.5%Core Earnings / Average Assets 0.15 9% 10.0%Credit Quality Measure 0.24 14% 17.5%Core Deposits / Total Liabilities 0.23 14% 12.0%Balance Sheet Liquidity Ratio 0.10 6% 8.0%Total 1.70 100% 100.0%
Logistic Model Results
Table 1.5 shows the results of the logistic regression model, where the dependent
variable for the model is whether an institution failed before year-end 2009. The
weighted average CAMELS rating, Tier 1 leverage ratio, core deposits ratio, and
concentration measure are significant at the 5 percent level in all years. The core
earnings ratio, credit quality measure, and balance sheet liquidity ratio are not statistically
significant in several years.
Table 1.5 Logistic Regression Results
Dependent Variable (1 = Failed; 0= Not failed)
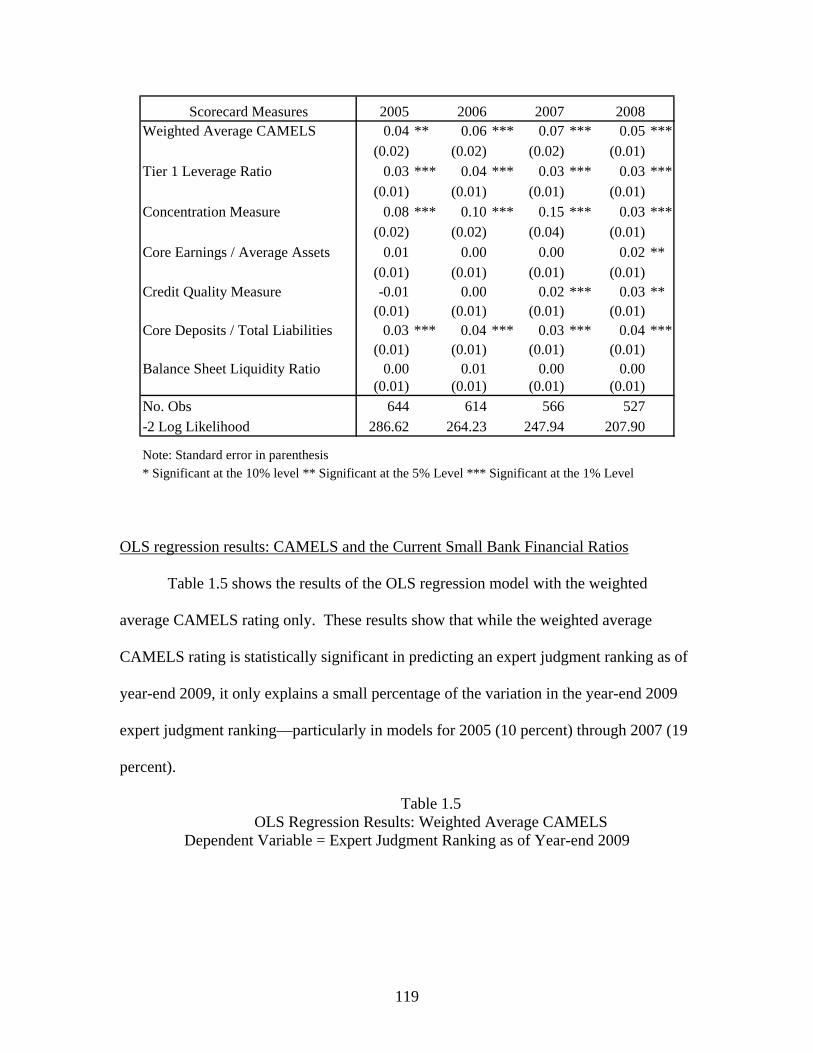
119
Scorecard Measures 2005 2006 2007 2008Weighted Average CAMELS 0.04 ** 0.06 *** 0.07 *** 0.05 ***
(0.02) ### (0.02) ### (0.02) ### (0.01) ###Tier 1 Leverage Ratio 0.03 *** 0.04 *** 0.03 *** 0.03 ***
(0.01) ### (0.01) ### (0.01) ### (0.01) ###Concentration Measure 0.08 *** 0.10 *** 0.15 *** 0.03 ***
(0.02) ### (0.02) ### (0.04) ### (0.01) ###Core Earnings / Average Assets 0.01 0.00 0.00 0.02 **
(0.01) ### (0.01) ### (0.01) ### (0.01) ###Credit Quality Measure -0.01 0.00 0.02 *** 0.03 **
(0.01) ### (0.01) ### (0.01) ### (0.01) ###Core Deposits / Total Liabilities 0.03 *** 0.04 *** 0.03 *** 0.04 ***
(0.01) ### (0.01) ### (0.01) ### (0.01) ###Balance Sheet Liquidity Ratio 0.00 0.01 0.00 0.00
(0.01) ### (0.01) ### (0.01) ### (0.01) ###No. Obs 644 614 566 527-2 Log Likelihood 286.62 264.23 247.94 207.90
Note: Standard error in parenthesis * Significant at the 10% level ** Significant at the 5% Level *** Significant at the 1% Level
OLS regression results: CAMELS and the Current Small Bank Financial Ratios
Table 1.5 shows the results of the OLS regression model with the weighted
average CAMELS rating only. These results show that while the weighted average
CAMELS rating is statistically significant in predicting an expert judgment ranking as of
year-end 2009, it only explains a small percentage of the variation in the year-end 2009
expert judgment ranking—particularly in models for 2005 (10 percent) through 2007 (19
percent).
Table 1.5 OLS Regression Results: Weighted Average CAMELS
Dependent Variable = Expert Judgment Ranking as of Year-end 2009

120
Variable
Weighted Average CAMELS 27.40 *** 30.44 *** 34.51 *** 36.08 ***(3.78) (3.65) (3.34) (2.13)
No. Obs 439 445 446 439Adjust. R2 0.10 0.13 0.19 0.40
Note: Standard error in parenthesis * Significant at the 10% level ** Significant at the 5% Level *** Significant at the 1% Level
20082005 2006 2007
Table 1.6 shows the results of the OLS regression model with a weighted average
CAMELS rating and the current small bank financial ratios. These results show that
adding the current small bank model financial ratios improves the ability to predict the
year-end 2009 expert judgment ranking; however, the improvement is not as significant
as in the model with proposed measures. For example, in 2006, the model with current
small bank financial ratios would have predicted slightly over 20 percent of the variation
in the current expert judgment ranking. This compares to 47 percent for the model with
proposed measures.
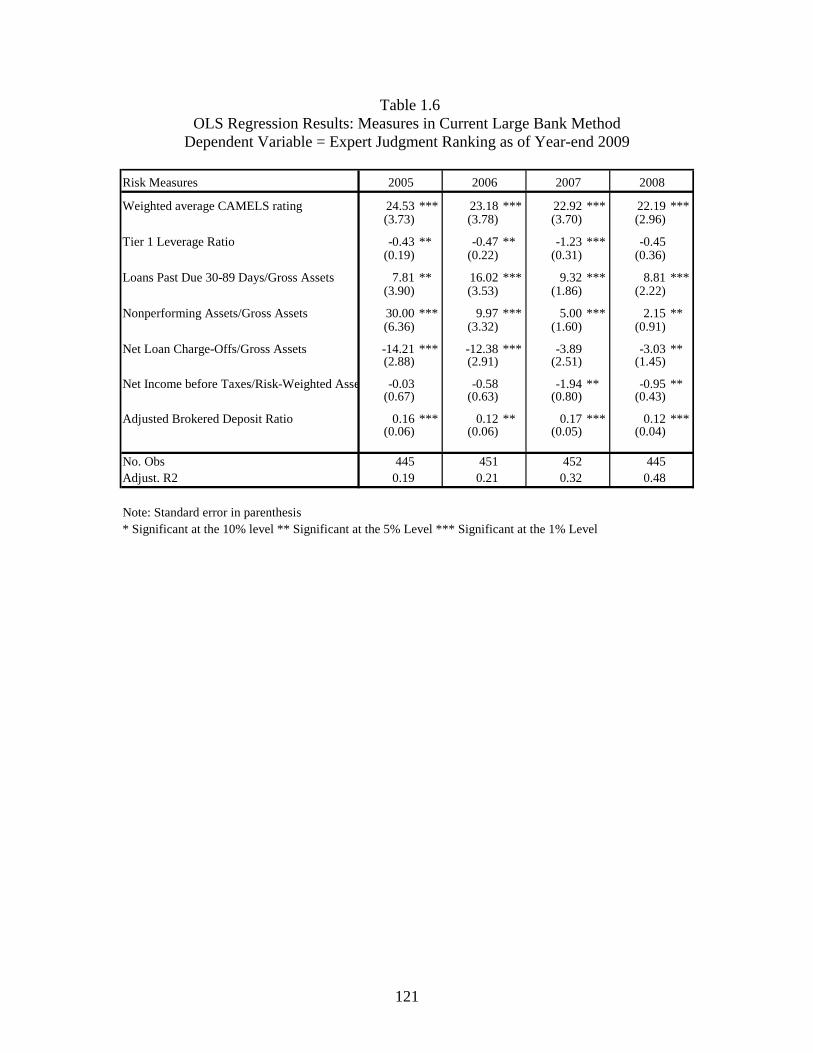
121
Table 1.6 OLS Regression Results: Measures in Current Large Bank Method
Dependent Variable = Expert Judgment Ranking as of Year-end 2009
Risk Measures
Weighted average CAMELS rating 24.53 *** 23.18 *** 22.92 *** 22.19 ***(3.73) (3.78) (3.70) (2.96)
Tier 1 Leverage Ratio -0.43 ** -0.47 ** -1.23 *** -0.45(0.19) (0.22) (0.31) (0.36)
Loans Past Due 30-89 Days/Gross Assets 7.81 ** 16.02 *** 9.32 *** 8.81 ***(3.90) (3.53) (1.86) (2.22)
Nonperforming Assets/Gross Assets 30.00 *** 9.97 *** 5.00 *** 2.15 **(6.36) (3.32) (1.60) (0.91)
Net Loan Charge-Offs/Gross Assets -14.21 *** -12.38 *** -3.89 -3.03 **(2.88) (2.91) (2.51) (1.45)
Net Income before Taxes/Risk-Weighted Asse -0.03 -0.58 -1.94 ** -0.95 **(0.67) (0.63) (0.80) (0.43)
Adjusted Brokered Deposit Ratio 0.16 *** 0.12 ** 0.17 *** 0.12 ***(0.06) (0.06) (0.05) (0.04)
No. Obs 445 451 452 445Adjust. R2 0.19 0.21 0.32 0.48
Note: Standard error in parenthesis * Significant at the 10% level ** Significant at the 5% Level *** Significant at the 1% Level
20082005 2006 2007
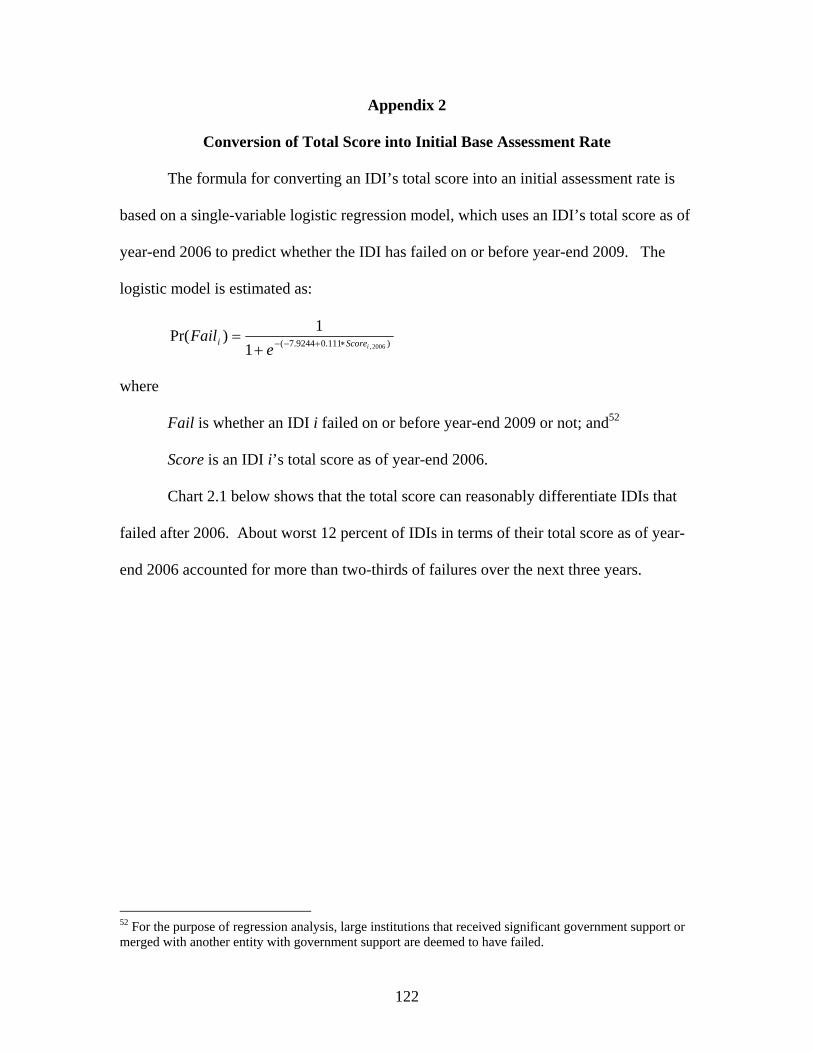
122
Appendix 2
Conversion of Total Score into Initial Base Assessment Rate
The formula for converting an IDI’s total score into an initial assessment rate is
based on a single-variable logistic regression model, which uses an IDI’s total score as of
year-end 2006 to predict whether the IDI has failed on or before year-end 2009. The
logistic model is estimated as:
)111.09244.7( 2006,1
1)Pr(
iScoreie
Fail
where
Fail is whether an IDI i failed on or before year-end 2009 or not; and52
Score is an IDI i’s total score as of year-end 2006.
Chart 2.1 below shows that the total score can reasonably differentiate IDIs that
failed after 2006. About worst 12 percent of IDIs in terms of their total score as of year-
end 2006 accounted for more than two-thirds of failures over the next three years.
52 For the purpose of regression analysis, large institutions that received significant government support or merged with another entity with government support are deemed to have failed.

123
Chart 2.1
Percentage of Failures Predicted by Total Score as of Year-end 2006
0.0
0.1
0.2
0.3
0.4
0.5
0.6
0.7
0.8
0.9
1.0
0 0.1 0.2 0.3 0.4 0.5 0.6 0.7 0.8 0.9 1
% of Failure
Percentage of 2006 Score (Highest to Lowest Score)
The plotted points in Chart 2.2 show the estimated failure probabilities for the
actual total scores using the logistic model and the results are nonlinear.
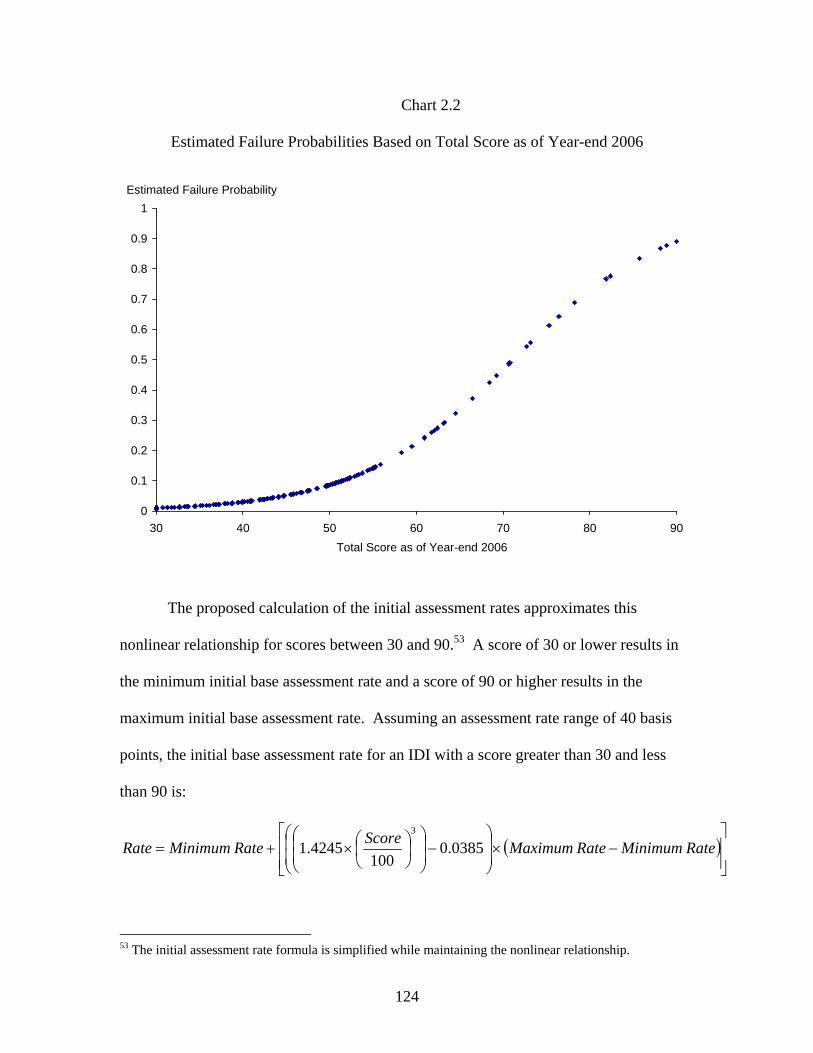
124
Chart 2.2
Estimated Failure Probabilities Based on Total Score as of Year-end 2006
0
0.1
0.2
0.3
0.4
0.5
0.6
0.7
0.8
0.9
1
30 40 50 60 70 80 90
Total Score as of Year-end 2006
Estimated Failure Probability
The proposed calculation of the initial assessment rates approximates this
nonlinear relationship for scores between 30 and 90.53 A score of 30 or lower results in
the minimum initial base assessment rate and a score of 90 or higher results in the
maximum initial base assessment rate. Assuming an assessment rate range of 40 basis
points, the initial base assessment rate for an IDI with a score greater than 30 and less
than 90 is:
Rate MinimumRate Maximum
ScoreRate MinimumRate 0385.0
1004245.1
3
53 The initial assessment rate formula is simplified while maintaining the nonlinear relationship.

125
By order of the Board of Directors.
Dated at Washington, D.C., this 9th day of November, 2010
Federal Deposit Insurance Corporation
Robert Feldman
Executive Secretary
* * *


![FEDERAL RESERVE SYSTEM Docket No. [] FEDERAL DEPOSIT ... · Docket No. [] FEDERAL DEPOSIT INSURANCE CORPORATION RIN 3064-ZA15 Proposed Guidance for Resolution Plan Submissions of](https://img.dokumen.tips/doc/110x75/5f02493c7e708231d403828c/federal-reserve-system-docket-no-federal-deposit-docket-no-federal-deposit.jpg)


![FEDERAL RESERVE SYSTEM - fdic.gov · PDF fileFEDERAL RESERVE SYSTEM . 12 CFR Part 225 . Regulation Y; Docket No. [ ] RIN [ ] FEDERAL DEPOSIT INSURANCE CORPORATION . 12 CFR Part 360](https://img.dokumen.tips/doc/110x75/5a7c3d4a7f8b9a2e358c8d31/federal-reserve-system-fdicgov-reserve-system-12-cfr-part-225-regulation.jpg)


![[XXXX-XX-X] FEDERAL DEPOSIT INSURANCE … [XXXX-XX-X] FEDERAL DEPOSIT INSURANCE CORPORATION 12 CFR Part 370 RIN 3064-AD37 Final Rule Regarding Amendment of the …](https://img.dokumen.tips/doc/110x75/5ac108947f8b9a4e7c8c8caf/xxxx-xx-x-federal-deposit-insurance-xxxx-xx-x-federal-deposit-insurance.jpg)