Embed Size (px)
Citation preview

FEATURE
44 | september 2016 beNCHmArK www.benchmarkminerals.com
the path to half a terrawatt: An extensive review of the whole lithium ion supply chain, from mine to market. What raw material will be needed and by when?
the lithium ion supply chain

beNCHmArK september 2016 | 45www.benchmarkminerals.com
LiThiUm ion
the lithium ion supply chain

FEATURE
46 | september 2016 beNCHmArK www.benchmarkminerals.com
both its new plant in Xi’an, China and at its already established facility in Ulsan, Korea.
Within the US, Tesla’s Gigafactory 1 opened in early 2016 as a battery pack facility but is expected to be making cells from scratch by the end of the year. Once fully operational and at capacity, the $5bn investment will be not only the world’s biggest battery plant and largest pack assembly facility, but also the world’s largest building by footprint, period.
North of the Gigafactory, in the traditional home of the auto industry, LG Chem is expanding its Holland, Michigan cell plant. The Holland plant, which cost $338m, including a $151m government grant, is expected to treble its capacity to 3GWh within the next four years.
US-based company Boston Power is focusing on increasing capacity in China and Taiwan, taking its total capacity to an estimated 7GWh from today’s 800MWh.
battery costs are falling The cost of producing a lithium ion battery cell has been steadily falling over the last decade.
In 2006, the cost of producing a cell was north of $1,000/kWh but manufacturing improvements pushed this figure below $500/kWh in 2013 and between $250/kWh and $400/kWh in 2016.
Between 2000 and 2015, the cost of a cell fell an average of 12% a year, but from 2016 to 2020, Benchmark expects this rate
he lithium ion battery industry is going through a renaissance period with billions of dollars being committed to expanding production capacity.
Benchmark Mineral Intelligence has tracked at least 12 lithium ion battery megafactories that are being constructed today.
These are lithium ion cell manufacturing facilities that have multi-gigawatt hour production capabilities, a step change from the megawatt scale level the industry operates at today.
The construction of the battery megafactories alone will increase the lithium ion industry capacity by over 80GWh, a figure that does not include widespread smaller expansions, especially in China, and an increasing capacity utilisation rate that could add an estimated 20GWh.
In 2015, the industry produced 65GWh worth of lithium ion cells, so there is no doubt that significant change for the lithium ion supply chain is here.
From the accompanying chart, it is clear that while the focus is on Tesla’s Gigafactory 1 in Nevada – the biggest of all new lithium ion battery plants at 35GWh of new capacity and a 50 GWh pack capacity – nearly 70% of new cell capacity is being installed in China.
This surge in projects being established by both Chinese battery producers and Japanese and Korean JV partners is just the start for the industry.
Significant investments by Amperex Technology Ltd (ATL) and Tianjin Lishen Battery Joint Stock Co Ltd (Lishen) are ones to watch as China’s leading battery producers are being leant upon not only by government-backed industries within the country but major consumers in the rest of the world.
Both companies have grand plans to expand into the tens of GWh capacity, with Benchmark estimating Lishen to reach 10GWh capacity by 2018 and ATL 25GWh capacity by 2021, a three-fold and five-fold increase on today’s levels, respectively.
Samsung SDI, Panasonic and LG Chem are all planning new lithium ion plant expansions, some of which are pre-existing plants that are being expanded and others being new greenfield investments.
Samsung is looking to increase capacity in
t NeW globAl litHium ioN bAttery CApACity uNder CoNstruCtioN
Source: Benchmark Mineral Intelligence
more than $20bn has been committed to building new lithium ion cell capacity with more than 70% of new demand in China

beNCHmArK september 2016 | 47www.benchmarkminerals.com
▲
LiThiUm ion
This is vitally important if the same batteries are to go mainstream and be used in our cars and to power our homes. Public acceptance has to be there and with lithium ion it already is.
There is the anecdote that NASA would only use older technology in the space cockpits that put man on the moon as it was known and trusted. The same can be said for why large corporations will never install the latest version of Microsoft Office across their networks for fear that a new bug could derail their whole operation.
The same principle applies to lithium ion batteries in EVs and utility storage.
n The road to commercialisation is long: In the past, batteries have taken decades to commercialise. For example, with the rechargeable lithium ion, it was invented in the early 1970s, commercialised by Sony for its Walkman in 1992, but only really took off in the mid-2000s and the advent of the smartphone era.
While new chemistries are in the pipeline – including lithium air and lithium sulphur, the two most promising at present – there is very little chance of seeing a mainstream appearance in EVs or utility storage in the next decade.
The Battery Technology Road Map from Panasonic (see page 48) shows when it expects the world to enter a post lithium ion era. They have it pencilled in for 2030, together with solid state batteries.
n Lithium ion batteries are improving: Another major reason why we do not see competitors usurping lithium ion soon is because lithium ion batteries are getting better. We are just at the start of an advanced lithium ion era where investments in cathode and anode R&D are beginning to pay off.
In terms of anode developments, the commercialisation of spherical graphite has not only allowed the costs to come down, but holds the potential to increase the anode capacity. Many companies are now looking into adding silicon into the graphite anode – up to 15% – to further increase this performance. However, there are many pitfalls with either pure silicon anodes or as an additive including its expansion ratio, lack of durability, and cost. We expect silicon to play a major role post-2020.
of decrease to average 15-20% a year as the industry introduces significant scale into the manufacturing process.
the risk of competing chemistries Benchmark receives many questions on whether lithium ion will be replaced by other battery technologies in the relatively near future. Our response is always no.
This is for a number of reasons, which are: n A known technology for mass adoption: Lithium ion batteries of all chemistries have been known to the world for some time now. They have been tested in all cases, its highest profile problems – including Sony laptops and Boeing planes – have been exposed, and the public is comfortable with the technology.
bAttery iNdustry groWtH: 2000 - 2015
Source: Avicenne
20,000
18,000
16,000
14,000
12,000
10,000
8,000
6,000
4,000
2,000
2000
other
lithium ion
$(m
)
2001 2002 2003 2004 2005 2006 2007 2008 2009 2011 2012 2013 2014 201520100
Source: Benchmark Mineral Intelligence
litHium ioN bAttery Cell mANufACturiNg Costs $/KWH
3,000
2,500
High low
2,000
1,500
1,000
500
0 2000
2001
2002
2003
2004
2005
2006
2007
2008
2009
2010
2011
2012
2013
2014
2015
2016
2017
2018
2019
2020

FEATURE
48 | september 2016 beNCHmArK www.benchmarkminerals.com
adoption of lithium ion cells in the transportation sector has been the idea of a ‘holy grail’ for battery costs – what many believed to be $250/kWh.
Although average industry costs are still slightly above this level there is now little doubt from the battery majors that this target can not only be achieved, but surpassed substantially by as early as 2020.
Denise Gray, CEO and President of LG Chem Power, noted that the company has been working with major auto manufacturers to achieve cost savings through improvements in active materials and optimisation of both electrodes and other components.
These developments, alongside the economies of scale the company intends to achieve through facility expansions in South Korea, China and the US (which will allow them to supply over 300,000 EV batteries), have seen the company rally around the cost target of $100/kWh by 2020.
And while scale is central to the plans of all battery majors over the coming
For cathode developments, a wide variety of new chemistries and tweaks within existing chemistries have vastly improved cathode performance over the last decade. Today, the mainstream lithium ion chemistries we see going forward are NMC (Nickel Manganese Cobalt) and NCA (Nickel Cobalt Aluminium).
As a result, average energy density of a lithium ion battery has improved 5% a year between 1992 and 2016. There were also periods of improvement which were closer to 8%, such as when energy density increased from 360 Wh/l to 525 Wh/l between 2000 and the end of 2005.
Changing cathodes Lithium ion has been the main beneficiary of growth in demand for rechargeable batteries, soaring to a capacity of over 60GWh in 2020 from around 10GWh in 2005, while competing technology predecessors such as NiMh have stagnated at less than 5GWh capacity.
And this is before the market enters its real period of growth.
Benchmark forecasts expect lithium ion capacities to at least double by as early as 2020, with mass scale expansions in production facilities and strong demand growth from the electric vehicle market.
Both these developments, side by side, will address the final obstacle in attaining mass-market adoption – cost.
Central to the concept of wide-spread
▲
ener
gy d
ensi
ty (W
h/kg
)
Positive material: olyvin system
solid solution minerals
fluoride materials
negative material: oxide system (sio, sno, moo2, etc)
Alloy materials (si system, sn system, etc)
Electrolyte: ionic liquid etc
Positive material: liCoo2, limn2o4, li(Ni-mn-Co)2, lifepo4
negative material: graphite, li4ti5o12
Electrolyte: eC/dmd/emC
500
400
300
Higher capacity
Higher capacity
li-Air battery
lis battery
Higher safety levels
Higher safety levels200
100
present Cy2030Cy2016
0
Source: PanasonicReproduced from Nikkei Electronics
bAttery teCHNology roAdmAp
HoW litHium ioN’s Ability to store more eNergy HAs improved
Advanced Li-ion
Post Li-ion
All solid battery
Current Li-ion
Source: Cairn ERA, Huret Associates
800
1996
Wh/1 (volumetric energy density) Wh/Kg (gravimetric energy density)
2006 2016
700
600
500
400
300
200
100
0
beNCHmArK september 2016 | 49www.benchmarkminerals.com
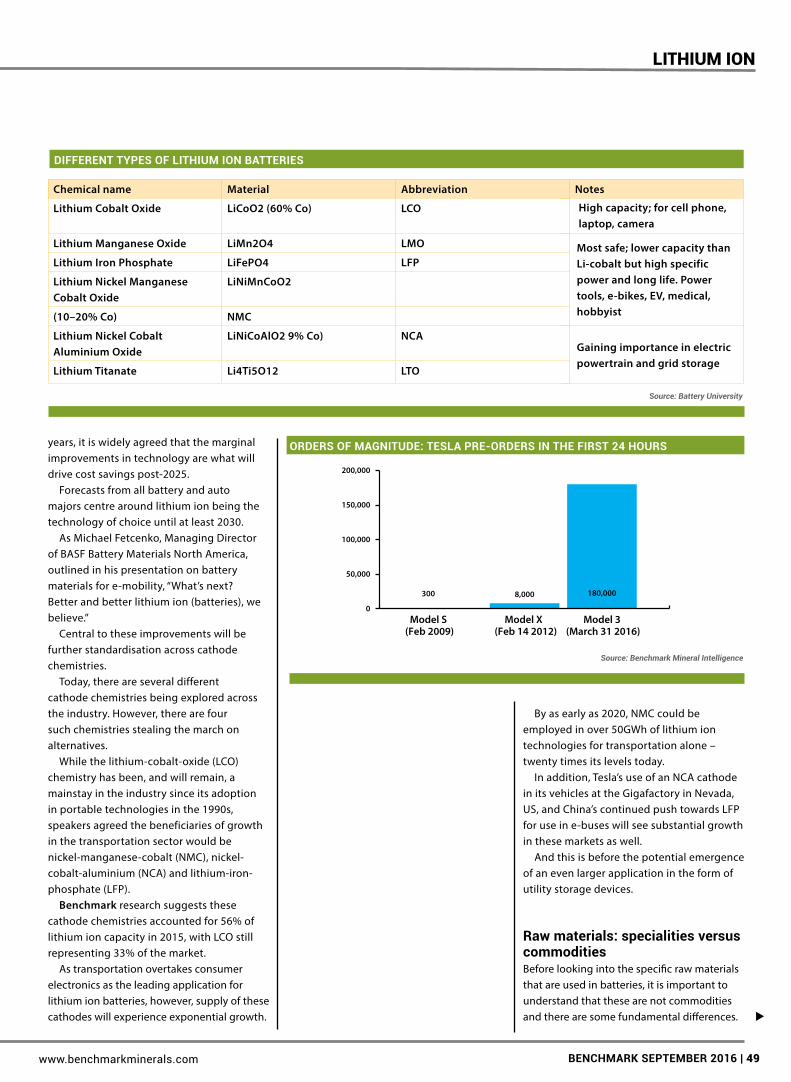
By as early as 2020, NMC could be employed in over 50GWh of lithium ion technologies for transportation alone – twenty times its levels today.
In addition, Tesla’s use of an NCA cathode in its vehicles at the Gigafactory in Nevada, US, and China’s continued push towards LFP for use in e-buses will see substantial growth in these markets as well.
And this is before the potential emergence of an even larger application in the form of utility storage devices.
raw materials: specialities versus commodities Before looking into the specific raw materials that are used in batteries, it is important to understand that these are not commodities and there are some fundamental differences.
years, it is widely agreed that the marginal improvements in technology are what will drive cost savings post-2025.
Forecasts from all battery and auto majors centre around lithium ion being the technology of choice until at least 2030.
As Michael Fetcenko, Managing Director of BASF Battery Materials North America, outlined in his presentation on battery materials for e-mobility, “What’s next? Better and better lithium ion (batteries), we believe.”
Central to these improvements will be further standardisation across cathode chemistries.
Today, there are several different cathode chemistries being explored across the industry. However, there are four such chemistries stealing the march on alternatives.
While the lithium-cobalt-oxide (LCO) chemistry has been, and will remain, a mainstay in the industry since its adoption in portable technologies in the 1990s, speakers agreed the beneficiaries of growth in the transportation sector would be nickel-manganese-cobalt (NMC), nickel-cobalt-aluminium (NCA) and lithium-iron-phosphate (LFP).
Benchmark research suggests these cathode chemistries accounted for 56% of lithium ion capacity in 2015, with LCO still representing 33% of the market.
As transportation overtakes consumer electronics as the leading application for lithium ion batteries, however, supply of these cathodes will experience exponential growth.
▲
LiThiUm ion
Positive material: liCoo2, limn2o4, li(Ni-mn-Co)2, lifepo4
negative material: graphite, li4ti5o12
Electrolyte: eC/dmd/emC
li-Air battery
lis battery
Source: Battery University
Source: Benchmark Mineral Intelligence
differeNt types of litHium ioN bAtteries
orders of mAgNitude: teslA pre-orders iN tHe first 24 Hours
Chemical name Material Abbreviation Notes
Lithium Cobalt Oxide LiCoO2 (60% Co) LCO
Lithium Manganese Oxide LiMn2O4 LMO
Lithium Iron Phosphate LiFePO4 LFP
Lithium Nickel Manganese Cobalt Oxide
LiNiMnCoO2
(10–20% Co) NMC
Lithium Nickel Cobalt Aluminium Oxide
LiNiCoAlO2 9% Co) NCA
Lithium Titanate Li4Ti5O12 LTO
Gaining importance in electric powertrain and grid storage
Most safe; lower capacity than Li-cobalt but high specific power and long life. Power tools, e-bikes, EV, medical, hobbyist
High capacity; for cell phone, laptop, camera
Model 3 (March 31 2016)
0
50,000
100,000
150,000
200,000
Model S (Feb 2009)
300
Model X (Feb 14 2012)
8,000 180,000
FEATURE
50 | september 2016 beNCHmArK www.benchmarkminerals.com
A question of qualityFundamental differences between niche minerals and traditional commodities are evident throughout their respective supply chains, beginning with the way in which they are mined.
Where traditional commodities such as iron ore, copper and petroleum have long-established supply chains, rooted in decades of exploration that has identified and developed significant resources across the world, niche minerals have been neglected for a generation.
Many of these sectors have not seen a major new market entrant for over a decade and while the excitement surrounding emerging end markets has caused a surge in exploration since 2009, weak capital markets have stunted the progress of even the most unique of resources.
At the heart of this dearth in development lies the inability of investors to sever their ties to traditional mining project analysis.
Bigger is not necessarily better when it comes to niche minerals.
While the majority of commodity projects depend upon extraction and distribution on a vast scale, the precise properties of a resource are as critical to a niche mineral project as its size or proximity to market.
As a result, existing critical mineral mines are generally smaller scale projects, supplying an established set of customers with defined requirements. This is in contrast to the majority of major commodity mines.
For example, the world’s largest iron ore project, the Hamersley mine in Australia, produced 163m tonnes in 2014. In comparison, the world’s largest graphite mine has a capacity of 50,000 tpa, no lithium projects exceed 65,000 tpa LCE production and the vast majority of the 90,000 tonnes of cobalt produced every year comes as a by-product of copper and nickel plays.
With emerging hi-tech end markets threatening to disrupt the existing supply structure in many of these industries, a diversification of resources will be required. Whether this could be on the scale of traditional commodities remains to be seen, but existing reserves would suggest otherwise.
Adding valueThe starkest contrast between niche minerals
and commodities lies in where value is added in their respective supply chains.
Where commodity production is generally a volume game, niche minerals are refined, specialist products that require specific processing to ensure their efficient application.
This is a difference which is only becoming more apparent with the use of these previously industrial minerals in emerging hi-tech sectors.
Now, more than ever before, the secret behind niche mineral production resides in the hands of the processors. Supply security no longer refers to the ability of a producer to mine and deliver a product, but their ability to provide a consistent supply of tailored material which will maximise efficiency.
Despite being a minor input cost into applications like lithium ion batteries, these materials are proving critical in improving performance, and in turn overcoming some of the major barriers to adoption.
Few have the experience in these markets to recognise this in itself, not to mention to act upon it.
The emergence of new markets with more refined needs is exposing not only a lack of resources, but also a lack of expertise to provide materials in line with end-user requirements, both old and new.
▲
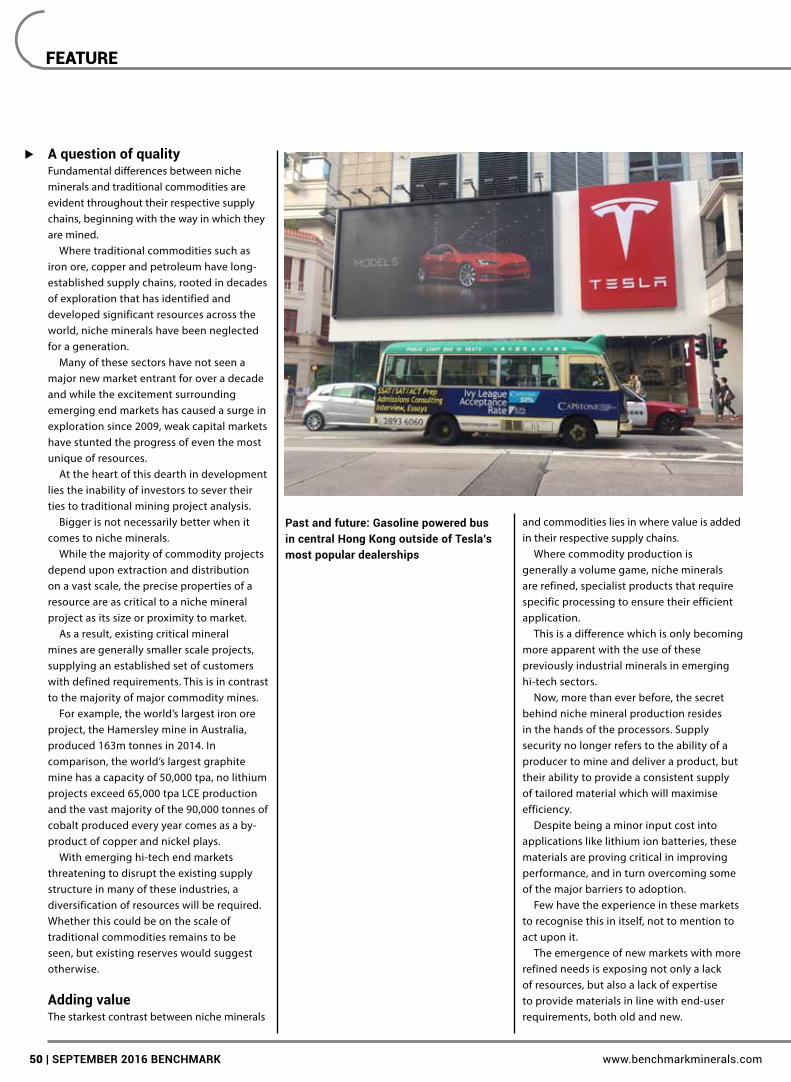
past and future: Gasoline powered bus in central Hong Kong outside of tesla’s most popular dealerships

beNCHmArK september 2016 | 51www.benchmarkminerals.com
LiThiUm ion
market maturityThe immaturity of these niche mineral markets relative to traditional commodities cannot be underestimated – everything from the way they are traded to their responsiveness to wider macro-economic developments differs.
Where traditional commodities are largely traded on established platforms, making them subject to external instruments such as hedging and futures markets, niche minerals
contracts are largely settled between producers and end users.
Despite a longer-term shift towards shorter-term contracting, since the financial crisis companies have attempted to avoid tying up capital in raw material stocks, meaning the bulk of niche mineral material continues to be traded less frequently, usually bi-annually or quarterly.
This antiquated approach to dealing makes niche mineral markets far more rigid
▲
stacks of flake graphite concentrate lie in wait in shandong province, China, as the country’s producers build up spherical graphite capacities to serve the battery market

FEATURE
52 | september 2016 beNCHmArK www.benchmarkminerals.com
than traditional commodities.While this sees a much slower erosion of
market in down-times, it also means that recoveries are often far more laboured.
It is likely that, as demand for these materials increases, and competition between traditional and emerging consumers escalates, modernisation will occur.
It is doubtful, however, that this will be a rapid process, with it generally working in the interests of established market players to preserve some element of opacity.
Until these established structures are put under increased scrutiny, evolution in the way these materials are traded is unlikely to occur at any speed.
For these reasons, the markets for these minerals must be viewed as a different beast to bulk commodities. They are typically not exchange traded, largely inflexible and unresponsive in the short term.
End-market developments can take months to be felt upstream, while supply-side volatility can send shockwaves through the supply chain.
price divergenceTraditionally, niche minerals have been tied to the fortunes of bulk industrial commodities. While not as responsive in the short term, the same end-market drivers have prevailed. In many ways, niche minerals follow in the footsteps of their bulk commodity counterparts.
Today, however, we stand on the verge of a new era in the relationship between these different materials and, as such, their pricing structures.
With the emergence of a new set of growth markets for niche minerals, the fortunes of these material prices are becoming further separated from the industrial commodities which once guided their fate.
These niche minerals are not simply seeing demand growth from the emergence of new hi-tech markets, but experiencing a period of fundamental restructuring with the addition of a new layer of demand.
The more crucial new markets become in the consumption of these raw materials, the further their pricing structures will deviate from commodities, forcing niche mineral markets on an increasingly disconnected trajectory.
This has already become evident in markets such as lithium, which has bucked the trend of almost all other raw material markets and registered price increases in excess of 20% in 2015 alone.
▲
ANode Carbon
Natural flake (spherical)Synthetic
sepArAtor Polymer films
CAtHode Lithium chemicals
NickelPhosphate
CobaltManganeseAnd more...
WHAt is A bAttery mAde of?
Source: Benchmark Mineral Intelligence
Hard rock lithium in Australia: a sample of Neometals spodumene which will
end up being chemically processed by ganfeng lithium for use in lithium ion
batteries

Chile
Australia
Argentina
Others
BENCHMARK sEptEMBER 2016 | 53www.benchmarkminerals.com
Lithium ion
While other areas like the flake graphite sector remain largely dependent on their industrial foundations, structural change is fast approaching, separating their fortunes from their industrial end markets towards a sector built on the foundations of hi-tech growth.
the Question of Commoditisation Arguably by the very definition of a commodity, a certain level of homogeneity between different products must exist.
No such homogeneity exists in the vast majority of niche raw material markets today.
The unique requirements of different end users dictate that specifications can vary considerably between end users creating the same application, not to mention different end markets.
This is a separation that has only been amplified by the emergence of a new set of hi-tech markets which, in many cases, are still trying to define the optimum material they require.
This lack of industry development in many critical mineral markets not only increases the rigidity of existing supply structures but raises barriers to entry for new suppliers seeking to spend capital on mining rather than R&D.
Although the attention paid to the niche minerals over the past 3-4 years has seen some level of commoditisation occur, these markets are still far from having established industry standards.
The nature of these materials and the role they play in various applications makes it likely that we will never see these materials commoditised to the same extent as today’s bulk commodities.
These niche minerals are increasingly becoming unique, refined, and advanced raw materials that can serve a range of markets.
This potential can be regarded as a major opportunity; however, misunderstanding the fundamental nature of these markets can present a new range of hazards.
Battery raw materials Batteries consume a wide variety of minerals and metals in their major anode, cathode, separator and electrode components.
The two most raw-material-intensive products are the anode, made from graphite,
and the cathode, which is a blend of a number of metals based on lithium.
Until now, these industries have been niche, speciality chemicals that are negotiated in private contracts between the buyer and seller. The significant growth expected in lithium ion batteries is forcing these speciality producers to significantly expand production and re-evaluate their entire supply chain, which must evolve to meet the new demand.
Lithium / Cathode supply Lithium supply is from two sources: liquid brine and hard rock.
The industry produces a wide variety of chemicals based on lithium carbonate raw material, including lithium hydroxide, lithium bromide, lithium chloride and lithium sulphate. As a result, the industry measures lithium supply in common units of lithium carbonate equivalent (LCE).
Lithium carbonate and lithium hydroxide are the two mainstream raw materials and are both used in lithium ion battery cathodes.
Brine, primarily from South America, was the leading sources of lithium in 2016 with an estimated 50% of supply from Chile and Argentina, the major producers in the region.
Chile, through SQM and Albemarle (formerly Rockwood Lithium), accounted for 37% of global output, extracting from continental brine sources in the Atacama Desert. These are huge salt flats (halite) which act as a sponge, collecting the mineral-rich water that washes into a closed basin from the surrounding volcanic mountain ranges.
Lithium, potash and magnesium are the primary minerals mined from these resources.
FMC Lithium is the major producer in Argentina, accounting for 10% of the world’s mined lithium, while new producer Orocobre is contributing volumes to the market as it ramps up production in its second year of operation.
With a new government in 2016, Argentina is one of the lithium industry’s great promises for new supply with a number of new potential entrants including Lithium Americas (now in partnership with Chile’s SQM), Lithium X Energy, and Galaxy Resources. ▲
LitHiuM RAw MAtERiAL suppLy By COuNtRy iN 2015
GLOBAL LitHiuM suppLy By pROduCt
Source: Benchmark Mineral Intelligence
Source: Benchmark Mineral Intelligence
Lithium carbonate 53%
Lithium hydroxide 25%
Lithium metal 6%
Butyl lithium 5%
Lithium chloride 5%
Other 6%
37%
9%
13%
41%

FEATURE
54 | september 2016 beNCHmArK www.benchmarkminerals.com
Hard rock lithium, spodumene mineral mined from petalite ore, is produced from one large mine in Australia. Talison Lithium operates this mine and produced 65,000 tonnes of lithium supply (LCE) in 2016.
The mine is a strategic source of lithium as it is owned by Chinese lithium chemical producer Sichuan Tianqi (51%) and US chemicals company Albemarle (49%). The vast majority of output is destined for the Chinese market and chemical conversion into a number of downstream lithium chemicals.
China does not have any significant domestic lithium resources either in brine or hard rock form. While the country has increased its domestic lithium output in recent years, it is marginal compared to the rest of the world.
The Qinghai salt lakes in China’s west have long been touted as a potential significant source of lithium as it hosts 77% of its resources. However, commercially it has failed to take off in any way, mainly due to the unfavourable chemistry compared to other sources in South America.
The source has seen over $1bn invested in commercialisation attempts over the last decade with no significant results. Most recently, EV producer BYD were eyeing a stake in the source in an attempt at supply sufficient for the country.
But realistically, with the known lithium
resources in the country, China will always be heavily dependent on lithium imports.
Bolivia has also been a high profile potential source, commonly being dubbed the Saudi Arabia of lithium in relation to its Salar de Uyuni hosting the world’s largest lithium resource.
The reality is that, to date, it has been another high profile failure of the industry with numerous problems dogging its commercialisation, including a high lithium to magnesium ratio and government distrust over foreign investment and technical partners. We do not expect Bolivia to be a major producer of lithium in the medium term.
Lack of expansion from brine producers and explorers has meant the industry has turned to hard rock sources to fill the supply gap in recent years.
Australia’s Talison Lithium has been the biggest beneficiary of this, but it has also pushed a number of development stage companies on the edge of new production.
Galaxy Resources and Neometals, both with operations based in Western Australia, are now on the verge of new production from their respective mines and both have Chinese backing through off-take deals and equity stakes. Both companies have been developing their resources since the first lithium boom of 2009-2010.
▲
1m y-o-y yTD ToDay lasT
inDex performance 4.1% 100.4% 58.4% 212.5 204.1
2009 2010 2011 2012 2013 2014 2015 Aug 2016
60
80
100
120
140
160
180
200
220
240
bmI LItHIum prICe INdex
Source: Benchmark Mineral Intelligence
40%
LItHIum’s mArKets IN 2016 (LCe)
Source: Benchmark Mineral Intelligence
batteries
Glass/ceramics
Grease
Air treatment
Others
20%
5%
12%
25%
40%

by-product
primary
recycled
Nickel
Copper
beNCHmArK september 2016 | 55www.benchmarkminerals.com
LiThiUm ion
Pilbara Minerals, a newcomer to the lithium space, has been one of the brightest performers on the stock market, primarily down to a large spodumene resource and supply agreements.
In Canada, another global hotspot for hard rock lithium exploration, Neometals has led the industry’s development in this region having secured $6m investment from Johnson Matthey for their spodumene mine and hydroxide plant. The company also has significant backing from the Quebec government, which wants to turn the province into a North American lithium hub.
Exploration in the US has been focused on Nevada and specifically Clayton Valley, which hosts lower grade brine resources to South America.
The area has been a focus for Tesla due to its locality to its mega-battery plant, Gigafactory 1, and it resulted in a supply partnership being signed with Pure Energy Minerals pending financing of its project.
Lithium is also found in other forms such as clays and geothermal brines.
Bacanora Minerals, another Tesla supply partner, is developing a significant lithium clay resource in northern Mexico and is targeting a 17,500 tpa carbonate plant.
Meanwhile in California, Simbol Materials – a failed acquisition target for Telsa – could be seeing a return to the lithium development sector after years of
mismanagement. The private company, which is seeking to extract lithium from geothermal brine, is the subject of a new takeover bid which could see it raise the $400m need to get into production.
demand and prices When lithium ion batteries overtook glass and ceramics as the industry’s primary market in 2010, it was a watershed moment for lithium.
The surge in lithium ion battery production in the mid-2000s – through our growing hunger for smartphones, laptops and tablets – saw demand growth jump from 5% pa to a consistent average of 8% pa.
It was a growth trajectory that was continuously underestimated by the majors, resulting in a strengthening lithium price throughout the late 2000s. When the financial crash impact took hold in 2009, demand weakened and prices fell for the first time in the decade.
However, in this same period, the industry saw the birth of the full electric vehicle through the Nissan LEAF, an entirely new market that used 16kWh batteries.
Once consumer spending regained its feet in the years following the crash, lithium’s price reacted strongly, increasing year-on-year between 2010 and today.
Between 2014 and 2016, owing to lithium ion battery demand from mobile technology and now pure EVs, lithium has fallen into the most severe shortage in recent memory and prices have increased four-fold inside China and three-fold in the rest of the world contracts.
As of August 2016, according to Benchmark Mineral Intelligence lithium prices collected to a methodology, lithium carbonate prices were between $20-25/kg within China and $12-15/kg in the rest of the world.
Meanwhile, lithium hydroxide prices were $25-30/kg inside China and $16-20/kg in the rest of the world contracts.
As of July 2016, the BMI Lithium Price Index stood at 191.6, up 89% year-on-year.
Benchmark’s medium term forecast for both grades is upward.
Cobalt / Cathode Much like lithium, batteries are the single largest end use for cobalt and have been the ▲
CobAlt’s by-produCt CoNuNdrum
drC domiNANCe: miNed supply by CouNtry iN 2015
Source: Benchmark Mineral Intelligence
Source: Benchmark Mineral Intelligence
drC
Canada
Australia
Cuba
russia
by-product production
>75%55:45
59%
5%6%
5%
9%
FEATURE
56 | september 2016 beNCHmArK www.benchmarkminerals.com
main driver of growth in the industry over the last decade.
Cobalt is used as an additive in the mainstream lithium ion cathodes of NCA (Nickel Cobalt Aluminium), NMC (Nickel Cobalt Manganese), and LCO (Lithium Cobalt Oxide).
Cobalt is a critical component of the cathode because it acts as a binder for the lithium ions and allows ions to move from the cathode to anode during discharge.
Cobalt supply has come under scrutiny of late following a report by Amnesty International which exposed the fact that some cobalt found in smartphone batteries was linked to child labour in the DRC. While the industry recognised that small proportions of cobalt supply does come from these controversial sources, it stressed that the vast majority of supply is still mined and traded in a responsible way.
The issues with child labour conflict minerals will continue to weigh heavy on cobalt.
supply Cobalt is produced as a by-product of copper and nickel production. The first step is mining and primary processing to reach an average concentrate of 6-10% cobalt content. The second stage is refining the cobalt concentrate to 20-30% content.
In 2015, the last full year of production,
102,000 tonnes of cobalt (all forms) of which 59% was mined from the Democratic Republic of Congo (DRC) as a by-product of copper production.
Outside of the DRC, there are no significant production hubs with the second largest producer, Canada, accounting for 9% of total supply.
Other producers include Russia, Cuba, Australia and the Philippines.
In total, cobalt is mined in 14 countries. But cobalt is a conundrum for the DRC. Firstly, having over half of the production
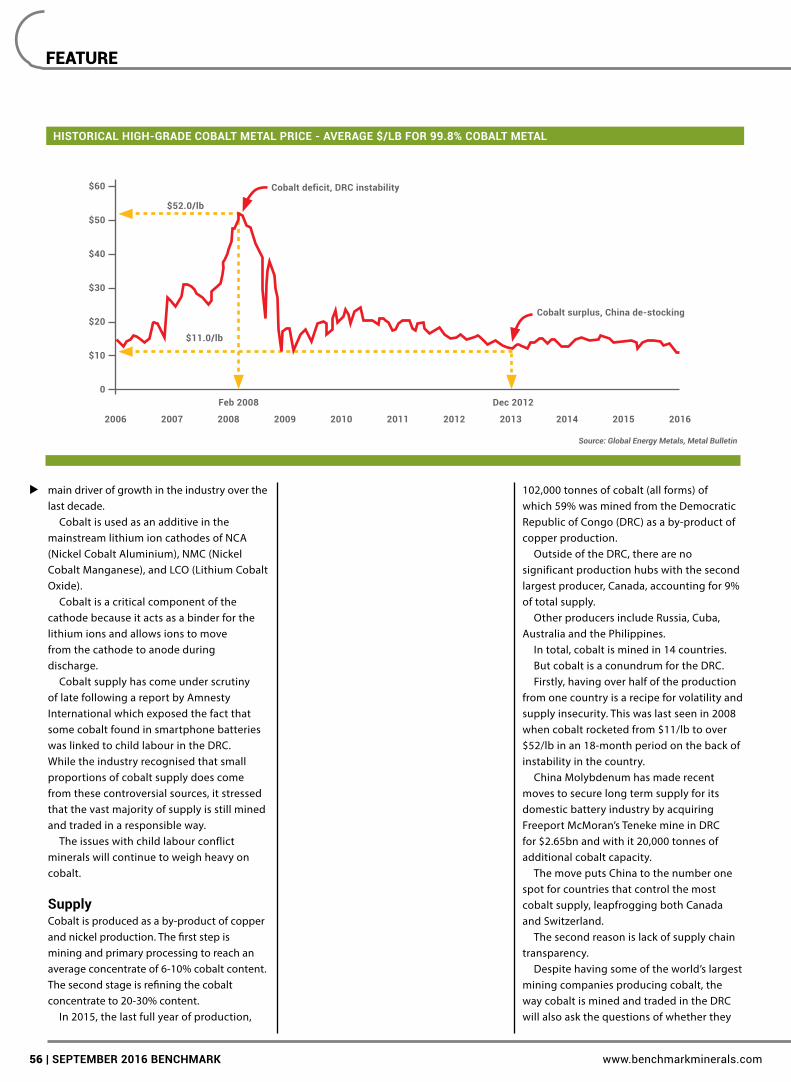
from one country is a recipe for volatility and supply insecurity. This was last seen in 2008 when cobalt rocketed from $11/lb to over $52/lb in an 18-month period on the back of instability in the country.
China Molybdenum has made recent moves to secure long term supply for its domestic battery industry by acquiring Freeport McMoran’s Teneke mine in DRC for $2.65bn and with it 20,000 tonnes of additional cobalt capacity.
The move puts China to the number one spot for countries that control the most cobalt supply, leapfrogging both Canada and Switzerland.
The second reason is lack of supply chain transparency.
Despite having some of the world’s largest mining companies producing cobalt, the way cobalt is mined and traded in the DRC will also ask the questions of whether they
▲
HistoriCAl HigH-grAde CobAlt metAl priCe - AverAge $/lb for 99.8% CobAlt metAl
$60
$50
$40
$30
$20
$10
0
2006
feb 2008
$52.0/lb
$11.0/lb
Cobalt deficit, drC instability
Cobalt surplus, China de-stocking
dec 2012
2007 2008 2009 2010 2011 2012 2013 2014 2015 2016
Source: Global Energy Metals, Metal Bulletin
beNCHmArK september 2016 | 57www.benchmarkminerals.com
LiThiUm ion
are linked to the conflict in the country or illegal practices such as child labour.
The industry has been proactive in signing up to a code of conduct through the Cobalt Development Institute (CDI), which warned of an “unjustified stigmatisation” of producers who follow strict standards.
“There is a risk of unjustified stigmatisation of all cobalt producers, including those in the CDI and International Council for Mining and Metals (ICMM), who for many years have followed strict corporate policies against the use of child labour and in the respecting of human rights,” the CDI’s president David Weight explained.
“Not only could this stigmatise the use of cobalt generally, to the detriment of the wider industry as a whole, but also those operations where the cobalt is mined and processed legitimately in full compliance with local regulations for health and safety and the protection of the environment,” he added.
The significant lack of alternative large scale, low cost supply, however, means the industry will continue to mine in the DRC, but ever increasing regulation will make it more restrictive
The US has had conflict minerals legislation for a number of years; however, it does not specifically cite cobalt but rather the “3TGs” minerals of tin, tungsten, and tantalum plus gold.
The EU is expected to enact a much wider-reaching conflict minerals legislation in 2016, which includes more countries and more minerals than the US legislation.
Unlike lithium and graphite, there are only a handful of explorers of new cobalt mines, including Canada (Fortune Minerals, Global Energy Metals, Formation Metals, Belvedere
Resources) and Australia (Broken Hill Prospecting, Panoramic Resources, Poseidon Nickel, Metallica Minerals, Tiger Resources).
No dedicated cobalt mines yet exist with the majority of production from nickel and copper operations.
demand and prices The cobalt industry is a split camp.
On one side you have traditional cobalt metal manufacturers producing superalloys, binders, catalysts to mature, and industrial markets that have struggled to offer any significant growth in recent years.
In the other corner, you have cobalt’s chemical manufacturers supplying a fast-growing new market, the battery sector.
The industry is further fragmented by believers and non-believers of the lithium ion revolution and a surge in battery applications outside of smartphones, powertools, laptops and tablets.
Cobalt’s future growth as a key component in lithium ion batteries relies on electric vehicles, homes and the commercial world using energy storage in ways never seen before.
New markets and new demand is a challenge for the well-established cobalt industry to consider and, most importantly, invest in.
Despite a compound annual growth rate in production of over 5% since the mid-1980s, the sector’s traditional end market, metal production, has been slowing, pushing supplies into surplus.
The growing needs of the battery sector – which grew by over 9% in 2014 – has insulated the cobalt industry from slowdown in industrial demand. However, slower than expected uptake of large-scale battery applications, namely electric vehicles, has left many industry players sceptical over the further growth potential of batteries.
Scepticism is deep-rooted among producers who, despite rallying calls from major battery consumers, remain wary of depending on an evolving market with a variety of battery chemistries, some of which do not use cobalt as part of the cathode makeup.
While these fears may carry some weight in the longer term, consumption patterns are likely to dictate that battery uncertainties can no longer be ignored.
Over the past five years alone, cobalt’s
▲
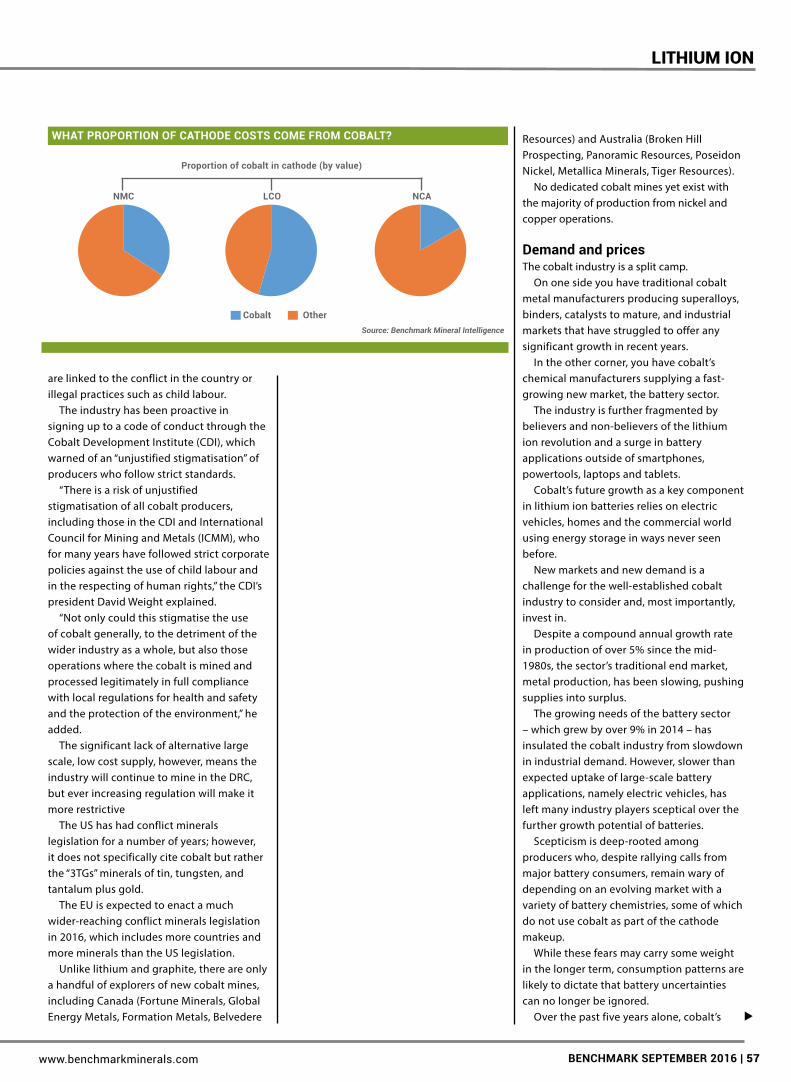
NmC
Cobalt other
proportion of cobalt in cathode (by value)
lCo NCA
WHAt proportioN of CAtHode Costs Come from CobAlt?
Source: Benchmark Mineral Intelligence

Natural spherical graphite
synthetic graphite
other
FEATURE
58 | september 2016 beNCHmArK www.benchmarkminerals.com
battery grade consumption has increased three-fold, and this growth looks set to continue considering the battery megafactories in the pipeline.
For example, the Tesla Gigafactory 1 alone will need 7,000 tonnes of battery grade cobalt each year when it is operating at capacity and that does not take into account the material the company would want to stockpile. This equates to at least a 15% increase in battery grade cobalt demand from one customer.
With this growth will come further disruption to the traditional market structures that have developed in cobalt over the last 30 years.
In short, a new, more secure supply chain for the modern era will need to be created, a task that includes new mines, new refineries, and a more transparent supply chain.
price volatility Today, cobalt metal prices remain at a low of $10-12/lb, but with battery demand soaring and supply falling with cutbacks on copper output, it leaves many questioning when the industry will return to the higher prices of the recent past.
In 2008, high grade cobalt metal prices soared to over $50/lb before the effects of the global economic crisis forced prices back below the $20/lb mark in 2013.
If a price cycle on this scale was to occur again, battery producers could be forced to move towards non-cobalt cathodes like lithium manganese oxide (LMO) or lithium iron phosphate (LFP).
However, the reality is that it would require prices to increase substantially in the short term and be coupled with severe long-term doubts for battery producers to totally abandon the technology they have developed over the last two decades – especially as they now stand on the precipice of a new era in demand.
Lessons can be learned from rare earths, which has experienced a more extreme yet similar situation.
In 2010, prices escalated to all-time highs on the back of supply restrictions in China. While the price of some rare earth elements rose by over 700% in 12 months, large end users such as Siemens AG and Boeing were reluctant to stop using the raw materials. They did, however, ramp up research in
substitute materials that could have an impact in years to come.
In a sense, necessity is the mother of invention and cobalt would want to avoid a rare earths situation by forcing its consumers to look at cobalt alternatives.
Shifting away from a cobalt cathode, as of yet, has become neither realistic nor conducive to the development of new end markets.
In order to avoid this type of obstacle, the cobalt market will be required to develop new resources – a tough ask considering the state of public markets today.
graphite /Anodes Graphite (carbon) is the largest raw material input by volume into a lithium ion battery cell and makes up the majority of the anode.
Battery-grade or anode graphite can be sourced either from naturally mined and processed graphite or man-made synthetically produced material.
In the graphite industry, the natural and synthetic camps are very different industries with little crossover.
The way each product is created and the markets they are sold into are very different, except for lithium ion battery anodes – the only market where both sides battle it out for dominance of the new hyper growth market.
Natural / spherical graphite Natural graphite is also known as flake graphite. This is a physical and chemical process that turns flake graphite into spherical graphite.
At present it takes a little over two tonnes of flake graphite to make one tonne of spherical graphite; however, new processing developments are expected to improve this yield closer to 70% rather than today’s 40% level.
These spheres are then sold to an anode manufacturer or trading company and made battery ready by coating them with a carbon film, adding stability and conductivity to the spheres. This product is then sold as anode material or coated spherical graphite at a price in excess of $7,000/tonne.
China produces 100% of uncoated spherical graphite and it accounts for 65% of the anode market.
▲ ANode mArKet iN 2015
Source: Benchmark Mineral Intelligence
market size: 80,000 tonnes

brazil
China
india
others
total: 600,000 tonnes (flake) and
52,000 tonnes (uncoated spherical)
China
beNCHmArK september 2016 | 59www.benchmarkminerals.com
LiThiUm ion
The main reason for this lack of diverse production in the market is a result of China being a low cost source of flake graphite feedstock.
The country produces 66% of the world’s output of flake graphite and only Brazil rivals the country as a volume producer of the material with a 25% share.
The world’s largest graphite producers include Aoyu Graphite Group, BTR New Energy Materials, Qingdao Black Dragon and Nacional de Grafite.
Europe and the US are dominated by processing and trading companies that source flake graphite from China and value-add into a number of products that serve industrial and hi-tech markets. Major players in this area include Asbury Carbons, Superior Graphite, Imerys Graphite & Carbon, Graftech, SGL Carbon, Georg H Luh, and Technografit.
AMG Mining / Graphit Kropfmühl also sources from China but also owns small to medium sized mines in Africa.
Since the price spikes of 2011, when flake graphite doubled in cost over a 12-month period, there has been significant exploration for the world’s next generation of graphite mines.
This exploration has centred on East Africa, Canada and Australia and has been led initially by Canadian (TSX-V) and Australian (ASX) developers.
Leading developers include Syrah Resources, which is the only fully funded new mine development, as of July 2016, located in Mozambique. The company is building the world’s biggest graphite mine (380,000 tpa capacity) with a focus on producing 30-50,000 tpa spherical graphite for the lithium ion market with a plant in Louisiana.
Other announced spherical graphite plants include Alabama Graphite’s plan in the US to establish a 15,000 tpa operation.
Other graphite mine developers who have a focus on the battery space include Magnis Resources, Black Rock Mining, Kibaran Resources, Talga Resources, Ontario Graphite, Graphite One Resources, Mason Graphite and Eagle Graphite.
In Canada, an alliance of four graphite development companies – Elcora Advanced Materials, Northern Graphite, Nouveau Monde Mining Enterprises, and Metals of
Africa – have partnered with Coulometrics to jointly acquire a spherical graphite mill with the goal of producing coated material “end to end in North America”.
The alliance is at an early stage and is seeking to have its material fully qualified by lithium ion battery producers.
synthetic graphite: Synthetic graphite is produced using a feedstock of petroleum coke and coal tar pitch, both by-products of oil and coking coal production, respectively. These carbon raw materials are mixed with a binder, usually coal tar pitch, and baked at temperatures exceeding 2,500 C.
For synthetic graphite’s primary product, steel electrodes – large rods to melt scrap – this graphitized raw material is extruded in rods. This process is energy intensive and can take up to 3 weeks to produce with the majority of this time taken up by the cooling of the rods.
However, for battery grade material the higher quality carbon raw materials are specifically chosen and are formed into blocks and baked at 700-900C. Once this is achieved the stock is then graphitized by temperatures of up to 3,200C to achieve a specific shape and density.
This material is then micronized to a specific size required for each different battery consumer – usually between 10-25 microns. This product is sold to battery producers for between $10,000 and $16,000/tonne.
The cost of production is more than double that of producing coated spherical graphite, the equivalent competing product.
Japan, China and the US are the major producers of battery grade synthetic graphite and it accounts for 34% of the anode market.
multi-billion-dollar convergence underpins demandA major factor in the battery megafactory race is the disruption caused by Tesla.
The company is not a traditional car manufacturer. The entry into the auto industry of what was, back in 2006, a Silicon Valley start-up, has caused major disruption to a mature industry, forcing established companies such as General Motors Co. (GM)
▲
flAKe grApHite feedstoCK supply iN 2015
spHeriCAl grApHite supply iN 2015
Source: Benchmark Mineral Intelligence
Source: Benchmark Mineral Intelligence
21%
66%
7%6%

FEATURE
60 | september 2016 beNCHmArK www.benchmarkminerals.com
and Nissan Motor Co. Ltd to act in the EV space.
Tesla Motors is also not a traditional battery producer, yet the turbulence caused by its Gigafactory plan has also sparked major battery producers discussed here, to re-evaluate their plans and invest significant sums of money into expansions.
It is a classic case of technological disruption.
Yet while the majority of the public initially saw Tesla disrupting the auto industry, its impact on the battery and energy storage industry is arguably greater.
The convergence of three multi-billion dollar industries of auto, technology and energy on batteries is a critical point.
Not only does it provide new funds and new competition, but it takes the problems of battery supply that has restricted demand uptake and views it with fresh eyes.
This disruption sparks others into action. Tesla CEO, Elon Musk, explained the
impact its first EV, the Roadster, back in 2008, had on the industry:
“When we first announced the Roadster, Bob Lutz of GM saw it and told his engineers that if a small company in California can do it, so can GM. That’s what got the [Chevrolet]
Volt rolling and that in turn got Nissan to do the LEAF.
“It’s what we induce others to do that will have a greater impact than the cars we make ourselves.”
This impact can now be seen quite evidently on the battery industry.
rise of the tech-industrialists This convergence has given rise to what Benchmark terms the Tech-Industrialists, a new generation of multi-discipline but technology-centric companies that are evolving to become a part of our everyday lives.
Google, Apple, Facebook, Tesla, and Amazon are all now household names.
The status of oil and gas majors, pharmaceutical companies and major conglomerates have all been put to the sword by the rise of these technology-centric companies as they have evolved from their Silicon Valley origins to shape our futures for communication, transport, energy storage and commerce.
In less than a decade, they have risen to become the world’s most powerful and influential companies and a generation
tHe evolviNg siliCoN vAlley set
Source: Benchmark Mineral Intelligence
Company business value business value
Apple pC hardware/software $38bn smartphone, pC, tablets,
software
$532bn
google internet search engine $127bn search, software, ads,
media, broadcasting,
innovation, data centres
$497bn
Amazon shopping website,
electronics, books
$15bn Commercial
giant, logistics, it
infrastructure, data
centres
$350bn
facebook social media site,
us uni exclusive
$ private social media, software
developer, vr
$340bn
tesla ev concept $ private Car manufacturer,
battery producer,
energy storage,
solar power producer
$31bn
2006 exxon $450bn
2016 Apple $532bn
the evolution of the silicon valley set into many industries including auto and energy is underpinning fundamental changes to the way we consume power, to which batteries are central
▲

beNCHmArK september 2016 | 61www.benchmarkminerals.com
LiThiUm ion
has grown up unfamiliar with names like ExxonMobil and GE, and seeing Microsoft as a poor cousin to Apple.
The development has been so rapid, there has been little time to reflect. But as we stand today, Google controls our usage of the Internet, Apple has made our life interconnected and mobile, Facebook has revolutionised the way we interact with human beings, Amazon has fundamentally shifted the way we buy things and Tesla is changing the way we use energy.
In the last five years alone, these Silicon Valley companies have grown to market capitalisations in the hundreds of billions of dollars and have come to dominate the table of the world’s most valuable companies.
For the first time in history, the top three most valuable companies in the world are Silicon Valley-based technology-based groups: Google, Apple and Facebook.
In fact, ExxonMobil held the top position for seven consecutive years until 2012 when Apple’s iPhone-powered rise usurped the energy group. In the previous periods in the late-1990s to mid-2000s the top spot was regularly shared between ExxonMobil, GE, and Microsoft.
But with Apple retaining the world’s most
valuable status since 2012, a title that was only recently taken – for a brief period in February 2016 – by Google (now trading under Alphabet), we have further proof that we now live in a different world, a world which is now being moulded by Silicon Valley and the rise of the Tech-Industrialists.
And their tentacles are spreading further. Google’s self-driving cars are now being
trialled on our roads, Apple is widely tipped to be about to enter the auto industry with its Titan electric vehicle project, Facebook is aggressively perusing both artificial intelligence and virtual reality technologies, Amazon is one of our biggest providers of data storage, controlling vast swathes of farms that collect and host all of our information, and Tesla is now not only developing mass scale electric vehicles but battery systems that can power our homes.
We are in an industrial renaissance period that has forced a convergence of disciplines and resulted in rapid and significant innovation.
The rate of change has been so rapid that we have barely had time to reflect on it and batteries and energy storage are critical components of many major plans by these companies.
litHium ioN rAW mAteriAl demANd sCeNArio (toNNes): A World HeAdiNg to HAlf A terAWAtt of storAge
70,000
Cobalt
lithium (lCe)
graphite anode
60,000
50,000
40,000
30,000
20,000
10,000
0
2015 2016 2017 2018 2018 2020 2021 2022 2023 2024 2025
Source: Benchmark Mineral Intelligence
tHe evolviNg siliCoN vAlley set


![The Lithium-Ion Battery Value Chain - Messe Sauber … · 2012-10-17 · The Lithium-Ion Battery Value Chain ... Market 2020 10.4 2015 2.3 2011 0.0 Energy demand [GWh] Forecast](https://img.dokumen.tips/doc/110x75/5b6a712b7f8b9a422e8c1dab/the-lithium-ion-battery-value-chain-messe-sauber-2012-10-17-the-lithium-ion.jpg)