Embed Size (px)
Citation preview

Feasibility study and simulation of a high energy diode-pumped
solid-state amplifier
Victor Hariton
Instituto Superior Tecnico, Lisboa, Portugal
April 2016
Abstract
Recently the Laboratory for Intense Lasers at IST started a program towards the installation ofa high energy DPSSL system, with the goal of allowing studies in various fields of science previouslynot available at this facility. This dissertation was performed in the framework of the developmentand implementation of a laser source based on CPA and diode-pumped Yb-doped materials, with anenergetic milestone set at 100 mJ and a repetition rate of 10 Hz. Amplification simulations are performedwith the goal of predicting the output energy and its dependece on temperature. Also spatial-temporaltemperature profile of the crystal, as well as the focal length of the induced thermal lens, are determinedboth analytically and numerically, with an approach based on finite element analysis developed for thisproblem. The conducted experimental work shows a good agreement with the models, revealing aminimum focal length of f = 2.37 m for the desired frequency of 10 Hz. A Gaussian beam propagationsimulation is performed, showing an absence of problems in implementing the setup with increasedrepetition rate.Keywords: high energy laser amplifiers. diode pumped lasers, ytterbium-doped laser media, thermaleffects in lasers
1. Introduction
Today, many of our daily life activities make use oflaser technology or laser-processed products. Ap-plications range from cutting and welding materi-als for cars, airplanes and ships down to nanometerscale lithography for microelectronics [1]. Besidesindustrial applications these light sources are usedin fields such as therapies, surgery [2] and opticalcommunications [3]. Also high power lasers enableus to probe fundamental laws of nature by grantingaccess to new physical regimes [4].
The vast field of applications made possible byhigh power lasers is due to the rapid progress of thistechnology over the past 30 years. This progresscan be attributed to a number of key develop-ments. The development of techniques such asmode-locking [5] and Q-switching [6] in the 1960sand most importantly of chirped pulse amplification(CPA) [7] in the mid 1980s allowed reaching highenergies concentrated in the form of very short lightpulses. An additional key element is the develop-ment of high quality solid state crystals that havegood properties for implementation of terawatt andpetawatt laser systems.
Lasers have reached a broad diversity in their firsthalf century. For instance, in size they range froma few centimeters to the extent of several football
fields [8]. Today,s state of the art lasers cover virtu-ally every color from the visible spectrum and be-yond, including mid-infrared radiation to hard X-ray radiation [9]. Applications in countless fields,such as medical, industrial, defense and science havecontributed to broadening the research and enhanc-ing the development of new technology.
Figure 1: Laser intensity evolution for the past 50years (Public Domain image).
Fig. 1 shows the evolution of the peak focusedlaser intensity during the last 50 years, and the
1

corresponding physical regimes that were unlocked.After a quick boost in the early 1960s, the increasein intensity experienced a period of stagnation fortwo decades, until the introduction of the CPA tech-nique in 1985 [7].
CPA is one of the most important techniques inthe current state of the art for high-energy and high-power lasers. It consists of three steps: temporalpulse stretching to avoid damage or nonlinear ef-fects associated to high peak intensities; safe am-plification in the gain media; compression to theoriginal time scale. Every ultrahigh power laser (> 100 Terawatts) relies on, and it enables ampli-fication of extremely short pulses, which require ahigher laser damage threshold of all the optics in-volved. CPA allowed to bypass this limitation, pro-viding increased levels of amplification. It enabledsmall-scale laboratories to create and operate withmulti-terawatt pulses, contributing to the miniatur-ization of large-scale experiments and leading to adecrease in the overall cost.
A particular class of lasers, diode-pumped solid-state lasers (DPSSL), has revealed advantages inhigh peak power generation. Peak power of a laserpulse can be estimated as P = E/τ , with E andτ being the energy and duration of the pulse, re-spectively. Early diodes did not find widespreaduse in pumping high power systems due to theirhigh prices. But nowadays, with decreasing pricesand the possibility of pumping in the vicinity ofthe absorption wavelength of the gain media, diodelasers enable great improvements in compactness,efficiency and overall cost, making them efficientreplacements for ion and flashlamp-pumped lasers.In addition to high peak power many of the ap-plications in industry and research require higheraverage power, defined as Pav = E × f , where f isthe pulse repetition rate (frequency). Laser-drivenplasma accelerators, nuclear fusion and materialprocessing require sub-picosecond systems operat-ing with multi-Joule pulse energies and kilohertzrepetition rates [10] and DPSSL have demonstratedbetter results and performance for such conditions.Currently heat problems still constrain large lasersystems and limit their performance to a few shotsper day. The rise of DPSSL holds the key to cir-cumventing this limitation, allowing such systemsto attain much higher repetition rates.
2. Motivation
The Laboratory of Intense Lasers (L2I) hosts a CPAlaser system based on two solid-state amplifiers,Fig. 2, using two different Yb-doped materials.
This work was carried out at the beginning ofthe transition of the L2I to a DPSSL program.It is focused on the second stage of amplificationof the setup, namely the diode-pumped solid state
Figure 2: General scheme describing the L2I laser[11].
Yb:YAG amplifier. In previous experimental workthe repetition rate was limited to 1 Hz due to elec-tronic limitations of the diode laser driver, whichwas unable to provide high current pulses at a ratefaster than one shot per second. Increasing the rep-etition rate had therefore become a strategic prior-ity. This upgrade, however, implies a study of theconditions that all the components will be subjectedto, and the fact that the amplification process itselfwill be different. A thorough description and studyof all the processes involved is therefore required,and this constitutes the main goal of this thesis.
In order to accomplish these objectives, the fol-lowing major tasks were performed:
• Analytical description and characterization interms of power delivered, number of roundtrips in the crystal and seed influence on theoutput energy. This is followed by the study ofthe thermal effects rising in the gain medium,and their influence in the amplification processand its efficiency.
• Implementation of a numerical code to simu-late the temperature distribution in the gainmedium and the evolution of thermal effects,as well as the thermal lenses for different pumprepetitions rates and pulse length.
• Experimental work consisting in testing andcharacterizing the amplifier for different pumpconditions, and benchmarking of temperaturesimulation code.
• Evaluation of the current laser amplifier designin terms of compatibility with an upgrade inthe repetition rate.
The ultimate goal of this project is to developand characterize an amplifier based on Ytterbium-doped gain media with the purpose of delivering 100
2

mJ-level pulses at a moderate repetition rate, ob-jectively set at 10 Hz. The optical amplifier will beintegrated and used in a laser system, with the goalof performing laser-matter interactions experimentswith a high number of shots, allowing a statisticallike approach.
3. ModellingWith the goal of predicting the amplification pro-cesses and the energy evolution with temperature,an already developed computational model wasused [12].
3.1. Description of the modelIt is very common to develop computational modelsto simulate the behavior of a particular type of laserbefore implementing it in the laboratory. Testingthe pumping and the amplification processes butalso many other properties are among the objec-tives of the simulation. To perform this simula-tion a powerful computing language, Matlab, wasused based on discrete variables and numerical cal-culations. The 1D code, was initially created andimproved by, Celso P. Joao [12]. It is divided intothree main parts and contains a series of changeableparameters that can be grouped in four classes:
• Type of crystal, i.e. absorption and emis-sion cross sections (depending on tempera-ture), length, doped ion concentration and flu-orescence time;
• Pump conditions, i.e power, duration, wave-length and pump waist;
• Signal properties, such as wavelength, energy,duration and bandwidth;
• Geometry and losses induced by the opticalcomponents.
Thermal Sink
Pump Laser Crystal
Pump Area
L
wp z
r
Figure 3: Scheme of the geometry including theaxes.
All physical processes are based on well estab-lished theoretical principles and the geometry canbe visualized in Fig. 3. The formulas describingthe main processes involved in laser-pumping and
amplification in a given gain medium (evolution ofexcited population and pump intensity) can be writ-ten as:
dN jex(z, t)
dt=[σa(λj)Ngr(z, t)− σe(λj)N j
ex(z, t)]
(1)
×Ij(z, t)hνj
− N jex(z, t)
τf
dIj(z, t)
dz=[−σa(λj)Ngr(z, t) + σe(λj)N
jex(z, t)
](2)
×Ij(z, t)
which describes the absorption and population in-version. Here j = p, s if the equations describethe pumping or the amplification, respectively. Nex
is defined as the population density in the excitedstate, σa and σe are the absorption cross-sectionand emission cross-section respectively, Ngr is thepopulation density in the ground state, λ and ν arethe wavelength and frequency of the incoming radi-ation, h is Planck’s constant, I is the intensity andfinally τf is the half life time of the excited state.
3.2. Amplification SimulationThe benchmark/test simulations were performedassuming a 3 ms pumping time to confirm its capac-ity of predicting output energies and compare themwith experimental results. The problem lies, in thefact that the fluorescence time (τf) of Yb:YAG isactually nearly three times smaller (≈ 1 ms) thanthe pumping time. This is due to technical limita-tions of the pumping driver, which was deliveringthe same trigger signal to the regenerative amplifier(whose gain medium, Yb:CaF2, has a fluorescencetime of 2.4 ms) and the multipass amplifier. Inthese conditions, it was stable to work with thesecharacteristics at lower power, but as the pumpingincreases, more of the pumping energy will be con-verted to heat. Moreover, with the increase of therepetition rate to 10 Hz more of this effect will be-come more noticeable, so it is important to studyalternatives.
First we study the increase in power needed toachieve the same type of output energy behaviorversus the input seed energy. To confirm that highenergies can be reached with only 1 ms pumpingtime, a set of simulations were performed. Nat-urally, more energy is required to accomplish thesame amount of population inversion and conse-quently the final extracted energy (approx. 160 mJfor 10 mJ input). At high temperature the maxi-mum power needed exceeds the maximum amountthat the pumping system can deliver (4 kW), as itis depicted in Fig. 4.
Following this, we test how the crystal size willinfluence the overall performance. The ideal length
3

0 2 4 6 8 100
25
50
75
100
125
150
175
200
Seed Energy (mJ)
Ou
tpu
t E
ne
rgy (
mJ)
2300 W ; 300 K
2950 W ; 355 K
3550 W ; 415 K
4300 W ; 475 K
Figure 4: Energy output evolution vs. seed energyfor four different temperatures. Pump pulse dura-tion is 1 ms. At the highest temperature the re-quired pump power exceeds the maximum available(4 kW).
is determined by when the maximum output en-ergy occurs, corresponding to the combination ofmost energy stored in the crystal including reab-sorption and the number of passages through thecrystal. The simulations performed have as an ob-jective to determine the extracted energy as func-tion of the rise of temperature in the crystal. Asthe goal of the thesis is to increase the repetitionrate of the system to 10 Hz, this rise in tempera-ture will occur naturally due to the amount of pumpradiation transferred into heat which strongly influ-ences amplification and reabsorption. The result ofthis simulation is shown in Fig. 5. It is found thatfor temperatures around 300 K a crystal length of0.6 cm is a good compromise, and at higher tem-perature with this power, a size of (0.5-0.7 cm) isactually adequate. For the following simulations weused a value of 0.8 cm corresponding to the size ofthe actual crystal used in the multipass amplifier.
0 0.2 0.4 0.6 0.80
20
40
60
80
100
120
140
160
Crystal Length (cm)
Ou
tpu
t E
ne
rgy (
mJ)
300 K; 2300 W
355 K; 2950 W
415 K; 3550 W
475 K; 4300 W
Figure 5: Output energy at different pumping pow-ers and temperatures vs. crystal length for a 1 mspump pulse.
The number of amplification passes was also eval-
uated under the same temperature range, from 295K to 475 K. To improve stability of the amplifier,saturation of the amplification is necessary. As wecan see in Fig. 6, the simulation showed that thissaturation is reached at approximately 10 passes fora temperature of 300 K and a constant pump powerof 2.3 kW. Even though it is possible to extractmore energy at higher temperature, increasing thenumber of passes beyond 15 is not justifiable be-cause of the difficulty in implementing it in a realsetup.
0 1 2 3 4 5 6 7 8 9 10 11 12 13 14 150
20
40
60
80
100
120
140
160
180
200
220
Number of passes
Ou
tpu
t E
ne
rgy (
mJ)
300 K; 2300 W
355 K; 2950 W
415 K; 3550 W
475 K; 4300 W
Figure 6: Output energy vs. number of passes forfour different temperatures. Pump duration: 1 ms.
In summary, the simulations show us that underspecific conditions it is possible to achieve a rela-tively high output energy (100-160 mJ) when oper-ating at temperatures ranging from 295 K to 475 K.In Table 1 a summary of all fixed parameters usedfor the simulations is presented. From this part ofthe work it is possible to conclude that a 3 % dopedYb:YAG crystal can operate at higher temperature,generating a relatively high output energy, which isthe main objective of this work.
Parameter Value
Ppump 0.5-4.3 kWtpump 1 ms and 3msApump 0.132 cm2
λabs 940 nmλemi 1032 nmYb-doping 3 %dseed 1.6 mmτf 1 ms
Table 1: Fixed simulation parameter.
4. Temperature ProfileA two way approach is followed: first, an analyticalmodel is developed, specifying the conditions for itsvalidation, and then a finite-element analysis is per-formed. Both approaches are used to provide an ap-proximation of the thermal lens effect in the crystal
4

and the corresponding induced aberrations. Theseeffects origin from the change of the temperature-dependent refractive index, and the deformation ofthe end-face curvature caused by the relaxation ofthe thermally induced stresses in the end regions.
4.1. Analytical Model
In our case, an end-pumped cylindrical crystal isconsidered, where the heat generated within thelaser rod by pump light absorption is removed by acoolant flowing along its curved surface (Fig. 3). Itis assumed a spatially uniform gain that will leadto an approximately uniform radial deposition ofheat. This way an axially symmetric profile of tem-perature will be formed in the crystal after a givennumber of pulses. These assumptions allow for ananalytical, steady-state solution to be found. Start-ing with time-dependent heat transport that is de-termined by the differential energy-conservation law
∂Q
∂t= S(r, z, t)−∇ · ΦQ (3)
where S(r, z, t) stands for the heat source term andΦQ is the heat flux. The heat flux is proportional tothe temperature gradient, ΦQ = - Kc∇T , where Kc
is the thermal conductivity. Moreover, the heat isalso proportional to the temperature, Q = CpT ,where Cp is the heat capacity per unit volume.Making use of these properties the equation for thetime-dependent temperature profile is obtained
ρCp∂T (r, z, t)
∂t−Kc∇2T (r, z, t) = S(r, z, t) . (4)
In this part of the work it is considered that forthe generation of the desired laser pulses, a shortpump time-scale (max. 3 ms) in comparison withthe heat transport time scale in the crystal is nec-essary. That being considered, the source term inequation Eq. 4 will cause a fast increase in tem-perature, followed by a relaxation-type evolution.The simplified expression discribing this assumtion,leading to impose S(r, z, t) = 0, becomes
∂T (r, z, t)
∂t= ka∇2T (r, z, t) , (5)
where ka = Kc / Cp is the thermal diffusivity. Fromthese principles a steady-state solution is found byusing the separation of variables method conductedoriginally by Lausten and Balling [13]. This condi-tion is obtained when the number of pumping pulsesgoes to infinity and the final expression derived forthe temperature profile is showed in Eq. 6.
T∞ =T0 [1− exp(−γl)]
γl
∞∑n=1
exp
(−ka
a2nr20t
)(6)
×2wpr0
J1
(anwp
r0
)J21 (an)
1
anJ0
(anr
r0
)
×
1
1− exp(−ka a
2n
r20τ)+
2T0γl
∞∑m=0
∞∑n=1
1− cos(mπ) exp(−γl)
1 +(mπγl
)2 cos(mπz
l
)
× exp
(−ka
(a2nr20
+m2π2
l2
)t
)
×2wpr0
J1
(anwp
r0
)J21 (an)
1
anJ0
(anr
r0
)
×
1
1− exp(−ka
(a2nr20
+ m2π2
l2
)τ) ,
where γ is the absorption coefficient.
A cumulative process occurs leading to an in-crease of the temperature, depending on the rateof deposition. The steady-state, as postulated be-fore, is also depicted in Fig. 7 a). The highesttemperature is obtained in these conditions, show-ing the spread of the temperature along the crystalradius overcoming the pumping waist, which in thiscase was set to the value of wp = 0.12 cm. The 3-D view of the temperature can be observed in Fig.7 b) containing the combination of the radial andlongitudinal components.
4.2. Numerical Model
As before, we assume the pump profile to be axiallysymmetric, which is the case for our end pumpedgeometry. The thermal conductivity Kc is a scalarquantity that in these conditions is not significantlydependent on temperature. As before, the temper-ature T (r, z, t) satisfies Eq. 4.
At this moment the source term is directly de-fined, contrary to what was done in the above sec-tion. We may easily consider the pump to be rep-resented by a top hat distribution, a Gaussian oreven a Super-Gaussian distribution [14]. Althoughit is possible to simulate with a top-hat profile, testsimulations have shown a longer time in the calcu-lation algorithm and less precision if simulated inlonger time scales. In these conditions and in or-der to accomplish the desired precision, the Super-Gaussian shape will be chosen for the calculationahead. That being said, the formula for the sourceterm takes the form
5

0.0 0.1 0.2 0.3 0.4 0.5 0.6 0.70
20
40
60
80
100
120
r(cm)
ΔT∞(K)
(a)
(b)
Figure 7: a) Calculated temperature distribuitionafter an hypothetically infinite number of pulses for10 Hz, 3ms pumping time and 3.5 kW power. b)A 3D visualization of the temperature within thecrystal, where R is the crystal radius, Z is its lengthand ∆T the temperature difference.
S(r, z, t) =ηsPump(t)
w2pπ
e− 1
2 (r
wp)4γe−γz , (7)
with Pump(t) representing a pulsed function re-sponsable for the temporal profile of the pumping.
Computational tools allow us to obtain a tempo-ral evolution of the temperature and obtain resultsfor different conditions. We started with a 1 Hzrepetition rate and a 1 ms pumping time. Fig. 8shows the result for 4 last pulses over 10 s of opera-tion time. One should mention that this interval issufficient to conclude that a stable maximum tem-perature is reached such that no further simulationis necessary for these conditions. For an opticalpump power of 3.5 kW the maximum temperaturereached in the first case is 23.6 K above the coolingtemperature.
In a similar way, a study is conducted at a repe-tition rate 10 times higher which is the main goal ofthis thesis. By keeping the same pump power, thesimulation allows us to find a maximum limit forthe temperature rise in the crystal. Fig. 9 a) shows
Figure 8: Temporal evolution of the radial temper-ature distribution (at z = 0) for a 1 Hz repetitionrate pump. The time window ranges from 6-10 s,during which the maximum temperature is reached.A maximum pump power was assumed (3.5 kW) de-livered on a wp = 0.12 cm with pulse duration of 1ms, obtaining a rise of 23.6 K from the borders tothe center of the crystal.
that the temperature first increases with time, be-tween 0 and 1 s, and then becomes constant witha few small oscillations, around 10 s of operation.This situation can also be called a thermal steadystate. In fact, if the repetition rate is higher thanthe inverse of thermal relaxation time 1/τthermal =4Kc/r20 Cpρ of the laser crystal, a steady state ther-mal distribution will appear [15]. For the first case,where once again the pumping time is 1 ms perpulse, there is a steady state around 50.5 K higherthen the cooling temperature.
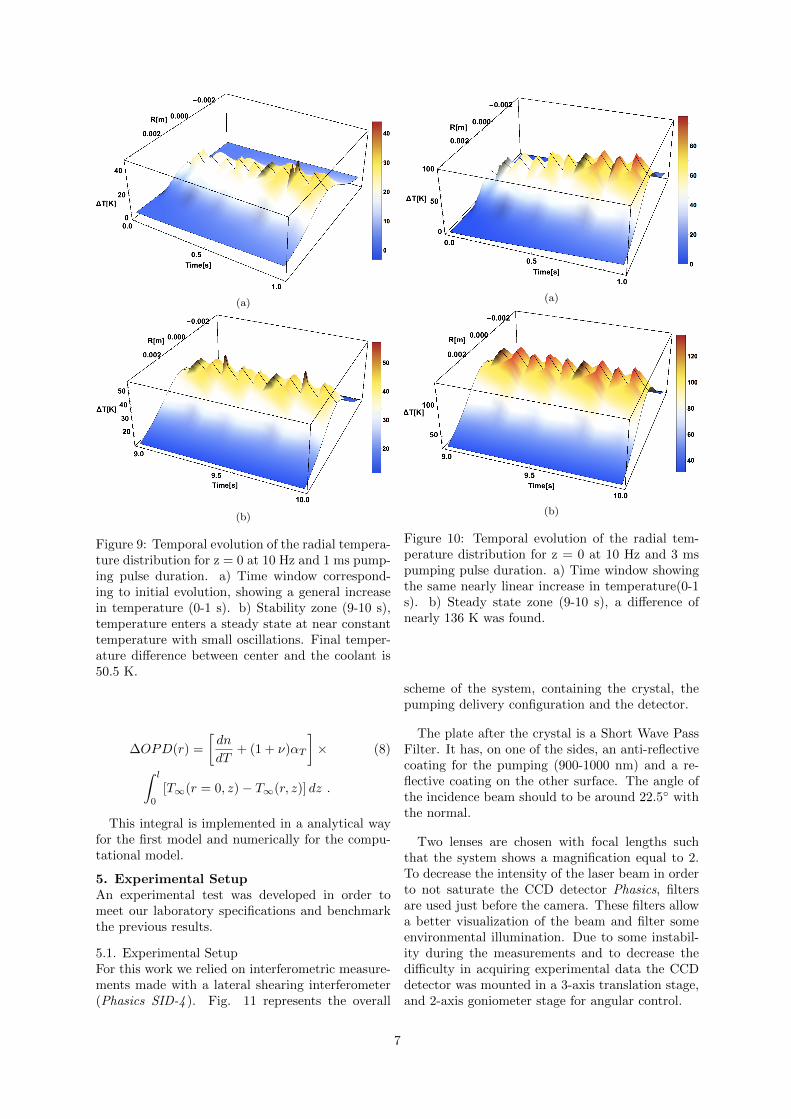
A different value is obtained when a differentpumping duration is used, in this case the 3mspumping as the original setup allowed. In this par-ticular case Fig. 10 shows the maximum tempera-ture predicted for the 10 Hz repetition rate, and thesteady state is reached around 136 K above coolingtemperature, which is highly significant for the am-plification processes as seen in previous section.
4.3. Thermal LensingThe temperature profile can influence the laser gainmaterial in different ways. Those affecting the prop-agation of light and introducing distortion are thedirect change of the temperature-dependent refrac-tive index, and the deformation of the end-face cur-vature, resulting in a lens caused by the relaxationof the thermally induced stresses in the end regions.
Once the steady profile for the temperature is cal-culated, we are able to proceed to the calculationof the thermal lens. The effects considered are cal-culated by a model created by Koechner [16], andstudies showed that, although being simple, it givesa good estimation for the real value. The opticalpath difference (OPD) that will cause the thermallens has a distribution between z and z+dz givenby
6
(a)
(b)
Figure 9: Temporal evolution of the radial tempera-ture distribution for z = 0 at 10 Hz and 1 ms pump-ing pulse duration. a) Time window correspond-ing to initial evolution, showing a general increasein temperature (0-1 s). b) Stability zone (9-10 s),temperature enters a steady state at near constanttemperature with small oscillations. Final temper-ature difference between center and the coolant is50.5 K.
∆OPD(r) =
[dn
dT+ (1 + ν)αT
]× (8)∫ l
0
[T∞(r = 0, z)− T∞(r, z)] dz .
This integral is implemented in a analytical wayfor the first model and numerically for the compu-tational model.
5. Experimental SetupAn experimental test was developed in order tomeet our laboratory specifications and benchmarkthe previous results.
5.1. Experimental SetupFor this work we relied on interferometric measure-ments made with a lateral shearing interferometer(Phasics SID-4 ). Fig. 11 represents the overall
(a)
(b)
Figure 10: Temporal evolution of the radial tem-perature distribution for z = 0 at 10 Hz and 3 mspumping pulse duration. a) Time window showingthe same nearly linear increase in temperature(0-1s). b) Steady state zone (9-10 s), a difference ofnearly 136 K was found.
scheme of the system, containing the crystal, thepumping delivery configuration and the detector.
The plate after the crystal is a Short Wave PassFilter. It has, on one of the sides, an anti-reflectivecoating for the pumping (900-1000 nm) and a re-flective coating on the other surface. The angle ofthe incidence beam should to be around 22.5◦ withthe normal.
Two lenses are chosen with focal lengths suchthat the system shows a magnification equal to 2.To decrease the intensity of the laser beam in orderto not saturate the CCD detector Phasics, filtersare used just before the camera. These filters allowa better visualization of the beam and filter someenvironmental illumination. Due to some instabil-ity during the measurements and to decrease thedifficulty in acquiring experimental data the CCDdetector was mounted in a 3-axis translation stage,and 2-axis goniometer stage for angular control.
7

Figure 11: Experimental setup for the thermal lensmeasurements.
6. Experimental Results
The following experimental results were optainedconcerning the thermal lens effect. Also a prepara-tion for future work is completed in terms of laserpropagation in a multi-pass configuration.
6.1. Thermal Lensing
Taking into account the above statements, we cancompare the experimental data of the thermal lensvalues with predictions made in the previous sec-tions. The first results come from the 1 Hz repeti-tion rate and 1 ms pumping time. A graph showingthe predictions from the two models, analytical inblue and numerical in red, and the experimentaldata can be seen in Fig.12.
▲▲ ▲ ▲ ▲ ▲ ▲ ▲
●
●●
● ● ● ● ●
●
●
●
●● ● ● ●
Analytical
▲ Exp. Points
● Numerical
0.5 1.0 1.5 2.0 2.5 3.0 3.50
10
20
30
40
Pump Power (kW)
ThermalLensFocalLength
(m)
Figure 12: Thermal lens evolution vs. pump power.Pump duration 1 ms, repetition rate 1 Hz. Com-parison with analytical model (blue) and numericalmodel (red). Limit lines are imposed to the modelcorresponding to a minimum (wpmin) and a maxi-mum (wpmax) pumping waist.
In order to achieve comparable results, the theo-retical models have been applied for two pumpingwaists in every case studied, one corresponding to aminimum value (wpmin) and other for a maximumvalue (wpmax), creating an interval for the predictedexperimental value. The criteria used for choosingthe two values is based on the pump beam ellipticity(see Fig. 13): the maximum value will be limited bythe probe beam/seed radius and for the minimumit will be used the smallest size of the vertical axiswithin the crystal. The values used in the numeri-cal simulations and analytical expression are wpmin
= 1 mm and wpmax = 1.4 mm for the minimum andmaximum values respectively.
Figure 13: Pump profile example, generated in thecrystal plane (z=0 plane). Profile corresponding toa 180 A current and 3 ms of duration time.
We observe that at 1 ms pumping time, the mod-els overestimate the thermal lens value at smallpumping power. This could be due to the fact thatat low powers and lower pumping time the excesspumping in the horizontal direction could be moresignificant and in this way contribute more for thethermal lens effect.
▲
▲▲
▲ ▲ ▲ ▲ ▲
●
●
●
●● ● ● ●
●
●
●● ● ● ● ●
Analytical
▲ Exp. Points
● Numerical
0.5 1.0 1.5 2.0 2.5 3.0 3.50
2
4
6
8
10
12
Pump Power (kW)
ThermalLensFocalLength
(m)
Figure 14: Thermal lens evolution vs. pump power.Pump duration 1 ms, repetition rate 10 Hz.
Finally, Fig. 14 shows the data for pumping at 10Hz repetition rate. At lower powers the numericalmodel has a better adjustment, and at higher pow-
8

ers both models slightly underestimate the mag-nitude of the thermal lens. It was expected thatsuch minor discrepancy would occur at higher ratesdue to pumping profile differences, given that bothperfect top-hat and Gaussian profiles will cause astronger thermal lensing at higher powers than thethat originated by our pump beam. Also at highervalues the oscillations are more significant and be-ing more difficult to measure leading to a highererrors. In any case, given the assumptions that wehave considered even in the absence of perfect con-ditions, all series of experimental data are predictedremarkably well by both the theoretical models.
6.2. Laser PropagationIn the previous section, positive values of thermallensing were measured, which will lead to beam fo-cusing. Depending on the number of round trips inthe imaging amplifier this effect adds up and thusthe beam diameter on the optics can get smallerthan the limit set by the LIDT. In order to predictthe performance of the laser after the proposed 8passes through the crystal a simulation of the prop-agation is performed. The main objective of thissection is to foresee possible damage of the turningmirrors in the multipass configuration. In this sim-ulation the crystal is considered a perfect thin lenswith the focal length of the minimum expected forthe 10 Hz repetition rate. Taking the value mea-sured before for the 3.6 kW, f = 2.37 m,the graphof Fig. 15 shows the evolution of the laser beamdiameter along propagation.
Figure 16: Multipass setup composed of multipleturning mirrors. System allows 8 passes throughthe crystal.
Recalling the original multipass setup (Fig. 16),the propagation starts at mirror M5, such that thefirst beam waist (i.e. z = 0) coincides with thefirst pass through the crystal. Pure thermal lens-ing has a small influence in the laser behavior ascan be observed: no hard focusing in the mirrorstakes place, ensuring that a practical implementa-tion can be considered. The major concern shouldbe the possible damage induced to the turning mir-rors (M11 and M12) after the 6-th passage. Herethe minimum beam waist is predicted, correspond-ing to a diameter of 1.13 mm, while the LIDT di-ameter in this region (approximately 60 mJ) leads
to a minimum diameter dmin = 1.2 mm. Althoughnot being quantified, astigmatism and other aber-rations also have the potential to increase with thenumber of round trips through the crystal. If thecompensation of the effect turns out to be impos-sible with standard techniques, a deformable (or apermanent convex) mirror could be used in order tocompensate the induced wavefront deformation.
7. Conclusions
The amplification model was able to predict a suc-cessful performance at a more suitable pumping du-ration (1ms), and high output energies are expectedto be achieved even at higher temperatures.
Calculations regarding the temperature distribu-tion inside a longitudinally pumped amplifier crys-tal and the thermally-induced lens were performedand predicted values, for the difference, rangingfrom 23 K to 136 K.
Experimental work was conducted for a series oflaser repetition rates, obtaining values between 2-13 m for the focal length of the thermal lens, de-creasing (i.e. becoming more pronounced) with ahigher repetition rate, as expected. These findingsshow that an upgrade of the laser system is pos-sible, namely the increase in the repetition rate to10 Hz, maintaining an output energy of 100 mJ.These conditions can be obtained with a predictedminimum of 3 kW pumping power at 1 ms time.The induced thermal lens of ≈3 m can be managedaccording to the beam propagation simulation.
7.1. Future Work
The general characterization of the laser at 10 Hz iscrucial, including spectral properties that were notaddressed in the present work. This includes the op-timization of the regenerative amplifier and overallcomponents by using spectral amplitude and phaseshaping (e.g. Dazzler), which as previously men-tioned, enables wavelength matching and a higherperformance. The pumping process could be opti-mized and should increase the performance of themultipass amplifier. A readjustment of the cylindri-cal lenses could lead to a more symmetrical beam.
Further studies on new laser materials or othercomposite crystals with attractive properties canalso be a road to explore. Among such ma-terials we may highlight a few e.g. Yb:GGG,Yb:GdCOB, Yb:BOYS, Yb:CaBOYS, Yb:SYS andYb:YSO, which have already demonstrated poten-tial advantages in specific applications. In con-clusion, we can state that research in this field isan open, exciting topic, in a moment when lasersbased on ytterbium-doped gain media are startingto become commercially available, while still offer-ing many opportunities for innovative research andapplications.
9

Figure 15: Simulation of Gaussian beam propagation through the multipass amplifier. Initial diametercorresponding to 1.5 mm. Minimum diameter obtained corresponds to the value of d = 1.13 mm , whilethe minimum allowed for the LIDT is dmin = 1.2 mm.
Acknowledgements
The author would like to thank his supervisor, forall the support and guidance, and all of his col-legues, in particular to Celso Paiva Joao for his helpand dedication.
References
[1] F. Bachmann. Industrial applications of highpower diode lasers in materials processing. Ap-plied surface science, 208:125–136, 2003.
[2] R. W. Waynant. Lasers in medicine. CRCPress, 2001.
[3] E. Yablonovitch and E. O. Kane. Band struc-ture engineering of semiconductor lasers for op-tical communications. Lightwave Technology,Journal of, 6(8):1292–1299, 1988.
[4] M. Dunne. Laser-driven particle accelerators.Science, 312(5772):374–376, 2006.
[5] H. A. Haus. Mode-locking of lasers. SelectedTopics in Quantum Electronics, IEEE Journalof, 6(6):1173–1185, 2000.
[6] M. Arrigoni, M. Bengtsson, and M. Schulze.Solid-State Lasers-Laser pulsing: The nuts andbolts of q-switching and modelocking. LaserFocus World, 48(6):29, 2012.
[7] D. Strickland and G. Mourou. Compression ofamplified chirped optical pulses. Optics Com-munications, 56(3):219 – 221, 1985.
[8] D. W. Larson. NIF laser line-replaceable units(LRUs). Proc. SPIE, 5341:127–136, 2004.
[9] P. F. Moulton. Tunable solid-state lasers. Pro-ceedings of the IEEE, 80(3):348–364, 1992.
[10] W. Leemans and E. Esarey. Laser-drivenplasma-wave electron accelerators. Phys. To-day, 62(3):44–49, 2009.
[11] C. P. Joao, H. Pires, L. Cardoso, T. Imran,and G. Figueira. Dispersion compensation bytwo-stage stretching in a sub-400 fs, 1.2 mjYb:CaF2 amplifier. Opt. Express, 22(9):10097–10104, May 2014.
[12] C. P. Joao. Novos materiais para amplifi-cadores laser, 2009.
[13] R. Lausten and P. Balling. Thermal lensing inpulsed laser amplifiers: an analytical model. J.Opt. Soc. Am. B, 20(7):1479–1485, Jul 2003.
[14] Y.F. Chen, T.S. Liao, C.F. Kao, T.M. Huang,K.H. Lin, and S.C. Wang. Optimization offiber-coupled laser-diode end-pumped lasers:influence of pump-beam quality. QuantumElectronics, IEEE Journal of, 32(11):2010–2016, Nov 1996.
[15] H. J. Eichler, A. Haase, R. Menzel, andA. Siemoneit. Thermal lensing and depolar-ization in a highly pumped Nd:YAG laser am-plifier. Journal of Physics D: Applied Physics,26(11):1884, 1993.
[16] W. Koechner. Solid-State Laser Engineering.Springer, 6th edition, 2009.
10


![Diode-pumped alexandrite laser [ PDF 1.58 MB ] - Fraunhofer ILT](https://img.dokumen.tips/doc/110x75/6234108b9d3b6f75765b3e98/diode-pumped-alexandrite-laser-pdf-158-mb-fraunhofer-ilt.jpg)