Embed Size (px)
Citation preview

Compact diode-pumped solid-state lasers
Stefan Spiekermann
TRITA-FYS 2004:24 ISSN 0280-316X ISRN KTH/FYS/--04:24--SE

Compact diode-pumped solid-state lasers
Stefan Spiekermann
Doctoral Thesis
Department of Physics Royal Institute of Technology
Stockholm, Sweden 2004

Compact diode-pumped solid-state lasers Stefan Spiekermann ISBN 91-7283-755-1 © Stefan Spiekermann, 2004 Doktorsavhandling vid Kungliga Tekniska Högskolan TRITA-FYS 2004:24 ISSN 0280-316X ISRN KTH/FYS/--04:24--SE Laser Physics and Quantum Optics Department of Physics Royal Institute of Technology SE-106 91 Stockholm, Sweden Cover: Implementation of diode pumped solid state lasers into a laser projection system. Printed by Universitetsservice US-AB, Tryck & Media Stockholm, 2004.

i
Spiekermann, Stefan Compact diode-pumped solid-state lasers Laser Physics and Quantum Optics, Department of Physics, The Royal Institute of Technology, SCFAB, SE-106 91 Stockholm, Sweden. Abstract Compact diode-pumped solid-state lasers (DPSSL) are continuously replacing traditional gas lasers as well as enabling completely new technology. However, compact and cost efficient designs are required to satisfy end-user demands. The aim of this thesis was therefore to investigate novel laser designs for given applications considering these demands. In a large part of the thesis work, nonlinear optics were employed to realize laser wavelengths where there was no appropriate laser transition available. Besides other nonlinear crystals such as BBO, LBO and KTP, periodically poled KTP played an important role in this thesis work. Its unique properties regarding up conversion processes were exploited, thus supplying a broadened view over its potential and limitations. This thesis places emphasis on practical concerns, mainly related to real applications. It gives solutions to the beam shaping of laser diodes, covers the simulation and the design of laser dynamics as well as laser performance and describes the sources of laser output degradation and damage mechanisms. Novel infrared lasers were designed and multiple intra-cavity, external cavity and non-resonant multi-pass frequency conversion schemes were successfully employed and optimized. These produced red, orange, green, blue and ultraviolet output for various applications like spectroscopy, micro machining and writing of fiber Bragg gratings. Keywords: diode-pumped solid-state lasers, nonlinear optics, frequency conversion,

ii

iii
Preface The thesis project was made possible through generous grants from The Carl Trygger Foundation, the Göran Gustafsson Foundation as well as the Swedish Foundation for Strategical Research (SSF). The thesis has been carried out at three locations. Experiments with non-planar ring oscillators have been performed at InnoLight GmbH in Hannover, Germany. Intra-cavity doubled green, blue and turquoise lasers have been developed at Cobolt AB, Stockholm. All other experiments were performed at the Laser Physics and Quantum Optics group, Department of Physics, at the Royal Institute of Technology, Stockholm, Sweden from January 2000 to February 2004. The thesis consists of an introductory section providing a theoretical and technological background to the work and the appended journal reprints listed as follows.

iv

v
List of publications Paper I: S. Spiekermann, M. Bode, C. Fallnich, H. Welling and I. Freitag,
“Actively Q-switched miniature Nd:YAG ring laser in single-frequency operation”, El. Lett., 34, 2246-2247 (1998).
Paper II: M. Bode, S. Spiekermann, C. Fallnich, H. Welling, and I. Freitag,
“Ultraviolet single-frequency pulses with 110 mW average power using frequency-converted passively Q-switched miniature Nd:YAG ring lasers”, Appl. Phys. Lett., 73, 714-716 (1998).
Paper III: S. Spiekermann, H. Karlsson, F. Laurell, and I. Freitag, ” Tunable single-
frequency radiation in orange spectral region”, El. Lett., 36, 543-545 (2000).
Paper IV: S. Spiekermann, M. Bode, I. Freitag, and F. Laurell, “Ultraviolet single-
frequency pulses with high average power using frequency-converted passively Q-switched quasimonolithic Nd:yttrium-aluminum-garnet ring lasers”, Appl. Phys. Lett., 79, 458-460 (2001).
Paper V: S. Spiekermann, H. Karlsson, and F. Laurell, “Efficient Frequency
Conversion of a Passively Q -Switched Nd:YAG Laser at 946 nm in Periodically Poled KTiOPO4”, Appl. Opt., 12, 1979-1982 (2001).
Paper VI: S. Spiekermann, V. Pasiskevicius, F. Laurell, H. Karlsson, and I. Freitag,
“Optimizing non-resonant frequency conversion in periodically poled media”, Appl. Phys. B, accepted for publication on February 26, 2004.
Paper VII: S. Spiekermann, and F. Laurell, “Deep blue diode-pumped Nd:YLF laser”,
Opt. Lett., submitted on April 1, 2004.

4
Other publications by the author related to the subject: Patent I: R. Hansson, H. Karlsson, and S. Spiekermann, ”GRIN-Lens
Arrangement”, pat. No. WO03098283, European patent office (2003). Patent II: K. Ekvall, H. Karlsson, and S. Spiekermann. ”Optical Frequency Mixing”,
pat. No. WO02103863, European patent office (2002). Paper VIII: S. Spiekermann, S. Wang, F. Laurell, and I. Freitag, “Ultraviolet single-
frequency ns-pulses with high average output power”, Conference on Lasers and Electro-Optics, CLEO - Technical Digest, 2000, p 440.
Paper IX: S. Johansson, S. Spiekermann, V. Pasiskevicius, F. Laurell, K. Ekvall, and
S. Wang, “Generation of turquoise light by sum frequency mixing of a diode-pumped solid-state laser and a laser diode in periodically poled KTP”, Appl. Opt., submitted in May, 2004.

vii
Acknowledgements First, I would like to thank my supervisor Prof. Fredrik Laurell. After listening to his talk in Konstanz 1998, I spontaneously decided to ask for a job and never regret it. He made this thesis work possible. Two special thanks to Dr. Ingo Freitag and Dr. Valdas Pasikevicius, who always listened to my “crazy” ideas and kept me on the ground. With his company, Ingo Freitag generously supplied me with many lasers and optics, while Valdas Pasikevicius shared his vast experience. Thanks to assoc. Prof. em. Jens A. Tellefsen, the “father” of our group, who helped me to feel like at home here in Sweden. Thanks, furthermore, for all the students at the Laserphysics group, starting with Matthias Pierrou who initiated the “Blue Laser Project”, and continuing with Håkan Karlsson, Jonas Hellström, Gunnar Karlsson and Shunhua Wang, and all the other students, for close collaborations and arranging the badly needed festivities. Thanks to all Cobolt employees, especially my room mate Katrin Ekvall, my muse, and Håkan Karlsson, for believing in me. I will never forget this team! Much appreciation for Agneta Falk, our secretary, for keeping our “backs” free. Thanks also to our technician, Rune Person, who helped me out with many “last moment” optomechanics. Finally, my deep respect to my wife Edina. Without her support, I would not have come this far. Thanks to my family, for giving me a solid base in this wild life.

1
Table of contents Abstract i Preface iii List of publications v Acknowledgements vii
1 INTRODUCTION .................................................................................................... 3
1.1 MOTIVATION AND OBJECTIVE................................................................................. 3 1.2 EVOLUTION OF THE PROJECT AND OUTLINE OF THE THESIS.................................. 5
2 DIODE-PUMPED SOLID-STATE LASERS ........................................................ 6
2.1 LASER CRYSTALS ..................................................................................................... 6 2.2 OPTICS ................................................................................................................... 10 2.2.1 GAUSSIAN BEAMS................................................................................................. 10 2.2.2 MATRIX FORMALISM ............................................................................................ 12 2.2.3 RESONATOR THEORY............................................................................................ 13 2.2.4 SURFACE QUALITY AND COATINGS ....................................................................... 15 2.3 LASER SCHEMES .................................................................................................... 17 2.3.1 DIODE PUMPING.................................................................................................... 17 2.3.2 BEAM-TWISTING................................................................................................... 19 2.3.3 STANDING WAVE CAVITIES................................................................................... 20 2.3.3.1 Experimental results on a cw 1064 nm Nd:YAG laser: ................................... 21 2.3.3.2 Experimental results on a cw 946 nm Nd:YAG laser: ..................................... 22 2.3.3.3 Experimental results on a cw 914 nm Nd:YVO4 laser: .................................... 22 2.3.3.4 Experimental results on a cw 908 and 903 nm Nd:YLF laser:......................... 23 2.3.4 TRAVELING WAVE CAVITIES................................................................................. 25 2.3.5 Q-SWITCHED LASERS............................................................................................ 27 2.3.5.1 Experimental results on a passively Q-switched quasi-three-level Nd:YLF laser: 37 2.3.5.2 Experimental results on a passively Q-switched quasi-three-level Nd:YAG laser: 38 2.4 POWER SCALING .................................................................................................... 39 2.4.1 THERMAL EFFECTS ............................................................................................... 39 2.4.2 THE AMPLIFIER..................................................................................................... 42

2
3 NONLINEAR OPTICS .......................................................................................... 44
3.1 THE COUPLED WAVE EQUATIONS.......................................................................... 44 3.2 PHASEMATCHING................................................................................................... 46 3.2.1 BIREFRINGENCE PHASEMATCHING........................................................................ 46 3.2.2 QUASI-PHASEMATCHING ...................................................................................... 48 3.2.3 ACCEPTANCE BANDWIDTH ................................................................................... 49 3.3 NONLINEAR OPTICS WITH GAUSSIAN BEAMS........................................................ 50 3.4 NONLINEAR CRYSTALS .......................................................................................... 52
4 FREQUENCY CONVERSION SCHEMES ........................................................ 53
4.1 SINGLE AND MULTI-PASS FREQUENCY CONVERSION ............................................ 53 4.1.1 ACCEPTANCE BANDWIDTHS.................................................................................. 54 4.1.2 LINEAR PHASEFRONT DISTORTION........................................................................ 57 4.1.3 ABSORPTION AND THERMAL EFFECTS................................................................... 59 4.1.4 PERFORMANCE OF SELECTED SCHEMES ................................................................ 61 4.2 FREQUENCY CONVERSION IN AN EXTERNAL CAVITY............................................ 62 4.2.1 IMPEDANCE MATCHING ........................................................................................ 63 4.2.2 PERFORMANCE OF A ULTRA-SHORT MONOLITHIC EXTERNAL CAVITY ................... 63 4.3 INTRACAVITY FREQUENCY CONVERSION.............................................................. 64 4.3.1 AMPLITUDE STABILITY AND LONGITUDINAL MODE DYNAMICS............................. 64 4.3.2 PERFORMANCE OF GREEN AND BLUE LASERS WITH INTRACAVITY SECOND HARMONIC GENERATION.................................................................................................. 64 4.3.3 PERFORMANCE OF A TURQUOISE LASER WITH SUM-FREQUENCY MIXING .............. 67 4.3.4 PERFORMANCE OF AN ORANGE LASER WITH SUM-FREQUENCY MIXING ................ 69 4.4 FREQUENCY CONVERSION OF Q-SWITCHED LASERS ............................................ 70 4.4.1 FREQUENCY QUADRUPLED AND TRIPLED NPROS................................................. 70 4.4.2 SHG OF A Q-SWITCHED ND:YAG LASER AT 946 NM ........................................... 74
5 DESCRIPTION OF THE ORIGINAL RESEARCH WORK............................ 75
6 CONTRIBUTION BY THE CANDIDATE ......................................................... 78
7 CONCLUSIONS AND OUTLOOK...................................................................... 79
8 REFERENCES........................................................................................................ 81

3
1 Introduction
1.1 Motivation and objective The motto of this thesis could be described as follows: Using a strong physical basis, I wanted to exploit the state of the art of building visible diode pumped solid state lasers and use the gathered experience as a starting point for going further, to push the limits and carefully create the optimum solution for specific applications. It is now 45 years since Maiman [1] demonstrated the first laser. Since then, research in the field has flourished and thousands of scientists have sought to build the most efficient, the most powerful or simply the most unique gas-, dye-, semiconductor- or solid state laser. While early systems struggled to reach lasing threshold, material science caught up and lead the scene away from pure science towards solving technical problems. The literature shows extensive investigations of a vast amount of laser components. The art became to choose among those components, to control the needed material specifications and to engineer the right system. Heat has to be removed, optics has to be designed and, last but not least, a certain degree of cost efficiency has to be reached for guaranteeing applicability. The importance of lasers in our society increases by the day. Some are hidden in electronic equipment, like infrared diode lasers in CD-players and telecommunication systems. Others are used for scientific applications, like blue, turquoise and green lasers for spectroscopy or multiple visible lasers for microscopy. Then there are the two biggest applications for solid-state lasers, material processing and medical treatment. And as it is always, lasers can be used in military applications like pulsed eye-safe solid-state lasers for range finding. Finally, lasers can be used for pure pleasure. Their extremely good beam quality makes it possible to collimate a beam over kilometers of distance. This enables together with the highly saturated colors astonishing visual effects in laser shows or a laser displays. One objective of this thesis was chosen to be the development of compact lasers for display applications, although other applications, emerging during the work, were not neglected. Displays present a very novel application for lasers. While their color purity and scalability make them perfectly suited for this purpose, their high price prevented a breakthrough so far. It was therefore a strong concern to provide a solution that solves this problem. Figure 1.1 shows the widely used CIE 1976 system for displaying the visible color space. Its attraction lies in its ability to easily simulate the mixing of colors sources. This is done by first choosing multiple sources and determining their color-coordinate (see chapter 5). The second step is to draw lines between these coordinates. All the colors along these lines are obtainable by simply balancing the power levels of each fundamental color source. And when there are more then two different color sources, then the coordinates are the edges of a polygon with the mixable colors lying

4
inside its area, the so-called color gamut. The grey triangle in Figure 1.1 presents the gamut from a standard projector, pumped by a metal halide lamp (grey triangle). One can clearly see that such a projector is only capable of rendering a fraction of the colors that are visible for the human eye. The white triangle is constructed from laser sources. Combining lasers at 460, 532 and 630 nm results into a nearly 100% larger gamut. It becomes even larger when using a fourth laser at around 490 nm. In principle, one can even use a blue laser with shorter wavelength and a red laser with longer wavelength, but the perception of the human eye gets worse at these wavelengths and increases the demands on laser power. Hence, the display objective of this thesis can be stated more precisely. It is to develop high power but cost-effective DPSS lasers at 450-460, 532, 630-650 and optionally at 490-500 nm.
Figure 1.1 CIE 1976 diagram for simulating the mixture of multiple color sources.
5
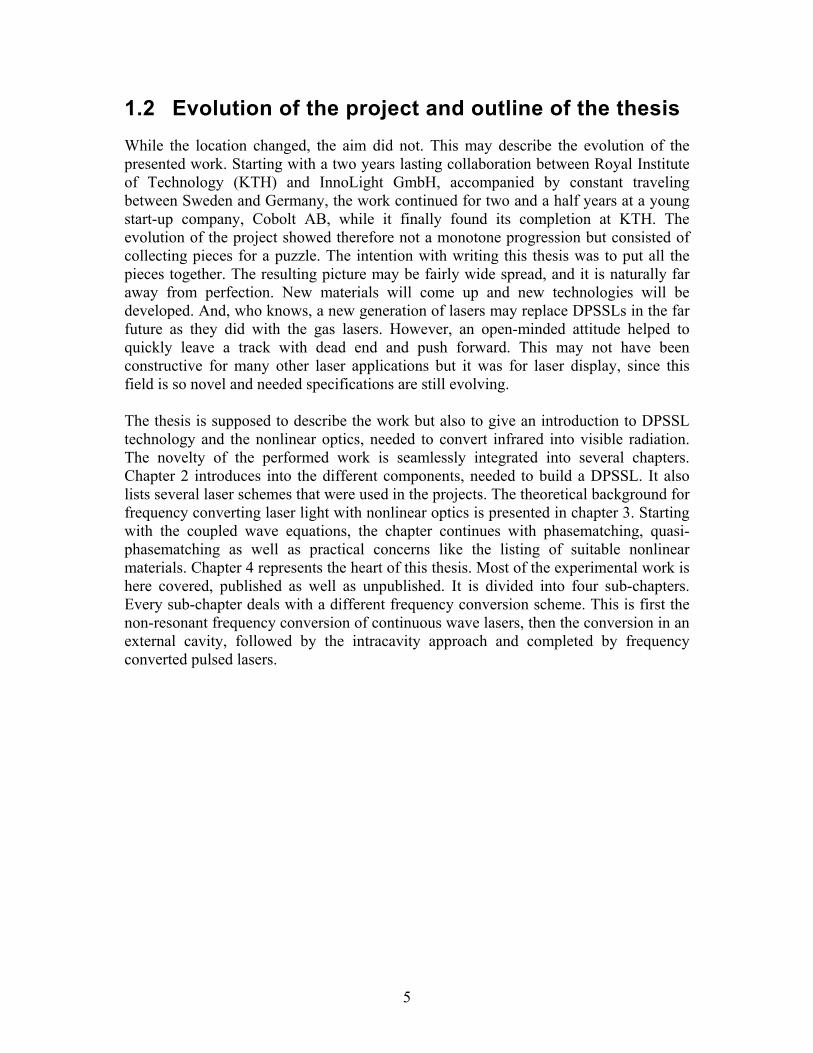
1.2 Evolution of the project and outline of the thesis While the location changed, the aim did not. This may describe the evolution of the presented work. Starting with a two years lasting collaboration between Royal Institute of Technology (KTH) and InnoLight GmbH, accompanied by constant traveling between Sweden and Germany, the work continued for two and a half years at a young start-up company, Cobolt AB, while it finally found its completion at KTH. The evolution of the project showed therefore not a monotone progression but consisted of collecting pieces for a puzzle. The intention with writing this thesis was to put all the pieces together. The resulting picture may be fairly wide spread, and it is naturally far away from perfection. New materials will come up and new technologies will be developed. And, who knows, a new generation of lasers may replace DPSSLs in the far future as they did with the gas lasers. However, an open-minded attitude helped to quickly leave a track with dead end and push forward. This may not have been constructive for many other laser applications but it was for laser display, since this field is so novel and needed specifications are still evolving. The thesis is supposed to describe the work but also to give an introduction to DPSSL technology and the nonlinear optics, needed to convert infrared into visible radiation. The novelty of the performed work is seamlessly integrated into several chapters. Chapter 2 introduces into the different components, needed to build a DPSSL. It also lists several laser schemes that were used in the projects. The theoretical background for frequency converting laser light with nonlinear optics is presented in chapter 3. Starting with the coupled wave equations, the chapter continues with phasematching, quasi-phasematching as well as practical concerns like the listing of suitable nonlinear materials. Chapter 4 represents the heart of this thesis. Most of the experimental work is here covered, published as well as unpublished. It is divided into four sub-chapters. Every sub-chapter deals with a different frequency conversion scheme. This is first the non-resonant frequency conversion of continuous wave lasers, then the conversion in an external cavity, followed by the intracavity approach and completed by frequency converted pulsed lasers.

6
2 Diode-pumped solid-state lasers The principle of laser operation can be described as follows: An active material, being a gas, a fluid or a solid, is excited via a certain pump process. The premise for qualifying as an active material is a long-living excited state, which leads to inversion of the involved energy levels, when pumped strongly enough. Inverted population itself leads to stimulated emission (gain), caused by spontaneously emitted photons. This stimulated emission can be feed back coherently with specially designed cavity mirrors. If this cavity is designed so that the gain exceeds the losses (due to absorption, scattering etc.), then a coherent field can build up. By coating one cavity mirror so that it transmits a few percent of this field, one finally generates an output beam, which can be directed to the application of concern. The active materials used in this thesis work were of solid-state nature. Solid-state materials have important advantages over other active media. They are mostly crystals or glasses, doped by active ions, which can be easily processed without the need of complex capsulation, as it is required for gases or fluids. They do not inhibit substantial fluctuations, resulting in increased stability. Another advantage is the strong gain-factor. This is because of the very high density of active ions, which makes it possible to design extremely compact (shorter then 1 mm) systems. And finally, the laser energy levels are usually strongly shielded from the crystal field. They are very sharp as a result, decreasing non-radiative decay processes to a minimum. The following four sub-chapters treat relevant solid state laser components as well as laser schemes in detail. The most important theoretical relations are supplied and some experimental issues are discussed.
2.1 Laser crystals The host material for the active ions should have particularly good optical, mechanical and thermal properties to qualify as a good laser crystal. This is for example hardness, heat-conductivity, chemical contamination, internal stress, homogeneity of the refractive index, resistiveness towards induced color centers, scatter losses and producibility. Only a few crystals combine these properties. First solid state lasers were based on corundum-type host crystals like ruby or sapphire, doped with chromium or titanium ions. These crystals are extremely hard, have very high thermal conductivity and can be grown in an excellent optical quality. They also offer unique emission wavelengths, which is why they still find many applications. However, the laser efficiency is limited by a relatively weak pump absorption cross section together with a small στf-product (product of stimulated-emission cross section and the fluorescence lifetime). Some other crystal types offer higher laser efficiency and have absorption bands, fitting to the emission spectra of high power GaAlAs diode lasers (see chapter

7
2.3.1). Some of these are garnets, vanadates and scheelites. We concentrate in this work on yttrium aluminum garnet (Y3Al5O12, YAG), yttrium floride (LiYF4, YLF), yttrium vanadate (YVO4, YVO) and gadolinium vanadate (GdVO4, GVO). See Table 2.1 for a summary of the relevant physical properties. Chemical formular Y3Al5O12
[2]
LiYF4 [3] YVO4 [3] GdVO4 [3],
[4]
Nd-density(1at%dop)[1020/cm3] 1.38 1.39 1.25 1.25
Moh hardness 8.5 4-5 4-5 4-5
Tensile strength [kg/cm2] 2·103 <2·103 ∼1·103 ∼1·103
Thermal expansion [K-110-6] 7.5 a-axis: 13.0
c-axis: 8.0
a-axis: 3.1
c-axis: 7.2
a-axis: 1.6
c-axis: 7.3
Thermal conductivity [W/(mK)] 13 6 5.2 12
Specific heat capacity [J/(kgK)] 600 790 505 502
Refractive index (1064nm) 1.82 n0=1.45
ne=1.47
n0=1.96
ne=2.17
n0=1.97
ne=2.19
Thermal lensing [K-110-6] 7.3 π: -4.3
σ: -2.0
π: 3.0
σ: 8.5
π: 4.7
σ:
Table 2.1 Properties of selected host crystals.
These host crystals can be doped with rare earths, which are nearly ideal activator ions in solid-state lasers. Some examples are neodymium, ytterbium, erbium, holmium and thulium. Doping means that yttrium (or gadolinium) ions are partly replaced by those rare earths. However, it is important that the dopant has a size as similar to yttrium as possible. This is to prevent internal stress, connected to a stronger coupling of the neighboring ions and hence a reduced fluorescence lifetime. The term diagram of Nd3+ in YAG is shown in Figure 2.1. It has a very efficient four-level laser scheme, which originates from a long-lived upper laser level 4F3/2 and a fast non-radiative decay from the lower laser level 4I11/2 down to the ground state 4I9/2. It even offers a quasi-three-level scheme with the ground state as the lower laser level. Nd3+ shows a very similar term diagram for the other crystal hosts, while small differences in cross-sections, transition energy and fluorescence lifetime give specific advantages. Nd:YVO and Nd:GVO offer for example a much higher emission cross section but their low heat conductivity makes them more suitable for low power applications. Nd:YLF has, in contrast, the advantage of a very long fluorescence lifetime and can store more pump energy, which makes it attractive for pulsed lasers. Another very interesting property is

8
the emission wavelengths of the quasi-three-level system of 908 (σ-polarized) and 903 nm (π-polarized). These wavelengths are both lower than realized with any other diode pumped solid-state laser. The laser properties of the mentioned Nd doped crystal hosts are listed in Table 2.2.
Figure 2.1 Term diagram for Nd3+ in YAG.

9
Chemical formular Nd:Y3Al5O12
[2], [3]
Nd:LiYF4
[3]
Nd:YVO4
[3]
Nd:GdVO4
[5], [6], [3]
Fluorescence lifetime 4F3/2 [µs] 240 540 90 90
Stimulated emission cross-section 4F3/2→
4I11/2 [10-19cm2]
6 2.2 (π) 12.3 12.5
Stimulated emission cross-section 4F3/2→
4I9/2 [10-19cm2]
0.53 4.8 (π) 4.3(σ) 6.6 (π)
Fractional population of highest 4I9/2 sub-level at room temp.
0.0077 0.034 0.049
Wavelength 4F3/2→4I9/2 [nm] 1064 1047 (π) 1064 1063
Wavelength 4F3/2→4I9/2 [nm] 946 908 (σ) 914 913
Pump wavelength [nm] 808 792 808 807
Pump absorption coefficient
(1 at% Nd doping) [cm-1]
4.3 5.3 31.4 (π) 67(π)
Gain bandwidth 4F3/2→4I11/2 [nm] 1.0 1.5 (π) 1.0 (π) 1.2 (π)
Gain bandwidth 4F3/2→4I9/2 [nm] 1.0 3.0 (π) 3.4 (σ) 2.5 (π)
Table 2.2 Optical properties of Nd:YAG, Nd:YLF, Nd:YVO and Nd:GVO
Recently, Yb doped crystals are the subject of special interest. For example Yb:YAG has a very high quantum efficiency (a pump wavelength of 0.94 µm and a laser wavelength of 1.03 µm), reducing the heat load and improving the slope efficiency. Novel high power lasers emitting up to 1 kW utilize this laser crystal. On the other side, KGW and KYW are getting very attractive crystal host for Nd and Yb doping. They have large third order susceptibility and they are promising Raman active media. Furthermore they offer large pump absorption cross section and high stimulated emission cross-section. These are only some examples from a wide variety of new interesting laser crystals. Reabsorption in quasi-three-level lasers: Quasi-three-level lasers use the ground state as lower laser level. Although this level is splitted into a manifold due to the Stark effect, it is still thermally populated. The consequence is temperature depending reabsorption loss. According to [7], these losses are described by

10
Equation 2-1
ionemreabs Nf ⋅⋅= σα , with the stimulated emission cross section σem, the fractional population of the lower laser level f and the concentration of the doping ions Nion. Using the data from of Table 2.1 and Table 2.2, one gets for example αreabs=0.056/cm for 1at% doped Nd:YAG and αreabs=0.34/cm for 0.2at% doped Nd:YVO4. These losses are considerably high and they have to be compensated by strong gain (high pump beam brightness and laser mode confinement) for reaching a reasonably low laser threshold.
2.2 Optics The ability to choose the right laser scheme requires a good understanding of the involved optics. This chapter gives a short introduction into Gaussian beams, the matrix formalism and resonator theory. The presented theory served as a tool for simulating laser cavities as well as imaging optics.
2.2.1 Gaussian beams Gaussian beams are the “eigenfunctions of free space”. To be more precise, they are an exact solution to the paraxial wave equation. To validate this statement, one has to start with the electro-magnetic wave equation Equation 2-2
2
2
22 ),(1),(
ttrE
ctrE
∂∂
=∇vv
vv,
which directly originates from the Maxwell-equations. The Maxwell-theory is one of the most successful theories in physics. It allows a precise description of many aspects of the interaction of light with matter, like diffraction, interference and even nonlinear optics. We will indeed use them in a later chapter to describe frequency conversion of laser light. For now, we go back to our Gaussian beam problem. The solution of the wave equation should be a superposition of plane waves, characterized by
)()(),( kztiertrE −⋅Ψ= ωvvv, with k = 2π/λ and a complex scalar amplitude Ψ( rv ) that is
altered by diffraction effects. Presuming that this transverse amplitude changes slowly with distance z, we can write the reduced paraxial wave equation Equation 2-3
0)(2)(2
2
2
2
=Ψ∂∂
−Ψ
∂∂
+∂∂ r
zikr
yxvv
.

11
The scalar amplitude has the form of a spherical wave but with complex source point coordinates to express the fall off with transverse distance to the axis: Equation 2-4
+=Ψ
)(~2exp
)(~1)(
22
zqyxik
zqrv .
We can separate the exponent into real and imaginary parts: Equation 2-5
)(1
)(1
)(~1
zqi
zqzq ir
−= ,
which can be interpreted as Equation 2-6
)()(1
)(~1
2 zi
zRzq πωλ
−= ,
where the complex beam parameter )(~ zq depends on the radius of the wavefront-curvature R(z) as well as the beam radius )(zω and fully characterizes a beam at any z coordinate. It is very useful to originate the coordinate system from the point were the Gaussian beam has a planar wavefront. At this point, the beam parameter is
Rziiq ⋅=⋅= λπω /)0(~ 20 , with the beam waist 0)0( ωω = and the Rayleigh-range zR.
With employing the propagation law zqzq += )0(~)(~ and the substitutions Equation 2-7
zzzzR R
2
)( += and
2
0 1)(
+=
Rzzz ωω ,
it is hence straight-forward to proof that (Equation 2-4) are the parameters of is indeed a solution of the paraxial wave equation and the parameters in Equation 2-7 describe the free space evolution of this solution. It is obvious that the beam waist of a diffraction limited Gaussian beam is proportional to the reciprocal far field angle
( ) ( )0//)(lim ωπλωθ ⋅==∞→
zzz
. The contour of a Gaussian beam is shown in Figure 2.2.
12
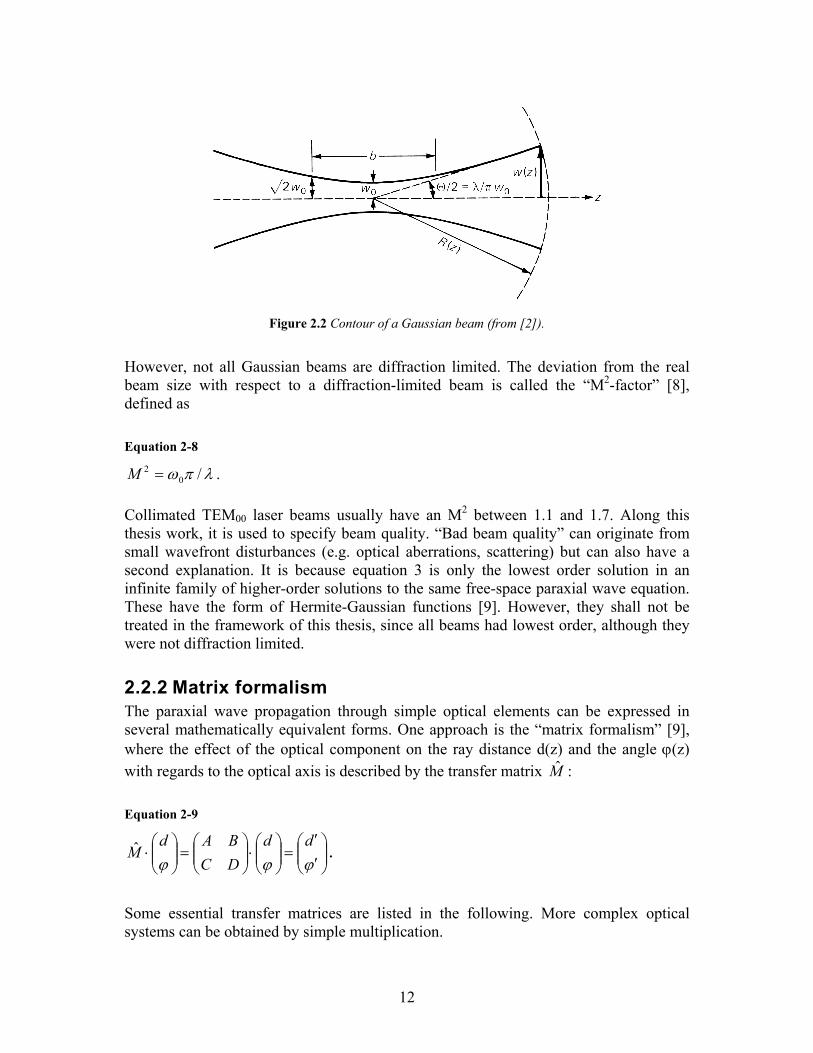
Figure 2.2 Contour of a Gaussian beam (from [2]).
However, not all Gaussian beams are diffraction limited. The deviation from the real beam size with respect to a diffraction-limited beam is called the “M2-factor” [8], defined as Equation 2-8
λπω /02 =M .
Collimated TEM00 laser beams usually have an M2 between 1.1 and 1.7. Along this thesis work, it is used to specify beam quality. “Bad beam quality” can originate from small wavefront disturbances (e.g. optical aberrations, scattering) but can also have a second explanation. It is because equation 3 is only the lowest order solution in an infinite family of higher-order solutions to the same free-space paraxial wave equation. These have the form of Hermite-Gaussian functions [9]. However, they shall not be treated in the framework of this thesis, since all beams had lowest order, although they were not diffraction limited.
2.2.2 Matrix formalism The paraxial wave propagation through simple optical elements can be expressed in several mathematically equivalent forms. One approach is the “matrix formalism” [9], where the effect of the optical component on the ray distance d(z) and the angle ϕ(z) with regards to the optical axis is described by the transfer matrix M̂ : Equation 2-9
′′
=
⋅
=
⋅
ϕϕϕdd
DCBAd
M̂ .
Some essential transfer matrices are listed in the following. More complex optical systems can be obtained by simple multiplication.

13
• Propagation through free space with distance s:
=
101ˆ s
M
• Transition between two dielectric media with refractive indices n and n´:
=
′nnM
001ˆ
• Thin lens with focal length f:
−
=101ˆ
1f
M
• Reflection at a spherical mirror with radius of curvature R:
−
=101ˆ
2R
M
• Transition through a curved dielectric interface:
=
−′ 101ˆ
Rnn
M
These matrices are limited to normal beam incidence and do not cover optical aberrations (see [10] for a more general treatment). An extremely useful correlation can be obtained for Gaussian beams. In [10], it is shown that an optical component with a transfer matrix M̂ transforms the complex beam parameter q~ as Equation 2-10
DnqCBnqA
nq
+⋅+⋅
=′′
)/~()/~(~
,
with λλ nn =′′ . In other words, ray matrices can be applied to both, geometrical optics as well as Gaussian beams. During this thesis work, this rule was repetitively proven and applied to simulate arbitrary complex optical systems.
2.2.3 Resonator theory The matrix formalism can be used to calculate optical resonators, which is a highly desired tool for laser design. A stable resonator reproduces the complex beam parameter after one round-trip, also expressed by )(~)(~~
21 zqzqq == . It follows from equation (Equation 2-10): Equation 2-11
0~)(~ 2 =−⋅−+ BqADqC .
The determinant of the round-trip matrix is one, resulting in a solution of Equation 2-11:

14
Equation 2-12
2)(422~
1 DABi
BAD
q+−−
−= .
From Equation 2-12, it follows that the beam radius ω and the wavefront-curvature R are given by Equation 2-13
( )( ) 122 42 −
+−= DAB
πλ
ω , AD
BR−
=2
.
With choosing a suitable start and end-point, both parameters can be calculated for any location in the resonator. A simple example may clarify this formalism. The laser resonator shall consist of two mirrors with curvature R1 and R2. The length of the resonator is L and a lens with focal length f is placed between the mirrors. The distance from one mirror to the lens is L1, while the second distance is L2=L-L1. It is common to define two stability parameters [11] Equation 2-14
)1( 11
21 ux
LLg ⋅+−= , )1( 2
2
12 ux
LLg ⋅+−= ,
with )1(
1
111 R
LLu −= , )1(2
222 R
LLu −= and 21
111LLfx −−= . By using these definitions, the
round-trip matrix becomes [2] Equation 2-15
−−
−=
12)1(2212ˆ
21211
221
gggggggg
M .
With assuming that the beam radius is real, one can deduce from (Equation 2-15) that
2)ˆ( <=+ MtraceDA . The stability criterion for the suggested resonator is hence
Equation 2-16
2)12(2 21 <−=+ ggDA ⇒ 10 21 ≤≤ gg .
The contour of the resonator mode for a given set of mirror curvatures and focal length of the lens fulfilling (Equation 2-16) was now obtained by recursive computation.
15
2.2.4 Surface quality and coatings On the first sight, surface quality and coatings seem to be a trivial problem, with all these hundreds of suppliers on the market. But it was indeed not the case. Especially with intracavity frequency doubled lasers, where parasitic losses were detrimental, a lot of time had to be invested to find the right supplier, which could fulfill the needed specifications. Surface quality: Surface quality is very often referenced to the MIL-0-13830A standard, which includes scratches, digs, grayness, edge chips, and cemented interfaces [12]. Scratch numbers refer to the width of the reference scratch in ten thousandths of a millimeter. For example, a 10 scratch is equivalent to a 1-µm standard scratch. Even with some maximum visibility scratches present, MIL-0-13830A still allows many combinations of smaller scratch sizes and lengths on the polished surface. A dig is a pit or small crater on the polished optical surface. Digs are defined by their diameters, which are the actual sizes of the digs in hundredths of a millimeter. The diameter of an irregularly shaped dig is 1/2 x (length plus width). For example, a 5 dig is equivalent to a 0.05 mm standard dig. The sum of the diameters of all digs shall not exceed twice the diameter of the maximum size specified per any 20-mm diameter. 10-5 scratch and dig represents a precise standard for very demanding laser applications and is the optimum, optics suppliers can offer. However, it did not satisfy our needs in many cases. The biggest problem was that the MIL-0-13830A standard allows a relatively high dig-density on small substrates. Hence, we had to start intensive discussions with our suppliers. Together, we solved some of the problems by applying specially designed holders, by investing more money into a careful and time-consuming polishing technique or by simply choosing bigger substrates. Anyway, despite all the effort, we very often ended up in translating optics for circumventing performance decrease due to scattering at digs and scratches. Coatings: The smartest laser design can be unrealistic because of coating limitations. This lesson was quick and painful. Laser diodes were burned because of unexpected back-reflections, coatings were destroyed when operated at 946 nm (see below) and unwanted ethalon effects destabilized lasers. It turned out to be extremely helpful to know more about available coating techniques, their advantages and their disadvantages. Electron beam coating [12]: “A high-flux electron gun (1 A at 10 kV) is aimed at the film material contained in a large, water-cooled, copper crucible. Intense local heating melts and vaporizes some of the coating material in the center of the crucible without causing undue heating of the crucible itself. Careful control of temperature and vacuum conditions ensures that most of the vapor is in the form of atoms or molecules, as opposed to clusters. This produces a more even coating with better optical characteristics and improved longevity.” Advantages: The coating technology and therefore the coating itself is cheap. The results are good but do not satisfy the highest demands. A single wavelength multilayer

16
anti-reflective (AR) coating can be realized with R<0.1% and a double wavelength AR coating with R<1%. Simple high reflectivity (HR) coatings can be specified with R>99.8%, more complex coatings (double HR, long pass, short pass) with R>99.5%. The transmission of a HR/HT combination (For example an input coupler with HR for the laser wavelength and HT for the pump wavelength) is realizable with about HR>99.5% and HT<10%. Disadvantages: The energy of the vaporized coating atoms or molecules is relatively low and results in a low packing density in the thin-film coating-layers, leading into water-vapor absorption. This causes changes in transmission behavior and reduced damage threshold for wavelengths that coincide with a water absorption line (for example 946 nm). Furthermore, the interface between the layers is granular and not well defined (see Figure 2.3), which is the reason for a relatively unpredictable coating result. It also causes scattering and hence losses. For example, a multilayer HR coating with a transmission of only 0.2% can have additional 0.2% losses.
Figure 2.3 Comparison of an e-beam coating with an ion-assisted coating [13].
Ion-assisted coatings: In this technique, the newly deposited coating layer is subjected to a stream of ions (O, Ar, Xe). These ions transfer energy to the adsorbed surface atoms, thereby increasing their kinetic energy and resulting in a more compact, non-porous layer. Advantages: Coatings made with the ion-assisted technique are more expensive than e-beam coatings but offer more distinct layer boundaries, which lead to a more controlled transmission curve. A single wavelength multilayer anti-reflective (AR) coating can be realized with R<0.1% and a double wavelength AR coating with R<0.5%. Simple high reflectivity (HR) coatings can be specified with R>99.9%, more complex coatings (double HR, long pass, short pass) with R>99.7%. The transmission of a HR/HT combination (For example an input coupler with HR for the laser wavelength and HT for the pump wavelength) is realizable with about HR>99.7% and HT<5%. Disadvantages: Graphite grids are used to narrow down the energy spectrum of the ions. Small micro-explosions in this grid cause unpredictably scattered micro-pinholes in the coating.
17
Sputter deposition: Charged Ar+ ions are accelerated and bombard a target (cathode). This results in the erosion of the cathode material. Microscopic particles are ejected, react with oxygen and form a thin-film layer on the substrate. Advantages: Sputter deposition enables extremely dense coating layers, very distinct layer boundaries and gives ultimate results. A single wavelength multilayer anti-reflective (AR) coating can be realized with R<0.05% and a double wavelength AR coating with R<0.2%. Simple high reflectivity (HR) coatings can be specified with R>99.95%, more complex coatings (double HR, long pass, short pass) with R>99.8%. The transmission of a HR/HT combination (For example an input coupler with HR for the laser wavelength and HT for the pump wavelength) is realizable with about HR>99.8% and HT<2%. Disadvantages: The technology is expensive and the deposition rate is low. We employed electron beam coatings wherever low losses and a low damage threshold were of no great concern. This was the case for nonlinear crystals and other optical components outside a laser cavity, for Q-switched lasers with high output coupling and even for intracavity doubled lasers with high gain and high conversion efficiency. Other components were coated with the ion-assisted or even sputter technique, depending on the demands.
2.3 Laser schemes The following five sub-chapters cover the basics for designing a diode pumped solid-state laser. They describe appropriate arrangements and give an introduction into laser dynamics.
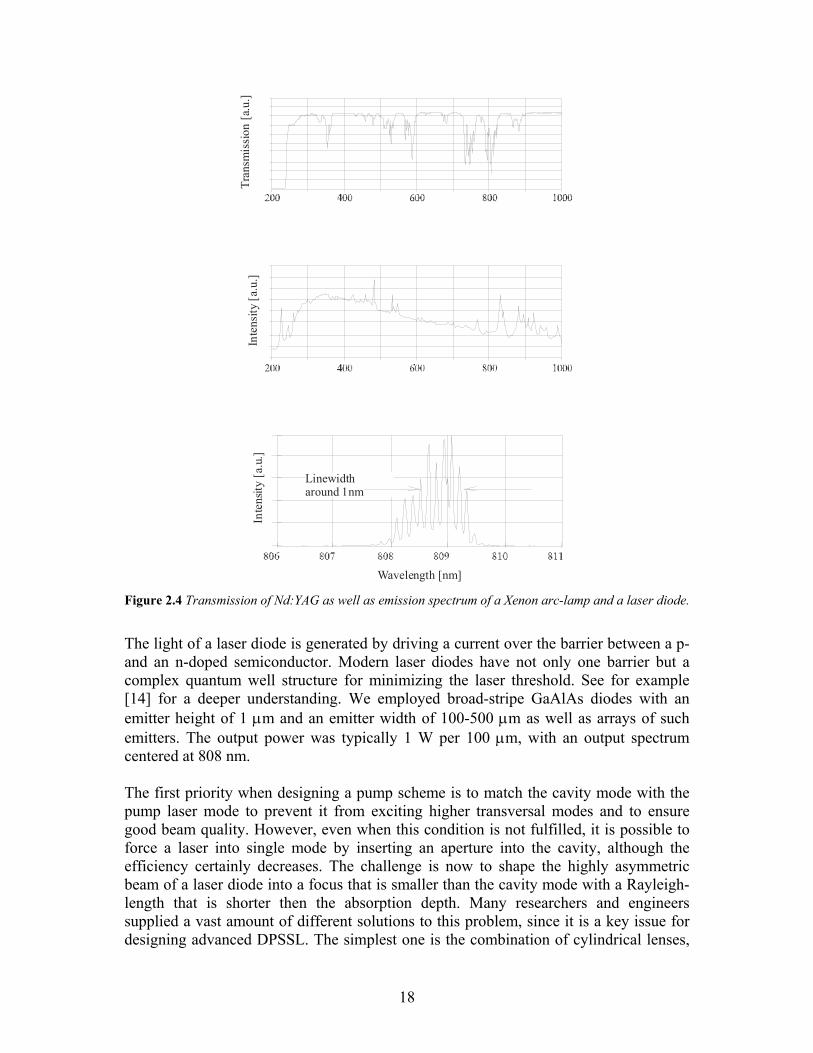
2.3.1 Diode pumping For a long time period, flash lamps were the only alternative for optically pumping solid-state laser crystals. The drawback with this technique is the very poor overlap of their emission spectrum with the absorption spectrum of the active ions, as shown in Figure 2.4, although they are still used in some pulsed applications because of their cost-effectiveness. The pump efficiency could be drastically enhanced with the appearance of narrow band diode lasers. The bandwidth of these diodes is typically 1 nm (see Figure 2.4) and can be matched with one of the strong absorption lines. With an appropriate design, the pump absorption efficiency increases up to 100%, in contrast to a few percent with flash lamps. The electrical to optical efficiency of a DPSSL can be higher than 25%.
18
Inte
nsity
[a.u
.]In
tens
ity [a
.u.]
Wavelength [nm]
Tran
smis
sion
[a.u
.]
Linewidtharound 1nm
Figure 2.4 Transmission of Nd:YAG as well as emission spectrum of a Xenon arc-lamp and a laser diode.
The light of a laser diode is generated by driving a current over the barrier between a p- and an n-doped semiconductor. Modern laser diodes have not only one barrier but a complex quantum well structure for minimizing the laser threshold. See for example [14] for a deeper understanding. We employed broad-stripe GaAlAs diodes with an emitter height of 1 µm and an emitter width of 100-500 µm as well as arrays of such emitters. The output power was typically 1 W per 100 µm, with an output spectrum centered at 808 nm. The first priority when designing a pump scheme is to match the cavity mode with the pump laser mode to prevent it from exciting higher transversal modes and to ensure good beam quality. However, even when this condition is not fulfilled, it is possible to force a laser into single mode by inserting an aperture into the cavity, although the efficiency certainly decreases. The challenge is now to shape the highly asymmetric beam of a laser diode into a focus that is smaller than the cavity mode with a Rayleigh-length that is shorter then the absorption depth. Many researchers and engineers supplied a vast amount of different solutions to this problem, since it is a key issue for designing advanced DPSSL. The simplest one is the combination of cylindrical lenses,

19
but there are also advanced approaches, improving the poor beam quality of a diode array with a factor of 40 or more. Several variants were tested during this thesis work. For single emitters, we employed different combinations of cylindrical and spherical lenses as well as the more advanced “beam-twister” (BTW) technique [15] and the “two-mirror” technique [16]. While the first approach is trivial, the latter two ones are not. In the following, only the BTW technique should be treated in detail, since the “two-mirror” approach proved to be effective but turned out to be too complex and unstable for every days use.
2.3.2 Beam-twisting An extensive theoretical treatment of transforming three-dimensional Hermite-Gaussian beams into Laguerre-Gaussian beams was performed in [17]. The converter consisted of two cylindrical lenses under well-defined conditions. The theory was successfully extended to the transformation of any astigmatic beam (like the beam from a broad-stripe laser diode) into a stigmatic beam with twist [15]. The method used was the matrix formulism, presented in chapter 2.2.2, adapted to astigmatic elements. It was found that optimum conversion requires the Rayleigh length and waist position being identical in both transverse directions. The two lenses should be placed symmetrically around the focus. They should be rotated by 45º and their focal length and position should be related to the Rayleigh length of the focus (see. Figure 2.5).
Figure 2.5 Optical system for converting astigmatic beams into stigmatic beams with twist [15].
The distance between the lenses and the focus should be 2/Fz = , while the focal length F of the lenses should obey the following relation: Equation 2-17
22 −= Rz
F .
This fairly simple set of conditions serves as a powerful tool to easily design a BTW system for a laser diode. We applied it to a diode with 490 µm emitter and an output

20
power of 7 W. With the help of two cylindrical and one spherical lens, the fast axis (perpendicular to the stripe) was focused to a radius of 75 µm and the slow axis (parallel to the stripe) to 475 µm. The Rayleigh length was 14.5 mm in both cases, which results in a beam quality factor of M2=1.5 for the fast axis and M2=60 for the slow axis. The optimum theoretical focal length of the two BTW lenses was F=25 mm, according to Equation 2-17, and their distance to the focus 17.7 mm. These values turned out to be optimum even in the experiment. We refocused the transformed beam into a 110x110 µm spot. The transverse beam parameters were not identical (M2=32 in the fast axis and M2=38 in the slow axis), but that was explained with the distorted diode beam. It did not have a homogeneous elliptical profile but rather an overlap of several lobes. For getting higher power and an even more symmetric beam, the output of two diodes of the same type but mounted with the emitters perpendicular to each other were combined, using a polarization beam combining cube (the diodes were linearly polarized along the emitter). The resulting focus still had a radius of 110x110 µm, but with more equal beam quality factors of M2=38 in the fast axis and M2=40 in the slow axis. The total losses of the optics added up to about 18%, resulting in 10.5 W output at a diode current of 8 A. This highly symmetric, high power pump source was for example employed for driving the laser amplifier, presented in paper [IV]. The outcome of this arrangement was encouraging and more effort was invested to scale the optical arrangement down for achieving a more compact setup. For this purpose, we employed a micro lens for collimating the fast axis and a strong aspherical lens to focus the laser diode beam down to a Rayleigh length as short as 3.5 mm. The two cylindrical BTW lenses were combined into one single thick lens. Even though the whole arrangement was only about 5 cm long, the results were comparable to those from the large BTW. Anyway, we wanted to go one step further. The goal was to miniaturize the whole package down to about 1 cm, while maintaining cost effectiveness and stability. There are only two alternatives for manufacturing lenses with the extremely short focal length we were looking for. One is etched micro lenses and the other one is GRIN-lenses. While micro lenses provide superior optical performance, GRIN lenses give the advantage of low cost and flat optical surfaces. These flat surfaces open up the opportunity to build a quasi-monolithic BTW by gluing several lenses and spacers together into one stable block. This was exactly what we were looking for. Two cylindrical GRIN-lenses focused the beam of a 200 µm wide emitter with 2 W output into a spot with a Rayleigh length of only 1 mm. A single cylindrical GRIN-lens, rotated by 45º, served as BTW and a spherical GRIN-lens refocused the beam into a symmetric spot with a radius of 50 µm. The distances between the lenses was filled up with glass spacers and index-matching optical adhesive was used to bond the parts together, resulting in a quasi-monolithic package with a length of only 14 mm (see patent [I]). The beam quality factor of the shaped beam was improved to M2=18, down from M2=28 for the unshaped beam.
2.3.3 Standing wave cavities In a standing wave cavity, the electromagnetic field is traveling along a closed optical path in the forward and backward direction, forming a standing wave pattern with nodes and antinodes. The shape of the pattern can be derived from the longitudinal mode structure, while the longitudinal mode structure itself is predetermined by the Fabry-
21
Perot nature of the cavity, which only resonates wavelengths with λ=2·L/m, where L ist the cavity length and m is a positive integer. There is of course a selection mechanism for the longitudinal modes due to gain effects. In a purely homogeneously broadened laser transition, only the longitudinal mode with the highest gain builds up and completely depletes the gain, but in a free running standing wave cavity, one mode leaves the gain around the nodes undepleted, allowing the build-up of neighboring modes with suitable antinode distribution. This effect is called “spatial hole burning”. It couples the longitudinal modes to each other, giving rise to amplitude instability in intracavity doubled lasers (see chapter 4.3.1). In the beginning of the thesis work, the matrix formalism, introduced in 2.2.2 was employed to write MathCad scripts for simulating simple cavities as presented in 2.2.3. After realizing that these simulations were constantly needed, the wish for a user-friendlier program arose. We decided to employ the program WinLase from C. Horvath and F. Loesel. It uses the same formalism but provides a convenient Windows interface. However, before starting to design laser cavities with this program, certain premises were considered:
• The cavity should be stable and its mode size in the laser crystal should be similar to the pump spot size.
• The amount of optical components should be as little as possible to decrease losses and increase compactness as well as stability.
• For isotropic laser crystals, polarizing optics has to be implemented for optimum conversion efficiency (see chapter 3).
• The cavity should be rather insensitive to thermal lensing (see chapter 2.4.1). The cavity, which fulfills the above premises very well, would be a monolithic plane-parallel design, stabilized by thermal lensing. In a next step, one could add a curved mirror to increase insensitivity towards thermal lensing. These two simple arrangements were indeed the basis for most of the lasers in this thesis work. A quantity of selected examples shall now be presented.
2.3.3.1 Experimental results on a cw 1064 nm Nd:YAG laser: The standing-wave laser, frequency doubled to 532 nm in paper [VI], was based on a 5 mm long 1at% doped Nd:YAG crystal, coated with HR@1064 nm and HT@ 808nm on one side and AR on the other side. The crystal was mounted in a water-cooled copper block and pumped with a 400 µm spot, delivered by a 808 nm diode array, beamshaped and coupled into a 200 µm fiber with NA 0.22. A flat mirror with R=80% and 22 mm distance to the crystal served as output coupler and a fused silica Brewster window polarized the laser mode. Modematching was fulfilled at a pump-power of 20 W, generating a thermal lens that corresponds to a curved mirror with ROC=25 mm. The cavity was not optimized for lower pump powers with lower thermal lensing, there resulting into multimode operation. Finally, a single mode, linearly polarized output power of 8 W could be measured.

22
2.3.3.2 Experimental results on a cw 946 nm Nd:YAG laser: As pointed out in chapter 2.1, quasi-three-level lasers, running on the 4F3/2-4I9/2 transition, suffer from reabsorption loss and generally have a much lower stimulated emission cross section compared to their four-level version, running on the 4F3/2-4I11/2 transition. For designing the quasi-three-level version of a Nd:YAG laser, reabsorption losses were minimized by trading of a lower pump absorption efficiency. The crystal was only 3 mm long and the doping level was only 0.6 at% with HR@946, HT@808 and HT@1064 nm (to suppress lasing at 1064 nm) on one side and AR@946 and AR@808 nm on the other side. This design gave optimum performance, although only 56% of the pump light was absorbed. It was especially advantageous at higher powers, were the crystal design efficiently decreases thermally induced birefringence, leading to less losses at the Brewster window. The losses at the Brewster window are much more critical for quasi-three-level lasers, since the lower gain requires less output coupling compared to for four-level lasers. For further enhancing the efficiency of the laser, the pump-focus was only 270 µm in diameter and a curved mirror with ROC=-50 mm and R=95% was used at a distance of 30 mm to the laser crystal. Figure 2.6 shows the slope efficiency of this laser. Thermal effects prevented from single transversal mode operation above 17 W pump power.
0 2 4 6 8 10 12 14 160,0
0,5
1,0
1,5
2,0
2,5
3,0
3,5
Out
put P
ower
[W]
Pump Power [W]
Figure 2.6 Slope efficiency of the 946 nm Nd:YAG laser.
2.3.3.3 Experimental results on a cw 914 nm Nd:YVO4 laser: The 4F3/2-4I9/2 transition of Nd:YVO4 promises higher gain but also inhibits much stronger reabsorption losses. The doping level has to be even lower, the crystal shorter and the pump focus smaller. We chose a 2 mm long a-cut sample with 0.2 at% doping which resulted in 50% absorption efficiency. The pump focus was only 140 µm. Special care had to be taken for suppressing the strong laser gain at 1064 nm. Therefore, the incoupling side of the laser crystal had a coating with HT>98% at 1064 nm. The output coupler was the same as for the Nd:YAG laser but with ROC=-100 mm at a distance of

23
10 mm to the laser crystal. No Brewster window was needed, since the c-axis of Nd:YVO is dominating its laser activity at 914 nm, but the laser performance was still slightly worse compared to Nd:YAG (see Figure 2.7). However, it showed a very strong dependency on pump beam quality. The experiments indicate that a polarized pump source with three times better beam quality, focused to a smaller pump spot, would even out the performance. Indeed, when employing an aperture to the pump beam improving the beam quality with a factor of 2, then the slope efficiency increased from 17.3 % to 27.8% and the threshold pump power decreased from 3.4 W down to 1.3 W.
0 2 4 6 8 10 12 14 16 18 200,0
0,5
1,0
1,5
2,0
2,5
3,0
Out
put P
ower
[W]
Pump Power [W]
Figure 2.7 Slope efficiency of the 914 nm Nd:YVO4 laser.
2.3.3.4 Experimental results on a cw 908 and 903 nm Nd:YLF laser: The last candidate among these quasi-three-level lasers was Nd:YLF. It was choosen because of the very high energy of its 4F3/2-4I9/2 transition. Lasing is possible at 908 as well as 903 nm (see chapter 2.1). Nd:YLF has the most delicate laser properties, since it has very low gain, combined with fairly high reabsorption. It has low tensile strength, which implicates high handling demands, thermally as well as mechanically. For example, its thermally induced stress is very strong under non-lasing conditions, which is why the cavity was aligned with chopped pumping. The chopper was only removed when lasing was guaranteed. Two laser rods were designed. A 1.4 mm long, 1-at.% Nd doped crystal and a 2.4 mm long, 0.6-at.% doped crystal. Both rods had an antireflective coating at 908 nm on one side. The other side was highly reflective coated at 908 nm and highly transmitting at around 1047 nm. The outputcoupler had a transmission of 2.7% at 908 nm and 3.2% at 903 nm, the radius of curvature was ROC=-100 and the cavity length 15 mm. A fiber-coupled diode laser array served as pump. It delivered a maximum output power of 8.88 W from a fiber with 250 µm-core diameter (NA 0.22). Its center wavelength was 792 nm to match the high pump absorption coefficient for light perpendicular to the c-axis of Nd:YLF. The overall pump absorption efficiency was 56% for both laser crystals. The σ-polarized emission at 908 nm is superior to π-

24
polarized emission at 903 nm because of the slightly higher stimulated emission cross section. Figure 2.8 shows the slope at 908 nm.
0 1000 2000 3000 4000 50000
200
400
600
800
1000
1200
1400
1600
Pmax=1057mW
Pmax=1432mW
Ps=1628mWPs=1540mW
Absorbed peak power [mW]
Out
put p
eak
pow
er [m
W]
chopped pump not chopped
Figure 2.8 Output power at 908 nm as a function of absorbed pump power under chopped and non-
chopped condition.
The laser showed chaotic amplitude fluctuations at lower pump power levels but stabilized above about 4W of absorbed pump power. It is important to mention that these values were achieved with the 0.6-at.% doped crystal. The 1.0-at% doped crystal performed much worse. The reason for this behavior could be increased pump absorption density, which results in increased temperature and hence stronger reabsorption, as well as increased upconversion efficiency owing to higher dopant concentration [19]. Indeed, we observed much more upconverted visible radiation in the 1.0-at% doped crystal. In a next step, we forced the laser to emit parallel to the optical axis by inserting a Brewster plate into the cavity. Operation at 903 nm, which corresponds to a transition from the higher of the two sublevels of the upper laser level manifold, could be achieved with only a small decrease in efficiency, as shown in Figure 2.9. Both, the 908 and the 903 nm laser, operated in TEM00 mode with nearly diffraction limited beam quality. As observed at 908 nm, amplitude fluctuations occurred also at 903 nm with comparable behavior. The results were published in paper [VII].

25
0 1000 2000 3000 4000 50000
200
400
600
800
1000
Pmax=580mW
Pmax=923mW
Ps=2100mWPs=2192mW
Absorbed peak power [mW]
Out
put p
eak
pow
er [m
W]
chopped pump not chopped
Figure 2.9 Output power at 903 nm as a function of absorbed pump power under chopped and non-
chopped condition.
2.3.4 Traveling wave cavities Opposed to standing wave cavities, in traveling wave cavities, the electromagnetic wave is traveling unidirectional. The shape of such a cavity is preferably ring-shaped, comprising an optical diode that suppresses lasing in one direction. Interference patterns only emerge close to the mirrors, where the incident and reflected beam have small overlap. However, the gain media can be placed away from these regions, eliminating any spatial-hole-burning effect. The gain becomes very homogeneous, supporting single frequency operation. A very compact variant of such a laser was repeatedly employed during this thesis work. It is the monolithic non-planar ring oscillator (NPRO). Figure 2.10 shows a sketch of the cavity design and its beam path.
1064nm 808nm (Diodelaser)
B
Outcoupling side
Point of total internal reflection (TIR)
(a) (b) Figure 2.10 Geometry of the monolithic laser crystal in (a) top and (b) perspective view.

26
The Nd:YAG crystal has dimensions of 3x8x12 mm and it has a combined input and output coupler coating at the front face (HT@808 nm, R=97.5%@1064 nm for s-pol and R=93%@1064 nm for p-pol light). Although the design does not totally circumvent spatial hole burning (there is a small overlapping region at the front face), it still produces up to 2 W of single frequency output [20]. Even higher output (up to 4 W) can be reached with a composite diffusion bonded design, using a thin undoped part at the front, removing any spatial hole burning. The optical diode consists of a combination of a reciprocal with a non-reciprocal polarization rotator. The two rotations cancel each other out in traveling direction, and add up in the opposite direction. A polarizer then selects the laser mode with the lowest losses. The non-planar beam path was used to obtain reciprocal rotation, while a magnetic-field-induced Faraday-effect (YAG has a non-zero Verdet constant) cares for the non-reciprocal part. The polarization dependent coating on the outcoupling face acts as polarizer and suppresses lasing in the direction where both polarization rotations add up. The pump-schematic of most of the used NPRO’s is shown in Figure 2.11. Four 2 W diode lasers pumped the crystal. Two each were coupled with a polarization beam combiner.
Diodelaser
NPRO
Diodelaser
DiodelaserDiodelaser
1064nm
HT808nmHR1064nm
Figure 2.11 Pump geometry of the NPRO setup.
The NPRO is not limited to output at 1064 nm. With appropriate coating on the output coupling face, other laser transitions of Nd:YAG can be addressed. Until now, the output at 946, 1064, 1319, 1356 as well as 1440 nm was presented. The choice of the laser crystal was until now limited to isotropic material. This is because of the birefringence effect of anisotropic crystals, destabilizing the optical diode. During this thesis work, it was demonstrated for the first time that this is not necessarily true. Nd:YLF is anisotropic, but has relatively weak birefringence, especially when c-cut. Therefore, a composite NPRO was designed with a 3 mm long Nd:YLF front part and a 9 mm long YAG reflector. Finally, a maximum single frequency output of 600 mW could be recorded. The emitting wavelength of 1053 nm is

27
of special interest for high power Nd:Glass bulk or fiber amplifiers, since it matches their gain maximum. The main reason for employing an NPRO is because of its single frequency operation. However, the ring laser is not the only alternative that leads to such attributes. A standing wave cavity can be forced to suppress neighboring modes with a mode-selecting element. Two variants were tested during this thesis work. One is the ethalon and the other one is the Lyot-filter. The ethalon is nothing but a monolithic plane-parallel Fabry-Perot resonator, placed inside the cavity. Its longitudinal mode structure overlaps with the one from the resonator, providing losses for certain modes while promoting others. With careful design, it is possible to create an arrangement that supplies single frequency operation. The Lyot-Filter works with the same principle, providing a loss structure. It is realized by combining a dispersive birefringent element in combination with a polarizer. The birefringent element rotates the polarization of the laser light with an amount that is wavelength dependent. Only certain wavelengths are rotated with a multiple of 360º and transmitted through the polarizer without losses. Both approaches are employed in chapter 4.3 for forcing single-frequency operation and stabilizing intracavity frequency doubled lasers.
2.3.5 Q-switched lasers For many applications, it is interesting to compress the output of a laser into a short, energetic pulse. A widely uses technique to realize such a pulsed laser is the so-called Q-switching. The quality factor Q is defined as the ratio of the stored energy to the loss per cycle. The idea is to modulate the Q-value with modulating the cavity losses. As long as the losses are switched on while the gain medium is pumped, laser activity is suppressed and energy is cumulatively stored. Only after opening the switch, laser threshold is suddenly reached and nearly the complete stored energy is emitted into a giant pulse. The degree of inversion reduction depends on the speed of the switch compared to the pulse buildup-time. The complete dynamics of the Q-switching process can be precisely simulated with the help of rate-equations. For this purpose, one has to start with the case of a continuous wave four-level laser. It is fully described by the time dependent evolution of the two main variables, the photon number n(t) and the inverted population difference N(t). They are coupled by the stimulated emission cross section σ and influenced by the pump rate r, the decay rate for the inverted population difference γ2 as well as the round trip time tr, the output-coupler reflectivity R and the laser beam cross section σ [9]. However, for the sake of simplicity, we neglect the influence of spatial hole burning, which is a good approximation in most cases: Equation 2-18
)()()()( tntntKNdt
tdncγ−=
and

28
Equation 2-19
)()()()(2 tNtKntNr
dttdN
−−= γ ,
with γC=-ln(R)/tr and the coupling constant )/(2 AtK rσ= . This system of differential equations is not possible to solve analytically. However, for a Q-switched laser, one can treat the pump stage and laser stage independently, since the photon number is zero during the pump interval. Equation 2-19 can then analytically be solved with the following result: Equation 2-20
[ ])exp(1)( 22
γγ
⋅−−= trtN .
It becomes clear that N(t) increases exponentially but converges to r/γ2 and it therefore does not make sense to pump longer than two or three times the lifetime 1/ γ2, because the stored energy would not increase further. The solution for the laser interval is a little bit more complicated. Some approximations have to be made: First, the pulse-buildup-time is supposed to be very short compared to the fluorescence lifetime of the gain medium and second, spontaneous emission and pumping during the short laser interval should be neglected. Division and integration leads then to a simple relation between n(t) and N(t): Equation 2-21
−−≈
)(ln)()(
tNN
rN
tNNtn iii ,
with the initial inverted population difference Ni. All important pulse properties like peak power, pulse length and pulse energy can be obtained from Equation 2-21. In the experiments, it turned out that the pulse-buildup-time was a very important parameter. It can be derived from Equation 2-21 and leads to (see [9]) Equation 2-22
C
rP
tr
Tδ⋅
−≈
125
,
With the cavity losses δC≈ ln(1/R). Two types of Q-switches, presented in paper [I] and [II] shall now be treated in detail. The frustrated total internal reflection and the passive Q-switch :

29
Frustrated total internal reflection Q-switch: An electromagnetic wave that propagates through an interface between two dielectric media with refractive indices n1 and n2 alters its phase vector according to the refraction law n1sinθ1=n2sinθ2. The critical angle of incidence, where the wave is totally internally reflected, is defined by θ1,critical=arcsin(n2/n1). At the top side of the NPRO crystal, the internal angle is 63.4º, and therefore larger than θ1,critical=33.2º. It can know be shown that even if total internal reflection forbids a wave traveling in transmission, there is an evanescent electromagnetic field [21]. This field is oriented parallel to the interface and decays according to Equation 2-23
)exp())(exp(ˆδ
ω dxktiEE x −⋅−⋅= ,
with the penetration depth Equation 2-24
221
221
0
sin2 nn −=
θπ
λδ ,
where λ0 is the wavelength in vacuum. The penetration depth can be measured by employing a dielectric medium with distance d to the interface. Its refractive index n3 must be large enough to suppress total internal reflection. In this case, the evanescence field polarizes this medium, inducing a traveling wave with an amplitude that depends on the distance d. Court et al. found an analytical solution for the transmission through such a “sandwich” structure for the special case of n1=n3 [22]: Equation 2-25
1sinh1
2/
/ +=
yT
psps α
,
with
1sin2 1222 −= θ
λπ Ndny ,
( ))1sin(cos
14
1
122
122
22
−−
=θθ
αNN
Ns ,
( )[ ]2122 1sin1 −+= θαα Nsp ,
2
1:nnN = .
Figure 2.12 shows the transmission depending on the distance d for the NPRO case, where n1=n3=1.82, n2=1 and θ1=63.4.

30
0 1107 2107 3107 4 1070
0.2
0.4
0.6
0.8
1
Distance d [m]
Tran
smis
sion
S-polarised
P-polarised
Figure 2.12 Transmission through the point of total internal reflection depending on the distance between
the NPRO crystal and the second crystal.
It is fairly strong up to a distance of around 0.1 µm and vanishes for distances larger than 1 µm. Since the transmitted wave is nothing but a loss for the laser cavity, one can think about connecting the second crystal to a piezoelectric actuator and modulating these losses by controlling the distance d. Such a modulator would be a Q-switch and is called Frustrated Total Internal Reflection Switch (FTIR-switch). The realization of such a switch for the NPRO is shown in Figure 2.13.
Point of TIR
Piezoelectric actuator
YAG-disc
808 nm1064 nm Figure 2.13 FTIR-switch, consisting of a YAG-disc, connected to a piezoelectric actuator.
A polished disc made from YAG was glued to a piezoelectric tube with a resonance frequency of 25 kHz and a maximum expansion of 5 µm. However, as can be seen from Figure 2.12, 5 µm is not needed to achieve good modulation. We achieved good performance already with 0.5 µm, implying a rise time of 4 µs. This relatively long rise time only permits lossless operation for pump rates up to r=1.03, as can be calculated from Equation 2-22. At higher pump rates, the pulse emission falls into the switching

31
time of the modulator, resulting in a partly outcoupling through the switch. In paper [I], we reported on the average output power of a FTIR-switched laser, depending on the pump rate, as shown in Figure 2.14.
1,0 1,1 1,2 1,30
25
50
75
100
125 Cw-operation Pulsed operation
Pump rate
Aver
age
outp
ut p
ower
[mW
]
Figure 2.14 Average output power of the FTIR-switched laser and the cw laser.
The losses grow with increasing pump rate, as predicted from theory. The pulses had a pulse length of 49 ns, a peak power of 340 W and energy of 17 µJ. Most important, the pulses were actively controlled, not being realized with NPROs before. Passive Q-switch with Cr4+:YAG: Passive Q-switching is very attractive for designing extremely compact and simple pulsed lasers. The main disadvantage with the passive approach is the lack of pulse timing control, but many applications do not need this feature. It was therefore a widely employed technique during this thesis work. Papers [I,II,IV,V,VII] presented frequency converted Nd:YAG lasers, Q-switched with Cr4+:YAG saturable absorbers. The design of these lasers was based on numerical solutions of modified rate-equations, which shall now briefly be introduced.
Figure 2.15 Term diagram of Cr4+ in YAG [23].

32
Figure 2.16 Absorption of Cr4+:YAG as a function of temperature [24].
The best tool to describe the dynamics of Cr4+:YAG saturable absorbers is the term diagram, shown in Figure 2.15. The Cr4+-ions have a 3d2 electron configuration that is not protected by a surrounding inert gas shell, as it is the case for Nd3+:YAG, giving less shielding against the crystal field and acting as color centers with a broad absorption band in the near infrared spectral region. They are assumed to occupy tetrahedrical lattice sites, which is common for granates. The absorption of the laser photons takes place between the ground level 3B1 and the excited state 3E (3T2). The excited electrons relax with a lifetime of 0.1 ns into the relatively long-living (τ=3.5 µs) 3B2 level and then with a quantum efficiency of 15% back into the ground level. The relatively long lifetime of the 3B2 level opens up the opportunity for population inversion and therefore a switch of the Q-factor. This is because a poor occupation of the ground level results in a decreased absorption efficiency of the laser photons: The absorber is “bleached”. The term diagram also mentions excited state absorption from the excited level 3B2 into 3E (3T1). These double excited electrons relax back via non-radiative phonon interactions and therefore limit the efficiency of the absorber. Figure 2.17 shows the bleaching behavior of three different absorbers with an unbleached transmission of T0=65, 85 and 92%. It can be seen that a photon energy density of minimum 0.2 J/cm2 at 1064 nm is required for reaching a strong enough population inversion.

33
0,0 0,1 0,2 0,3 0,4 0,560
70
80
90
100
T0=92% T0=85% T0=65%
Tran
smiss
ion
[%]
Energy density [J/cm2]
Figure 2.17 Bleaching behavior of Cr4+:YAG absorbers with different Cr4+ doping level.
It is obvious that the inverted population difference Na(t) of the absorber has to be taken into account in addition to the inverted population difference Ng(t) of the gain medium when designing an appropriate set of laser rate equations. Even the excited state absorption in Cr4+:YAG has to be considered in the form of the parameter β=σ1/σ2. The set of three coupled rate equations can then be written as [9] Equation 2-26
( )[ ] )()()()()(0 tntNNKtNKtNK
dttdn
caaaaagg ⋅−−−−= γβ
Equation 2-27
)()()()(
tntNKtNrdt
tdNgggg
g γγ −−= ,
Equation 2-28
)()())(()(
0 tntNKtNNdt
tdNaaaaa
a −−= γ ,
with: γg decay rate of upper laser level γa decay rate of first excited state of Cr4+ γ population reduction factor, equals 1 for an ideal four-level laser Kg coupling constant
gr
g
AtgK σ2= , with the cross section σg of the induced laser
emission, the cavity round-trip time tr and the effective beam cross-section Ag Ka coupling constant
ar AtaK 12σ= , with the cross section σ1 of the absorber ground level and the effective beam cross section within the absorber Aa
Na0 Na just before the switching process

34
This system of coupled nonlinear differential equations does not have an analytic solution. However, a numerical integration method was employed (Runge-Kutta formalism) to investigate the time-resolved dynamics. However, while most parameters could be taken from the literature or the laser design, there was no reliable data on the absorption cross sections of the absorber. This problem could be solved by fitting the Frantz-Nodvik-equation (see [26] for a detailed presentation) to the transmission data in Figure 2.17. The obtained values were σ1=8.7x10⁻¹⁸ cm2, σ2=1.3x10⁻¹⁸ cm2 and hence β=6.7. The results for two different initial transmissions T0=71% and T0= 85% are shown in Figure 2.18.
3,08 3,10 3,12 3,14 3,160
2
4
6
8
10
12
14
Photon number n
Time [µs]
Inverted pop. diff. Ng
Inverted pop. diff. N a
Den
sity
[a.u
.]
1,72 1,74 1,76 1,78 1,80 1,820
2
4
6
8
10
12
14
Photon number n Inverted pop. diff. Ng
Inverted pop. diff. N a
Den
sity
[a.u
.]
Time [µs] Figure 2.18 Laser parameters during the pulse emission for two different initial absorber transmissions
T0=71% (left graph) and T0= 85% (right graph).
It can clearly be seen that a lower initial transmission leads to higher inverted population differences and shorter pulses with higher peak power. It would be practically very useful to plot the pulse parameters in relation to the output coupling and the initial transmission. Such a plot would be a powerful tool for designing application specific lasers. X. Zhang et al. [26] solved this problem by introducing several approximations and derived a simple set of relations for analytically calculating the pulse energy EP, the peak power PPeak, the pulse length τP, the average output power PAv and the pulse repetition rate fP: Equation 2-29
⋅
=
f
i
g
aP n
nR
AhE ln1ln
2 γσν
,
Equation 2-30
−−−
−−⋅
= α
α
αγν
i
ttoi
t
itti
rPeak n
nnn
nn
nnnRt
hP 11)(ln1ln 0 ,

35
Equation 2-31
Peak
PP P
E≈τ ,
Equation 2-32
β
β
τ 1
1
12/)1(/1
−
+−= Schwelle
aP
PPf ,
Equation 2-33
PulsPAv EfP ⋅= , with:
1
20
2
1ln1ln
−
+
+
=ag
i A
LTR
nσ
, 1
20
0 2
1ln11ln
−
+
+
=ag
t A
LTR
nσ
β,
α
−+=
i
t
i
t
i
t
i
t
nn
nn
nn
nn 00 1 ,
−
−−
+=
α
α i
f
i
t
i
f
i
t
i
f
nn
nn
nn
nn
nn
111ln1 00 and g
a
γσσ
α = .
Figure 2.19 to Figure 2.21 show plots for several simulated Q-switched lasers (using Equation 2-29 to Equation 2-33) based on the NPRO design with 4 W pump power, presented in chapter 2.3.3. As a result, they guide to the optimum laser design for given premises. For example, when needing average output power higher than 0.5 W and simultaneously peak power higher than 50 kW, one would choose an absorber with T0=70% and an output coupler with R=0.8.
τ P[s
]
Output coupling R0.5 0.6 0.7 0.8 0.9 10
2 10 9
4 10 9
6 10 9
8 10 9
T0=60%
T0=70%T0=80%
T0=90%
Puls
e le
ngth
E P[J
]
0.5 0.6 0.7 0.8 0.9 10
5 10 5
1 10 4
1.5 10 4
T0=60%T0=70%
T0=80%
T0=90%
Output coupling R
Puls
e en
ergy
Figure 2.19 Pulse energy and pulse length for variable absorber transmission and output coupling.

36
f P[H
z]
0.5 0.6 0.7 0.8 0.9 10
2 104
4 104
6 104
T0=60%T0=70%
T0=80%
T0=90%
Output coupling R
Rep
etiti
on ra
teP Pea
k[W
]
0.5 0.6 0.7 0.8 0.9 10
5 104
1 105
1.5 105
T0=60%
T0=70%
T0=80%
T0=90%
Output coupling R
Peak
pow
er
Figure 2.20 Peak power and repetition rate for variable absorber transmission and output coupling.
P Av
[W]
0.5 0.6 0.7 0.8 0.9 10
0.5
1
1.5
T0=60%
T0=70%
T0=80%
T0=90%
Output coupling R
Aver
age
pow
er
Figure 2.21 Average output power for variable absorber transmission and output coupling.
While the design of the Q-switched lasers in papers [II,IV,V,VII] was purely based on the above simulations, paper [I] presented a unique combination of active FTIR and passive Cr4+:YAG Q-switching. In the beginning of this chapter, it was pointed out that an actively Q-switched NPRO is limited to very low pump rates around r=1.03, since the pulse build-up time gets to fast for the relatively slow FTIR switching time. The advantage of a combined switch becomes obvious when going back to the time-resolved dynamics of the system. We first calculated the saturated inversion population for several pump power levels and used them as starting points for simulating the referring pulse build-up times. As a second step, the combined switch was simulated by introducing a time-dependent loss factor into Equation 2-26. A Boltzmann-curve proved to fit the FTIR switching behavior very well. The modified total decay rate of the cavity is then Equation 2-34
( )( )[ ]R
dtttAA
RC t
ARtFTIRlossesR 2)/)exp((1 0
211ln))1(ln( +−−=
−−−=′ −+
−
γ .
Figure 2.22 shows the results of the simulation. It can clearly be seen that the FTIR-switch delays the pulse emission substantially. A pump rate as high as r=1.05 is allowed for reaching a build-up time that is shorter than the 4 µs switching time of the FTIR.

37
This pump rate seems not to be substantially higher than the above mentioned r=1.03 for the pure FTIR-switch, but it does correspond to much higher pump-powers, since the laser threshold for passively Q-switched lasers is higher. This leads to shorter pulses with higher energy. Compared to the pure FTIR-switch, the pulse length dropped from 49 ns down to 3.5 ns and the pulse energy increased from 17 µJ up to 53 µJ.
1,00 1,05 1,100123456789
101112
Without FTIR
[µs]
Pump rate
TP=4µs
With FTIR
Pulse
bui
ld-u
p tim
e
Figure 2.22 Pulse build-up time vs. pump rate with and without FTIR. The initial transmission of the
absorber was T0=71%, the outputcoupling R=0.81.
Cr4+:YAG is not only suitable for Q-switching lasers around 1064 nm. It is even applicable for quasi-three-level lasers Nd: doped lasers down to 908 nm. The Equation 2-29 to Equation 2-33 predicted in this case correct pulse energies but too high peak power (about a factor 2 too high) and hence too short pulses. However, a correction factor was introduced and lasers were designed, leading to papers [V,VII].
2.3.5.1 Experimental results on a passively Q-switched quasi-three-level Nd:YLF laser:
In paper [VII], we presented a passively Q-switched quasi-three-level Nd:YLF laser, emitting at 908 nm. The laser setup is based on the cw version, described in chapter 2.3.3 but with a Cr4+:YAG saturable absorber inserted into the cavity. The unsaturated transmission of the disk was 94% at 946nm and it was antireflective coated at the same wavelength. Slight tilting of the disk shifted the reflectivity curve of the coating and minimized the losses at 908nm. However, the losses were still too high to reach threshold without chopping the pump. With a pump duty cycle of 25%, repetitive pulse trains (see Figure 2.23) could be observed. At maximum pump power, the pulses were 54 ns long with energy of 97 µJ. The average power was 304 mW for each pulse train.

38
0 2 4 6 8 100.0
0.1
0.2
0.3
0.4
0.5
0.6
phot
odio
de v
olta
ge U
pd[V
]
time t[ms]
Figure 2.23 Pulse train of the passively Q-switched Nd:YLF laser at 908 nm.
2.3.5.2 Experimental results on a passively Q-switched quasi-three-level Nd:YAG laser:
In paper [V], we presented a passively Q-switched quasi-three-level Nd:YAG laser, emitting at 946 nm. A high-brightness, fiber-coupled diode laser array served as the pump. It delivered a maximum output power of 8.67 W at 808 nm from a fiber with 250µm-core diameter and N.A. = 0.22. To match the effective pump spot radius of 150 µm, a simple, linear cavity design was sufficient to assure efficient lasing with good beam quality. An output coupler with 4.9% transmission showed the best performance. It resulted in a slope efficiency of 50% referring to the absorbed pump power and hence 2.75 W of output power. When a Brewster plate was inserted into the cavity to achieve polarized operation, the output power decreased to 2.27 W with a beam quality factor M2 ≤ 1.5. The largest problem with Cr4+:YAG as absorber in a 946 nm laser was found to be damage of the electron beam coatings (see chapter 2.2.4). Since quasi-three level lasers require small laser modes and low output coupling, the circulating intra-cavity energy density is very high. Hence, a compromise has to be made between low losses for low threshold, sufficiently high output coupling to reduce the energy density and low unsaturated absorber transmission to achieve high peak powers for efficient frequency conversion. Furthermore, the cavity length, which affects the pulse width and hence the peak power, has to be taken into account. We investigated these aspects experimentally and finally made the choice with an unsaturated absorber transmission of 94%, an output coupling of 4.9% and a cavity length of 4 cm. The peak as well as the average power was sufficiently high and no coating damage occurred at any time. In Figure 2.24, the pulse length, the pulse energy and the repetition frequency are shown as a function of average output power. The maximum average output power of 565 mW was obtained with 7.1 W of pump power. At this power level, the pulse energy was 15.8 µJ and the peak power was 0.66 kW. Subjecting the laser crystal to higher pump power levels resulted in degraded performance due to transverse multimode operation.

39
0 100 200 300 400 500 6000
5
10
15
20
25
30
Pulse Length
Pul
se L
engt
h [n
s]
Average Output Power [mW]
0
5
10
15
20
25
30
35
40
Pul
se R
epet
ition
Rat
e [k
Hz]
Repetition Rate
6
8
10
12
14
16
18
20
22
Pulse Energy
Pul
se E
nerg
y [µ
J]
Figure 2.24 Pulse length, pulse repetition rate and energy versus average output power for the passively
Q-switched laser at 946 nm.
2.4 Power scaling As pointed out in chapter 2.1, there is a quantum defect between the pump photon and the laser photon. The energy difference is converted into heat and induces a number of unwanted effects which limit power scaling. The following two chapters give a short introduction into some of these effects and show how to partly circumvent them.
2.4.1 Thermal effects End pumping with a small pump-spot gives rise to strong pointed heating with a temperature distribution and a gradient that is depending on the cooling symmetry and the material properties of the host crystal. Figure 2.25 shows a finite element simulation of a 3x3x3 mm YAG crystal with 5 W absorbed in a 200 µm diameter spot. The crystal was cooled from two sides and therefore shows a temperature distribution that is nearly centre-symmetric around the pump-spot, evolving into axis symmetry near the cooled faces. The maximum temperature was higher than 50°C and is in fact even higher, since the temperature dependent heat conductivity of YAG was not taken into account.

40
Figure 2.25 Finite element simulation of an end pumped Nd:YAG crystal.
Several effects result from such a temperature distribution. First to mention is thermal expansion, leading to mechanical stress. There is also induced birefringence, caused by the photoelastic effect, and thermal lensing, caused by the temperature dependence of the refractive index. Mechanical stress: The mechanical stress around a pump spot can be calculated from the thermal expansion coefficient and the thermal conductivity of a certain host crystal. Its tensile strength defines then the limiting pump power, where the probability of cracking gets too high. During the experiments (and expected from the material data in Table 2.1), it was found out that Nd:YLF was the most sensitive crystal. Cracks appeared already at absorbed pump power levels of around 5 W (250 µm focus). Better performed Nd:YVO, which cracked at around 15 W (200 µm focus). For Nd:YAG, the pump levels were too low for observing thermally induced damage. Induced birefringence: The strain, caused by the above-mentioned stress, induces small refractive index variations via the photoelastic effect. These variations lead in turn to birefringence effects which depolarize polarized light (see Figure 2.27). The depolarization is strongest between the axes, where the angle between the polarization pv and the refractive indices Φnv and rnv is 45º. It is weakest where pv is collinear to either Φnv or
rnv . The experimental verification is presented in Figure 2.27, where the white lobes show the depolarized light.

41
Thermally induced birefringence is not very important as long as the light does not have to be polarized. However, nonlinear crystals demand polarized light for optimum frequency conversion. Anisotropic gain media like Nd:YVO4 or Nd:YLF inherently emit polarized light but isotropic media like Nd:YAG need a polarization selecting optical element like a Brewster window in the cavity. The loss effect at a Brewster window was quantitatively investigated in a laser setup with 0.5at% doped Nd:YAG (coated for 946 nm), a 2% output coupler and a pump spot size of 200 µm. The losses were acceptable up to 10 W of pump power (0.1% losses) but reached at 15 W a level were beam degradation became strong (0.25% losses). These losses are especially critical in a intracavity doubled laser, where the total losses are supposed to be minimum for obtaining a strong internal field. There are several approaches to circumvent the negative effects of thermally induced birefringence. One indirect way is to implement a quarter-wave plate into the cavity, which partly corrects for the depolarization [28]. A direct approach is to reduce the stress by either increasing the pump spot diameter or decreasing the doping level. In fact, a decreased doping level leads not only to less stress but also to higher laser efficiency, since the weaker quenching effect implies a stronger laser transition. Thermal lensing: The refractive index has not only a stress dependent component but is also temperature dependent. For most materials, this coefficient is positive (see Table 2.1) but there are even materials like Nd:YLF where it is negative. In any case, the result is a center symmetric gradient of the refractive index, equipollent with a lens, being fairly ideal in the centre but inducing negative spherical aberrations in the outer region of the pump spot [29]. Innocenzi et al. derived a simple equation for calculating the focal length of such a thermal lens [30]:
Figure 2.27Main axes of the indicatrix; nΦ,r are
the azimutal and radial refractive index; p polarization of light (from [27]).
Figure 2.27Depolarization effect due to
thermally induced birefringence; the white lobes mean depolarization (from [27]).

42
Equation 2-35
−
= − lP
edTdnPK
f αω
ωωπ1
1)/(
2
,
with the heat conductivity Kω, the pump spot diameter ωP, the fraction of pump power that results into heating Pω, and the absorption coefficient α at the pump wavelength. For example, the above described laser setup would imply a thermal lens of 36 mm under lasing conditions. In fact, we measured experimentally a somewhat lower value of 30 mm, but the measurement method was not very precise. It consisted of building a plane-parallel cavity and extending the cavity length up to where lasing stopped. This cavity length was assumed to be the stability limit, leading to the desired value. However, it is reasonable that lasing stopped before the stability limit was reached, resulting in a too small focal length. A more precise method would consist of directly propagating a second laser beam through the crystal and observe its distortion after one pass. The measures to circumvent too strong thermal lensing are, in principle, the same as for the thermally induced birefringence, but there is an additional point to consider. It is the mentioned optical aberrations in the outer region of the pump spot, which implicates the need for good control over the laser mode. This is not so critical for quasi-three-level lasers, where reabsorption acts as a mode-cleanup, but mostly for high gain four-level lasers, where little pump in the wrong regions result in beam quality degradation. Up-conversion: Up-conversion itself is of course no thermal effect, but it can under certain conditions result in increased thermal loading of the laser crystal. For example, electrons in the upper laser level can absorb pump or laser photons and relax back via subsequent cascaded multiphonon processes. These processes are parasitic and convert additional pump light or circulating laser light into heat. Nd:YVO and Nd:YAG show low up-conversion efficiency but not Nd:YLF [31]. This effect is especially critical since it strongly increases under non-lasing conditions. It is a common observation to run a Nd:YLF laser reliably under lasing conditions, but fracture the laser rod as soon as lasing is interrupted. This is the reason, why the alignment of Nd:YLF lasers during this thesis work was usually performed by using a chopped pump. There are two effective methods to decrease up-conversion efficiency. One is to decrease the Nd doping level, since it is proportional to the up-conversion parameter [32]. This method was successfully employed in paper [VII]. Another method is to reduce the pump photon density, since it has strong influence on the up-conversion parameter as well. However, increasing the pump spot is practical with four-level lasers but difficult with quasi-three level lasers, since it increases reabsorption losses.
2.4.2 The amplifier It is under certain circumstances not possible to circumvent limitations, dictated by thermal effects or design necessities. In this situation, adding one or multiple amplifier stages is the only alternative to scale the power and pulse energy above the limits of one single laser oscillator. The simplest amplifier is a single pass through a pumped gain

43
crystal. More complex setups delivering higher gain include multi-pass and multi-stage arrangements. The most interesting parameters of an amplifier, gain and energy extraction, can be described in a simple formalism (see below). Other parameters like wavefront and pulse shape distortions or not easily accessible and disregarded during this thesis work. Reference [9] may serve as a tool for obtaining a deeper insight into these effects. Paper [IV] presented a rather simple double-pass amplifier for enhancing the pulses of a Q-switched NPRO. The following formalism was used to simulate this kind of amplification in order to get hold of requirements on the pump power, pump intensity and the gain material. It is taken from [2]: Analytic expressions for the gain G can be obtained when employing certain approximations. First, the events during the pulse amplification should be fast compared to the pumping rate, which means that pumping during the pulse duration can be neglected. If we additionally approximate the pulse shape to a rectangular profile and neglect losses due to scattering or absorption, then the rate equations from chapter 2.3.5 can be a applied and lead to (after integrating over the solution for the photon density)
Equation 2-36
−
+= 01exp1ln G
EE
EE
Gs
in
in
S ,
with the saturation energy density
γσυhEs = ,
the input energy per unit area ντ hE pin 0Φ= (Φ0 is the initial photon density),
and the small signal gain
( ) )exp(:exp:exp 021
0 lglElEh
G stst ==
= β
υσ ,
where Est is the stored energy, which can be calculated from Equation 2-20. For example, when taking the amplifier as presented in paper [IV], were we focused 6 W of pump power with a spot diameter of 200 µm into a Nd:YVO4 crystal, then
Equation 2-36 would give a gain of G=6.6 for 55 µJ signal pulses at 7.6 kHz repetition rate. This is in contrast to the experimentally obtained gain of G=2.6. The reason for this relatively strong discrepancy is mainly the fact that the signal beam diameter was 20% smaller than the pump beam diameter to prevent from wavefront distortions. This fact alone is responsible for decreased gain of about 40%. One other factor is the above mentioned approximation for rectangular pulse shapes, which results into to high gain (about 5%) and finally the above formalism was derived for plane waves but the profile of our signal beams were Gaussian shaped.

44
3 Nonlinear optics A major part of this thesis work dealt with frequency converting laser light by employing nonlinear optics. The following chapters give a short introduction into the formalism, resulting into precise equations for predicting e.g. conversion efficiencies and interaction bandwidths.
3.1 The coupled wave equations
The polarization Pv
of a dielectric medium caused by a propagating electromagnetic wave can be described with the susceptibility χ : Equation 3-1
...)3(0
)2(0
)1(0 EEEEEEP
vvvvvvvχεχεχε ++= .
The electrons oscillate harmonically, as long as the induced fields is not too strong. The real- and imaginary part of χ(1) characterize then the refractive index and absorption. However, if the intensity of the incoming electromagnetic beam is sufficiently high, as it is the case with laser beams, then one has to take higher orders of P
v into account,
inducing nonlinear “overtones”. The quadratic tensor χ(2) is then responsible for e.g. frequency doubling. This becomes clear when superimposing two electromagnetic waves Ei(z,t)=Eicos(ωit+kiz) (i=1,2) into Equation 3-1. As a result, one gets four terms for the quadratic polarization, oscillating with different frequencies: Equation 3-2
( ) ( )[ ]zktEP iiii+= ωχω 2cos22
21
2 (frequency doubling),
Equation 3-3 ( ) ( )[ ]zkktEEP )(cos 2121212
21+++=+ ωωχωω (sum-frequency mixing),
Equation 3-4 ( ) ( )[ ]zkktEEP )(cos 2121212
21−+−=− ωωχωω (difference-frequency mixing),
Equation 3-5 ( ) ( )2
22
12 EEPstationär += χ (optical rectification).
Equation 3-2 and Equation 3-3 shall know be treated in detail. The incoming wave(s) is (are) usually called fundamental(s) and the converted wave as the second harmonic (SH) and sum frequency (SF) wave. The treated nonlinearities have a purely electronic nature. The tensor χ(2) therefore obeys the permutation and Kleinmann symmetry. These symmetries allow a reduced description of the nonlinear polarization as a function of the EjEk matrix notation:

45
Equation 3-6
⋅
=
yx
zx
zy
z
y
x
z
y
x
EEEEEE
EEE
dddddddddddddddddd
KPPP
222
22
2
2
363534333231
262524232221
161514131211
0ε ,
where K ist the degeneracy factor, which takes the value ½ for SH generation (SHG) and 1 for SF generation (SFG). Symmetry properties of the specific crystal reduces the matrix dij even further, if the polarization for a specific beam incidence has to be calculated. The remaining components dij are then usually written as an effective coefficient deff. Reference 82 lists this coefficient for different crystal classes. For SHG, the nonlinear polarization finally becomes: Equation 3-7
( ) ( )202 ωεω EdP eff= .
Starting point for an analytical treatment of the SHG is the wave equation for lossless media, derived from the Maxwell equations: Equation 3-8
),(),(][ 2
2
02
2
0 trPt
trEt
rrrr
∂∂
=∂∂
−∆ µεµ ,
whith ε = ε0(1+χ(1)). A system of two coupled amplitude equations result when employing the according fourier component of the nonlinear polarization and using the “slowly vaying envelope approximation” z
EzE k ∂
∂∂∂ <<2
2 :
Equation 3-9
kzieff
kzieff
eEcn
di
zE
eEEcn
di
zE
∆
∆
⋅⋅−=∂∂
⋅⋅−=∂∂
2
2
2
2
2ω
ω
ω
ωωω
ω
ω
ω
,
with the phase difference ∆k = k2ω-2kω. The system can be decoupled and solved when assuming that the fundamental beam is not significantly depleted during the conversion. The intensity of the generated SH can then be calculated with
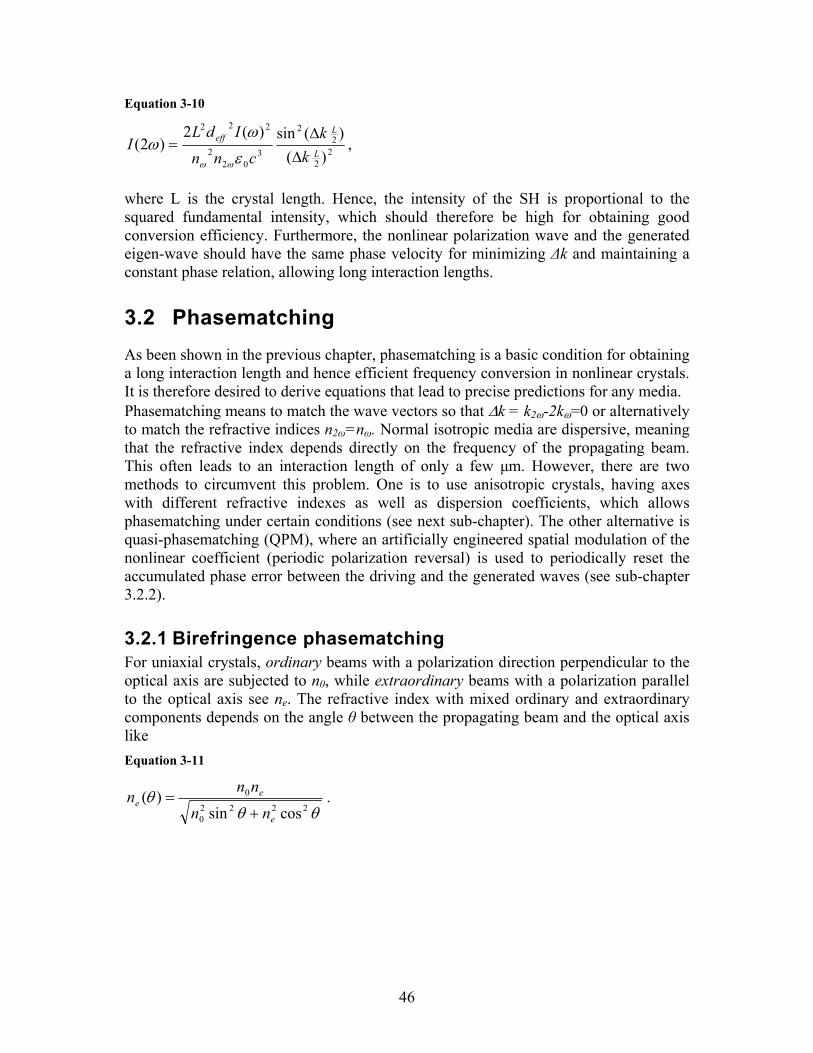
46
Equation 3-10
22
22
302
2
222
)()(sin)(2
)2(L
Leff
kk
cnn
IdLI
∆∆
=ε
ωω
ωω
,
where L is the crystal length. Hence, the intensity of the SH is proportional to the squared fundamental intensity, which should therefore be high for obtaining good conversion efficiency. Furthermore, the nonlinear polarization wave and the generated eigen-wave should have the same phase velocity for minimizing ∆k and maintaining a constant phase relation, allowing long interaction lengths.
3.2 Phasematching As been shown in the previous chapter, phasematching is a basic condition for obtaining a long interaction length and hence efficient frequency conversion in nonlinear crystals. It is therefore desired to derive equations that lead to precise predictions for any media. Phasematching means to match the wave vectors so that ∆k = k2ω-2kω=0 or alternatively to match the refractive indices n2ω=nω. Normal isotropic media are dispersive, meaning that the refractive index depends directly on the frequency of the propagating beam. This often leads to an interaction length of only a few µm. However, there are two methods to circumvent this problem. One is to use anisotropic crystals, having axes with different refractive indexes as well as dispersion coefficients, which allows phasematching under certain conditions (see next sub-chapter). The other alternative is quasi-phasematching (QPM), where an artificially engineered spatial modulation of the nonlinear coefficient (periodic polarization reversal) is used to periodically reset the accumulated phase error between the driving and the generated waves (see sub-chapter 3.2.2).
3.2.1 Birefringence phasematching For uniaxial crystals, ordinary beams with a polarization direction perpendicular to the optical axis are subjected to n0, while extraordinary beams with a polarization parallel to the optical axis see ne. The refractive index with mixed ordinary and extraordinary components depends on the angle θ between the propagating beam and the optical axis like Equation 3-11
θθθ
22220
0
cossin)(
e
ee
nn
nnn
+= .

47
ne(ω)
ne(2ω)no(ω)
no(2ω)
z, optical axis
θ
•AI
•AII
Figure 3.1
Figure 3.1 shows the index ellipsoid for a negatively uniaxial crystal (no>ne). The index for the fundamental is shown as a continuous line, while the index for the SH is dashed. A closer look at the ellipsoid quickly results in a solution for the phasematching problem. In point AI, both refractive indexes no(ω) and ne(2ω) are equal. This situation can be achieved by simply adjusting the angle θ (angle phasematching) and choosing the right polarization of the fundamental. In other words, the phasematching-angle θm gives the experimental angle of incidence on the nonlinear crystal (together with the azimuth angle φ). This task is usually done by the crystal manufacturer, who already cuts the sample faces with a specific angle. Besides the above example, it is also possible to use a fundamental beam with both ordinary and extraordinary components. The phasematching of this variant is realized in point AII. It is also called “Type II” phasematching (opposed to the above “Type I” phasematching). The phasematching condition for negative uniaxial crystals is then Type I: ne(2ω,θm) = no(ω) Type II: ne(2ω,θm) = ½ (ne(ω,θm)+no(ω)) It should be mentioned, that the example from Figure 3.1 shows a case where 0º≠ θ≠ 90º, which is called “critical phasematching” (opposed to “non-critical phasematching”, where θ=0º or θ=90º). It means that there is a “walk-off angle” ρ between the pointing vector of the ordinary fundamental and the extraordinary harmonic wave. This effect decreases the interactive region and leads to a degraded frequency conversion. It can be calculated to

48
Equation 3-12
)2sin(112
)tan( 22,
22,
2, θρ
ωω
ω
−=
oa
o
nnn
.
Walk-off free phasematching is given for non-critical phasematching, but this is unfortunately only possible for very few crystals at specific fundamental wavelengths and temperatures. Opposed to uniaxial crystals, the situation in biaxial crystals where the three crystal axis all have different refractive indices is more complex and shall not be treated here. Hobden [36] covered this crystal type for different crystal classes. However, a simplification is possible, if the propagation direction of the fundamental lies in the direction of the principal axis (x, y or z) of a biaxial crystal. The problem then reduces to the treatment for an uniaxial crystal.
3.2.2 Quasi-phasematching
x
z
y
Figure 3.2 Geometry of the periodic polarization reversal in PPKTP.
As mentioned above for QPM, an artificially engineered spatial modulation of the nonlinear coefficient (periodic polarization reversal, see Figure 3.2) is used to periodically reset the accumulated phase error between the driving and the generated waves [37]. The wave-vector mismatch for the mth order QPM second harmonic generation (SHG) collinear process is expressed as Equation 3-13
,22 GQ kkkk −−=∆ ωω with the grating vector Equation 3-14
,2Λ
=πmGk
where the period Λ is twice the coherence length for the interacting waves. Manufacturing a period of 9 µm for first order (m=1) SHG at 1064 nm is state of the art for KTP as well as LiNbO3. For shorter wavelengths, dispersion increases rapidly and the coherence lengths become on the order of a few µm. Let us, for the sake of simplicity, assume that the fabricated structure is ideal (the influence of imperfections is

49
treated in [38], [39]) and has an optimum duty cycle for the polarization reversal. The effective nonlinear coefficient deff is then reduced by the Fourier amplitude of the mth spatial harmonic of this modulation:
ijeff dm
dπ
2= .
There are several advantages of QPM over traditional birefringence phasematching. By the use of noncritical phase-matching, walk-off can be avoided and hence can longer crystals be used without beam quality degradation. Furthermore, a wider transparency range can be used, as the full transmission range is available by choosing the appropriate QPM grating. And finally, the crystal axis with the highest nonlinear coefficient can be phase-matched, leading to drastically enhanced conversion efficiency in many cases.
3.2.3 Acceptance bandwidth Even if optimum phasematching is guaranteed, frequency conversion can be affected by acceptance bandwidth limitations. These bandwidths origin from the temperature-, angular-, as well as frequency dependent refractive index of the nonlinear crystal. Equation 3-10 gave for plane waves: Equation 3-15
2
2
2 )2/()2/(sin
kLkLP
∆∆
∝ω .
The dependency of the phasematching on the above mentioned parameters can be written as a Taylor-series: Equation 3-16
νν
θθ
∆∂∆∂
+∆∂∆∂
+∆∂∆∂
+∆≅∆)()()()0( kkT
Tkkk ,
where ∆k(0)=0 should be obtained for optimum phasematching. The bandwidths are defined as the full width on half height (FWHM) of the following sinc functions:
11 ]/)([772.1 −=
− ∂∆∂=∆pmtTTklT π ,
11 ]/)([772.1 −=
− ∂∆∂=∆pm
kl θθθπθ , 11 ]/)([772.1 −=
− ∂∆∂=∆pm
kl νννπν .
The specific derivations for a number of phasematching variants are listed in [40]. In this thesis work, we mainly focused on bandwidth limitations of quasi phasematched periodically poled KTiOPO4 (PPKTP) crystals. For a perfectly uniform grating, the

50
wavelength acceptance bandwidth is given by [41]
Equation 3-17 1
214429.0
−
∂∂
−∂∂
+−
=∆SH
SH
F
F
F
FSHFFWHM
nnnnl λλλλ
λ .
Besides ∆λ, the temperature acceptance bandwidth is another important variable in our experiments. It has to be large enough to overcome the effect raised by temperature gradients in the crystal and it determines the requirements for the stability of the temperature controller. With a fixed wavelength, it can be expressed as [41] Equation 3-18
1
)(4429.0
00
−
−+
∂∂
−∂∂
=∆ FSHT
F
T
SHFFWHM nn
Tn
Tn
lT α
λ.
The angular acceptance bandwidth, ∆φ, is important when focusing with a large
numerical aperture or when employing a double pass scheme where the angle formed between the forward and backward propagating beam is non-zero. When the PPKTP sample is rotated around the z-axis away from ideal non-critical phase-matching, Fejer et al [41] determined:
Equation 3-19
ϕϕ cos2
772.12ln
n
F
SHG Λ=∆ .
ϕ is here defined as the angle between the wave vector for the incident fundamental beam and the pseudo-momentum vector associated with the periodic lamellar domains.
3.3 Nonlinear optics with Gaussian beams The equation for calculating the conversion efficiency for frequency doubling plane waves was introduced in chapter 3.1. An appropriate equivalent for Gaussian beams for Type I phasematching in uniaxial crystals was derived by Boyd and Kleinman [42]. Zondy [43] extended the theory for Type II. The intensively used equation from Boyd and Kleinman is given by Equation 3-20
leinSHG eBhPKlkP α
ω µξκσ −= ),,,,(2 , with
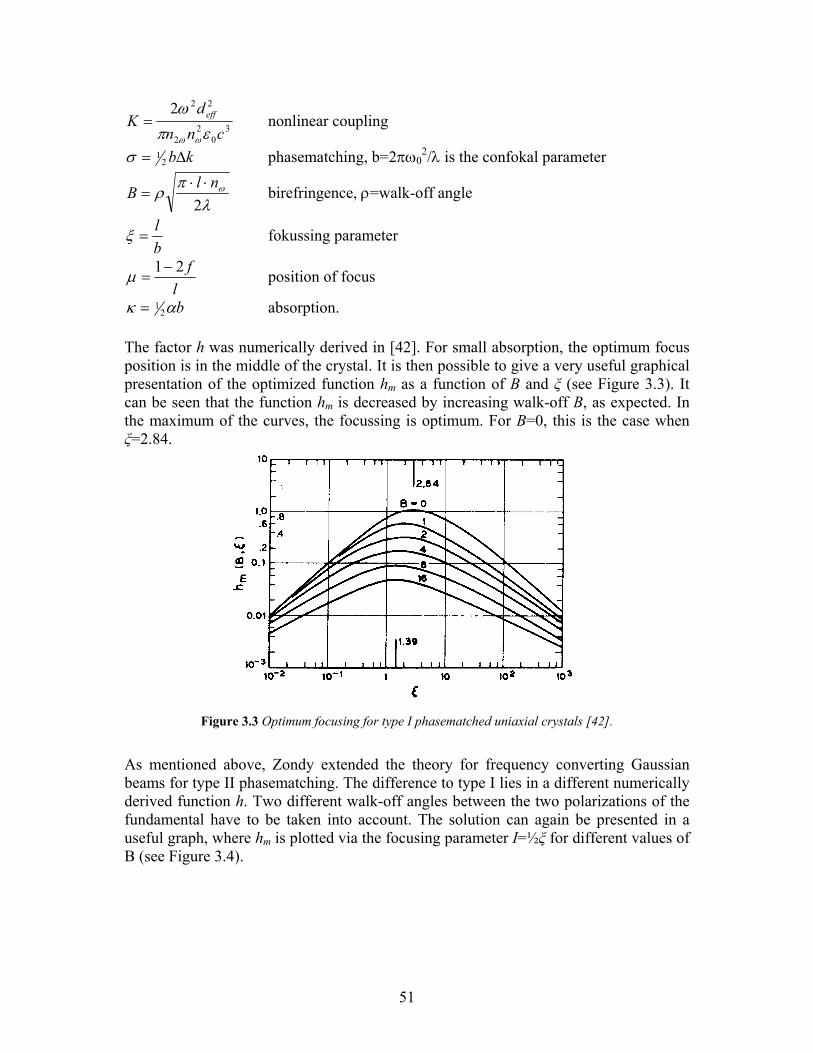
51
30
22
222cnn
dK eff
επω
ωω
= nonlinear coupling
kb∆= 21σ phasematching, b=2πω0
2/λ is the confokal parameter
λπ
ρ ω
2nl
B⋅⋅
= birefringence, ρ=walk-off angle
bl
=ξ fokussing parameter
lf21−
=µ position of focus
bακ 21= absorption.
The factor h was numerically derived in [42]. For small absorption, the optimum focus position is in the middle of the crystal. It is then possible to give a very useful graphical presentation of the optimized function hm as a function of B and ξ (see Figure 3.3). It can be seen that the function hm is decreased by increasing walk-off B, as expected. In the maximum of the curves, the focussing is optimum. For B=0, this is the case when ξ=2.84.
Figure 3.3 Optimum focusing for type I phasematched uniaxial crystals [42].
As mentioned above, Zondy extended the theory for frequency converting Gaussian beams for type II phasematching. The difference to type I lies in a different numerically derived function h. Two different walk-off angles between the two polarizations of the fundamental have to be taken into account. The solution can again be presented in a useful graph, where hm is plotted via the focusing parameter I=½ξ for different values of B (see Figure 3.4).

52
Figure 3.4 Optimum focusing for type II phasematched uniaxial crystals [43].
As can be seen in the figure, hm at B=0 complies with the solution for type I phasematching, but it is quite different for cases with walk-off. Herewith, all theoretical tools are given to optimally design a frequency conversion arrangement. When all the material parameters of the nonlinear crystal is known, it is possible to precisely predict the conversion efficiency for a specific nonlinear process and to recommend an optimum focusing parameter.
3.4 Nonlinear crystals The choice of a suitable nonlinear crystal for a specific application is essential for reaching high conversion efficiencies. The following list gives helpful criteria:
• It should be possible to phasematch the nonlinear crystal for a specific interaction, either via birefringence or quasi-phasematching.
• The effective nonlinear coefficient deff should be as high as possible, since it affects the nonlinear coupling and therefore the harmonic output quadratically. However, in certain applications, it has decreased importance, for example due to very high fundamental energy density.
• The acceptance bandwidths should be as large as possible, so that the impact of temperature, wavelength and angular deviation on the harmonic output is as small as possible.
• The walk-off angle should be as small as possible to prevent from harmonic beam degradation and to allow long interaction lengths.
• The damage threshold regarding high energy densities as well as strong thermal loading should be as high as possible. Mechanical fracture, photorefractive effects and grey-tracking [44] are possible limiting causes.
• The absorption at the fundamental as well as harmonic wavelengths should be as small as possible to prevent from strong thermal loading as well as losses. This

53
factor limits the amount of applicable crystals especially in the deep blue and the UV region.
• The chemical as well as mechanical stability should be high. A low tensile strength, hygroscopic behavior and domain instability can complicate handling.
• The cost-efficiency and the producibility should be good to guarantee feasible implementation into a potential product.
No nonlinear crystal combines all the above mentioned criteria in an optimum manner. It is rather necessary to find the right crystal for each application. Table 3.1 summarizes the materials, used during this thesis work. KTP
(1064nm) PPKTP (1064nm)
LBO (946nm)
BBO (532nm)
KNbO3 (946nm)
Lattice structure Biax. - Biax. Uniax. Biax. Transparency [nm]
350-4500 - 160-2600 185-2600 400-4500
Damage threshold [Jcm-2]
15 - 25 13 1.7
Type II, eoe I, ooo I, ooe I, ooe I, ooe θ, φ 90, 23.5 0, 0 90, 19.3 47.6, 0 90, 60 deff [pm/V] 3.3 10.5 0.81 1.04 10.2 walk-off [mrad] 3.2 0 11.3 85 46.7 ∆φ·l [mrad cm] 62.6 - 8.2 0.3 ∆θ·l [mrad cm] 14.1 172 0.27 - 0.9 ∆T·l [ºC cm] 25.4 5.9 7.3 5.4 0.5 ∆λ·l [nm cm] 0.9 0.27 4.0 ~0.7 0.33 n2ω 1.86 1.86 1.61 1.61 2.27
Table 3.1 Data on selected nonlinear crystals.
4 Frequency conversion schemes One goal of this thesis work was to realize novel frequency conversion schemes. This chapter shows the results of applying the theoretical and experimental background, presented in chapter 2 and 3. It describes the work that was published in paper [II-VIII] but also presents unpublished experiments, wherever it is complementary.
4.1 Single and multi-pass frequency conversion For many years birefringent phasematching with angle tuning was used for nonlinear frequency conversion. However, this technique only allows utilizing a limited number of nonlinear coefficients. For example, the large d33 in LiNbO3 and KTiOPO4 are not available with birefringent phasematching. As a consequence, high intensities were needed to achieve efficient frequency conversion. This was either achieved by pulsing the laser (chapter 4.4), coupling single frequency radiation into an external cavity

54
(chapter 4.2), or placing the nonlinear crystal directly into the laser cavity (chapter 4.3). All these techniques have their drawbacks: Only a limited number of applications are addressed with pulsed lasers. Employing an external cavity usually requires complicated electronics and the intra-cavity approach suffers in most cases from stability problems. By the recent introduction of quasi-phase-matching (chapter 3.2.2) in bulk frequency conversion, some of these difficulties have been reduced. By use of noncritical phasematching, walk-off can be avoided and hence longer interaction lengths used without beam quality degradation. Additionally, the crystal axis with the highest nonlinear coefficient can be phase-matched, leading to drastically enhanced conversion efficiency in many cases. The task was therefore to investigate, if a non-resonant conversion scheme could compete with resonant schemes in terms of efficiency (paper VI). This was realized by employing single as well as multi-pass schemes (see Figure 4.1). All limiting factors like acceptance bandwidth problems, beam distortion effects and parasitic losses as well as thermal effects were experimentally addressed and compared with theoretical predictions.
NPRO PPKTPFI BS
λ/4
2ω
λ/2
Figure 4.1 Schematic sketch of the set-up for frequency doubling the output of a NPRO in a quadruple pass scheme through PPKTP. The wave-plates are used to linearize the polarization of the fundamental
beam, before propagating through the Faraday isolator FI and the beam splitter BS.
4.1.1 Acceptance bandwidths Chapter 3.2.3 supplies the equations for calculating temperature, wavelength as well as angular bandwidths for PPKTP. They can directly be applied to single pass frequency conversion, but need an addition for multi-pass schemes: When acceptance bandwidths are crucial, N-pass schemes through a short crystal have advantages over a single pass through a long crystal. This is not the case for plane waves, but for diffraction limited beams, tighter focusing within the Boyd-Kleinman limit gives advantages. The efficiency increases similar to the plane wave case with N2l when the beam is reimaged with the same spot size, while the acceptance bandwidth scales with (Nl)-1 only. A single pass scheme shows the same bandwidth behavior, but the efficiency scales only with Nl. However, it has to be taken into account that multi-pass schemes add complexity to an optical setup, which has to be balanced with the benefits of increased bandwidth. The experimental results, presented in paper [VI], help to take this decision. With a given pump linewidth and pump power, it is possible to predict the conversion efficiency of certain schemes and therefore to choose the most appropriate one. Table 4.1 shows the results when using a NPRO (see 2.3.4) as pump source at 1064 nm and

55
employing a single, double and quadruple pass through a 0.9, 2 and 3 cm long PPKTP in the small signal regime. It can be seen that there is a rather good agreement between the theoretically predicted acceptance bandwidths and the measured values. However, there is a large difference between the “ideal” conversion efficiency (calculated from chapter 3.3) and the experiment. This is because there is absorption (chapter 4.1.3), interference (chapter 4.1.2), as well as pump depletion effects to be taken into account for the “real” situation, leading to ηtheo. L
[cm] N ∆Texp
[K] ∆Ttheo [K]
∆λexp [nm]
∆λtheo [nm]
∆ϕexp [deg]
∆ϕtheo [deg]
ηexp [% W-1]
ηtheo, ideal [% W-1]
ηtheo [% W-1]
0.9 1 6.02 6.60 0.30 4.1 3.3 0.74 0.74 0.74 2 2.81 3.30 0.15 2.39 2.96 2.75 4 1.06 1.65 0.075 7.19 11.84 9.54
2 1 2.39 2.97 0.13 2.6 2.3 2.10 2.10 2.10 2 1.05 1.49 0.067 7.45 8.40 7.50 4 0.49 0.74 0.033 0.034 21.53 33.60 25.44
3 1 1.79 1.98 0.090 1.7 1.9 2.86 2.86 2.86 2 0.77 0.99 0.048 0.045 9.70 11.44 9.50 4 0.43 0.49 0.027 0.022 27.31 45.76 26.26
Table 4.1 Experimental and theoretical bandwidths for samples 2, 3 and 4 in single, double and quadruple pass scheme, together with the measured small signal conversion efficiencies. For the ideal
efficiency ηtheo, ideal we only multiplied with N. For the real case ηtheo, we regarded absorption, interference, as well as pump depletion effects.
The acceptance bandwidths even of the quadruple pass through the 3 cm long PPKTP did not impact on the frequency doubling of the NPRO, which has a much narrower linewidth. However, for pump lasers with broad linewidth, one can see a clear relation between the ratio of the incident pump linewidth to crystal acceptance (normalized pump linewidth), and the conversion efficiency. We verified the theory presented in [45] by frequency doubling a multimode Nd:YAG laser (linewidth ∆λ = 0.3 nm) in several SHG schemes with different acceptance bandwidths. The experimental results fit the theory quite well, as shown in Figure 4.2. Taking a temperature tuning curve is an even better way to understand the effect of a normalized pump linewidth that is close to 1 or even larger. For values much smaller than 1, one would expect a sinc2 dependency of the second harmonic output power on the phasematching temperature (see chapter 3.2). However, this behavior is “smeared out” when using pump lasers with broad linewidth. Figure 4.3 shows the experimental evidence for this effect. The two curves were taken with a double pass scheme through the 2 cm long PPKTP. We generated the same SH power (800 mW) when using 7.3 W of multi-mode pump power in the first case and 3.4 W of single frequency pump power in the second case. From this, it becomes obvious that the first thing to consider when designing for a high SH conversion efficiency in a multi-pass experiment would be the normalized pump line width.

56
0 1 2 3 4 5 6 70,0
0,5
1,0
1,5
2,0
Nor
mal
ized
SH
pow
er
Normalized pump linewidth
Simulation Experiment
Figure 4.2 SH power, generated with a multi-mode pump as a function of pump linewidth. The output power is normalized by the corresponding single-mode case, and the linewidth is normalized by the
acceptance bandwidth of the crystal. The solid line is obtained from[45], the squares is the experimental data, obtained from various single and multi-pass schemes.
22 24 26 28 30 32 34 36 38 400
1
2
3
4
5
6
7
8
Nor
mal
ized
con
vers
ion
effic
ienc
y [%
/W]
Temperature [oC]
Single mode laser Multi mode laser
Figure 4.3 Experimental temperature tuning curves under multi-mode and single-mode pumping in the
large signal regime. The generated SH power is 0.8 W.
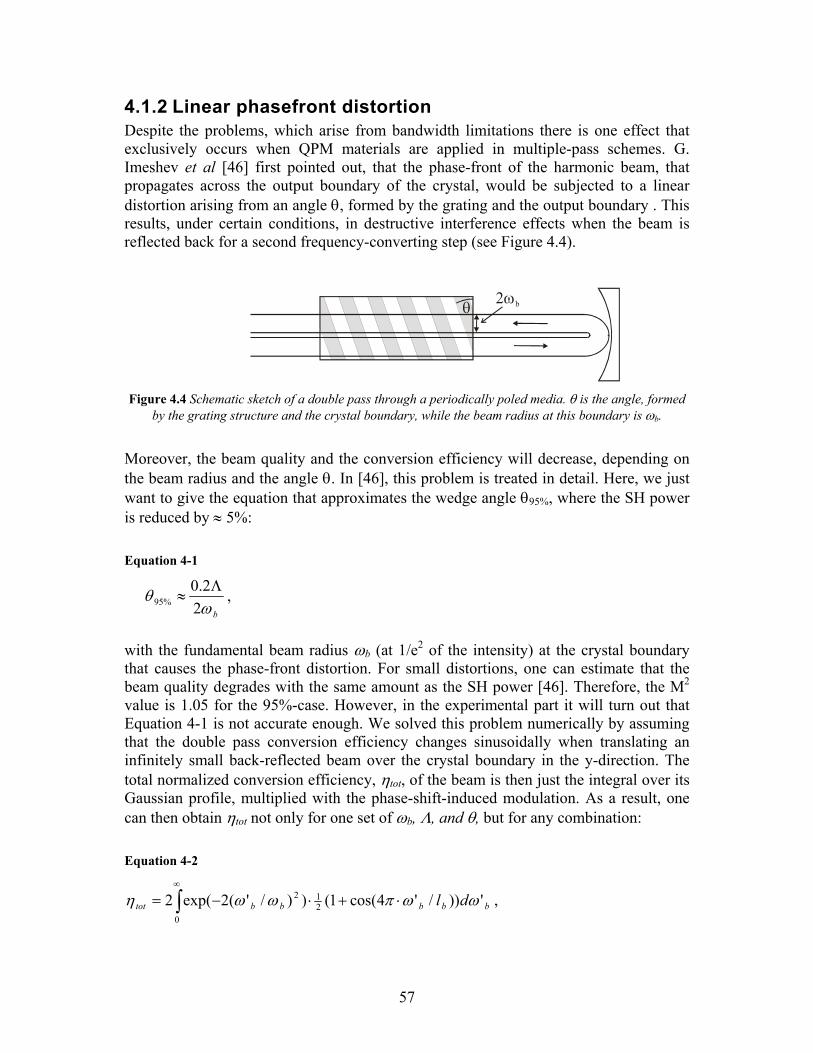
57
4.1.2 Linear phasefront distortion Despite the problems, which arise from bandwidth limitations there is one effect that exclusively occurs when QPM materials are applied in multiple-pass schemes. G. Imeshev et al [46] first pointed out, that the phase-front of the harmonic beam, that propagates across the output boundary of the crystal, would be subjected to a linear distortion arising from an angle θ, formed by the grating and the output boundary . This results, under certain conditions, in destructive interference effects when the beam is reflected back for a second frequency-converting step (see Figure 4.4).
θ 2ωb
Figure 4.4 Schematic sketch of a double pass through a periodically poled media. θ is the angle, formed
by the grating structure and the crystal boundary, while the beam radius at this boundary is ωb.
Moreover, the beam quality and the conversion efficiency will decrease, depending on the beam radius and the angle θ. In [46], this problem is treated in detail. Here, we just want to give the equation that approximates the wedge angle θ95%, where the SH power is reduced by ≈ 5%: Equation 4-1
bωθ
22.0
%95Λ
≈ ,
with the fundamental beam radius ωb (at 1/e2 of the intensity) at the crystal boundary that causes the phase-front distortion. For small distortions, one can estimate that the beam quality degrades with the same amount as the SH power [46]. Therefore, the M2 value is 1.05 for the 95%-case. However, in the experimental part it will turn out that Equation 4-1 is not accurate enough. We solved this problem numerically by assuming that the double pass conversion efficiency changes sinusoidally when translating an infinitely small back-reflected beam over the crystal boundary in the y-direction. The total normalized conversion efficiency, ηtot, of the beam is then just the integral over its Gaussian profile, multiplied with the phase-shift-induced modulation. As a result, one can then obtain ηtot not only for one set of ωb, Λ, and θ, but for any combination: Equation 4-2
∫∞
⋅+⋅−=0
212 '))/'4cos(1())/'(2exp(2 bbbbbtot dl ωωπωωη ,

58
with lb = Λ/sin(θ) and the integration variable ω´b. The numerical solution leads to the curve in Figure 4.5. Here, the normalized conversion efficiency is plotted against the normalized beam radius ωb/lb.
0.00 0.05 0.10 0.15 0.200.70
0.75
0.80
0.85
0.90
0.95
1.00
Con
vers
ion
effic
ienc
yη to
t
Normalized beam radius ωb/lb
0.00 0.05 0.10 0.15 0.200.70
0.75
0.80
0.85
0.90
0.95
1.00
Con
vers
ion
effic
ienc
yη to
t
Normalized beam radius ωb/lb
Figure 4.5 The reduction of the conversion efficiency down to ηtot, when employing a normalized beam radius ωb / lb to a wedged PPKTP. The crosses show the experimental data. The circle is calculated from
Equation 4-1 and the curve is obtained from Equation 4-2.
To verify Equation 4-2 experimentally, we first needed to determine the wedge angles θ. This was done by performing a double pass through the crystals while observing the SH-power modulation that occurs when translating the back-reflected beam in the y-direction over the whole crystal aperture. From the number of maxima and minima it was possible to deduce the wedge angles. To investigate the influence of ωb on the conversion efficiency, we translated the PPKTP in the x-direction, instead of changing the focusing strength. Then we compared the ratio of single-pass and double-pass SH power. Moving the crystal closer to the reflecting mirror results in a larger ωb and hence a larger phase-mismatched part of the beam. The results are added to the theoretical prediction in Figure 4.5. Even if Equation 4-2 describes the experimental results better than Equation 4-1, the discrepancy is still quite large. One reason for this behavior may be that we also changed the waist location when translating the PPKTP. Therefore, optimum refocusing is no longer guaranteed. Another reason lies in the plane wave nature of Equation 4-2. It is an adequate but not perfect simplification in our case.

59
4.1.3 Absorption and thermal effects PPKTP has substantial absorption in the green, as well as in the IR spectral region (we measured α ≈ 0.041 cm-1 at 532 nm and α < 0.006 cm-1 at 1064 nm for our samples). Together with rather low heat conductivity, this leads to a noticeable temperature perturbation already at modest signal power. Temperature, wavelength and angular acceptance bandwidths are then inevitably affected. Indeed, the phase-matching curves differ substantially from the small signal one already when scaling the NPRO-output power up to 1.34 W (see Figure 4.6 and Figure 4.7). At higher power (from around 2.3 W), we could even observe hysteresis effects for the temperature phase-matching curve, which means, that the temperature-tuning curve differed slightly depending on if the scan was done by increasing or decreasing the temperature. For example, with a pump power of 3.4 W and a quadruple pass through the 3 cm sample, the position of the steep lower flank of the temperature tuning was 0.5°C higher when tuning from lower to higher temperature, compared to the one obtained when tuning in the opposite direction.
30,5 31,0 31,5 32,0 32,5 33,0 33,5 34,0 34,5 35,00
5
10
15
20
25
Nor
mal
ized
con
vers
ion
effic
ienc
y [%
/W]
Temperature [oC]
Pump power 0,39W Pump power 1,34W Pump power 2,33W Pump power 3,35W
Figure 4.6 Experimental temperature tuning curves for a quadruple pass through a 3 cm long PPKTP with a single mode laser as pump source. The line with squares is for the small signal case, the other
lines are for 1.34, 2.33 and 3.35 W, respectively.

60
-4 -2 0 2 4 6 8 10 12 14 16 18 200
2
4
6
8
10
12
14
16
18
20
22
Conv
ersio
n ef
ficie
ncy
[%]
Relative frequency [GHz]
Pump power 0.39 W Pump power 1.34 W Pump power 2.33 W
Figure 4.7 Experimental wavelength tuning curves for a quadruple pass through a 2 cm long PPKTP with a single-mode laser as pump source. The line with squares is for the small signal case, the other
lines are for 1.34 and 2.33 W, respectively.
We have plotted the degradation of the normalized conversion efficiency for the different schemes in Figure 4.8. Although it seems that the normalized efficiency for the quadruple pass schemes flattens out at higher pump powers, it should be clear that the hysteresis effect decreases the practicality, meaning that temperature control for stable output power gets more and more difficult. However, we did not exceed this limit with the powers employed in our experiments.
0,0 0,5 1,0 1,5 2,0 2,5 3,0 3,50
5
10
15
20
25
30
Nor
mal
ized
con
vers
ion
effic
ienc
y [%
/W]
Incident pump power [W]
Quadruple pass with 3 cm crystal Quadruple pass with 2 cm crystal Double pass with 3 cm crystal
Figure 4.8 Degradation of the normalized conversion efficiency vs. single mode pump power for different
schemes.

61
4.1.4 Performance of selected schemes To the best of our knowledge we have been able to generate the highest conversion efficiency ever reported for a non-resonant SHG scheme using a cw laser in a bulk nonlinear crystal. Figure 4.9 shows the slope efficiency of the SH output versus the incident pump power. The normalized efficiency for a quadruple pass through a 3 cm long PPKTP was as high as 27.3% W-1 for the small signal regime and 13.4% W-1 for a maximum pump power of 3.4 W, equivalent to 1.55 W of SH output power. The setup was reliably running over hours without showing a power drop or beam quality degradation. These results definitely show that a non-resonant multi-pass scheme is a competitor to resonant schemes. However, the situation is different for the multi-mode pump laser. The measured maximum conversion efficiencies are 4.9% W-1 for the small signal regime but 2.5% W-1 for 8 W of pump power, equivalent to 1.61 W of SH output. These results were obtained with a triple pass through a 0.5 cm long PPKTP. In the theory we found it not useful to employ a scheme with a larger normalized linewidth than 4. Therefore, one would expect some improvement for a scheme with up to 7 passes though the 0.5 cm long PPKTP. An estimation that regards the effects of the normalized pump linewidth as well as parasitic absorption gives a value of 14% W-1 for the small signal regime. However, this experiment was ruled out due to the limited aperture size of the PPKTP. Based on the 946 nm laser, described in chapter 2.3.3, we finally realized a double pass scheme through a 1 cm long PPKTP for getting blue output. Here, 2.5 W of fundamental power resulted in 190 mW of blue power, corresponding to 3% W-1. However, the PPKTP suffered from grey tracking effects, resulting in noticeable power drop within several hours. These multi-pass schemes are of course not restricted to SHG processes. They would also be beneficial for SFG, DFG as well as OPA and OPG interactions. For example, a simulation shows that it should be possible to reach extremely low OPO thresholds. With a quadruple pass through a suitable 3 cm long PPKTP with resonating only a signal wavelength of 1570 µm, one would expect a threshold of 0.5 W single frequency pump power at 1064 nm in comparison with 5 W for a single pass.

62
0,0 0,5 1,0 1,5 2,0 2,5 3,0 3,50
200
400
600
800
1000
1200
1400
1600
SH p
ower
[mW
]
Incident pump power [W]
Quadruple pass with 3 cm crystal Quadruple pass with 2 cm crystal Double pass with 3 cm crystal
Figure 4.9 Output power slope efficiency for single mode pump in different schemes.
4.2 Frequency conversion in an external cavity Frequency conversion in an external cavity is chosen whenever enhanced light intensity is needed but intracavity nonlinear processes are not possible. This can for example be the case for monolithic lasers, gas lasers or diode lasers. However, even if very high efficiencies up to 90% can be reached (see for example [47], [48]) with this approach, one has to accept certain drawbacks. For efficient coupling of the fundamental wave into the external cavity, it is needed to lock its resonance frequency to the light frequency, which is usually done by controlling the length of the cavity with complicated feedback electronics (see for example [49], [50]). This kind of setup did not fit into the work theme of this thesis and it was therefore a concern to find a novel external cavity approach, which combines the advantage of high conversion efficiency with compactness and simplicity. A solution to this problem was found when reading the article of Kozlovsky et al.. They used a NPRO as an ultra stable single frequency laser source an employed a monolithic MgO:LiNbO3 external cavity. Even their approach needed electronic feedback circuitry to lock the cavity length, but it brought up the idea that it may be possible to design a monolithic or semi-monolithic external cavity that is stable enough for not needing fast electronic, but only slow thermal stabilization. To reach this kind of insensitivity, one would need a cavity with a resonance peak that is substantially broader than the short-term frequency fluctuations of the system. This means to employ a cavity with low finesse and large free spectral range or, in other words, a short cavity with high non-parasitic losses. To build a short cavity is technically no problem, but simultaneously maintaining high losses is not, since these losses should preferably be induced by frequency conversion and not by parasitic effects like absorption or coating losses. As shown in chapter 3.3, conversion efficiency is proportional to the nonlinear crystal length. Simulations showed that it is

63
therefore not enough to employ a crystal with a high nonlinear coefficient but also employ a fundamental laser source with high output power as well as a minimized cavity mode to increase conversion efficiency even further. A first premature but successful experiment shall now be presented.
4.2.1 Impedance matching The problem of coupling an electromagnetic wave into an external cavity is very similar to the problem of coupling electrical energy in an electrical resonant circuit, which is why both a analogously called “impedance matching”. An external cavity usually has a certain transmission T of the first mirror and certain losses L, composed of absorption, coating losses and nonlinear losses. Maximizing the incoupled light amplitude is equipollent with minimizing the reflected amplitude at the first mirror. The classical interference theory gives a quick answer to this problem [21][52] and recommends to equalize T=L for getting zero reflected amplitude. Let us, for example take a 3 mm long cavity, including a 2.3 mm long PPKTP crystal, phasematched for first order SHG at 1064 nm. Employing one flat mirror and one concave mirror with ROC=-25 mm results in a mode radius of 48 µm. Taking a fundamental power of 1.6 W into account, one would finally get the desired transmission T=3.3%. This cavity has a resonance peak with 30 GHz at FWHM, which is large compared to the frequency drift of <1MHz/min of the NPRO.
4.2.2 Performance of a ultra-short monolithic external cavity We realized the above simulated external resonator but had to use a first mirror with T=5% instead of the optimum T=3.3%. Additionally, we only had mirrors that transmitted the harmonic light, allowing no internal double pass. Simulations show that the expected fundamental input to harmonic output ratio should be increased to 2 with this arrangement [53]. The PPKTP was clamped on a copper block, which was glued to a temperature controlled Peltier element. The two mirrors were glued to the block to enhance stability. The NPRO was optically isolated with a Faraday isolator and a mirror and lens arrangement provided modematching of the fundamental beam into the external cavity. In the experiment, it turned out that the inherent stability of this cavity was indeed sufficient. Resonant SHG could be observed for minutes and even longer with only slight adjustment of the cavity temperature. It has to be mentioned that the setup was far from optimized. Improvement of the thermal stability should be possible and even the mechanical stability could be enhanced by replacing the mirror arrangement with a specially coated and polished PPKTP. Finally, 705 mW of SH light was measured, distributed in two beams. This value is very close to the theoretically predicted power of 800 mW, being a sign of good modematching and low parasitic losses. Monolithic external resonators where employed in multiple SHG and SFG configurations ([54], [55], [56]), but all of them needed high bandwidth stabilization either of the external cavity or the laser source. To the best of my knowledge, this is the first demonstration of frequency doubling in an external cavity at these power levels without fast stabilization loops. Reliable operation over minutes was demonstrated, extendable to many hours by employing better thermal isolation and probably active temperature control.

64
4.3 Intracavity frequency conversion Intracavity frequency conversion is the easiest way to achieve high conversion efficiency with low power cw lasers. The principle consists of taking advantage of the strong internal field in a laser cavity and place a nonlinear crystal directly inside. The power that is transferred to the harmonic wave is then depending on the ratio between parasitic losses (absorption, coating losses and scattering) and nonlinear losses. It is therefore desired to close the cavity with HR coatings at the fundamental wavelength and use good AR coatings for the internal optical elements. Doing so, efficiencies as high as 30 % have been reported regarding laser diode pump and harmonic power [57][58][59][60][61][62].
4.3.1 Amplitude stability and longitudinal mode dynamics Although intracavity doubled lasers are highly efficient and can be designed in very compact geometries, even fitting into a laser pointer, they commonly suffer from fast amplitude noise, so called “green noise” or “blue noise” [63]. These fluctuations origin from the longitudinal mode coupling in the frequency doubling process. If good amplitude stability is desired, then certain measures have to be considered for decoupling this system. One approach is to force the laser into single mode operation, which removes the coupling problems completely. Another approach is to increase the amount of longitudinal modes to a relatively large number, which produces a very complex permutation symmetry that is insensitive to a small change in the mode composition. Both approaches have successfully been employed in systems that are commercially available. However, they are relatively complex and expensive, while other compact and cost effective solutions lack stability. It was therefore a strong concern during this thesis work to find a solution that is both compact and stable. Deeper investigations on the green noise problem show that it is a manifestation of chaotic nonlinear behavior for certain parameter values [64] and that it is possible to stabilize a system by tuning these parameters [65][66][67][68].
4.3.2 Performance of green and blue lasers with intracavity second harmonic generation
Certain parameters are well known for leading into chaotic behavior. One of them is depolarizing effects on the fundamental beam. This can be due to a birefringent element that is not placed parallel with its optical axis to the beam polarization. Therefore, non-critical Type I phasematching is preferred. Another effect that should be prevented from is internal interference effects with the harmonic beam, which can be realized by only allowing a single pass through the nonlinear crystal. Finally, for achieving compactness and cost efficiency, the laser cavity should be as simple as possible with as few optical elements as possible. First, the laser crystal had to be selected. It should be a crystal that has all the positive properties listed in chapter 2.1 and lead to wavelengths around 525-535 nm for the green laser and to 455-475 nm for the blue laser. Additionally, it should have a good damping parameter to suppress internal amplitude transients [9]. Here I decided to use Nd:YVO4 for the green (1064 nm) and Nd:YAG (946 nm) in the blue laser.
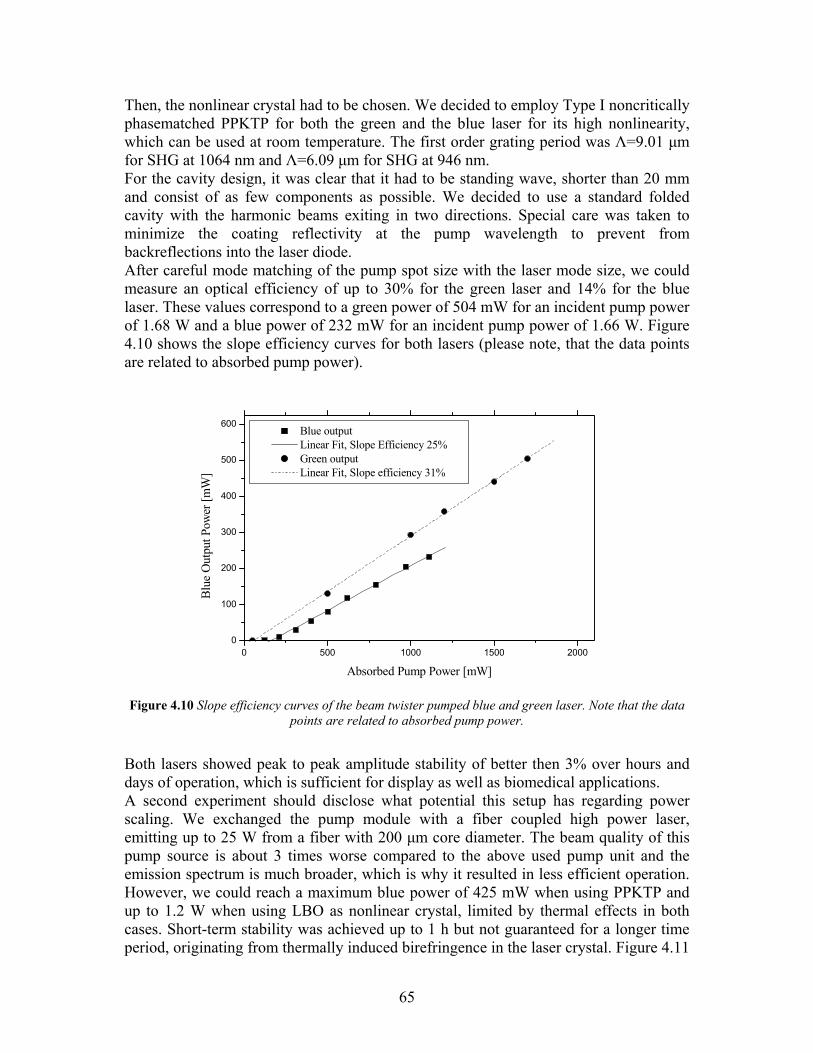
65
Then, the nonlinear crystal had to be chosen. We decided to employ Type I noncritically phasematched PPKTP for both the green and the blue laser for its high nonlinearity, which can be used at room temperature. The first order grating period was Λ=9.01 µm for SHG at 1064 nm and Λ=6.09 µm for SHG at 946 nm. For the cavity design, it was clear that it had to be standing wave, shorter than 20 mm and consist of as few components as possible. We decided to use a standard folded cavity with the harmonic beams exiting in two directions. Special care was taken to minimize the coating reflectivity at the pump wavelength to prevent from backreflections into the laser diode. After careful mode matching of the pump spot size with the laser mode size, we could measure an optical efficiency of up to 30% for the green laser and 14% for the blue laser. These values correspond to a green power of 504 mW for an incident pump power of 1.68 W and a blue power of 232 mW for an incident pump power of 1.66 W. Figure 4.10 shows the slope efficiency curves for both lasers (please note, that the data points are related to absorbed pump power).
0 500 1000 1500 20000
100
200
300
400
500
600
Blue output Linear Fit, Slope Efficiency 25% Green output Linear Fit, Slope efficiency 31%
Blue
Out
put P
ower
[mW
]
Absorbed Pump Power [mW]
Figure 4.10 Slope efficiency curves of the beam twister pumped blue and green laser. Note that the data points are related to absorbed pump power.
Both lasers showed peak to peak amplitude stability of better then 3% over hours and days of operation, which is sufficient for display as well as biomedical applications. A second experiment should disclose what potential this setup has regarding power scaling. We exchanged the pump module with a fiber coupled high power laser, emitting up to 25 W from a fiber with 200 µm core diameter. The beam quality of this pump source is about 3 times worse compared to the above used pump unit and the emission spectrum is much broader, which is why it resulted in less efficient operation. However, we could reach a maximum blue power of 425 mW when using PPKTP and up to 1.2 W when using LBO as nonlinear crystal, limited by thermal effects in both cases. Short-term stability was achieved up to 1 h but not guaranteed for a longer time period, originating from thermally induced birefringence in the laser crystal. Figure 4.11
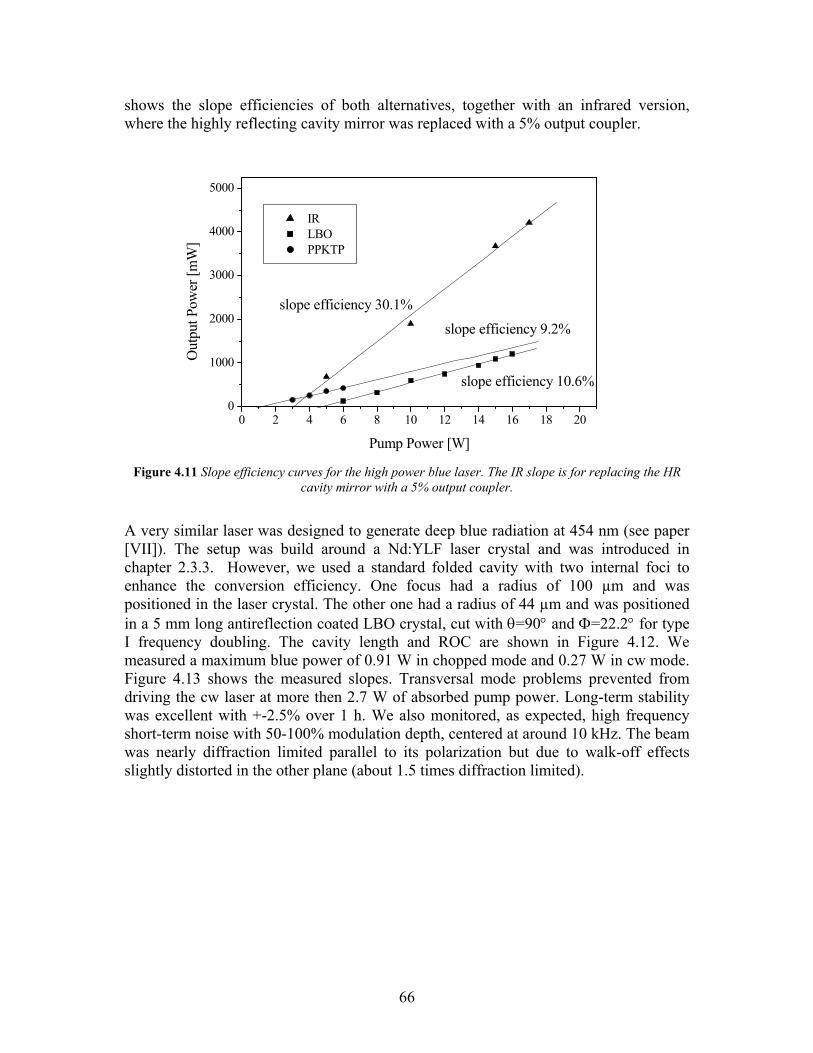
66
shows the slope efficiencies of both alternatives, together with an infrared version, where the highly reflecting cavity mirror was replaced with a 5% output coupler.
0 2 4 6 8 10 12 14 16 18 200
1000
2000
3000
4000
5000
slope efficiency 9.2%slope efficiency 30.1%
slope efficiency 10.6%
IR LBO PPKTP
Out
put P
ower
[mW
]
Pump Power [W] Figure 4.11 Slope efficiency curves for the high power blue laser. The IR slope is for replacing the HR
cavity mirror with a 5% output coupler.
A very similar laser was designed to generate deep blue radiation at 454 nm (see paper [VII]). The setup was build around a Nd:YLF laser crystal and was introduced in chapter 2.3.3. However, we used a standard folded cavity with two internal foci to enhance the conversion efficiency. One focus had a radius of 100 µm and was positioned in the laser crystal. The other one had a radius of 44 µm and was positioned in a 5 mm long antireflection coated LBO crystal, cut with θ=90° and Φ=22.2° for type I frequency doubling. The cavity length and ROC are shown in Figure 4.12. We measured a maximum blue power of 0.91 W in chopped mode and 0.27 W in cw mode. Figure 4.13 shows the measured slopes. Transversal mode problems prevented from driving the cw laser at more then 2.7 W of absorbed pump power. Long-term stability was excellent with +-2.5% over 1 h. We also monitored, as expected, high frequency short-term noise with 50-100% modulation depth, centered at around 10 kHz. The beam was nearly diffraction limited parallel to its polarization but due to walk-off effects slightly distorted in the other plane (about 1.5 times diffraction limited).

67
LBO
Nd:YLFCoating HR@908nmand HT@1047 and 792nm
PumpL=76mm
L=36mm
ROC=-25mmCoating HR@908 and HT@454nm
ROC=-100mmCoating HR@908 and 454nm
Figure 4.12 Sketch of the intracavity doubled deep blue laser.
200 400 600 800 1000 1200 14000
200
400
600
800
1000
outp
ut p
ower
Pou
t[mW
]
absorbed pump power Pabs
[mW]
chopped pump not chopped
Figure 4.13 Second-harmonic output power at 454 nm versus absorbed laser diode pump power with and
without chopping the pump.
4.3.3 Performance of a turquoise laser with sum-frequency mixing
Rare earth doped laser crystals support a limited amount of emission lines. Frequency doubling these lines leads mainly to the blue, green and deep red spectral wavelengths. For obtaining laser output in the turquoise as well as yellow-orange spectral region, one has to frequency mix two lines. Turquoise lasers enjoy a lot of attention in biomedical applications. Until now, Argon ion lasers delivered the desired features, emitting at 488 nm. But, gas lasers are inherently inefficient and users demand more compact and efficient replacements. One approach to satisfy the needs is to employ electrically or optically pumped vertically emitting diode lasers with intracavity or external frequency doubling [69]. We realized a second approach, which is based on DPSSL technology. It utilizes one emission line of Nd:YVO4 at 914 nm and one line of Nd:YLF at 1047 nm,

68
mixing them down to 488 nm (patent [II]). Like all lasers during this thesis, the setup had to be compact and efficient. But the output also had to be very stable to satisfy the demands of the biomedical applications. The first thought was to perform double resonant intracavity SFG, but the considerations published by Kretschmann et al. [70] predicted serious stability problems owing to coupling effects between the two lasers. Therefore, we decoupled the two lasers by designing a single resonant setup with the PPKTP placed in the resonant 1047 nm cavity and the non resonant 914 nm laser passing once through the resonant cavity. This approach is less efficient than a double resonant approach but still more efficient than a non resonant approach. Figure 4.14 shows the sketch of the realized setup.
Reflector with HR@1047nm PPKTP for
SFG 914+1047nm
Nd:YVO crystal withAR@914nm
Input coupler withHR@1047nm andHT@798 and 488nm
Input coupler with HR@914nm andHT@808
Pump 808nmPump 798nm
Input coupler with HR@914nm andHT@808
Coating HR@1047nmand R=97%@914nm
Nd:YLF crystal withAR@1047nm
Turqoise output
Figure 4.14 Schematics of the SFG scheme for generating turquoise light.
The 914 nm laser consists of a folded cavity with the folding mirror transmitting the pump light. The laser mode is controlled by a curved cavity mirror and the outputcoupler coating is on the PPKTP, which is at the same time HR for 1047 nm. The other side of the PPKTP is AR-coated and the second folding mirror is HR at 1047 nm and HT at 914 as well as 488 nm. Therefore, the PPKTP is resonant to the 1047 nm cavity but not resonant to the 914 nm cavity. The pump for the Nd:YVO4 was a laser diode with 200 µm emitter, focused into a 100 µm spot. The Nd:YLF crystal did not need such a small pump spot. Here we just reimaged the output from a second laser diode with 200 µm emitter. With a maximum pump power of 2.5W for the 914 nm laser and 1.8W for the 1047nm laser, 120 mW of turquoise light was measured. The harmonic output was as expected proportional to the pump power of the 798 nm pump diode laser as well as to the 914 nm power. When measuring the stability of the harmonic output, one could see a superposition of two harmonic oscillations, which were identified as the relaxation oscillations of the two fundamental lasers. However, it was to electronically reduce the noise below 3% peak-peak, satisfying the demands of most applications. This is in contrast to chaotic amplitude oscillations, as observed in intracavity frequency doubled lasers, which are not controllable with electronic feedback.

69
4.3.4 Performance of an orange laser with sum-frequency mixing
In the above chapter, turquoise light was generated with SFG of one Nd:YVO4 laser running on the 4F3/2→4I11/2 with another Nd:YLF laser running on the 4F3/2→4I9/2 transition. For reaching the yellow-orange spectral region, one has to utilize the 4F3/2→4I13/2 transition instead and mix it with a laser running on the 4F3/2→4I11/2 transition. High-resolution spectroscopy in the yellow-orange spectral region requires light sources with narrow bandwidth, high stability, and broad tunability. NPROs are well-known sources of ultra-stable, continuous-wave, single-frequency radiation with output powers exceeding 2W (chapter 2.3.4). Operation at 1064 nm has been reported as well as at 1357 nm [73]. The beams of the two NPROs were modematched by spherical lenses, beam combined with a dichroic mirror (HR at 1357nm and T = 90% at 1064 nm) and finally, with a third lens, focused confocally into the nonlinear crystal (see Fig. 1). A maximum output power of 1W of each laser was available while driving the laser diodes well below specifications.
NPRO 11357nm
NPRO 21064nm
Dichroic mirrorHR 1357nm / HT 1064nm
PPKTP
Dichroic mirrorHR 1064 - 1357nm / HT 596nm
Power-meter
Figure 4.15 Experimental setup for single pass sum-frequency mixing of two NPROs.
The uncoated nonlinear crystal for SFG had a length of 9 mm. It was a c-cut single-domain KTP crystal, periodically poled with a first-order quasi-phase matched grating with a period of 12.77 µm. A sum-frequency output power of 16.7 mW was obtained at 596 nm. Taking into account the Fresnel losses at the uncoated crystal faces, this corresponds to a normalized conversion efficiency of 0.53% / (W⋅cm) and an effective nonlinear coefficient of deff=9 pm/V. As a demonstration of the tuning capability, we placed an Iodine vapor cell in front of the orange beam and measured the transmission through the cell. When the 1064 nm laser was tuned over 2.2 K, the frequency at 596 nm shifted 6.6 GHz. The transmission spectrum is shown in Fig. 3. A strong, Doppler broadened absorption peak was observed.

70
27.5 28.0 28.5 29.0 29.5 30.0
1.0
1.5
2.0
2.5
3.0
3.5
trans
mitt
ed p
ower
, a.u
.
laser crystal temperature, oC
Figure 4.16 Transmission spectrum of Iodine vapor at around 596.4nm resulting from temperature
tuning of the 1064nm laser.
4.4 Frequency conversion of Q-switched lasers Resonant schemes are usually not needed when frequency converting laser pulses with high peak power. The light intensity of such pulses is often high enough to achieve conversion efficiencies exceeding 65% in a single pass configuration through a relatively short crystal [71]. However, there are some optimization needed to achieve these efficiencies for pulses with medium peak power levels. Papers [II, IV, V] present this case, where passively Q-switched lasers with a peak power of a few kW are efficiently frequency doubled and quadrupled into the green, blue and ultraviolet spectral region.
4.4.1 Frequency quadrupled and tripled NPROs Guided by the simulations introduced in 2.3.5, a passively Q-switched NPRO (described in [72]) was optimized in terms of maximum peak power, resulting in 2.1 ns long pulses with 90 µJ pulse energy at a repetition rate of 5.4 kHz. One advantage of an NPRO is that they can be tuned relatively fast via a piezoelectric element (1-2MHz/V) and also slowly by controlling the laser-crystal temperature (≈3GHz/K). Additionally, their monolithic ring laser design results in ultrastable operation and nearly Fourier transform limited pulses. Subsequent frequency conversion of this laser source to wavelengths of 532, 355, and 266 nm is motivated by applications ranging from trace gas monitoring to micromachining.
1064532
266
KTP BBO
NPRO,Passively Q-switched
Lens Lens
Figure 4.17 Schematic of the experimental configuration.
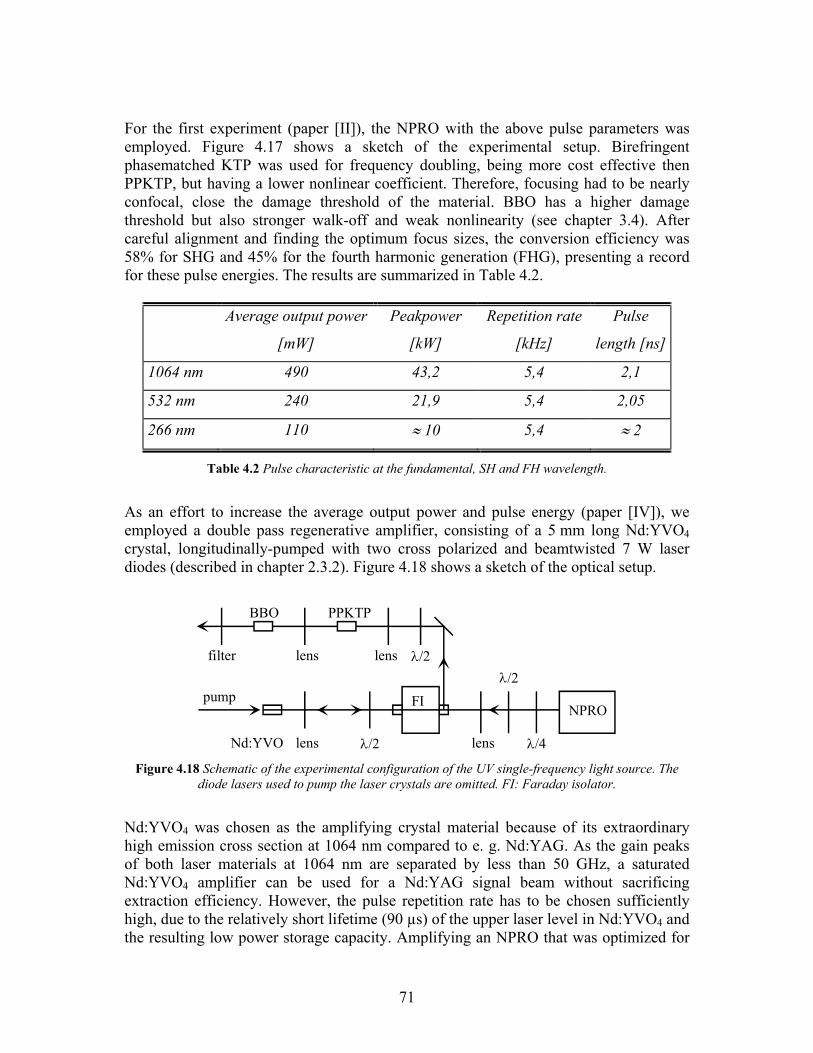
71
For the first experiment (paper [II]), the NPRO with the above pulse parameters was employed. Figure 4.17 shows a sketch of the experimental setup. Birefringent phasematched KTP was used for frequency doubling, being more cost effective then PPKTP, but having a lower nonlinear coefficient. Therefore, focusing had to be nearly confocal, close the damage threshold of the material. BBO has a higher damage threshold but also stronger walk-off and weak nonlinearity (see chapter 3.4). After careful alignment and finding the optimum focus sizes, the conversion efficiency was 58% for SHG and 45% for the fourth harmonic generation (FHG), presenting a record for these pulse energies. The results are summarized in Table 4.2.
Average output power
[mW]
Peakpower
[kW]
Repetition rate
[kHz]
Pulse
length [ns]
1064 nm 490 43,2 5,4 2,1
532 nm 240 21,9 5,4 2,05
266 nm 110 ≈ 10 5,4 ≈ 2
Table 4.2 Pulse characteristic at the fundamental, SH and FH wavelength.
As an effort to increase the average output power and pulse energy (paper [IV]), we employed a double pass regenerative amplifier, consisting of a 5 mm long Nd:YVO4 crystal, longitudinally-pumped with two cross polarized and beamtwisted 7 W laser diodes (described in chapter 2.3.2). Figure 4.18 shows a sketch of the optical setup.
pumpNPRO
FI
BBO PPKTP
lens
lenslens
lensfilterλ/2
λ/2 λ/4
λ/2
Nd:YVO Figure 4.18 Schematic of the experimental configuration of the UV single-frequency light source. The
diode lasers used to pump the laser crystals are omitted. FI: Faraday isolator.
Nd:YVO4 was chosen as the amplifying crystal material because of its extraordinary high emission cross section at 1064 nm compared to e. g. Nd:YAG. As the gain peaks of both laser materials at 1064 nm are separated by less than 50 GHz, a saturated Nd:YVO4 amplifier can be used for a Nd:YAG signal beam without sacrificing extraction efficiency. However, the pulse repetition rate has to be chosen sufficiently high, due to the relatively short lifetime (90 µs) of the upper laser level in Nd:YVO4 and the resulting low power storage capacity. Amplifying an NPRO that was optimized for
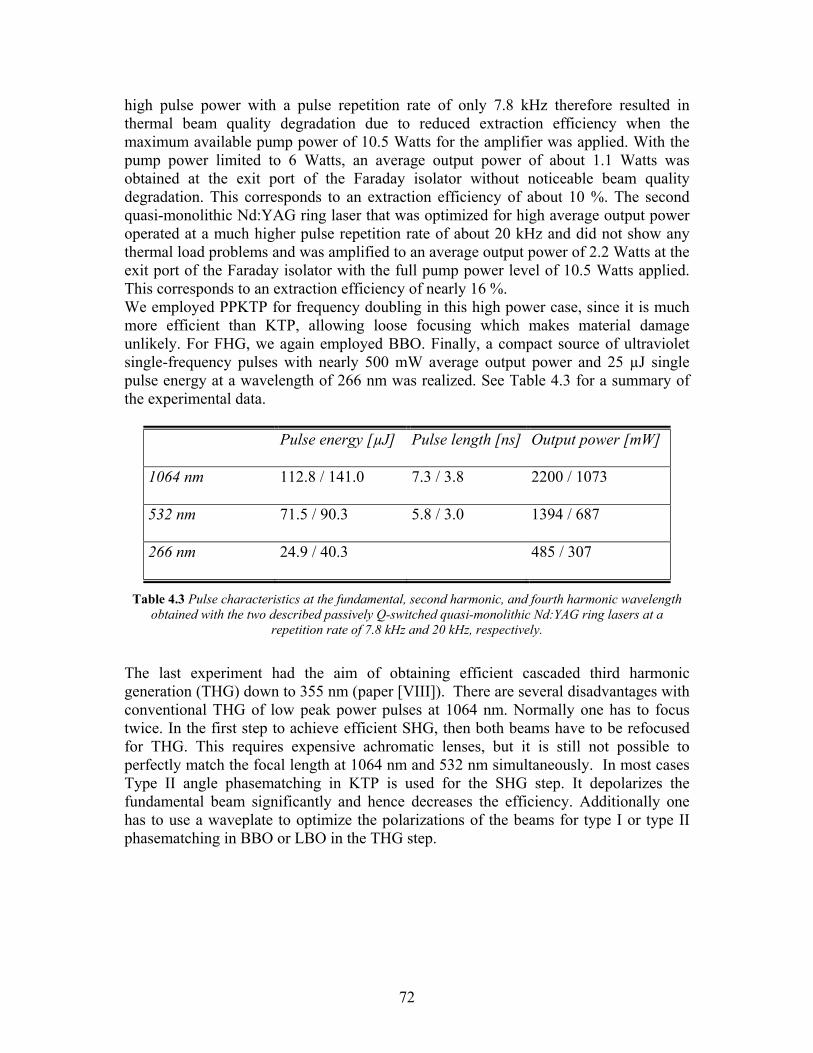
72
high pulse power with a pulse repetition rate of only 7.8 kHz therefore resulted in thermal beam quality degradation due to reduced extraction efficiency when the maximum available pump power of 10.5 Watts for the amplifier was applied. With the pump power limited to 6 Watts, an average output power of about 1.1 Watts was obtained at the exit port of the Faraday isolator without noticeable beam quality degradation. This corresponds to an extraction efficiency of about 10 %. The second quasi-monolithic Nd:YAG ring laser that was optimized for high average output power operated at a much higher pulse repetition rate of about 20 kHz and did not show any thermal load problems and was amplified to an average output power of 2.2 Watts at the exit port of the Faraday isolator with the full pump power level of 10.5 Watts applied. This corresponds to an extraction efficiency of nearly 16 %. We employed PPKTP for frequency doubling in this high power case, since it is much more efficient than KTP, allowing loose focusing which makes material damage unlikely. For FHG, we again employed BBO. Finally, a compact source of ultraviolet single-frequency pulses with nearly 500 mW average output power and 25 µJ single pulse energy at a wavelength of 266 nm was realized. See Table 4.3 for a summary of the experimental data.
Pulse energy [µJ] Pulse length [ns] Output power [mW]
1064 nm 112.8 / 141.0 7.3 / 3.8 2200 / 1073
532 nm 71.5 / 90.3 5.8 / 3.0 1394 / 687
266 nm 24.9 / 40.3 485 / 307
Table 4.3 Pulse characteristics at the fundamental, second harmonic, and fourth harmonic wavelength obtained with the two described passively Q-switched quasi-monolithic Nd:YAG ring lasers at a
repetition rate of 7.8 kHz and 20 kHz, respectively.
The last experiment had the aim of obtaining efficient cascaded third harmonic generation (THG) down to 355 nm (paper [VIII]). There are several disadvantages with conventional THG of low peak power pulses at 1064 nm. Normally one has to focus twice. In the first step to achieve efficient SHG, then both beams have to be refocused for THG. This requires expensive achromatic lenses, but it is still not possible to perfectly match the focal length at 1064 nm and 532 nm simultaneously. In most cases Type II angle phasematching in KTP is used for the SHG step. It depolarizes the fundamental beam significantly and hence decreases the efficiency. Additionally one has to use a waveplate to optimize the polarizations of the beams for type I or type II phasematching in BBO or LBO in the THG step.

73
BBO
(THG 1064nm)
PPKTP
(SHG 1064nm)
Figure 4.19 Schematic of the frequency tripling scheme.
Use of PPKTP removes all these disadvantages. It is type-I phasematchable and the fundamental electric-field vector is parallel to the vector of the second-harmonic field. Hence no waveplate is needed for interaction in type I phasematchable THG crystals like BBO. Additionally, the high nonlinearity of PPKTP makes it possible to focus only once. The BBO is placed into the focus and the PPKTP crystal sits right in front of it (see Figure 4.19). This set-up eliminates the need for expensive achromatic lenses. Its high nonlinearity allows it to be located right in front of the THG crystal without refocusing the beam. The energy density is still high enough to convert the fundamental efficiently. As a result, the fundamental beam is first converted into a second harmonic beam with an efficiency of 30%. Sum-frequency-mixing of these two beams in a 5 mm long BBO crystal, in turn, leads to a conversion efficiency of 20.3% with respect to the light incident on the PPKTP, being a record at these pulse energies. This corresponds to an average output power of 134 mW at the third harmonic wavelength (see Table 4.4).
Peak power Ppeak [kW]
Pulse length τ [ns]
Average output power Pav [mW]
1064 nm 18.7 3.42 660 355 nm 3.9 3.29 134
Table 4.4 Pulse parameters of the first and third harmonic signal. The repetition rate is 10.3 kHz.
Even higher THG efficiency could be reached when employing the above-described amplifying stage for the fundamental pulses. As a result, 50% of the fundamental beam was converted into the second harmonic with a 1 cm long PPKTP. Sum-frequency-mixing of these overlapped beams in a 7 mm long BBO crystal, in turn, leads to a conversion efficiency of 26.0% with respect to the light incident on the PPKTP. This corresponds to an average output power of 296 mW at the third harmonic wavelength (see Table 4.5). The experimental setup is shown in Figure 4.20.
Pulse energy [µJ] Pulse length [ns] Output power [mW] 1064 nm 43.0 3.8 348
1064 nm, amplified 141.1 3.8 1140 532 nm 70.5 3.0 570 355 nm 36.6 3.7 296
Table 4.5 Parameters of the fundamental and harmonic pulses, the pump power for the NPRO was 5 W and for the amplifier 6 W; pulse repetition rate was 8.08 kHz

74
pumpNPROFI
BBO PPKTP
lens
lenslens
filterλ/2
λ/2 λ/4
λ/2
Nd:YVO Figure 4.20 Schematic of the experimental configuration; FI: Faraday isolator.
4.4.2 SHG of a Q-switched Nd:YAG laser at 946 nm Chapter 2.3.5 described the setup and the performance of a passively Q-switched Nd:YAG laser at 946 nm. The maximum average output power of the pulse train was 565 mW and each pulse had a energy of 15.8 µJ and a peak power of 0.66 kW. Such peak powers require high nonlinearity for obtaining high conversion efficiency. KNbO3 is one candidate that fulfills this requirement, but it is not suitable for high average powers. Therefore, the pulses were frequency doubled by means of a 9 mm long PPKTP crystal with the highest efficiency of 57% at a slightly reduced average power of 500 mW. This corresponds to 285 mW of blue power. Excellent average power stability was observed at all power levels studied and no crystal degradation occurred during several hours of operation.

75
5 Description of the original research work Paper I: Actively Q-switched miniature Nd:YAG ring laser in single-
frequency operation S. Spiekermann, M. Bode, C. Fallnich, H. Welling and I. Freitag, El. Lett., 34, 2246-2247 (1998). We have realized the first actively Q-switched miniature Nd:YAG ring laser. The FTIR switch consisted of a polished piece of Nd:YAG glued to a piezoelectric actuator and pressed towards one point of total internal reflection. The repetition rate was up to 3 kHz with 50 ns pulses, having energy of several µJ. Actively controlled pulses as short as 3.4 ns with up to 53 µJ pulse energy were obtained with a combination of an FTIR and Cr4+:YAG saturable absorber. An investigation of the pulse dynamics has been performed. Paper II: Ultraviolet single-frequency pulses with 110 mW average power
using frequency-converted passively Q-switched miniature Nd:YAG ring lasers
M. Bode, S. Spiekermann, C. Fallnich, H. Welling, and I. Freitag, Appl. Phys. Lett., 73, 714-716 (1998). A compact source of ultraviolet single-frequency pulses has been realized by subsequent single-pass SHG and FHG of a NPRO. The conversion efficiency for both processes together was a record setting 22 % and resulted in an ultraviolet pulse train with 110 mW average power and 20 µJ pulse energy. KTP was used for the SHG process and BBO was used for the FHG interaction. Paper III: Tunable single-frequency radiation in orange spectral region S. Spiekermann, H. Karlsson, F. Laurell, and I. Freitag, , El. Lett., 36, 543-545 (2000). Sum-frequency mixing of two continuous wave NPROs at 1064 and 1357 nm have been used to generate tunable, single frequency radiation at 596 nm. An output power of 16.7 mW was obtained by employing periodically poled KTiOPO4 (PPKTP) as the frequency converter. An absorption curve of Iodine vapor was recorded to demonstrate the tunability of this system.

76
Paper IV: Ultraviolet single-frequency pulses with high average power using
frequency-converted passively Q-switched quasimonolithic Nd:yttrium-aluminum-garnet ring lasers
S. Spiekermann, M. Bode, I. Freitag, and F. Laurell, Appl. Phys. Lett., 79, 458-460 (2001). The frequency conversion scheme from paper [2] was scaled employing a regenerative amplifier. PPKTP was used instead of KTP because of better power handling capacity. The ultraviolet output was more than quadrupled, resulting in 485 mW average power. A novel pump source was also developed, consisting of two cross polarized an beam-twisted 7 W laser diodes, supplying up to 10.5 W pump power with a beam quality factor of better than M2=40. Paper V: Efficient Frequency Conversion of a Passively Q -Switched Nd:YAG
Laser at 946 nm in Periodically Poled KTiOPO4 S. Spiekermann, H. Karlsson, and F. Laurell, Appl. Opt., 12, 1979-1982 (2001). In this paper, efficient continuous wave and passively Q-switched diode laser pumped Nd:YAG lasers at 946 nm were presented together with highly efficient frequency doubling. Periodically poled KTiOPO4 was employed as the nonlinear material because of its high nonlinearity and good resistance to photorefractive damage and gray tracking in the blue spectral region was observed. At the SH wavelength of 473 nm, we measured 76 mW in continuous wave and 285 mW in Q-switched mode, respectively. The pulse to pulse dynamics were also investigated. Paper VI: Optimizing non-resonant frequency conversion in periodically poled
media S. Spiekermann, V. Pasiskevicius, F. Laurell, H. Karlsson, and I. Freitag, Appl. Phys. B, accepted for publication on February 26, 2004. We reported on non-resonant frequency conversion into the blue, green, orange, and red spectral region. Fundamental light sources were continuous wave NPRO’s as well as a standing-wave multi-mode Nd:YAG laser. Periodically poled KTiOPO4 was employed as the nonlinear medium. A multi-pass scheme resulted in a normalized conversion efficiency as high as 27.2 % W-1 for frequency doubling in the small signal regime at 1064 nm. Extensive investigations on practical considerations were performed.

77
Paper VII: Deep blue diode-pumped Nd:YLF laser S. Spiekermann, and F. Laurell, Opt. Lett., submitted on April 1, 2004. In this paper, a novel cw diode-pumped solid-state laser, emitting in the deep blue spectral region is reported. The laser crystal was Nd:YLF, operated on the 4F3/2 – 4I9/2 transition. A maximum output power of 1.06 W was generated for σ-polarized output at 908 nm and 0.58 W for π-polarized output at 903 nm. When Cr4+:YAG was introduced as a passive Q-switch pulses of 97 µJ with a length of 54 ns was obtained. Blue light was achieved by intracavity second harmonic generation using LBO as the frequency doubler. An output power of 0.27 W was obtained at 454 nm with an absorbed pump power of 3.6 W.

78
6 Contribution by the candidate Paper I: The candidate designed and performed the experiments. M. Bode assisted in writing the manuscript. Paper II: The candidate performed the experiments. He also designed the setup together with M. Bode, who wrote the manuscript. Paper III: The candidate designed the optical arrangement and performed the experiments. He also wrote the manuscript. H. Karlsson assisted with PPKTP preparation. Paper IV: The candidate performed the experiments and designed the setup as well as the pump laser for the amplifier. He wrote the manuscript assisted by M. Bode. Paper V: The candidate designed the setup, performed the experiments and wrote the manuscript. H. Karlsson assisted with PPKTP preparation. Paper VI: The candidate performed the experiments and designed the optical arrangements. He was also responsible for writing the manuscript, assisted by F. Laurell and V. Pasiskevicius. Paper VII: The candidate designed the setup and performed all experiments. He was also responsible for writing the manuscript.

79
7 Conclusions and Outlook DPSSL can today be designed to fit a broad range of applications. Depending on the required output power, amplitude stability, reliability, frequency tunability, compactness and output wavelength, one can choose between a wide set of laser technology. This thesis work contributes with several new laser setups which can potentially replace much more complex and expensive systems or even enable the realization of new applications. This was possible due to the development of novel laser schemes, mostly utilizing nonlinear optics. PPKTP was employed in most experiments. It is shown that it gives significant advantages when it comes to efficient frequency conversion to the visible (especially the blue) spectral region. It has good transmission down to the blue spectral range and it has positive effects on the stability of intra-cavity doubled lasers because of its non-critical phase matching. It is shown that the efficiency of properly designed non-resonant multi-pass schemes with PPKTP can compete with resonant schemes and simultaneously decrease the demands on mechanical stability. It was also employed to realize the first external resonant SHG scheme without needing active stabilization. However, PPKTP has its limitations when it comes to high power levels and its sensitivity towards photorefractive damage and grey-tracking strongly increases in the deep blue spectral region. Other nonlinear materials like LBO, BBO and BiBO are more suitable in this case. The field of applications for the NPRO, the most rigid and stable ring laser available, was strongly widened by means of compact frequency conversion steps as well as a novel actively Q-switching approach. The fundamental infrared cw and Q-switched radiation was down-converted into the orange, red, green, blue and ultraviolet spectral region. It was shown that the NPRO’s unique beam and spectral quality enables record-breaking conversion efficiencies. Certain schemes with extreme small acceptance bandwidth like multi-pass arrangements and external cavity SHG without active stabilization are only applicable for this laser source. The power scaling with amplifiers shows great potential for even more applications. During the thesis work, the first turquoise solid state laser with bulk crystals was presented. The solution shows strong potential to replace Argon ion gas lasers for biomedical applications. However, this technology is competing with other solutions, based on frequency converted diode lasers or upconversion fiber lasers. Compact blue and green lasers were presented in chapter 4.3.2. and 4.4.2. The blue lasers at 473 and 454 nm show record setting optical to optical efficiencies for diode pumping. They where successfully employed in medium power laser displays. For low power displays, monolithic microchip alternatives show clear advantages. Therefore, it has been decided to put a strong focus on this attractive technology in the future. Even

80
for high power displays, there are better alternatives. One is arrays of microchip lasers and another one is the development of novel regenerative amplifiers for pulsed lasers, followed by nonlinear frequency conversion steps. This approach only had small attention during this thesis but will be developed in oncoming experiments.

81
8 References [1] T.H. Maiman, Nature, 187, 493 (1960). [2] W. Koechner, “Solid-State Laser Engineering”, 1st edition, Springer Verlag. [3] C. Czeranowsky, PhD thesis, Shaker Verlag, Aachen 2002. [4] Huaijin Zhang et al., J. Opt. Soc. Am. B, 19, 18 (2002). [5] P.A. Studenikin, A.I. Zagumennyi, Y.D. Zavartsev, P.A. Popov, I.A.
Shcherbakov, Quant. Electr., 25, 1162 (1995). [6] C. Czeranowsky, M. Schmidt, E. Heumann, G. Huber, S. Kutovoi, Y. Zavartsev,
Opt. Comm., 205, 361 (2002). [7] W.P. Risk, J. opt. Soc. Am. B, 28, 1412 (1988). [8] M.W. Sasnett, “The Physics and Technology of Laser Resonators”, Hall &
Jackson, England, 1989. [9] A.E. Siegman, “Lasers”, University Science Books, Sausalito, California, 1986. [10] H. Kogelnik, and T. Li, Proc. IEEE, 54, 1312 (1966). [11] N. Hodgson, H. Weber, ”Optische Resonatoren”, Springer-Verlag, Berlin,
1992. [12] Melles Griot, ”Optics Guide”, 2003. [13] DS Tafelmaier GmbH, www.tafelmaier.de, webpage, 2004. [14] Coldren and Corzine, “Diode Lasers and Photonic Integrated Circuits”, Wiley,
1995. [15] H. Laabs, C. Gao, and H. Weber, J. of Mod. Opt., 46, 709 (1999). [16] W.A. Clarkson, and D.C. Hanna, Opt. Lett., 21, 375 (1996). [17] L. Allen, M.W. Beijersbergen, R.J.C. Spreeuw, and J.P. Woerdman, Opt. Com.,
45, 8185 (1992). [18] C. Horvath, and F. Loesel, Winlase Version 2.1 Professional (1995). [19] P. J. Hardman, W. A. Clarkson, G. J. Friel, M. Pollnau, and D. C. Hanna, IEEE
J. Of Quant. El., 35, 647 (1999). [20] I. Freitag, A. Tűnnermann, and H. Welling, Opt. Comm., 115, 511-515 (1995). [21] M.V, Klein, and T.E. Furtak, “Optik”, Springer-Verlag, Berlin, 1988. [22] I.N. Court, and F.K. Williesen, Appl. Opt., 3, 719 (1964). [23] T. Dascalu, N. Pavel, V. Lupei, G. Phillips, T. Beck, and H. Weber, Opt. eng.,
35, 1247 (1996). [24] R.S. Afzal, W. Yu, J.J. Zayhowski, and T.Y. Fan, Opt. Lett., 22, 1314 (1997). [25] L.M. Frantz, and J.S. Nodvik, J. of Appl. Phys., 34, 2346 (1963). [26] X. Zhang et al., IEEE J. Of Q. El., 33, 2286 (1997). [27] M. Schmid, R. Weber, T. Graf, M. Roos, and H.P. Weber, IEE J. of Quant. El.,
36, 620 (2000). [28] W.A. Clarkson, N.S. Felgate, and D.C. Hanna, Opt. Lett., 24, 820 (1999). [29] R. Kossowsky et al. (eds), “Optical resonators – Science and Engineering”,
Kluwer academic Publishers, 1998.

82
[30] M.E. Innocenzi, H.T. Yura, C.L. Fincher, and R.A. Fields, Appl. Phys. Lett., 56, 1831 (1990).
[31] M. Pollnau, P.J. Hardman, M.A. Kern, W.A. Clarkson, and D.C. Hanna, Phys. Rev. B, 58, 16076 (1998).
[32] P.J. Hardman, W.A. Clakson, G.J. Friel, M. Pollnau, and D.C. Hanna, IEEE J. of Quant. El., 35, 647 (1999).
[33] L.M. Frantz, J.S. Nodvik, J. Appl. Phys., 34, 2346 (1963). [34] D.A. Kleinman, Phys. Rev., 126, 1977 (1962). [35] F. Zernicke, and J.E. Midwinter, “Applied nonlinear Optics”, John Wiley &
Sons, New York, 1973. [36] M.V. Hobden, J. Appl. Phys., 38, 4365 (1967). [37] J.A. Armstrong, N. Blombergen, J. Ducuing, andP.S. Pershan, Phys. Rev., 127,
1918 (1962). [38] M.M. Fejer, G.A. Magel, D.H. Jundt, and R.L. Byer, IEEE J. Quantum
Electron., 28, 2631 (1992). [39] S. Helmfrid, G. Arvidsson, and J. Webjörn, J. Opt. Soc. Am. B, 10, 222 (1992). [40] V.G. Dmitriev, G.G. Gurzadyan, and D.N. Nikogosyan, “Handbook of
Nonlinear Optical Crystals”, Springer series in opt. sc., Springer Verlag, Berlin-Heidelberg, 1991.
[41] M.M. Fejer, G.A. Magel, D.H. Jundt, and R.L. Byer, IEEE J. Quantum Electron., 28, 2631 (1992).
[42] G.D. Boyd, and D.A. Kleinman, J. Appl. Pys., 39, 3597 (1968). [43] J.J. Zondy, Opt. Commun., 81, 427 (1997). [44] B. Boulanger, I. Rousseau, J.P. Feve, M. Maglione, B. Menaert, and G. Marnier,
IEEE J. Quant. Electron., 35, 281 (1999). [45] S. Helmfrid, G. Arvidsson, and J. Webjörn, J. Opt. Soc. Am. B, 10, 222 (1992). [46] G. Imeshev, M. Proctor, and M.M. Fejer, Opt. Lett., 23, 165 (1998). [47] K. Schneider, S. Schiller, J. Mlynek, M. Bode, and I. Freitag, Opt. Lett., 21,
1999 (1996). [48] I. juwiler, A. Arie, A. Skliar, and G. Rosenman, Opt. Lett., 24, 1236 (1999). [49] R.W.P. Drewer, J.L. Hall, F.V. Kowalski, J. Hough, G.M. Ford, A.L. Munley,
and H. Ward, Appl. Phys. B, 32, 97 (1983). [50] T.W. Hänsch, and B. Couillaud, Opt. Commun., 35, 1980. [51] W.J. Kozlovsky, C.D. Nabors, and R.L. Byer, IEEE J. of Quant. El., 24, 913
(1988). [52] E. Jurdik, J. Hohlfeld, A.F. van Etteger, A.J. Toonen, W.L. Meerts, H. van
Kempen, and Th. Rasing, JOSA B, 19, 1660 (2002). [53] M. Bode, “Abstimmbare Einfrequenz-Strahlquellen hoher Stabilität im
infraroten, sichtbaren und ultravioletten Spektralbereich”, dissertation, Universität Hannover (1999).
[54] J.D. Vance, C.-Y. She, and H. Moosmuller, Appl. Opt., 37, 4891 (1998). [55] D.C. Gerstenberger, G.E. Tye, and R.W. Wallace, Opt. Lett., 16, 992 (1991). [56] R. Paschotta, P. Kurz, R. Henking, S. Schiller, and J. Mlynek, Opt. Lett., 19,
1325 (1994). [57] D. Shen, A. Liu, J. Song, and K. Ueda, Appl. Opt., 37, 7785 (1998).

83
[58] V. G. Ostroumov, F. Heine, S. Kueck1, G. Huber, V. A. Mikhailov, I. A. Shcherbakov, Appl. Phys. B., 64, 301 (1997).
[59] C. Czeranowsky, E. Heumann, and G. Huber, Opt. Lett., 28, 432 (2004). [60] L. Y. Liu, M. Oka, W. Wiechmann, and S. Kubota, Opt. Lett., 19, 189 (1994). [61] M. Pierrou, F. Laurell, H. Karlsson, T. Kellner, C. Czeranowsky, and G. Huber,
Opt. Lett., 24, 205 (1999). [62] V. Gaebler, B. Liu, H. J. Eichler, Z. Shang, D. Sheng, Opt. Lett., 25, 1343
(2000). [63] T. Baer, J. Opt. Soc. Am. B, 3, 1175 (1986). [64] G. James, E. Harrell II, and R. Roy, Phys. Rev. A, 41, 2778 (1990). [65] S. Falter, K.M. Du, Y. Liao, M. Quade, J. Zhang, P. Loosen, and R. Poprawe,
Opt. Lett., 22, 609 (1997). [66] G. E. James, E. M. Harrell II, C. Bracikowski, K. Wiesenfeld, and R. Roy, opt.
Lett., 15, 1141 (1990). [67] M. Oka, and S. Kubota, Opt. Lett., 13, 805 (1988). [68] C. Czeranowsky, V. Baev, and G. Huber, Opt. Lett., 28, 2100 (2003). [69] E. Schiehlen, M. Golling, and P. Unger, IEEE Phot. Tech. Lett., 14, 777 (2002). [70] A. Kretschmann, F. Heine, G. Huber, and T. Halldorsson, Opt. Lett., 22, 1461
(1997). [71] V. Pasiskevicius, S. Wang, J.A. Tellefsen, F. Laurell, and H. Karlsson, Appl.
Opt., 37, 7116 (1998). [72] I. Freitag, A. Tuennermann, and H. Welling, Opt. Lett., 22, 706 (1997). [73] I. Freitag, A. Tünnermann, and H. Welling, El. Lett., 33, 777 (1997).


![JOURNAL - tu-plovdiv.bg- 6 - and studied such mode of operation for the two modern lasers - CW diode-pumped Yb-doped crystal lasers and the CW red diode lasers [7-9]](https://img.dokumen.tips/doc/110x75/5e6fd350b25a843bd51ea44f/journal-tu-6-and-studied-such-mode-of-operation-for-the-two-modern-lasers.jpg)


![Experimentally verified pulse formation model for high-power … · 2014. 8. 21. · ting Lasers (MIXSEL) [6, 7] benefit from the advantages of diode-pumped solid-state lasers (DPSSL),](https://img.dokumen.tips/doc/110x75/61386a290ad5d20676493dd0/experimentally-veriied-pulse-formation-model-for-high-power-2014-8-21-ting.jpg)