Embed Size (px)
Citation preview

FDI Spillovers, Import Competition and Export Intensity - Evidence for Romanian
Manufacturing Firms
Bruno Merlevede
HUB RESEARCH PAPER 2008/38.
SEPTEMBER 2008

FDI Spillovers, Import Competition andExport Intensity - Evidence for Romanian
Manufacturing Firms
Bruno Merlevede∗
HUBrussel, Research Foundation-Flanders and Ghent University
April 24, 2008
Abstract
This paper investigates the integration of internationalisation in terms of importcompetition and export intensity at the industry level into the FDI spillover frameworkfor a panel of Romanian manufacturing firms. Whereas the FDI spillover discussionis framed in terms of the presence of foreign firms, we argue that one could like-wise frame this discussion in terms of import competition or export intensity. Thenthe question arises whether the findings in the FDI spillover literature are falsely at-tributed to foreign presence while they actually originate from internationalisation. Ifnot, it is still possible that internationalisation spillover effects behave in a similarway as FDI spillover effects and that there is some trade-off between both. On theother hand foreign presence and internationalisation may also reinforce one another.We find that intraindustry FDI spillover effects are negative, but insignificant, whileintraindustry internationalisation spillover effects are significantly positive. Interindus-try effects seem to be largely absent if interaction terms are not included. Interactioneffects suggest a trade-off between FDI and internationalisation. This holds both forintra and interindustry effects. Throughout our results we find indications that importcompetition is more beneficial to domestic firms’ productivity than export intensity atthe industry level. Overall, we find no indication that the findings of the FDI spilloverliterature are falsely attributed to foreign presence while they actually originate frominternationalisation.
∗HUBrussel, Stormstraat 2, B-1000 Brussels, Belgium, [email protected]; Depart-ment of Economics and CERISE, Ghent University, Belgium; Research Foundation-Flanders (FWO-Vlaanderen)
1

1 Introduction
When a firm invests in a foreign country, it often brings with it proprietary technology to
compete successfully with indigenous firms (Markusen, 1995). Believing that this trans-
ferred technology will be adopted by domestic firms, numerous host country policymakers
try to implement policies to attract foreign direct investment (FDI). Unfortunately, such
faith in the positive spillover effects of FDI contrasts starkly with the empirical evidence
(Rodrik, 1999). The literature surveys of Görg and Greenaway (2003) and Smarzynska Ja-
vorcik (2004) conclude that there is no clear evidence of aggregate positive spillovers from
FDI. Looking at the literature more closely, however, we see a distinction between spillovers
to firms in the same industries (intraindustry or horizontal spillovers) and spillovers to firms
in linked industries (interindustry or vertical spillovers). Horizontal spillovers have received
widespread attention, while the vertical spillover discussion launched by McAleese and Mc-
Donald (1978) and Lall (1980) languished for two decades until its recent revival by Schoors
and van der Tol (2002) and Smarzynska Javorcik (2004). These authors distinguish verti-
cal spillovers that occur through contacts between foreign firms and their local suppliers in
upstream industries (backward spillovers) from those that occur through contacts between
foreign firms and their downstream customers (forward spillovers). Both studies suggest that
spillovers between industries dominate spillovers within industries. This finding is confirmed
by analyses on other samples and time periods. A consensus on the direction and magnitude
of the effects is still lacking however.
At the same time interest in a range of aspects of firm and plant level adjustment to trade
liberalisation and falling trade costs has exploded in recent years. This new literature was
triggered by the empirical observation that exporting and non-exporting firms co-existed in
the same industry but had very different characteristics (see Bernard and Jensen (1995)).
While theoretical breakthroughs linked firm level heterogeneity to participation in interna-
tional markets (see Melitz (2003), Helpman et al. (2004) and Bernard et al. (2003)), the
growing availability of micro level datasets facilitated detailed analysis at the firm level.
Within this literature, there is ample evidence of the positive correlation between productiv-
ity and internationalisation, the direction of causation has been more controversial, however
(Greenaway and Kneller (2007)).
In this paper, we merge the insights from this strand of literature in the spillover frame-
work in a novel way. There are some indications in the literature that trade openness matters
for FDI spillovers, but the evidence is merely circumstantial. Schoors and Vandertol (2002)
find that spillovers vary strongly with openness. Sinani and Meyer (2004) find that trade ori-
entation matters for spillovers. Sjöholm (1999), on the other hand finds for Indonesian firms
2

that industrial competition rather than import competition affects FDI spillovers. In this
paper we investigate how horizontal and vertical spillovers relate to internationalisation1,
measured as import competition and export intensity at the industry level for a dataset
of Romanian manufacturing firms. The spillover literature takes the share of foreign firms’
output in total industry output as basic measure to investigate spillover effects. We consider
whether export intensity, import competition, or openness have a comparable effect to the
presence of foreign firms. The question whether the findings in the FDI spillover literature
are falsely attributed to foreign presence while they actually originate from internationalisa-
tion then naturally arises. If not, it is still possible that internationalisation spillover effects
behave in a similar way as FDI spillover effects and that there is some trade-off between both.
On the other hand foreign presence and internationalisation may also reinforce each other’s
spillover effects. To test these hypotheses specifications commonly used in the spillover litera-
ture are replicated replacing the basic measure for the presence of foreign firms with, in turn,
the share of imported goods in total industry supply, the share of exports in total industry
supply, and the sum of both (openness). These commonly estimated specification are also
replicated adding the internationalisation measures to the FDI spillover measures. Finally,
we consider possible interaction effects to test the trade-off versus reinforcement hypotheses.
Below we review the various spillover effects analyzed in the literature and the empir-
ical evidence found in the literature (section 2). Section 3 lays out the data sources, the
estimation strategy, and discusses the integration of internationalisation in the FDI spillover
framework. Results are presented in section 4 and we conclude in section 5.
2 Spillovers of foreign investment to local firm produc-
tivity
Multinational companies (MNCs) can take on local firms with superior knowledge of local
markets, consumer preferences and business practices because they possess superior intan-
gible productive assets, such as managerial skills, reputation, or technological know-how
(Blomström and Sjöholm, 1999). Since these are not easily codifiable in the form of patents
and blueprints and difficult to value, it is hard to license them to a host country firm. But
the intangible productive assets can be conveyed to subsidiaries in the host country through
foreign investment (Teece, 1977), which is therefore expected to raise the productivity of the
receiving firm. If local firms interact with foreign affiliates, there are a number of channels
through which FDI may affect host country firm productivity. Two major types of spillovers1From this point onward internationalisation is thought of as import competition, export intensity, and
openness (the sum of imports and exports) at the sector level.
3
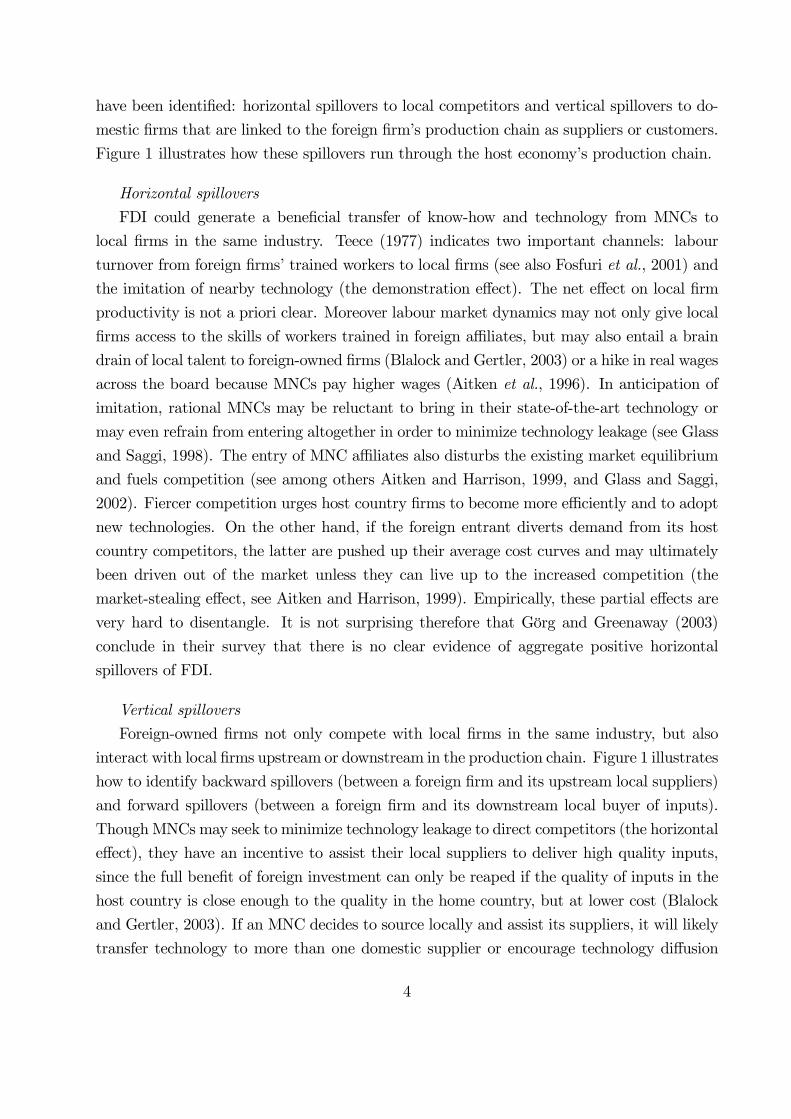
have been identified: horizontal spillovers to local competitors and vertical spillovers to do-
mestic firms that are linked to the foreign firm’s production chain as suppliers or customers.
Figure 1 illustrates how these spillovers run through the host economy’s production chain.
Horizontal spillovers
FDI could generate a beneficial transfer of know-how and technology from MNCs to
local firms in the same industry. Teece (1977) indicates two important channels: labour
turnover from foreign firms’ trained workers to local firms (see also Fosfuri et al., 2001) and
the imitation of nearby technology (the demonstration effect). The net effect on local firm
productivity is not a priori clear. Moreover labour market dynamics may not only give local
firms access to the skills of workers trained in foreign affiliates, but may also entail a brain
drain of local talent to foreign-owned firms (Blalock and Gertler, 2003) or a hike in real wages
across the board because MNCs pay higher wages (Aitken et al., 1996). In anticipation of
imitation, rational MNCs may be reluctant to bring in their state-of-the-art technology or
may even refrain from entering altogether in order to minimize technology leakage (see Glass
and Saggi, 1998). The entry of MNC affiliates also disturbs the existing market equilibrium
and fuels competition (see among others Aitken and Harrison, 1999, and Glass and Saggi,
2002). Fiercer competition urges host country firms to become more efficiently and to adopt
new technologies. On the other hand, if the foreign entrant diverts demand from its host
country competitors, the latter are pushed up their average cost curves and may ultimately
been driven out of the market unless they can live up to the increased competition (the
market-stealing effect, see Aitken and Harrison, 1999). Empirically, these partial effects are
very hard to disentangle. It is not surprising therefore that Görg and Greenaway (2003)
conclude in their survey that there is no clear evidence of aggregate positive horizontal
spillovers of FDI.
Vertical spillovers
Foreign-owned firms not only compete with local firms in the same industry, but also
interact with local firms upstream or downstream in the production chain. Figure 1 illustrates
how to identify backward spillovers (between a foreign firm and its upstream local suppliers)
and forward spillovers (between a foreign firm and its downstream local buyer of inputs).
ThoughMNCs may seek to minimize technology leakage to direct competitors (the horizontal
effect), they have an incentive to assist their local suppliers to deliver high quality inputs,
since the full benefit of foreign investment can only be reaped if the quality of inputs in the
host country is close enough to the quality in the home country, but at lower cost (Blalock
and Gertler, 2003). If an MNC decides to source locally and assist its suppliers, it will likely
transfer technology to more than one domestic supplier or encourage technology diffusion
4

final goods
raw materials
# Foreign# Domestic # Domestic
Sector A
Horizontal spillover
Forward spillover
(δAB)
Sector BSector C
Sector DSector E
Backwardspillover
(αAE)
Forwardspillover
(δAC)
Backwardspillover
(αAD)
Spillover Goods flow
Figure 1: Spillovers through the host economy’s production chain
5

in upstream industries in order to circumvent a hold-up problem. It is therefore expected
that the backward linkage spillovers may boost local firm productivity and competitiveness.
However, domestic firms that cannot live up to the standards required by the downstream
MNC may get hurt. Rodriguez-Clare (1996) shows that the backward spillover from foreign
firms to local firm productivity is more likely to be favorable if the good that MNCs produce
uses intermediate goods more intensively and if home and host countries are not too different
in terms of the variety of intermediate goods produced. If these conditions are reversed,
then MNC investment could even hurt the host economy: if intermediate inputs in the host
country are still too different from intermediate inputs in the home country (e.g. too low
quality), local firms’ productivity may suffer. Figure 1 also exhibits an equivalent forward
linkage effect, where better inputs due to foreign investments improve the productivity of all
downstream local firms that use these inputs. On the other hand, the inputs produced by
foreign affiliates may be more expensive and less adapted to local requirements. Therefore
foreign investment in input industries may be beneficial mainly to those firms that are more
fit to handle the more expensive though better inputs. The direction of vertical spillovers
thus depends on different characteristics and cirucmstances. The very different findings in
the literature -both with respect to horizontal and vertical spillovers- as evidenced in table
1 are therefore not surprising.
Level of technology - absorptive capability
One of the characteristics that is often cited as a decisive determinant for the direction
and magnitude of spillover effects is the level of technology of the local firm. There are
however two opposing interpretations of the level of technology that give rise to different
outcomes. Findlay (1978) constructs a dynamic model of technology transfer through FDI
from developed to developing countries. He argues there is a positive connection between the
distance to the world’s technological frontier and economic growth. Findlay’s model implies
that productivity spillovers are an increasing function of the technology gap between foreign
and domestic firms. However, measures of the level of technology are commonly used as a
measure of the ability of firms to assimilate outside knowledge and technology. Blomström
(1986) finds that foreign firms are more likely to wipe out local competitors if the initial level
of technology is low and human capital is poor, i.e. if absorptive capability is low. Kokko
et al. (1996) find that horizontal spillovers are positive and significant only for plants with
small or moderate technology gaps vis-a-vis foreign firms. Sjöholm (1999) finds that high
technology differences give rise to large spillovers, although results are sensitive to the choice
of technology measure. There is no theoretical ground for the assumption that technology
affects FDI spillovers linearly. Findlay (1978) suggests that spillovers are a negative function
6

Paper Data Aggreg. Country Da Ha Fa Ba Developing countries Blomström (1986) cs industry Mexico + na na Haddad and Harrison (1993) panel micro Morocco ? na na Kokko (1994) cs industry Mexico + na na Kokko (1996) cs industry Mexico + na na Aitken and Harrison,(1999) panel micro Venezuela - na na Blomström and Sjöholm (1999) cs micro Indonesia + na na Sjöholm (1999) cs micro Indonesia + na na Kathuria (2000) panel micro India ? na na Kugler (2001) panel industry Colombia ? na na Blalock and Gertler (2004) panel micro Indonesia ? na + Transition countries Djankov and Hoekman (2000) panel micro Czech Republic + - na na Kinoshita (2001) panel micro Czech Republic ? ? na na Konings (2001) panel micro Bulgaria
Poland Romania
? + ?
- ? -
na na na
na na na
Zukowska-Gagelmann (2000) panel micro Poland ? - na na Damijan et al. (2003) panel micro 10 EU-candidates + (3)
- (4) + (5) - (0)
+ (2) - (4)
+ (4) - (2)
Yudaeva et al. (2003) panel micro Russia + + - - Smarzynska Javorcik and Spatareanu (2003) b
panel micro Romania na -/+ na +/-
Smarzynska Javorcik (2004) panel micro Lithuania ? ? -/? + Sinani and Meyer (2004) panel micro Estonia na + na na Notes: results refer to the main or preferred estimation: + positive and signidicant result; - negative and signidicant result; ? insignificant result a D: direct effect; H: horizontal spillover; F: forward spillover; B: backward spillover b distinction: minority/majority owned foreign firms For developed countries see Görg and Greenaway (2003)
Table 1: Non-exhaustive overview of papers on spillovers in developing and transitioneconomies
of the level of technology, while the absorptive capability interpretation suggests a positive
relation. Figure 2 illustrates how these competing hypotheses may give rise to non-linear
relationships, without clear prediction of the curvature. Girma and Görg (2005) find indeed
evidence for a U-shaped relationship between productivity growth and horizontal spillovers
interacted with the level of technology, while Girma (2005) finds that horizontal spillovers
increase with absorptive capability until some threshold level beyond which it becomes less
pronounced.
3 Empirical approach, data, variables, and openness
In this section we first describe the standard procedure to investigate spilover effects from the
presence of foreign firms. Then we introduce variable definitions and our dataset. Finally,
we discuss how to integrate internationalisation in this framework.
7

spilloveron firm
productivity
absorptive capability hypothesis
level of technology
Findlay hypothesis
Figure 2: Spillovers as a non-linear function of the level of technology
3.1 Empirical approach
We use a two-step procedure. The first step consists in the estimation of a standard produc-
tion function. The second step relates the estimated total factor productivity to measures
of FDI spillovers and several control variables.
Our initial problem is that researchers cannot directly observe how firms react to firm-
specific productivity shocks. For example, a firm confronted with a large positive productivity
shock might respond by using more inputs. Griliches and Mairesse (1995) provide a detailed
account of this problem and make the case that inputs should be treated as endogenous
variables since they are chosen on the basis of the firm’s, rather than an econometrician’s,
assessment of its productivity. OLS estimates of production functions therefore yield biased
estimates of factor shares and biased estimates of productivity.2 We thus employ the semi-
parametric approach suggested by Olley and Pakes (1996) and subsequently modified by
Levinsohn and Petrin (2003). While details on the methodology appear in Appendix A, it
is sufficient here to note that it allows for firm-specific productivity differences that exhibit
idiosyncratic changes over time. We estimate domestic production functions by industry j
in the period 1998—2001, excluding foreign firms from the estimation.3 A measure of total
2Specifically, the coefficient of labor is biased upwards, while the capital coefficient is biased downwards.3The dependent variable in the production function is value added, va, is calculated as real output Y , mea-
sured as sales deflated by producer price indices of the appropriate Nace industry minus real material inputM , measured as material costs deflated by a weighted intermediate input deflator where the industry-specificweighting scheme is drawn from input-output tables. Labor L is expressed as the number of employees. Realcapital K is measured as fixed assets, deflated by the average of the deflators for the following five Naceindustries: machinery and equipment (29); office machinery and computing (30); electrical machinery and
8

factor productivity tfpit is obtained as the difference between value added and capital and
labor inputs, multiplied by their estimated coefficients:
∀j : tfpit = vait − bβllit − bβkkit (1)
In the second step, we relate tfpit to a vector of spillover variables, FDI, a concentration
index, H, and industry, region, and time dummies (αj, αr, and αt). Note that we pool
industries for the estimation of (2), whereas (1) is an industry-specific estimation.
tfpijrt = αi +Ψ1f (FDIjt−1, Tijrt−1)0 + α2Hjt + αj + αr + αt + εijrt (2)
Concentration (Hjt) is measured by the Herfindahl concentration index. The theoretical
literature is inconclusive as to the impact of competition on productivity. Nickell (1996) finds
a positive impact of competition on firm performance, which suggests a negative sign for α2.
The vector of spillover variables (FDIjt−1) covers different transformations of the horizontal
and vertical spillovers (cf. infra). We use the lagged version of the spillover variables because
it takes time for the spillover effects to manifest themselves. We first look at the spillover
variables traditionally considered in the literature. Next, we interact the spillover variables
with the firm-specific level of technology (Tijrt−1) in a non-linear way. Specification (2) is
first differenced and estimated as a fixed effects model:
∆tfpijrt = βi + Ω1∆f (FDIjt−1, Tijrt−1)0 + β2Hjt + βt + εijrt (3)
The fixed effects control for all time-invariant firm-specific unobservables driving produc-
tivity growth, including region and industry effects. The first-differenced time dummies still
control for the business cycle. Because FDIjt−1 and Hjt are defined at the industry level,
while estimations are performed at the firm level, standard errors need to be adjusted (see
Brent R. Moulton, 1990). Standard errors are clustered for all observations in the same
industry and year. All regressions are performed using the sample of domestic firms only.
3.2 Data description and variable definitions
Romanian firm-level data for 1996—2001 are drawn from the Amadeus database published
on DVD by Bureau Van Dijk. Industry price level data at Nace 2-digit level4 are taken
from the Industrial Database for Eastern Europe from the Vienna Institute for International
apparatus (31); motor vehicles, trailers, and semi-trailers (34); and other transport equipment (35). Thisapproach follows Smarzynska Javorcik (2004).
4Nomenclature générale des activités économiques dans les Communautés européennes.
9

Economic Studies and from the Statistical Yearbook of the Romanian National Statistical
Office. Our industry classification follows the classification used in the Romanian input-
output (IO) tables. This classification is then linked to the Nace classification scheme (see
Appendix B). The entire Amadeus series is used to construct a database of time-specific
foreign entry in local Romanian firms.5 IO tables for the period 1995—2001 were obtained
from the Romanian National Statistical Office.
The matrix FDI in (3) contains measures of foreign presence to capture the different
spillovers described above. We classify a firm as foreign (Foreign = 1) when foreign partic-
ipation exceeds 10%.6 The horizontal spillover variable Horizontaljt captures the degree of
foreign presence in sector j at time t and is measured as:
Horizontaljt =
Pi∈j Foreignit ∗ YitP
i∈j Yit(4)
where Yit is firm i’s real output at time t. Horizontaljt is industry j’s share of output
produced by foreign-owned firms.
For the measurement of the backward spillover variableBackwardjt, one possibility might
be to employ the share of firm output sold to foreign firms. However, this information is
unavailable from our dataset. Note moreover that the share of firm output sold to foreign-
owned domestic firms may cause endogeneity problems if the latter prefer to buy inputs from
more productive domestic firms. We measure Backwardjt as:
Backwardjt =X
k if k 6=jγjkt ∗Horizontalkt (5)
where γjkt is the proportion of industry j’s output supplied to sourcing industry k at time
t. The γs are calculated from the time-varying IO tables for intermediate consumption.
Horizontalkt is a measure for foreign presence in industry k at time t. In the calculation
of γ, we explicitly exclude inputs sold within the firm’s industry (k 6= j) because this is
captured by Horizontaljt.7 Since firms cannot easily switch between industries for their
5Amadeus DVDs are released each year. They provide a pan-European database of financial informationon public and private companies. Specific entries, however, only indicate the most recent ownership informa-tion. Since ownership information is gathered at irregular intervals, we do not have ownership informationfor all years and firms. Ownership changes tend to show up ex post in the database. Therefore, if a givenfirm has any gaps in its ownership series, we fill the gaps with the information from the following year.
6This threshold level is commonly applied (e.g. by the OECD) in FDI definitions.7To clarify, we offer the following example. Consider three sectors: j, k1, and k2. Suppose that half of
the output of j is purchased by k1 and the other half by k2. Further suppose that no foreign firms are activein k1, but half of the output of k2 is produced by foreign firms. The backward variable for sector j would be(0.5 ∗ 0.0) + (0.5 ∗ 0.5) = 0.25. From this, it can be easily seen that the value of Backward increases withforeign presence in the sectors k that source inputs from j and with the share of output of sector j supplied
10

inputs, we can avoid the problem of endogeneity by using the share of industry output sold
to downstream domestic markets with some foreign presence. In the same spirit, we define
the forward spillover variable Forwardjt as:
Forwardjt =X
l if l 6=jδjlt ∗Horizontallt (6)
where the IO tables reveal the proportion δjlt of industry j’s inputs purchased from upstream
industries l. Inputs purchased within the industry (l 6= j) are again excluded, since this is
already captured by Horizontaljt.8
A measure of the level of technology needs to reflect the relative technical capabilities of
a domestic firm vis-à-vis the foreign firms in the same industry. In constructing measure Tit,
we apply the Levinsohn-Petrin technique on the full sample of both domestic and foreign
firms, but on earlier years to avoid endogeneity. The estimated relation is then used to
derive total factor productivity measures ϕit for all firms. Tit is defined in (7) as the distance
between firm i’s lagged productivity level, ϕit−1, and the lagged “foreign frontier” in its
industry. The latter is defined as the mean productive efficiency of the 25% most productive
foreign firms in industry j (ϕjt−1,FOR). More productive firms have higher values of T .
Tit =ϕit−1
ϕjt−1,FOR(7)
We integrate the level of technology in the analysis by considering the interaction of T
with Horizontal, Backward, and Forward. Since the above discussion suggests possible
non-linearities, we consider interactions with the squared level of technology (T 2it). Sectoral
competition, Hjt, is measured by the Herfindahl index based on the firm-level observations
from the Amadeus database.
3.3 Integration of internationalisation
Following theoretical breakthroughs linking firm level heterogeneity to participation in inter-
national markets (see e.g. Melitz (2003), Helpman et al. (2004) and Bernard et al. (2003)),
and the growing availability of micro level datasets facilitating detailed analysis at the firm
level, the interest in a range of aspects of firm and plant level adjustment to trade liber-
to industries with foreign presence.8Consider three sectors: j, l1, and l2. Suppose j buys 75% of its inputs with l1 and the remaining 25%
with l2. Further suppose that 10% of l1’s output is produced by foreign firms, and half of the output of l2 isproduced by foreign firms. The backward variable for sector j would be (0.75 ∗ 0.10) + (0.25 ∗ 0.50) = 0.20.
11

alisation and falling trade costs has exploded in recent years (see Greenaway and Kneller
(2007) for a recent survey). In order to integrate internationalisation aspects in our spillover
framework we start by defining analogous measures for import competition, export intensity,
and openness as those for foreign presence above (cf. (4)). Whereas the spillover literature
takes the share of foreign firms’ output in total industry output as basic measure to inves-
tigate spillover effects, we replace the numerator in (4) with data on import competition
in (8) and export intensity in (9) at the industry level which are available from the yearly
IO-tables9. We also define the variable Openness in (10) as the sum of both. Obviously,
one would prefer export data at the firm level but this information is not available from the
Amadeus database10 and we use the industry’s export intensity as our measure. The corre-
lation structure in table 2 shows that the correlation between the FDI measure Horizontal
and the internationalisation measures Mcomp, Xintensity, and Openness is fairly limited
in case of Romania.
Mcompjt =ImportsjtP
i∈j Yit(8)
Xintensityjt =ExportsjtP
i∈j Yit(9)
Opennessjt =Importsjt +ExportsjtP
i∈j Yit(10)
It is not a priori clear how to integrate internationalisation into the spillover analysis.
Import competition, export intensity, and openness are first treated as comparable to the
presence of foreign firms. The list of possible FDI spillover effects in section 2 is discussed
in terms of the presence of foreign firms. Likewise we could discuss these possible effects
in terms of import competition or export intensity. In an emerging economy as Romania,
imported goods are unlikely to be of inferior quality than local goods. Likewise exported
goods -possibly of inferior quality relative to their western counterparts- will still face a
number of quality requirements that makes them superior over goods destined for the local
market. Therefore import competition or export intensity is not unlikely to cause equiva-
lent demonstration and competition effects as discussed in section 2. Interindustry spillover
9The data on imports refer to imported goods that are the same as the goods produced by the industry.They do not refer to imported inputs. Therefore we can define our variable as import competition. Exportsrefer to the amount of produced goods that is destined for export markets.10The database contains a variable ’export turnover’ but data are non-available for Romania.
12

Horizontal Openness McompHorizontal 1Openness 0.18 1Mcomp 0.08 0.55 1
Xintensity 0.15 0.81 -0.04
Table 2: Correlation matrix
effects are equally plausible. Inputs sourced from industries that face more import com-
petition or that are more export intensive could be of better quality and therefore may
affect the sourcing firm’s productivity. Likewise firms in industries that face more import
competition or are more export intensive may demand higher quality from their suppliers
or even assist them in producing suited inputs. As with FDI spillovers, the level of tech-
nology again could -possibly in a non-linear way- be a decisive factor in determining the
direction and magnitude of spillover effects from import competition and export intensity.
We test this by replicating specification (3) using measures for internationalisation compa-
rable to Horizontal, Backward, and Forward. We therefore define interindustry version
of Mcomp, Xintensity, and Openness analogously to the variable definitions of Backward
and Forward in (5) and (6) above. For Mcomp we then obtain
Mcompbackjt =X
k if k 6=jγjkt ∗ Impcompkt (11)
Mcompforjt =X
l if l 6=jδjlt ∗ Impcomplt (12)
The definitions for Xintensity and Openness follow in a straightforward manner.
The above discussion suggest the possibility that the findings in the FDI spillover litera-
ture are falsely attributed to foreign presence while they actually originate from internation-
alisation. We will put this possibility explicitly to the test by estimating specifications with
both FDI and internationalisation variables among the explanatory variables. The limited
correlation in table 2 is a first indication that this should not be the case in Romania. It
is still possible, however, that internationalisation spillover effects behave in a similar way
as FDI spillover effects and that there is some trade-off between both. On the other hand
foreign presence and internationalisation may also reinforce each other’s spillover effect. To
test whether there is a trade-off or a reinforcing effect we insert interaction effects between
foreign presence and internationalisation in our specification.
13

4 Results and interpretation
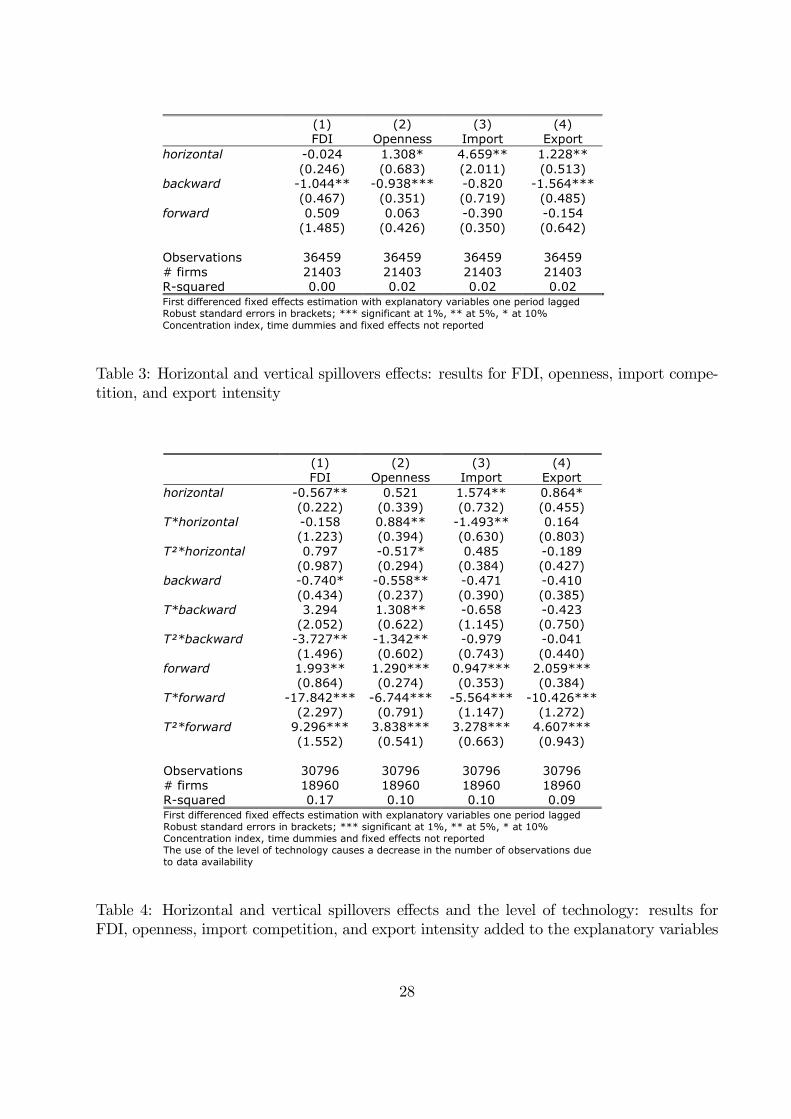
Table 3 presents findings for the most basic specification and shows how firm productivity is
explained by spillover effects. Column 1 shows only a limited impact of FDI spillovers on firm
level productivity, we only find a significant negative impact of the backward spillover vari-
able. The effect of selling inputs to an industry with foreign presence is negative, probably
this is an indication that Romanian firms are unable to adapt themselves to the standards
required. The poor results with respect to FDI spillovers are in line with Merlevede and
Schoors (2007) who show that in order to capture spillover effects accurately a set of charac-
teristics, including e.g. the level of technology, needs to be taken into account. In columns 2
to 4 the FDI versions of the spillover variables are replaced with their counterparts for open-
ness, import competition, and export intensity (i.e. Openness, Mcomp, and Xintensity
and their interindustry transformations). We find significant, positive horizontal effects of
considerable magnitude, especially the presence of import competition seems to enhance do-
mestic firms’ productivity in the same industry. A one standard deviation increase in import
competition results in a 1.5% gain in productivity. With respect to the interindustry effects
we find that supplying inputs to sectors with a higher export intensity seems to be associated
with negative productivity effects.
<insert table 3 here>
<insert table 4 here>
In table 4 we consider our spillover measures and their interaction with the level of tech-
nology, T , and the level of technology squared, T 2, to account for possible non-linearities.
As in table 3 the first column refers to FDI spillovers, columns 2 to 4 refer to the intra-
and interindustry spillover variables for openness, import competition, and export intensity.
Figure 3 displays the implied non-linear relationships of the respective spillovers with the
level of technology (horizontal axis in the subfigures). The forth panel of figure 3 displays a
kernel density estimate of the distribution of the level of technology of the domestic firms in
our sample. Column 1 in table 4 testifies of the importance to take the interaction with the
level of technology into account. For horizontal FDI spillovers we find a significant, negative
level impact, but the effect does not depend on the level of technology of the domestic firm.
The backward FDI spillover is hump-shaped with the least and the most advanced domes-
tic firms experiencing the most negative spillover effects of supplying sectors with foreign
firms. The effect for medium advanced firms is about zero. The interaction of the level of
technology and the forward FDI spillover variable is also highly non-linear, only the least
14

Horizontal effects
-0.3
-0.2
-0.1
0.0
0.1
0.2
0.3
0.4
0.5
0.0 0.1 0.2 0.3 0.4 0.5 0.6 0.7 0.8 0.9 1.0
FDI OpennessImport competition Export intensity
Backward effects
-0.5
-0.4
-0.3
-0.2
-0.1
0.00.0 0.1 0.2 0.3 0.4 0.5 0.6 0.7 0.8 0.9 1.0
FDI OpennessImport competition Export intensity
Forward effects
-2.0
-1.5
-1.0
-0.5
0.0
0.5
1.0
0.0 0.1 0.2 0.3 0.4 0.5 0.6 0.7 0.8 0.9 1.0
FDI OpennessImport competition Export intensity
02
46
Den
sity
0 .25 .5 .75 1Level of technology
All domestic firms
Kernel density estimate
Figure 3: Horizontal, forward and backward effects of FDI, Openness, Import competition,and Export intensity evaluated at their respective average values as a function of the levelof technology - Kernel density estimate of the level of technology for domestic firms
advanced firms benefit from the ability to buy their inputs from foreign firms. The Findlay
hypothesis (cf. supra) seems to be at work here: the least advanced firms have the largest
scope to benefit from spillovers. The kernel density estimate of the level of technology in
figure 3 indicates that a considerable part of the domestic firms experience positive forward
spillovers. As one can infer from figure 3 the results for the horizontal effects for the inter-
nationalisation measures are very different from their FDI counterparts. The level effect of
Openness is insignificant, but the interactions with the level of technology are. The latter im-
ply a slightly increasing positive contribution of openness to firm level productivity.11 Import
competition generates positive spillovers that decrease with an increasing level of technology,
but remain positive. The effect of export intensity is positive and unaffected by the level of
technology. Internationalisation always generates positive intraindustry spillovers. Openness
has a hump-shaped backward spillover effect comparable to FDI. Import competition and
export intensity in columns 3 and 4 show no backward effect. The forward effects of the
three internationalisation variables are comparable to the FDI forward spillover effects and
11The spillover effect remains positive when the level coefficient is set to zero.
15

suggest a Findlay interpretation. Whereas vertical interindustry effects are comparable for
FDI and openness, and to a lesser extent import competition and export intensity, horizon-
tal intraindustry effects of foreign presence and internationalisation are completely different.
Foreign presence generates negative horizontal spillovers, industry level internationalisation
is beneficial for domestic firms.
<insert table 5 here>
<insert table 6 here>
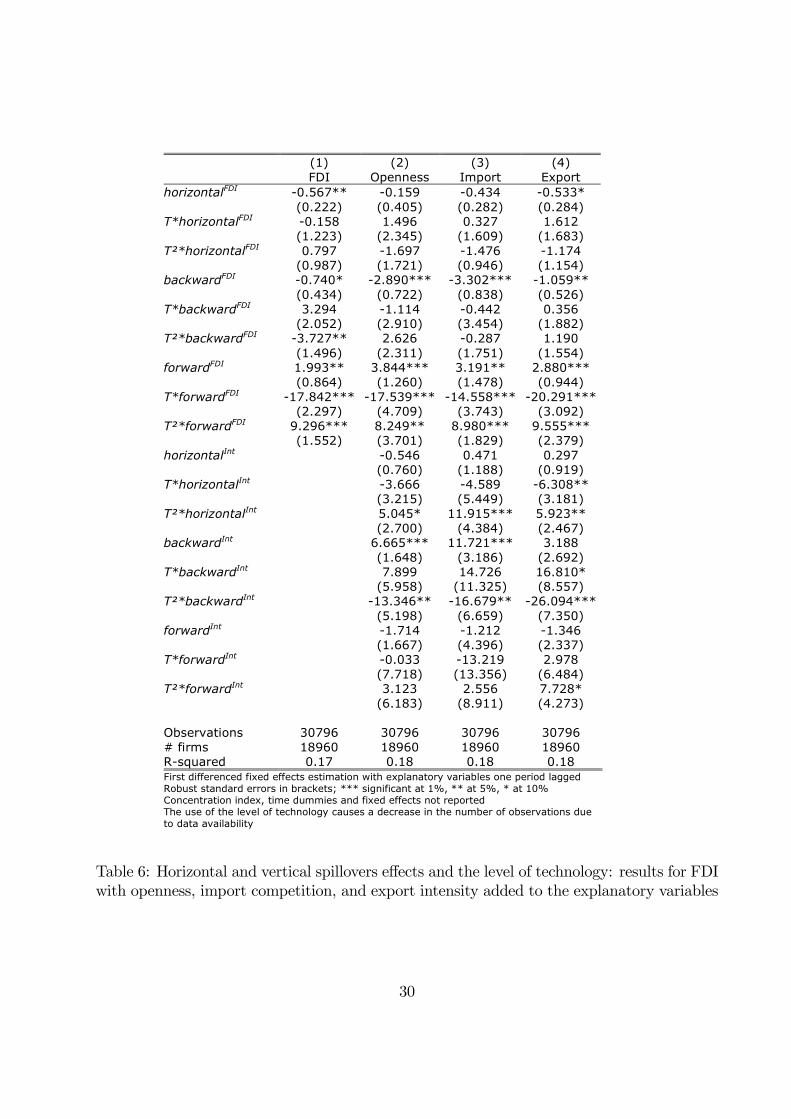
Do these results imply that some of the findings of the FDI spillover literature are falsely
attributed to foreign presence while they actually originate from internationalisation? To
answer this question tables 5 and 6 repeat the specifications of tables 3 and 4 but now add
the internationalisation variables to their FDI counterparts rather than replacing them. The
results in table 5 firmly corroborate our findings of the internationalisation variables in table
3. The significant backward FDI spillover is only robust to the export intensity variables.
Including the latter in a specification makes the horizontal FDI spillover significantly neg-
ative. Possibly this indicates a negative competition effect that is partly offset by a higher
industry export instensity. Table 5 confirms our finding in table 3 that the bulk of possible
productivity gain from level effects originates from intraindustry import competition.
Table 6 contains the results for the interactions with the level of technology and its square.
The addition of the internationalisation variables to the specification makes the borderline
significant, negative horizontal spillover effect insgnificant. Only when including the export
measures in column 4 the horizontal level spillover effect of foreign keeps its borderline signif-
icance. The point estimate of the backward level FDI spillover effect becomes more negative
when backward openness or backward import effects are included. The latters’ positive back-
ward level effect fully offsets the negative FDI spillover, however. Interaction effects with the
level of technology do not seem to matter for backward FDI spillovers; for openness and
import only the squared interaction is significantly negative. In line with table 5 forward
internationalisation effects seem to be completely absent when both measures for foreign
presence and internationalisation are included. The highly significicant non-linear forward
FDI spillovers are robust to the inclusion of the internationalisation measures. The pattern
depicted in figure 3 is confirmed, meaning that only the least advanced firms experience
positive forward FDI spillover effects. However, the larger point estimate of forwardFDI
implies that more firms will benefit than suggested in figure 3. Overall the results in table
5 and 6 imply that the findings of the FDI spillover literature are not falsely attributed to
foreign presence while they actually originate from internationalisation.
16

<insert table 7 here>
In table 7 we add interaction terms to the results in table 5. In columns 2 to 4 the positive
horizontal level effect of the internationalisation measures and the absence of the horizontal
FDI effect is confirmed. The interaction term is significantly negative for the openness and
import competition measures and suggest that the internationalisation effect is smaller for
industries with a larger foreign presence. The intraindustry effects of FDI on the one hand
and openness and import competition on the other thus do not reinforce one another, on the
contrary a larger foreign presence seems to reduce the scope for positive horizontal interna-
tionalisation spillover effects. With respect to the backward FDI variable, we see that the
negative sign in the traditional specification in column 1 switches to a positive sign when
the interactions with internationalisation measures are included (signficant in case of open-
ness and import competition). The three backward internationalisation variables themselves
are signficantly positive, the interaction terms are significantly negative. These coefficients
imply the following pattern: when both FDI and internationalisation are high, backward
spillovers become strongly negative. The most beneficial effects stem from a combination
of limited openness of industries the firm supplies to in combination with a large foreign
presence in those industries. For forward spillovers only the interaction with openness in
column 2 produces significant results. The implied total forward spillover is largely positive,
only when buying inputs from very open industries with a large foreign presence negative
spillovers can be detected. Generally, we find that if interaction effects are signficant, they
are negatively signed and they reduce the positive impact of either the FDI measure, the
internationalisation measure, or both. Clearly foreign presence and internationalisation do
not reinforce one another. The results in table 7 seem to suggest that there is a trade-off be-
tween internationalisation and foreign presence, both with respect to intra and interindustry
effects.
5 Conclusions
This paper investigates the integration of internationalisation in terms of import competition
and export intensity at the industry level into the FDI spillover framework. We review
the possible FDI spillover effects and indicate that whereas this discussion is framed in
terms of the presence of foreign firms, one could likewise frame the discussion in terms of
import competition or export intensity. This is especially valid in an emerging economy
as Romania. Imported goods are unlikely to be of inferior quality than local goods and
exported goods -possibly of inferior quality relative to their western counterparts- will still
17

face a number of quality requirements that makes them superior over goods destined for the
local market. Therefore import competition or export intensity are not unlikely to cause
intra and interindustry productivity spillover effects as well. The question whether the
findings in the FDI spillover literature are falsely attributed to foreign presence while they
actually originate from internationalisation then naturally arises. If not, it is still possible
that internationalisation spillover effects behave in a similar way as FDI spillover effects
and that there is some trade-off between both. On the other hand foreign presence and
internationalisation may also reinforce each other’s spillover effects.
For our empirical analysis we use a carefully contructed dataset of Romanian manufactur-
ing firms based on the Amadeus database by Bureau Van Dijk. We improve upon the previous
FDI spillover literature by constructing dynamic ownership data. Further, our dataset uses
detailed price information at the industry level and a series of yearly input-output tables to
take changes in the economic structure into account.
The following conclusions emerge from our empirical work. Horizontal FDI spillover ef-
fects are found to be negative, but insignificant. Horizontal spillover effects for openness,
import competition, and export intensity are significantly positive. The interaction between
internationalisation and foreign presence suggests that a larger foreign presence in the indus-
try reduces the scope for positive horizontal internationalisation effects for domestic firms.
Vertical or interindustry effects seem to be largely insignificant, except for a possible nega-
tive backward effect, both of foreign presence and internationalisation. Considering possible
interaction effects, we find that when they are signficant, they are negatively signed. Thus,
both for intra and interindustry spillovers, interaction effects between FDI and internation-
alisation reduce the significant positive impact of either the FDI measure, the international-
isation measure, or both. This implies that foreign presence and internationalisation are not
found to reinforce one another. Rather, our results suggest a trade-off between internation-
alisation and foreign presence, both with respect to intra and interindustry effects. When
we introduce the level of technology as a possible firm level determinant of the magnitude
and direction of spillover effects we find that: i) internationalisation always generates pos-
itive intraindustry spillovers, while intraindustry effects of foreign presence are negative or
insignificant; ii) vertical interindustry effects are comparable for FDI on the one hand and
openness, and to a lesser extent import competition and export intensity on the other hand.
Finally, throughout our results we find indications that import competition at the industry
level is more beneficial to domestic firms’ productivity than export intensity at the industry
level. Overall, we find no indication that the findings of the FDI spillover literature are
falsely attributed to foreign presence while they actually originate from internationalisation.
Based on the literature on firm level heterogeneity and participation in international
18

markets that suggests a positive correlation between productivity and internationalisation
one could take a different view on internationalisation. Internalisation could be thought of
as affecting the level of technology and the absorptive capability of a firm. In this view
one should investigate whether the internationalisation variables could play a role similar to
that of the level of technology in our estimations. Unfortunately our dataset is inappropriate
to perform this type of analysis because we only observe import competition and export
intensity at the industry level, not at the firm level. Therefore, this is left for future research.
19

References
Aitken, B. and A. Harrison, 1999, Do Domestic Firms Benefit from Direct Foreign Invest-ment? Evidence from Venezuela, American Economic Review, vol. 89(3), pp. 605-18
Aitken, B., A. Harrison and R. Lipsey, 1996, Wages and Foreign Ownership: A ComparativeStudy of Mexico, Venezuela and the United States, Journal of International Economics,vol. 40, pp.345-71
Bernard, A. and Jensen, B., 1995, Exporters, jobs and wages in US manufacturing: 1976—1987, Brookings Papers on Economic Activity, Microeconomics, pp.67—119.
Bernard, A., Eaton, J., Jensen, B., and Kortum, S., 2003, Plants and Productivity in Inter-national trad’, American Economic Review, Vol.93(3), pp.1268-90
Blalock, G. and P. Gertler, 2003, Firm Capabilities and Technology Adoption: Evidencefrom Foreign Direct Investment in Indonesia, mimeo
Blomström, M., 1986, Foreign Investment and Productive Efficiency: The Case of Mexico,Journal of Industrial Economics, vol.35(1), pp. 97-110
Blomström, M. and F. Sjöholm, 1999, Technology Transfer and Spillovers: Does Local Par-ticipation with Multinationals Matter?, European Economic Review, vol. 43, pp. 915-923
Damijan, J., M. Knell, B. Macjen and M. Rojec, 2003, Technology Transfer through FDI inTop-10 Transition Countries: How important are Direct Effects, Horizontal and VerticalSpillovers?, William Davidson Institute Working Paper No. 459, 29p.
Djankov, S. and B. Hoekman, 2000, Foreign Investment and Productivity Growth in CzechEnterprises, World Bank Economic Review, vol. 14(1), pp. 49-64
Findlay, R., 1978, Relative backwardness, direct foreign investment, and the transfer oftechnology: A simple dynamic model, Quarterly Journal of Economics, vol. 92, pp. 116
Fosfuri, A., M. Motta and T. Rønde, 2001, Foreign Direct Investment and Spillovers throughWorkers’ Mobility, Journal of International Economics, vol. 53(1), pp. 205-22
Girma, S., 2005, Absorptive Capacity and Productivity Spillovers from FDI: A ThresholdRegression Analysis, Oxford Bulletin of Economics and Statistics, vol.67(3), pp. 281-306
Girma, S. and Görg, H., 2005, Foreign Direct Investment, Spillovers and Absorptive Capa-bility: Evidence from Quartile Regressions., The Kiel Institute for the World Economy,Kiel Working Paper: No. 1248
Görg, H. and D. Greenaway, 2003, Much ado about nothing? Do domestic firms reallybenefit from Foreign Direct Investment?, IZA Discussion Paper No. 944, 34p.
Glass, A. and K. Saggi, 1998, International Technology Transfer and the Technology Gap,Journal of Development Economics, vol. 55, pp. 369-98
20

Glass, A. and K. Saggi, 2002, Multinational Firms and Technology Transfer, ScandinavianJournal of Economics, vol. 104(4), pp. 495-513
Greenaway, D. and Kneller, R., 2007, Firm Heterogeneity, Exporting and Foreign DirectInvestment, Economic Journal, vol.117, pp.F134—F161
Griliches, Z. and J. Mairesse, 1995, Production Functions: The Search for Identification,NBER Working Paper No. 5067, 40 p.
Helpman, E., Melitz, M. and Yeaple, S., 2004, Export versus FDI , American EconomicReview, vol. 94, pp. 300-16
Kinoshita, Y., 2001, R&D and Technology Spillovers through FDI: Innovation and Absorp-tive Capacity, CEPR Discussion Paper No. 2775
Kokko, A., 1994, Technology, Market Characteristics, and Spillovers, Journal of DevelopmentEconomics, vol. 43, pp. 279-93
Kokko, A., 1996, Productivity Spillovers from Competition between Local Firms and ForeignAffiliates, Journal of International Development, vol. 8, pp. 517-30
Kokko, A., R. Tansini and M. Zejan, 1996, Local Technological Capability and ProductivitySpillovers from FDI in the Uruguayan Manufacturing Sector, The Journal of Develop-ment Studies, vol. 32(4), pp. 602-11
Konings, J., 2001, The Effects of Foreign Direct Investment on Domestic Firms - Evidencefrom Firm-Level Panel Data in Emerging Economies, Economics of Transition, vol. 9(3),pp. 619-33
Lall, S., 1980, Vertical Interfirm Linkages in LDCs: An Empirical Study, Oxford Bulletin ofEconomics and Statistics, vol. 42, pp. 203-26
Levinsohn, J. and A. Petrin, 2003, Estimating Production Functions Using Inputs to Controlfor Unobservables, Review of Economic Studies, Vol. 70, pp. 317-41
Markusen, J., 1995, The Boundaries of Multinational Enterprises and the Theory of Inter-national Trade, Journal of Economic Perspectives, vol.9(2), pp.169-89
McAleese, D. and D. McDonald, 1978, Employment Growth and Development of Linkages inForeign-owned and Domestic Manufacturing Enterprises, Oxford Bulletin of Economicsand Statistics, vol. 40, pp. 321-39
Melitz, 2003, ’The impact of trade on intra-industry reallocations and aggregate industryproductivity’, Econometrica, Vol 71, 1695-1725.
Merlevede, B. and K. Schoors, 2007, FDI and the Consequences Towards More CompleteCapture of Spillover Effects, William Davidson Institute Working Paper No. 886
Nickell, S., 1996, Competition and Corporate Performance, Journal of Political Economy,vol. 104(4), pp. 724-46
21

Olley, G. and A. Pakes, 1996, The Dynamics of Productivity in the TelecommunicationsEquipment Industry, Econometrica, Vol. 64(6), pp. 1263-97
Petrin, A., B. Poi and J. Levinsohn, 2004, Production Function Estimation in Stata UsingInputs to Control for Unobservables, The Stata Journal, vol. 4(2), pp. 113-23
Rodríguez-Clare, A., 1996, Multinationals, Linkages, and Economic Development, AmericanEconomic Review, vol. 86(4), pp. 852-73
Rodrik, D., 1999, The New Global Economy and Developing Countries: Making Opennesswork, Overseas Development Council (Baltimore, MD), Policy Essay No. 24.
Schoors, K. and B. Van Der Tol, 2002, Foreign Direct Investment Spillovers within andbetween industries: Evidence from Hungarian Data, Ghent University Working Paper02/157, available on line
Sinani, E. and K. Meyer, 2004, Spillovers of technology transfer from FDI: The case ofEstonia, Journal of Comparative Economics, vol. 32, pp. 445-66
Sjöholm, F., 1999, Technology Gap, Competition and Spillovers from Foreign Direct Invest-ment: Evidence from Establishment Data, Journal of Development Studies, vol. 36(1),pp. 53-73
Smarzynska Javorcik, B., 2004, Does Foreign Direct Investment Increase the Productivityof Domestic Firms? In Search of Spillovers Through Backward Linkages, AmericanEconomic Review, Vol. 94(3), pp.605-27
Smarzynska Javorcik, B. and M. Spatareanu, 2003, To Share or not to Share: Does LocalParticipation Matter for Spillovers from Foreign Direct Investment, World Bank PolicyResearch Paper No. 3118, 28p.
Teece, D. (1977), Technology Transfer by Multinational Firms: The Resource Cost of Trans-ferring Technological Know-how, Economic Journal, vol. 87, pp. 242-61
Yudaeva, K., K. Kozlov, N. Melentieva and N. Ponomareva, 2003, Does Foreign OwnershipMatter? Russian Experience, Economics of Transition, vol. 11(3), pp. 383-410
Zukowska-Gagelmann, K., Productivity Spillovers From Foreign Direct Investment In
Poland,Economic Systems, vol. 24(3)
22

APPENDIX A: Production function estimation
We estimate the following production function sector by sector to derive sector-specific
labor and capital intensities.
∀j : lnV Airt = β0 + βl lnLirt + βk lnKirt + ωt + ηt (13)
where subscripts irt stand for firm i and region r at time t, and j stands for sector j. V A
stands for real value added of the firm, L is the freely variable input labor and K is the state
variable capital. The error has two components, the transmitted productivity component
given as ω, and η, an error term that is uncorrelated with input choices. The key difference
between ω and η is that the former is a state variable and hence impacts the firm’s decision
rules. ω is not observed by the econometrician; instead the firm immediately adjusts its
freely variable input L in response. We focus on value added rather than sales because it
is a better measure of firm performance. Consider the following version where small cases
refer to variables in logs and firm and region subscripts have been dropped.
vat = β0 + βllt + βkkt + ωt + ηt (14)
Levinsohn and Petrin (2003) start by assuming that the demand for the intermediate
input, materials mt, depends on the firm’s state variables kt and ωt:
mt = mt (kt, ωt) (15)
Making mild assumptions about the firm’s production technology, it can be shown that the
demand function is monotonically increasing in ωt. This allows inversion of the intermediate
demand function, so ωt can be written as a function of kt and mt.12
ωt = ωt (kt,mt) (16)
The unobservable productivity term is now expressed solely as a function of two observed
inputs. Following Olley and Pakes (1996), Levinsohn and Petrin (2003) make a final identifi-
12Due to possible correlation with labor and capital, direct FDI participation in the firm may distortthe estimation. We focus here solely on domestic firms. What about the spillovers? Since we estimate aproduction function for each sector separately and because the spillover variables are sector-specific, there isonly variation in the time dimension. The correlation between spillover variables on one hand, and labor andcapital on the other, is fairly low (below 0.2 for almost all spillovers in all sectors). Furthermore, the possiblecorrelation will to some extent be accounted for in the analysis. If ωt is a function of foreign presence, thiswill be reflected in material input choice as mt = mt (kt, ωt (foreign)). The inverted function would readωt = ωt (kt,mt (foreign)).
23

cation restriction by assuming that productivity is governed by a first-order Markov process:
ωt = E [ωt|ωt−1] + ξt (17)
where ξt is an innovation to productivity that is uncorrelated with kt (but not necessarily
with lt; this is part of the source of the simultaneity problem). The estimation routine itself
starts with transforming (14).
vat = β0 + βllt + βkkt + ωt + ηt (18)
= βllt + φt (kt,mt) + ηt
where
φt (kt,mt) = β0 + βkkt + ωt (kt,mt) (19)
By substituting a third-order polynomial approximation in kt and mt for φt (kt,mt), it is
possible to consistently estimate parameters as
vat = δ0 + βllt +3X
g=0
3−hXh=0
δghkgtm
ht + ηt (20)
where β0 is not separately identified from the intercept of φt (kt,mt). This completes the first
stage of the estimation routine from Levinsohn and Petrin (2003), from which an estimate
of βl and an estimate of φt (up to the intercept) are available. The second stage of the
estimation procedure begins by computing the estimated value for φt using
bφt = cvat − bβllt (21)
= bδ0 + 3Xi=0
3−iXj=0
cδijkitmjt (22)
For any candidate values β∗k , one can compute (up to a scalar constant) a prediction for ωt
for all periods t using bωt = bφt − β∗kkt (23)
Taking the bωt’s for all t, a consistent (non-parametric) approximation to E [ωt|ωt−1], say
Eh dωt|ωt−1
i, is given by the predicted values from the regression
bωt = γ0 + γ1bωt−1 + γ2bω2t−1 + γ3bω3t−1 + εt (24)
Given bβl, β∗k, and E h dωt|ωt−1ithe sample residual of the production function can be written
24

as dηt + ξt = vat − bβllt − β∗kkt −Eh dωt|ωt−1
i(25)
The estimate bβk of βk can then be defined as the solution to13minβ∗k
Xt
³vat − bβllt − β∗kkt − E
h dωt|ωt−1i´2
(26)
Since each of the two main stages of estimation involves a number of preliminary estima-
tors, the covariance matrix of the final parameters must account for the sampling variation
introduced by all of the estimators used in the two stages. Although deriving an analytic
covariance matrix may be feasible, this calculation is not trivial. Instead, Levinsohn and
Petrin (2003) substitute computational power for analytic difficulties, employing the boot-
strap method to estimate standard errors.14
For the estimation the data are taken from the Amadeus database, described in the main
text. Value added is calculated as real output Y , measured as sales deflated by producer price
indices of the appropriate Nace industry minus real material inputM , measured as material
costs deflated by a weighted intermediate input deflator where the industry-specific weighting
scheme is drawn from the IO tables. Labor L is expressed as the number of employees. Real
capitalK is measured as fixed assets, deflated by the average of the deflators for the following
five Nace industries: machinery and equipment (29); office machinery and computing (30);
electrical machinery and apparatus (31); motor vehicles, trailers, and semi-trailers (34); and
other transport equipment (35). This approach follows Smarzynska Javorcik (2004).
13A golden-section search algorithm is used to minimize (26).14Given the use of panel data, sampling occurs with replacement from firms, using the entire time series
of observations for that firm in the bootstrapped sample when the firm’s ID-number is randomly drawn. Abootstrapped sample is complete when the number of firm-year observations (closely) equals the number offirm-year observations in the original sample. The variation in the point estimates across the bootstrappedsamples provides an estimate for the standard errors of the original point estimates (see Petrin et al., 2004).
25

APPENDIX B: Nace code conversion
Romanian national
code
Description NACE rev.1.1
07 Coal mining and processing (including bituminous shale and sands)
10
08 Extraction of petroleum (including auxiliary services) 11.1 09 Extraction of natural gas (including auxiliary services) 11.1 11 Ferrous ores quarrying and processing 13.1 12 Non-ferrous ores quarrying and processing 13.2 13 Extraction of building material ores 14.1 14 Extraction of clay and sand 14.2 15 Extraction and processing of chemical ores 14.3 16 Extraction and processing of salt 14.4 17 Other non-ferrous ores quarrying and processing 14.5 18 Meat production and processing 15.1 19 Processing and preserving of fish and fish products 15.2 20 Processing and preserving of fruits and vegetables 15.3 21 Production of vegetal and animal oil and fat 15.4 22 Production of milk products 15.5 23 Production of milling products, starch and starch products 15.6 24 Manufacture of fodder 15.7 25 Processing of other food products 15.8 26 Beverages 15.9 27 Tobacco products 16.0 28 Textile industry 17 29 Textile clothing 18.2 30 Manufacture of leather and fur clothes 18.1+18.3 31 Footwear and other leather goods 19 32 Wood processing (excluding furniture) 20
33 Pulp, paper and cardboard; related items 21.1+21.2 34 Publishing, printing and reproduction of recorded media 22 35 Coking 23.1 36 Crude oil processing 23.2 38 Basic chemical products 24.1 39 Pesticides and other agrochemical products 24.2 40 Dyes and varnishes 24.3 41 Medicines and pharmaceutical products 24.4 42 Soaps, detergents, upkeeping products, cosmetics, perfumery 24.5 43 Other chemical products 24.6 44 Synthetic and man made fibres 24.7 45 Rubber processing 25.1
26

Romanian national
code
Description NACE rev.1.1
46 Plastic processing 25.2 47 Glass and glassware 26.1 48 Processing of refractory ceramics (excluding building items) 26.2 49 Ceramic boards and flags 26.3 50 Brick, tile and other building material processing 26.4 51 Cement, lime and plaster 26.5 52 Processing of concrete, cement and lime items 26.6 53 Cutting, shaping and finishing of stone 26.7 54 Other non-metallic mineral products 26.8 55 Metallurgy and ferroalloys processing 27.1 56 Manufacture of basic precious and non-ferrous metals 27.2 57 Other metallurgy products 27.3 58 Precious metals and other non-ferrous metals 27.4 59 Foundry 27.5 60 Metal structures and products 28
61 Manufacture of equipment for producing and using of mechanical power (except for plane engines, vehicles and motorcycles)
29.1
62 Machinery for general use 29.2 63 Agricultural and forestry machinery 29.3 64 Machine tools 29.4 65 Other machines for special use 29.5 66 Armament and ammunition 29.6 67 Labour-saving devices and domestic machinery 29.7 68 Computers and office means 30 69 Electric machinery and appliances 31 70 Radio, TV-sets and communication equipment and apparatus 32
71 Medical, precision, optical, watchmaking instruments and apparatus 33
72 Means of road transport 34 73 Naval engineering and repair 35.1
74 Production and repair of railway transport means and rolling equipment 35.2
75 Aircraft engineering and repair 35.3
76 Motorcycles, bicycles and other transport means (including cripple transport means) 35.4
77 Furniture 36.1 78 Other industrial activities 36.2→36.6
27
(1) (2) (3) (4) FDI Openness Import Export horizontal -0.024 1.308* 4.659** 1.228** (0.246) (0.683) (2.011) (0.513) backward -1.044** -0.938*** -0.820 -1.564*** (0.467) (0.351) (0.719) (0.485) forward 0.509 0.063 -0.390 -0.154 (1.485) (0.426) (0.350) (0.642) Observations 36459 36459 36459 36459 # firms 21403 21403 21403 21403 R-squared 0.00 0.02 0.02 0.02 First differenced fixed effects estimation with explanatory variables one period lagged Robust standard errors in brackets; *** significant at 1%, ** at 5%, * at 10% Concentration index, time dummies and fixed effects not reported
Table 3: Horizontal and vertical spillovers effects: results for FDI, openness, import compe-tition, and export intensity
(1) (2) (3) (4) FDI Openness Import Export horizontal -0.567** 0.521 1.574** 0.864* (0.222) (0.339) (0.732) (0.455) T*horizontal -0.158 0.884** -1.493** 0.164 (1.223) (0.394) (0.630) (0.803) T²*horizontal 0.797 -0.517* 0.485 -0.189 (0.987) (0.294) (0.384) (0.427) backward -0.740* -0.558** -0.471 -0.410 (0.434) (0.237) (0.390) (0.385) T*backward 3.294 1.308** -0.658 -0.423 (2.052) (0.622) (1.145) (0.750) T²*backward -3.727** -1.342** -0.979 -0.041 (1.496) (0.602) (0.743) (0.440) forward 1.993** 1.290*** 0.947*** 2.059*** (0.864) (0.274) (0.353) (0.384) T*forward -17.842*** -6.744*** -5.564*** -10.426*** (2.297) (0.791) (1.147) (1.272) T²*forward 9.296*** 3.838*** 3.278*** 4.607*** (1.552) (0.541) (0.663) (0.943) Observations 30796 30796 30796 30796 # firms 18960 18960 18960 18960 R-squared 0.17 0.10 0.10 0.09 First differenced fixed effects estimation with explanatory variables one period lagged Robust standard errors in brackets; *** significant at 1%, ** at 5%, * at 10% Concentration index, time dummies and fixed effects not reported The use of the level of technology causes a decrease in the number of observations due to data availability
Table 4: Horizontal and vertical spillovers effects and the level of technology: results forFDI, openness, import competition, and export intensity added to the explanatory variables
28

(1) (2) (3) (4) FDI Openness Import Export horizontalFDI -0.024 -0.152 -0.221 -0.266* (0.246) (0.194) (0.247) (0.158) backwardFDI -1.044** -0.840 -0.710 -1.401** (0.467) (0.536) (0.517) (0.671) forwardFDI 0.509 1.864 0.586 1.528 (1.485) (1.191) (1.175) (1.231) horizontalInt 1.462** 4.841** 1.421** (0.692) (1.927) (0.650) backwardInt -1.021*** -0.782 -1.740*** (0.348) (0.696) (0.469) forwardInt 0.154 -0.404 -0.567 (0.347) (0.336) (0.511) Observations 36459 36459 36459 36459 # firms 21403 21403 21403 21403 R-squared 0.00 0.03 0.02 0.03 First differenced fixed effects estimation with explanatory variables one period lagged Robust standard errors in brackets; *** significant at 1%, ** at 5%, * at 10% Concentration index, time dummies and fixed effects not reported
Table 5: Horizontal and vertical spillovers effects: results for FDI with openness, importcompetition, and export intensity added to the explanatory variables
29
(1) (2) (3) (4) FDI Openness Import Export horizontalFDI -0.567** -0.159 -0.434 -0.533* (0.222) (0.405) (0.282) (0.284) T*horizontalFDI -0.158 1.496 0.327 1.612 (1.223) (2.345) (1.609) (1.683) T²*horizontalFDI 0.797 -1.697 -1.476 -1.174 (0.987) (1.721) (0.946) (1.154) backwardFDI -0.740* -2.890*** -3.302*** -1.059** (0.434) (0.722) (0.838) (0.526) T*backwardFDI 3.294 -1.114 -0.442 0.356 (2.052) (2.910) (3.454) (1.882) T²*backwardFDI -3.727** 2.626 -0.287 1.190 (1.496) (2.311) (1.751) (1.554) forwardFDI 1.993** 3.844*** 3.191** 2.880*** (0.864) (1.260) (1.478) (0.944) T*forwardFDI -17.842*** -17.539*** -14.558*** -20.291*** (2.297) (4.709) (3.743) (3.092) T²*forwardFDI 9.296*** 8.249** 8.980*** 9.555*** (1.552) (3.701) (1.829) (2.379) horizontalInt -0.546 0.471 0.297 (0.760) (1.188) (0.919) T*horizontalInt -3.666 -4.589 -6.308** (3.215) (5.449) (3.181) T²*horizontalInt 5.045* 11.915*** 5.923** (2.700) (4.384) (2.467) backwardInt 6.665*** 11.721*** 3.188 (1.648) (3.186) (2.692) T*backwardInt 7.899 14.726 16.810* (5.958) (11.325) (8.557) T²*backwardInt -13.346** -16.679** -26.094*** (5.198) (6.659) (7.350) forwardInt -1.714 -1.212 -1.346 (1.667) (4.396) (2.337) T*forwardInt -0.033 -13.219 2.978 (7.718) (13.356) (6.484) T²*forwardInt 3.123 2.556 7.728* (6.183) (8.911) (4.273) Observations 30796 30796 30796 30796 # firms 18960 18960 18960 18960 R-squared 0.17 0.18 0.18 0.18 First differenced fixed effects estimation with explanatory variables one period lagged Robust standard errors in brackets; *** significant at 1%, ** at 5%, * at 10% Concentration index, time dummies and fixed effects not reported The use of the level of technology causes a decrease in the number of observations due to data availability
Table 6: Horizontal and vertical spillovers effects and the level of technology: results for FDIwith openness, import competition, and export intensity added to the explanatory variables
30

(1) (2) (3) (4) FDI Openness Import Export horizontalFDI -0.024 0.289 0.474 -0.384 (0.246) (0.340) (0.326) (0.301) horizontalFDI*Int -1.590** -3.979*** -0.541 (0.738) (1.464) (1.055) horizontalInt 1.948*** 6.779*** 1.592*** (0.615) (1.977) (0.560) backwardFDI -1.044** 3.039** 4.333** 1.552 (0.467) (1.410) (1.777) (1.018) backwardFDI*Int -11.359*** -26.359*** -17.451*** (3.503) (8.978) (4.616) backwardInt 1.567** 4.182*** 2.229** (0.741) (1.463) (1.001) forwardFDI 0.509 4.552* 4.052 1.777 (1.485) (2.666) (2.593) (1.950) forwardFDI*Int -6.976* -7.763 -6.595 (4.024) (5.957) (5.265) forwardInt 1.361** 1.312 0.545 (0.634) (0.935) (0.976) Observations 36459 36459 36459 36459 # firms 21403 21403 21403 21403 R-squared 0.00 0.03 0.03 0.04 First differenced fixed effects estimation with explanatory variables one period lagged Robust standard errors in brackets; *** significant at 1%, ** at 5%, * at 10% Concentration index, time dummies and fixed effects not reported
Table 7: Horizontal and vertical spillovers effects: results for FDI with openness, importcompetition, and export intensity and their interactions added to the explanatory variables
31