Embed Size (px)
Citation preview

1
Fatigue Testing of Welded Flat Head Pressure Vessel Joints
Chris HinnantPaulin Research Group
Houston, TX
2007 ASME PVP ConferenceSan Antonio, TX
July 25, 2007

2
• Previous work included 19 failures in 5 test vessels with flat heads. (Hinnant - PVP2006-ICPVT11-93967)
• Questions from previous testing:
1. Thickness effects – do very thin plates exhibit much greater fatigue lives?
2. Did testing in tap water adversely affect testing?
Previous Experimental Work to Date

3
Description of Tests

4
• Cyclic fatigue tests of cylindrical shells with flat heads attached using full penetration welds
• Carbon steel used for all new specimens
• TIG, GMAW, FCAW welding processes
• ASME certified welders and fabrication facilities
Test Specimens

5
Two specimens welded together & tested simultaneously
Test Specimens

6
• R=0, cycle between zero and max pressure
• “Thin” test was conducted using water.
• All other tests utilized only compressed air.
• Failures were repaired and testing continued if possible
• Pressure range produces structural stress < 2*Sy
Experimental Procedure

7
• Concrete castings inserted into test specimens to reduce free air volume and minimize cycle time.
• Air was preheated and filtered to prevent accumulation of condensate.
Experimental Procedure – Air Tests
8
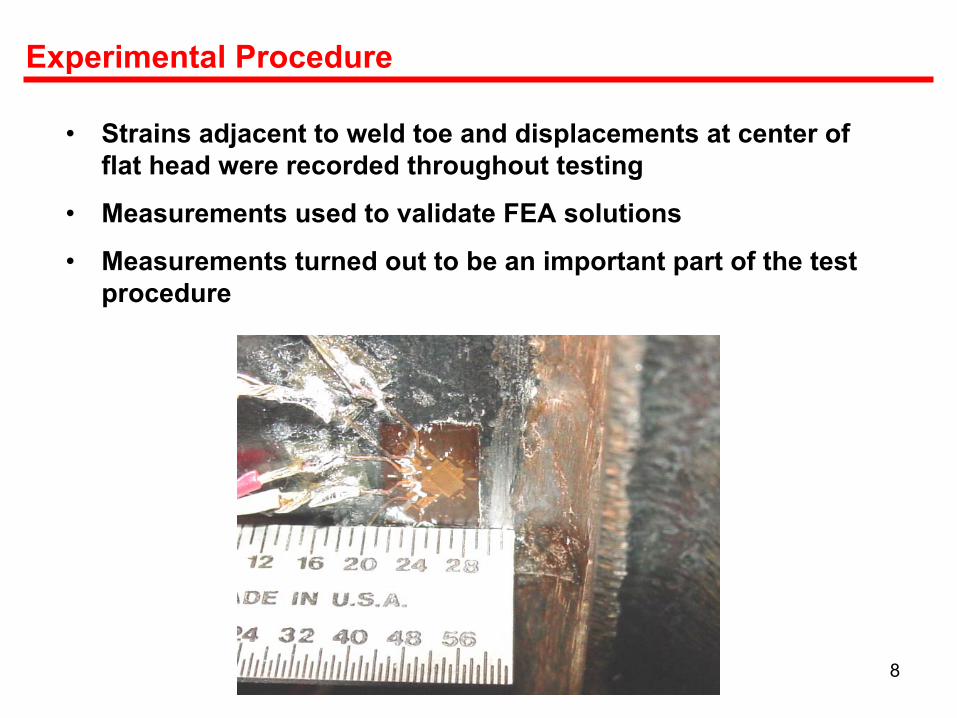
• Strains adjacent to weld toe and displacements at center of flat head were recorded throughout testing
• Measurements used to validate FEA solutions
• Measurements turned out to be an important part of the test procedure
Experimental Procedure

9
• Thru thickness crack with leakage
• Failures originated at weld toe on inside surface and extended to weld toe at outside surface.
• Additional failures which occurred adjacent to fatigue repairs are not included in results.
Failure Criteria

10
Fatigue Design Methods
11
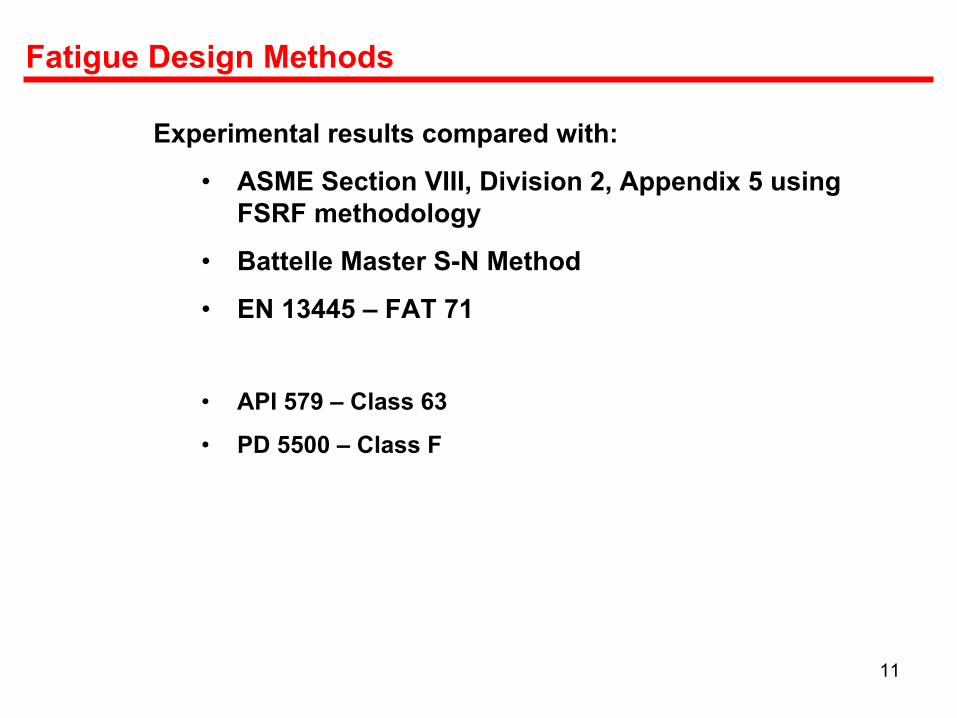
Experimental results compared with:
• ASME Section VIII, Division 2, Appendix 5 using FSRF methodology
• Battelle Master S-N Method
• EN 13445 – FAT 71
• API 579 – Class 63
• PD 5500 – Class F
Fatigue Design Methods

12
• Axisymmetric models used to determine stresses
• Linear elastic FEA used for all tests.
• To account for geometric stiffening, large displacement theory was used to analyze specimens #3 & #4
• As-built dimensions were used in all calculations.
Fatigue Design Methods

13
Fatigue Design Methods – ASME VIII-2 (FSRF = 2.15)

14
Fatigue Design Methods – Battelle Master S-N

15
Fatigue Design Methods – EN 13445 (FAT 71)

16
• Success of ASME FSRF method is dependent upon selection of an accurate FSRF
• Excluding Master S-N Method, plasticity correction factors are not used since structural stress range < 2*Sy
• For the Battelle Master S-N method, plasticity correction factors are applied for structural stress > 1.0*Sy
• Tests #1 & #2 (thin plate) were corrected for tap water environment by a factor of 1.35 on life.
Some notes on fatigue calculations

17
Thickness Effects

18
• Nearly all PRG data is below Battelle mean curve – could be improved by adjustment of thickness correction factor.
• Master S-N Method’s thickness correction factor provides significantly increased fatigue lives for very thin plates.
Thickness Effects

19
• Test specimens #1 & #2 were constructed with 0.055” (1.4 mm) thick plate to evaluate thickness effect.
• Test showed that the thickness correction factor is over estimated for “thin” test specimens #1 & #2.
• Actual fatigue life increase = 174%
• Master S-N predicted life increase = 247%
• Not a closed issue – further investigations planned
Thickness Effects

20
• Branco, et.al. tested similar thicknesses and concluded that a part of the fatigue life increase is attributed to better quality welds (TIG vs. MIG)
• They also reported over prediction of thin plates using a similar thickness correction method.
Thickness Effects – Other results…

21
• DeJesus tests suggest thickness effects are less significant in thin plate failing at low cycles.
• Research by Gurney suggest thickness correction extends into lower thicknesses, but a limit does exist.
• Thickness effect may collapse at high stress levels in bending dominant stress fields.
Thickness Effects – other results…

22
Geometric Effects

23
Geometric Effects
• For specimens #3 & #4, a slightly thinner flat head was used.
• The flat head was sufficiently thin to induce geometric stiffening to occur.
• As a result, the stress range and displacement was less than would be predicted by small displacement theory.
• For an “apples to apples” comparison, we need the actual elastic stress range experienced by the weld joint during testing.
• It would be incorrect to use the results for a linear elastic FEA solution with small displacement theory.

24
Geometric Effects
Time
Stress
Disp.
Cycles to Failure
Linear FEA
Linear FEA
Experiment Experiment
Stress
• Geometric stiffening results in decreased displacement and decreased stress range for the same load
• Linear elastic FEA over estimates the stress range, resulting indevelopment of non-conservative fatigue design curves.

25
Geometric Effects
• Measured stress is over predicted by 21%
• Displacement is over predicted 46%
63,920 psi50,340 psi52,740 psi
Stress Value
121%FEA Small Displacement Theory95%FEA Large Displacement Theory
Strain Measurementsvs. Measured
0.2426”0.1936”0.165”
Displacement
146%FEA Small Displacement Theory117%FEA Large Displacement Theory
Measurementsvs. Measured

26
Environmental Effects

27
Environmental Effects
• All 2006 tests and two new tests were conducted using Houston tap water.
• PVP 2006 - It was hypothesized that environmental effects were responsible for the test data consistently falling below Master S-N mean curve.
• Four additional tests were completed and tested in air to determine the environmental factor.
• NOTE - Environmental factor is only applicable to room temperature tap water at PRG lab in Houston, TX.

28
Environmental Effects
The environmental effect is estimated by:
1. Determine mean curve for tests conducted in water.
2. Determine mean curve for tests conducted in air.
3. Environmental effect is the ratio of the lives for a specified stress level
Cycles
Stress Air Tests
Water Tests
NaNw
NwNaFen =

29
Environmental Effects
Four environmental factors were calculated…
• Two stress methods were used: Structural Stress and Equivalent Structural Stress.
• Two approaches were used to bound the possible range of environmental factors: “strict” and “relaxed”.
• “Strict” compares only welds and tests that are very similar.
• “Relaxed” compares most all results.

30
Observed Environmental Effects
FenStress MethodCase
1.308Equivalent Structural StressRelaxed
1.136Structural StressRelaxed
1.302Equivalent Structural StressStrict
1.356Structural StressStrict
Conclusion – environmental effects for room temperature Houston tap water are minimal.

31
Summary of Testing

32
Summary of Testing
A total of 43 unique failures in 11 pressure vessels
Mean curve for structural stress definition :
(STD DEV = 0.217)
Mean curve for Master S-N Equivalent Structural Stress :
(STD DEV = 0.212)

33
Summary of Testing
Best fit for experimental data is FAT 82, slightly higher than the designated FAT 71 in EN 13445

34
Summary of Testing to Date
Experimental mean curve is approximately one standard deviation below Battelle Master S-N mean curve.

35
Summary of Testing
• Best fit FSRF for all PRG tests is 1.80.
• Less than 2.0 as per WRC 432 & 2007 ASME VIII-2

36
2007 ASME VIII-2
Welded Fatigue Method

37
2007 ASME Section VIII-2 Welded Fatigue Method
2007 ASME Section VIII Division 2 rules differ slightly from stress definition used in Battelle database:
• Thickness cut-off to eliminate increased life below 16 mm (0.625”)
• Mean stress correction
• Requires that operating environment be considered

38
2007 ASME Section VIII-2 Welded Fatigue Method• The following illustrates the difference in the stress definition
between Battelle EQ. SS and 2007 ASME VIII-2
• 2007 ASME increases stress range from 28% to 40%.

39
2007 ASME Section VIII-2 Welded Fatigue MethodThe following are the experimental failures with an Fen of 1.35 applied to tests using tap water

40
2007 ASME Section VIII-2 Welded Fatigue MethodThe following are the experimental failures with an Fen of 4.0 applied to all data points (default per 2007 VIII-2).

41
Conclusions

42
Testing Considerations
• PVP 2006 tests agree with recent tests reported here.
• 43 failures have been documented and reported.
• Mean curve shows EN & ASME FSRF to be conservative.
• Mean curve of test data is one standard deviation below mean curve of Master S-N Method.
• Geometric effects in testing must be properly addressed.
• Environmental effects of Houston tap water are minimal.
• Master S-N thickness correction factor over predicted fatigue life of very thin plate
• 2007 ASME VIII-2 includes a lower limit on the correction factor

43
Questions?
Available for download at:
www.paulin.com