Embed Size (px)
Citation preview
Fatigue life assessment of potential weld improvement techniques using
3D fracture analysis
NIKOLA MRDJANOV
Master of Science Thesis in Lightweight Structures
Dept of Aeronautical and Vehicle Engineering Stockholm, Sweden 2014

Fatigue life assessment of potential
weld improvement techniques using 3D fracture analysis
Nikola Mrdjanov
Master of Science Thesis TRITA-AVE 2014:04 ISSN 1651-7660 KTH Industrial Engineering and Management
Lightweight Structures SE-100 44 STOCKHOLM

Master of Science Thesis TRITA-AVE 2014:04 ISSN 1651-7660
Fatigue life assessment of potential weld
improvement techniques using 3D fracture analysis
Nikola Mrdjanov
Approved
Examiner
Zuheir Barsoum
Supervisor
Zuheir Barsoum
Commissioner
Contact person
Abstract
This thesis work was done in conjunction with the VINNOVA-funded research and development
project LIGHTSTRUCT. It was performed in the department of lightweight structures at KTH.
The thesis investigated two potential weld improvement techniques called toe weaving and
extended leg. These methods use double pass welding in order to create favorable weld
geometries in order to improve the fatigue life. The toe weaving technique produces a wavy weld
toe line that should induce a specific crack growth behavior, while the extended leg technique
has a straight toe line and will provide a smoother transition between weld and baseplate. The
investigation was done by performing 3D fracture analyses of the weld geometries as well as
fatigue tests on manually welded cruciform joints. Both simulations and fatigue tests showed a
slight fatigue life improvement for both techniques. A high variation in fatigue lives was
observed in testing, mostly due to the prevalence of undercut defects. The specific crack growth
for the toe weaved specimens could not be observed as in previous studies. The fatigue life
enhancement was therefore most likely due to a smoother weld transition between weld and
baseplate, reducing the stress concentration factor at the weld toe. The weaving technique is not
suitable for welded joints loaded in the longitudinal direction, making its use more limited
compared to the extended leg technique. From a production point of view, the toe weaving
technique is more time and knowledge demanding than the extended leg technique. It is therefore
recommended to further investigate the extended leg technique.

Preface
I would like to thank my supervisors:
Zuheir Barsoum, PhD, Sr Lecturer, KTH – Lightweight Structures.
Thomas Holmstrand, PhD student, KTH – Lightweight Structures.
for their support and guidance throughout the whole master thesis, making it a very valuable
experience.
I would also like to thank Ayjwat Bhatti and Mansoor Khurshid, PhD students at KTH
Lightweight structures for their inputs and interesting discussions. Finally I would like to thank
the whole research group for making the time during the thesis enjoyable as well.
Stockholm, April 2014
Nikola Mrdjanov
Table of Contents
1. Introduction ............................................................................................................................. 5
1.1. Background ....................................................................................................................... 5
1.2. Purpose ............................................................................................................................. 5
1.3. Methods ............................................................................................................................ 6
1.4. Improvement techniques ................................................................................................... 6
1.5. Toe weaving ..................................................................................................................... 9
1.6. Extended leg ................................................................................................................... 11
1.7. Fatigue life assessment methods..................................................................................... 12
2. Test specimens & destructive testing .................................................................................... 14
2.1. Test specimens ................................................................................................................ 14
2.2. Fatigue Testing ............................................................................................................... 15
3. Methods ................................................................................................................................. 16
3.1. Geometry ........................................................................................................................ 16
3.2. Critical Plane .................................................................................................................. 16
3.3. Franc3D/NG ................................................................................................................... 23
3.4. 3D Fracture modeling ..................................................................................................... 25
4. Results ................................................................................................................................... 28
4.1. Critical plane ................................................................................................................... 28
4.2. 3D Fracture analysis ....................................................................................................... 29
4.3. Fatigue life calculations .................................................................................................. 32
4.4. Fatigue testing and post evaluation ................................................................................ 34
5. Discussion ............................................................................................................................. 37
6. Conclusions ........................................................................................................................... 38
7. References ............................................................................................................................. 39

Abbreviations
FAT Fatigue strength at 2 million cycles
FEM Finite Element Method
FE Finite Element
FEA Finite Element Analysis
GMAW Gas Metal Arc Welding
HFMI High Frequency Mechanical Impact
LCC Life Cycle Cost
LEFM Linear Elastic Fracture Mechanics
SIF Stress Intensity Factor
TIG Tungsten Inert Gas
UT/UIT Ultra sonic Treatment /Impact Treatment
5
1.Introduction 1.1. Background
There is a need for manufacturing companies to constantly improve their products to stay
competitive but also meet ever increasing environmental demands. This is also the case for
companies that produce products that are welded, products used in for instance construction,
mining and loading industries. A result of that has been an increased use of high strength
steels for weight reduction, development of welding processes for better quality control and
reduction of production cost. Welding gives rise to residual stresses, local discontinuities and
defects that have a great impact on the performance of the welded structures. This is the case
especially when new materials and processes are implemented into production. Several
Nordic welding research projects have been conducted during the last 20 years, investigating
these subjects with the main aim of optimizing the fatigue life and the design of welded
structures. [1] This Master thesis is done in conjunction with a VINNOVA-funded national
research project called LIGHTSTRUCT, involving several academic and corporate
participants. It is a continuation of said projects with the purpose to further investigate and
develop design and manufacturing processes for lightweight welded structures used in high
performance products. The goals are, amongst others, to increase productivity, reduce LCC,
lead time in design and material consumption. This will be done by investigating the
possibility of implementing hybrid welding processes in production and further develop the
quality systems for these processes. The project also encompasses a study to broaden the
knowledge of how local weld geometry, defects and residual stresses affect the fatigue life in
high strength steel when using the new welding processes. The final step will be
implementing these welding processes on prototypes. [2] This thesis will partially encompass
the latter mentioned parts in the project, regarding local weld geometries, defects and their
effect on the fatigue life for new welding processes. Two potential fatigue life improvement
techniques, called toe weaving and extended leg, are investigated. Conventional improvement
techniques such as TIG- dressing, HFMI treatments or grinding require resources in form of
equipment, time and training. The weaving and extended leg techniques on the other hand use
the existing welding equipment, making improvement easier and cheaper.
1.2. Purpose The two potential improvement techniques will be investigated in this thesis by:
Performing FEA and fracture analyses of the local weld geometries in order to determine:
Their effect on the crack growth and fatigue life.
Finding optimal geometrical parameters for the toe weaving technique.
Performing fatigue tests on non-load carrying cruciform joint specimens, welded with the two
techniques, in order to determine:
The fatigue performance of the new welding techniques compared to as- welded
joints.
Whether the observed effects from previous studies can be reproduced, regarding
crack initiation sites, crack growth and fatigue life improvement.

6
1.3. Methods Fatigue life evaluation of the toe weaving technique has been performed using LEFM
analysis. Fatigue life calculations are based on SIF’s obtained through fracture simulations
using Franc3D [3]. Initial crack orientations and initiation sites are determined with the
critical plane approach using coordinate transformation methods and based on the Findley
damage parameter. The critical plane calculations are based on FE-simulations of the
geometries and are modeled according to the effective notch method.
1.4. Improvement techniques Weld improvement techniques are used to enhance the fatigue resistance of welded joints.
Most common post treatment techniques can only improve the weld toe. Therefore, it is
necessary to assess the structure and the loading that it is subjected to in order to establish
whether the treatment will have a beneficial effect. Figure 1 depicts two different structural
details, cruciform joints a), b), e) and butt joints c), d). The cracks are most likely to initiate at
the weld toe or root depending on the loading conditions. Cruciform joints or fillet welds with
applied loads in the non-load carrying direction a) or fully penetrated joints in the load-
carrying direction b), c) are most likely to fail from the weld toe. Joints that are not fully
penetrated d), e) will most likely fail from the weld root side when loads are applied in the
load-carrying direction, since the root gap will act as an initial crack. Improvement techniques
of the weld toe are of interest since the non-load carrying cruciform joint a) is primarily
evaluated in this thesis.
Figure 1: Probable crack initiation of different structural details with regards to the applied
load.
Fatigue cracking at the toe occurs due to the sharp geometric transition between weld and
base plate. There is also a high occurrence of weld defects such as undercuts, spatter or cold
laps from the weld process that will act as initiation sites and further decrease the fatigue
strength of the weld. [4] [5] Weld defects can be considered as small cracks initiated along the
toe region, see Figure 2 (right).
7
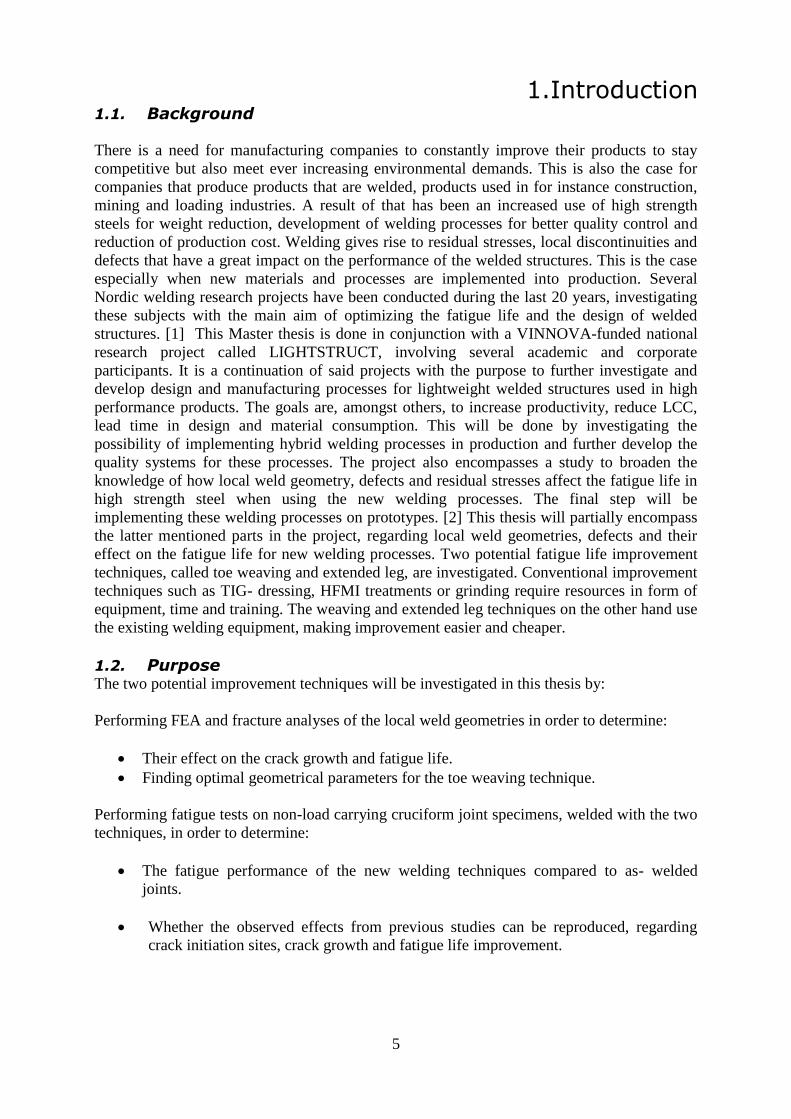
Figure 2: Weld geometry of a fillet weld (left) , crack shape at weld toe (right).
There are several techniques to improve the fatigue strength of joints at the weld toe region,
which can be categorized in two methods: methods improving the weld geometry and residual
stress methods. The purpose of the weld geometry improvement techniques is to remove
existing surface defects made during the welding process, moreover, they are also used to
increase the toe radii and smoothen the transition between weld and baseplate. The residual
stress methods induce compressive residual stresses at the weld toe surface by mechanical
plastic deformation. The constraint of the surrounding elastic material will give rise to
compressive residual stresses. They will have a crack closuring effect, reducing the stress
range of the applied tensile loads and thus reducing crack growth rates. [5] Several of the
most common post improvement techniques of the weld toe are displayed in Table 1.
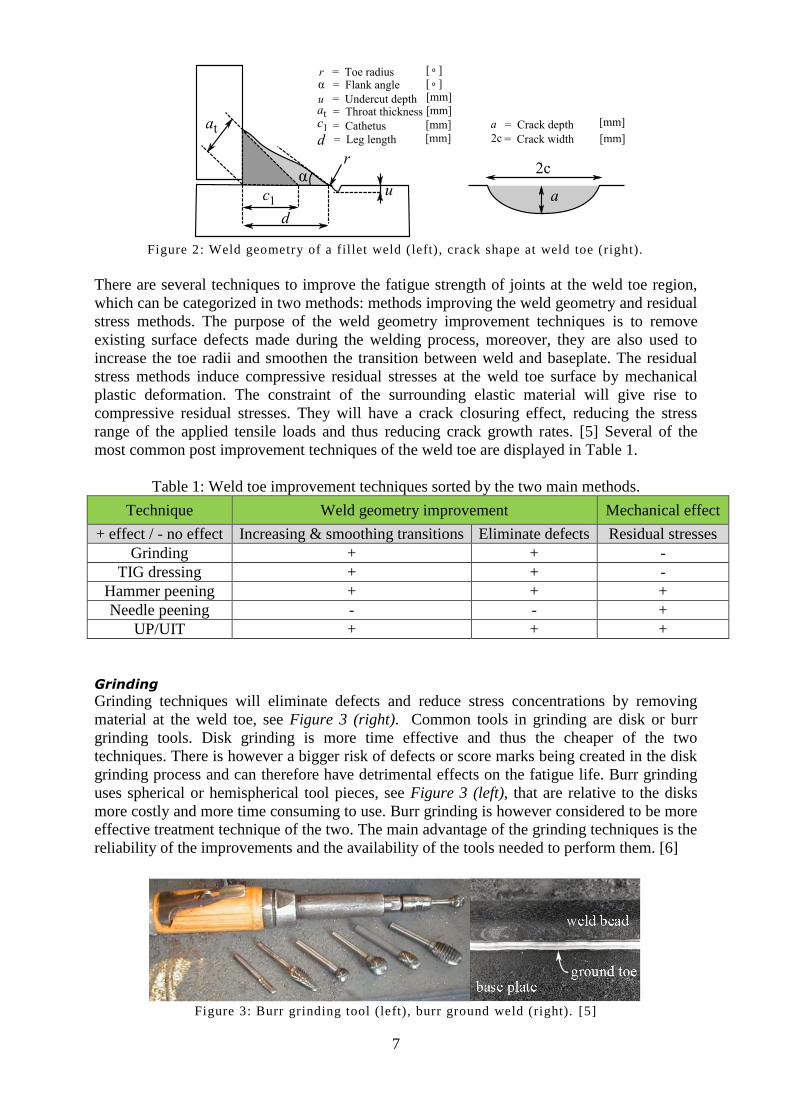
Table 1: Weld toe improvement techniques sorted by the two main methods.
Technique Weld geometry improvement Mechanical effect
+ effect / - no effect Increasing & smoothing transitions Eliminate defects Residual stresses
Grinding + + -
TIG dressing + + -
Hammer peening + + +
Needle peening - - +
UP/UIT + + +
Grinding
Grinding techniques will eliminate defects and reduce stress concentrations by removing
material at the weld toe, see Figure 3 (right). Common tools in grinding are disk or burr
grinding tools. Disk grinding is more time effective and thus the cheaper of the two
techniques. There is however a bigger risk of defects or score marks being created in the disk
grinding process and can therefore have detrimental effects on the fatigue life. Burr grinding
uses spherical or hemispherical tool pieces, see Figure 3 (left), that are relative to the disks
more costly and more time consuming to use. Burr grinding is however considered to be more
effective treatment technique of the two. The main advantage of the grinding techniques is the
reliability of the improvements and the availability of the tools needed to perform them. [6]
Figure 3: Burr grinding tool (left), burr ground weld (right). [5]

8
Dressing
Dressing techniques improve the weld toe geometry and removes surface defects by re-
melting the weld toe, see Figure 4. TIG and plasma dressing are the two main dressing
techniques. Dressing methods require a lot of preparation in order to obtain the desired
results. The surface should be de-slagged and wire brushed in order to remove contaminations
such as rust, slag, and other impurities. In some cases (steel joints) there is also a need to do
the post treatment using recommended preheat temperatures in order to avoid hydrogen
embrittlement and hard phases in the metal. Dressing techniques require knowledge and high
skill levels of the operators. The main advantage of the dressing techniques is the possibility
to obtain a high degree of fatigue improvement. [5], [6]
Figure 4: TIG dressing of fillet weld (left), weld profile pre and post treatment (right). [5]
Peening
Shot, needle, hammer and ultrasonic peening (UT/UIT) are methods used to introduce
compressive residual stresses at the weld toe. The weld metal is, depending on the technique,
plastically deformed or cold worked, by needles, hammers or small iron spheres. Needle and
hammer peening uses pneumatic or electric guns in order to cold work the metal. The end
piece of a hammer peen tool is a hemispheric tip with the diameter of 6-18 mm compared to
the needle end piece that has an array of small round tipped pins see Figure 5 a ), b). Hammer
peening produces higher impact energies in the treatment process and will as opposed to the
needle peening technique also improve the weld geometry. Needle peening on the other hand
is better suited to treat bigger areas as is the shot peening technique. The shot peening
technique utilizes small iron spheres of sizes 0.6 to 1 mm that are shot in high speed onto the
desired surface area. UT/UIT techniques utilize ultrasonic transducers to treat the weld metal
with high frequency impacts using either 16 mm diameter pins or a smaller array of pins, see
Figure 5 c ). These two techniques are also high energy methods and will improve the weld
geometry as well as inducing residual stresses. UT/UIT methods are considered to have the
best consistency in the treatment results. The IIW has introduced the term HFMI, describing a
variety of treatment methods with the same principal of function. They all deploy cylindrical
pins or indenters that impact the weld material with high frequency (>90 Hz), resulting in a
plastic deformation of the weld surface. They all improve both the local weld geometry and
residual stress field, thus any technique fulfilling this description falls within the term HFMI
[7]. Peening requires knowledge of operators and the right equipment. There is a risk of
creating new defects if the treatment is not performed in the correct way. The main advantage
of the method is that it is one of the cheapest improvement techniques. [5], [6]

9
Figure 5: Hammer peening a) [5], needle pin tool b) [5], UT peening c) [6].
Quantifying the improvement
IIW [8] have recommendations for how the improvements for grinding, TIG dressing,
hammer- & needle peening should be taken account for when calculating the fatigue life. The
recommendations can only be used for the nominal stress and structural hotspot stress
methods (see section 1.7). The amount of improvement to the fatigue life depends strongly on
the techniques used but also factors such as load ratio R, the structural detail and materials
used. The improvement is taken account for by upgrading the FAT – class of the structural
detail of interest. Other evaluation methods allow incorporation of the improvement effects in
other ways, for instance applying residual stresses in FE-models.
The background of the toe weaving technique and its potential use as a weld geometry
improvement technique is covered in coming sections.
1.5. Toe weaving J.L. Otegui et al [9] investigated the effect of different welding processes on early crack
growth in welded steel T-joints. Manual and automatic welds were compared and specimens
were tested using three-point bending in the transverse direction. It was observed that weld
toe irregularity or waviness, which was more prevalent in manual welds, had a beneficial
influence on the fatigue life. Higher irregularity of the weld toe would result in a higher
mismatch between the planes of small surface cracks, which in turn would delay the
coalescence of said cracks and result in higher fatigue life. Subsequent work [10], [11] was
focused on developing an automatic weld processes that could produce welds with a
controlled degree of waviness. Methods using variable welding speed, variable arc voltage
and arc rotation were tested and evaluated. Only the arc rotation method was found to give a
measurable effect on the fatigue lives of the tested specimens.
The weaved weld geometry is defined using two parameters, the wave period P, defining the
length between two subsequent waves and the toe breaking angle χ. It is the angle between
two meeting waves, also called the cusp region, see Figure 6 (left).
10
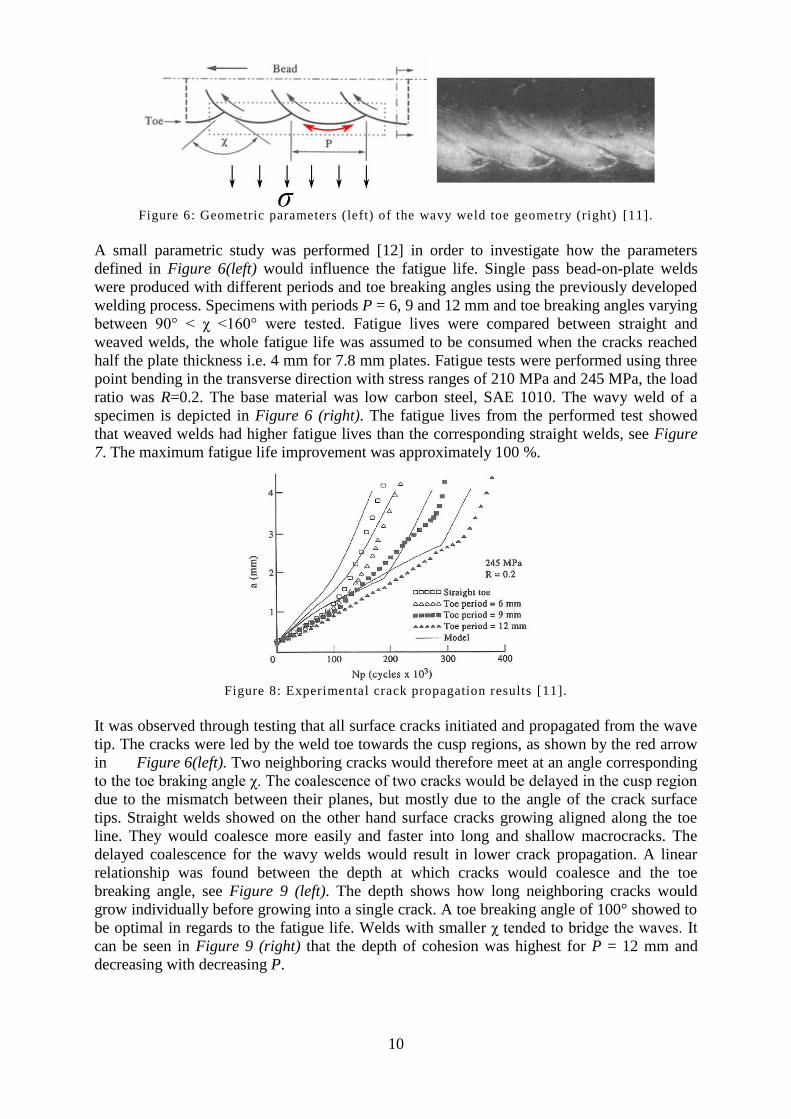
Figure 6: Geometric parameters (left) of the wavy weld toe geometry (right) [11].
A small parametric study was performed [12] in order to investigate how the parameters
defined in Figure 6(left) would influence the fatigue life. Single pass bead-on-plate welds
were produced with different periods and toe breaking angles using the previously developed
welding process. Specimens with periods P = 6, 9 and 12 mm and toe breaking angles varying
between 90° < χ <160° were tested. Fatigue lives were compared between straight and
weaved welds, the whole fatigue life was assumed to be consumed when the cracks reached
half the plate thickness i.e. 4 mm for 7.8 mm plates. Fatigue tests were performed using three
point bending in the transverse direction with stress ranges of 210 MPa and 245 MPa, the load
ratio was R=0.2. The base material was low carbon steel, SAE 1010. The wavy weld of a
specimen is depicted in Figure 6 (right). The fatigue lives from the performed test showed
that weaved welds had higher fatigue lives than the corresponding straight welds, see Figure
7. The maximum fatigue life improvement was approximately 100 %.
Figure 8: Experimental crack propagation results [11].
It was observed through testing that all surface cracks initiated and propagated from the wave
tip. The cracks were led by the weld toe towards the cusp regions, as shown by the red arrow
in Figure 6(left). Two neighboring cracks would therefore meet at an angle corresponding
to the toe braking angle χ. The coalescence of two cracks would be delayed in the cusp region
due to the mismatch between their planes, but mostly due to the angle of the crack surface
tips. Straight welds showed on the other hand surface cracks growing aligned along the toe
line. They would coalesce more easily and faster into long and shallow macrocracks. The
delayed coalescence for the wavy welds would result in lower crack propagation. A linear
relationship was found between the depth at which cracks would coalesce and the toe
breaking angle, see Figure 9 (left). The depth shows how long neighboring cracks would
grow individually before growing into a single crack. A toe breaking angle of 100° showed to
be optimal in regards to the fatigue life. Welds with smaller χ tended to bridge the waves. It
can be seen in Figure 9 (right) that the depth of cohesion was highest for P = 12 mm and
decreasing with decreasing P.

11
Figure 9: Crack cohesion depth vs. toe breaking angle (left), fracture surface of welds with
P = 12, 9, 6 mm and straight weld, (right) [11].
The optimum period length was not P = 12 mm even though the tests indicated otherwise.
The welding process could not create wave geometries that varied P and χ independently. In
this case the wavy weld of P = 12 mm had the toe breaking angle χ ≈ 100°, the specimens
with lower wave periods had all larger toe breaking angles and therefore shorter fatigue lives.
[11] suggested that P should be as small as possible. Smaller wave periods (c - lengths) would
result in cracks growing with higher a/c ratios, provided that the cusp regions act as crack tip
anchors. This effect would provide longer fatigue propagation lives.
Skriko et al. [13] evaluated non-load carrying fillet welds on S960 steel specimens, comparing
automatic single- pass weaved welds to straight welds. Fatigue tests and FE-simulations were
performed in that study, however, no parametric study was performed of the toe weaving
geometry and no specifications of what periods or toe breaking angles used were given in the
report. The fatigue tests showed cracks growing from the wave tips straight out towards the
base material bridging the gap between wave tips. The weaved specimens had however higher
fatigue lives than the corresponding specimens with straight welds. Skriko et al. suggests it is
due to the toe radii and the decreasing notch effect on the crack when growing into the base
material. The crack growth for the straight welds follows the toe line and is always subjected
to the notch effect, as a result cracks would develop smaller a/c ratios and shorter fatigue
lives.
1.6. Extended leg Extended leg, or leg deviation, is the geometrical extension of a cathetus of the triangle
approximating the fillet weld geometry, as seen in Figure 2 (left). The extension is defined as
the total leg length d. The purpose of the extended leg is to improve the local weld geometry
and thus to improve the fatigue life of the joint. The leg extension was produced using double
pass welding on the test specimens as specified in section 2.1. The wavy weld geometries are
also welded with double pass as opposed to [12], [13]. The resulting toe geometry is a
combination of both weaving and leg extension. The effect of the extended leg geometry is
therefore studied in addition to the weaved. Fatigue tests on welded specimens and
simulations using fracture analysis are performed for both techniques.

12
1.7. Fatigue life assessment methods There are four main methods that are currently used in assessing the fatigue life of welded
joints. The methods and their implementation are thoroughly described in the IIW
recommendations [8]. The methods can be divided into local and global approaches. The
nominal stress method and structural hot-spot method are both global approaches, the fatigue
lives are calculated based on stresses that are unaffected by the weld geometry. The effective
notch stress method and the crack propagation approach (linear elastic fracture mechanics) are
local approaches. Fatigue lives are calculated using stresses obtained on the local weld
geometry most often using FEA.
Nominal stress method
The nominal stress method is one of the older methods used to assess the fatigue life of welds.
To calculate the fatigue life, the nominal stress has to be determined in the structure,
secondly, a fatigue resistance S-N curve has to be chosen that represents both the structural
detail and load condition. The S-N curves are based on data from physical fatigue tests made
with a big variety of weld types and load conditions.
Hot-spot
The structural hot-spot stress is established by linear extrapolation of the stresses at certain
points from the weld toe by the means of strain gauges or FEA. Fatigue lives are calculated
based on fatigue resistance S-N curves for the hot-spot method. The characteristic FAT
strength for a structural detail and load case that correspond to the analyzed structure has to be
chosen.
The nominal stresses are often hard to assess when complex geometries are analyzed,
furthermore fatigue lives are based on the most common structural details and load
conditions. This will limit the use of the global methods to the assessment of simpler
structures and then only of the weld toe.
Effective notch method
The effective notch stress method is a local method that calculates the stress at the weld
notches. The notch stress is calculated by using FEA of the structure with the modeled weld
profile assuming linear elastic material behavior. The radii at both weld toe and root are
modeled using fictitious notches as seen in Figure 10, in order to avoid stress peaks.
Figure 10: Weld profiles modeled with fictitious notches. [14]
The real weld profile is replaced with an effective notch in order to take account for variations
in the weld geometry and microstructural support effects. The stress reduction at the notch
due to averaging the stress over a depth, can according to the notch rounding approach, be
accomplished by fictitiously enlarging the notch radius [14]. These considerations are taken
into account for by increasing the real notch radii with 1 mm. The fictitious notch will
consequently have a notch radius of 1 mm for the most conservative case (assuming the real
weld radius is 0 mm). The fatigue resistance - (FAT) of 225 MPa for maximal principal stress
or FAT 200 MPa for equivalent Von Mises stress - is used for steel specimens in order to
calculate the fatigue life. This method is valid for plate thicknesses of 5 mm or larger. A
fictitious notch radius of 0.05 mm is recommended for thin structures. [1], [8]
Radius 1 mm

13
Linear elastic fracture mechanics
The second local method is the crack propagation approach. It is used to predict crack growth
in structures subjected to fatigue loading. Figure 11 depicts the three different modes that
drive the crack growth. Mode I is the crack opening mode and appears when the crack is
subjected to tensile stresses normal to the crack plane. Mode II crack separation occurs when
the crack is subjected to in-plane shear stress perpendicular to the crack front. Mode III crack
separation has a tearing effect as a result of in-plane shear stress parallel to the front. Mode I
propagation is commonly the most dominant of the three modes, and will therefore govern the
crack path and shape. The SIF’s (stress intensity factors) that describe the stress state near the
crack tip for the three modes are , & . SIF’s can be calculated both analytically and
with the use of FEA.
Figure 11: The tree crack separation modes.
SIF’s on welds can be calculated using standard handbook formulas [15] in combination with
correction functions that take account for the weld geometry. It is also possible to use the
weight function approach or to use FE programs. [8] SIF’s are calculated with the use of FEM
software in this thesis and is further described in section 3.3. The stochastic variation of the
stresses due to fatigue loading is expressed in the form of SIF ranges and used in the
fatigue life calculations. Fatigue life is calculated using crack propagation equations, such as
Paris power law, see 3-14. It utilizes SIF ranges, material parameters to calculate fatigue lives.
Other modifications to the propagation equation take account for other factors such as mean-
and residual stresses, and load sequences (crack closure effects). [8], [1], [16]
The local approaches are more time consuming but will allow for the analysis of more
complex structures and with higher accuracies. They also allow for evaluations of both weld
toes and roots. [1]
14
2.Test specimens & destructive testing
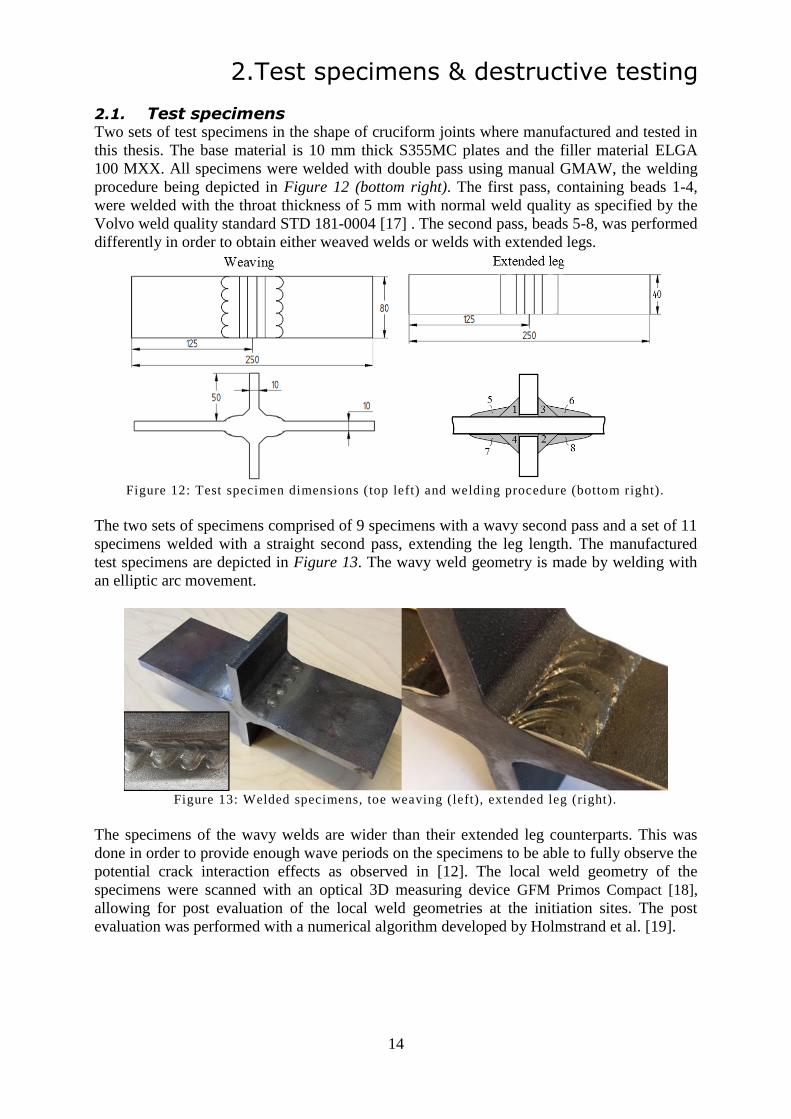
2.1. Test specimens Two sets of test specimens in the shape of cruciform joints where manufactured and tested in
this thesis. The base material is 10 mm thick S355MC plates and the filler material ELGA
100 MXX. All specimens were welded with double pass using manual GMAW, the welding
procedure being depicted in Figure 12 (bottom right). The first pass, containing beads 1-4,
were welded with the throat thickness of 5 mm with normal weld quality as specified by the
Volvo weld quality standard STD 181-0004 [17] . The second pass, beads 5-8, was performed
differently in order to obtain either weaved welds or welds with extended legs.
Figure 12: Test specimen dimensions (top left) and welding procedure (bottom right).
The two sets of specimens comprised of 9 specimens with a wavy second pass and a set of 11
specimens welded with a straight second pass, extending the leg length. The manufactured
test specimens are depicted in Figure 13. The wavy weld geometry is made by welding with
an elliptic arc movement.
Figure 13: Welded specimens, toe weaving (left), extended leg (right).
The specimens of the wavy welds are wider than their extended leg counterparts. This was
done in order to provide enough wave periods on the specimens to be able to fully observe the
potential crack interaction effects as observed in [12]. The local weld geometry of the
specimens were scanned with an optical 3D measuring device GFM Primos Compact [18],
allowing for post evaluation of the local weld geometries at the initiation sites. The post
evaluation was performed with a numerical algorithm developed by Holmstrand et al. [19].

15
2.2. Fatigue Testing The test specimens were subjected to loads in the non-load carrying direction as depicted in
Figure 1 a). Constant amplitude fatigue tests were performed using a SCHENCK Hydroplus
PSB (max ± 200 kN, 30 Hz) machine for both batches. The weaved batch was however also
subjected to marker loads in order to follow the crack growth history and coalescence,
similarly to tests by [20]. The load sequence for the weaved specimens was divided into two
load blocks: one constant amplitude block with 40 000 cycles of R = 0.5, and a marker block
lasting 10 000 cycles with load ratio R =0.8. The maximum stress was kept constant for both
blocks, see Figure 14.
Figure 14: Beach-marking load blocks for the weaved specimens.
The crack growth during the marker block would decrease substantially compared to the
normal load block, making the fracture surfaces for the marker blocks visually distinguishable
in post evaluation. The cycles of the marker blocks are not taken account for when fatigue
results are presented due to the low crack growth. Fatigue tests carried out on the extended leg
batch were only subjected to constant amplitude loads with R=0.5. Fatigue life calculations
were done in accordance with the IIW recommendations [8], excluding run-out specimens. A
5% probability of failure for 2 million cycles was calculated using an inverse slope of m=3.
Run- out specimens were tested two times at a higher stress range than previously. They could
be included in the fatigue resistance calculations if they fell within the scatter band of the
tested stress range. The results from the fatigue tests can be seen in section 4.

16
3.Methods 3.1. Geometry The geometry of the weaved welds, as seen in Figure 44, is asymmetric and not consistent in
regards to the wave periods, toe breaking angles, toe radii and leg extensions. Some
simplifications and assumptions are made to facilitate the modeling; the wave periods are
assumed to be semi-circular, symmetric and the toe radius is assumed to be constant along the
whole toe line of the wave. The shape of the simplified weld geometry can be seen in Figure
6(left).
Ansys model
Two fully parametric models of the wave toe geometry were created in Ansys Classic [21],
one as a bead-on-plate specimen according to specifications in [12] and one as a cruciform
joint corresponding to the welded test specimens, see Figure 12 & Figure 13. Linear elastic
isotropic material behavior is modeled, the Young’s modulus is set to E = 210 GPa and the
poisson ratio to ν = 0.3. All the models are modeled with 20 - node hexahedral elements for
the critical plane analyses, Franc3D /NG remeshes the models with tetrahedral elements for
the fracture analysis.
No residual stresses are taken account for in the simulations. The modeled cases are further
described in section 3.4.
3.2. Critical Plane
In order to perform fracture analysis of the models, it is necessary to identify the location and
orientation of the initial crack. The critical plane approach is a suitable method to use. Critical
plane models are most often used for fatigue analysis of components subjected to variable
amplitude multiaxial loading. They are mostly developed through observations of the crack
behavior in test specimens, and relate the crack initiation and propagation to certain
orientations in the material, given the loading conditions. [22] Cracks will initiate for
orientations or planes where the damage is maximized. They are found by reorienting the
planes and comparing the computed damage for every orientation. [23] Figure 15 depicts a
fillet weld with a potential plane inserted in the material.
Figure 15: A potential critical plane oriented into the material of a fillet weld.
Findley damage parameter
There are numerous damage parameters and are most often expressed as functions of shear
and normal stresses on a given plane [23]. Findley developed one of the first damage
parameters (1959), defining the most damaging plane as the one subjected to the highest shear
stress amplitude Δτ/2 modified by the maximum normal stress on that plane. The damage f
is defined as a linear combination of the two and expressed as:
3-1

17
The material constant k defines the materials sensitivity to normal stress on a shear plane and
is assumed to be k = 0.3, a common value for structural steels. [22]
Coordinate transformation (rotational matrices)
To find the plane with the highest damage according to the Findley criteria, it is necessary to
calculate shear and normal stress components on any of the potential planes. To resolve the
stress components for a given plane, it is necessary to perform a stress transformation of the
stress tensor from the global coordinate system to the local of the plane. The stress tensor can
be defined either analytically from known applied loads, or by the use of FEM software for
more complex geometries or loading conditions. Assuming that the critical location is in a
given point O of the global coordinate system, and that the stress state in that point is given by
its stress tensor, then the stress components for any given plane can be calculated with the use
of a rotational transformation [24]. Considering Figure 16, the plane orientations can be
defined by a series of rotations around the global coordinate axis. The plane is defined by an
orthogonal coordinate system a, b, n, with the origin O. The unit vectors a and b define the
given plane with n being its normal unit vector. The sign conventions of the rotations are
chosen and adapted to the FE models used in this thesis.
Figure 16: The plane coordinate system defined by an gles θ, φ, ψ, in respect to the global
system.
The rotations around each of the global coordinate axis X, Y and Z using angles ψ, φ, θ, can be
mathematically described by the following coordinate rotations [25]:
[
]
3-2
[
]
3-3
[
]
3-4
The , matrix describes the rotation around axis X with the angle ψ in the counter
clockwise direction. Matrices and describe the rotation around axis Y and Z with the
angles φ and θ respectively, in the clockwise direction. The rotation matrix for an arbitrary
plane defined by the angles θ, φ and ψ can be calculated by multiplying the rotation

18
transformations (3-2, 3-3, 3-4) in a given order. By multiplying the rotations in the following
order,
3-5
the following rotation matrix is obtained:
[
]
3-6
Where, c and s are abbreviations for the cosine and sine functions. This transformation will
generate a plane represented by the a and b vectors, and will rotate around the normal vector
n of that plane when ψ is varying, see Figure 17. The unit vectors a, b and n are obtained by
multiplying the global unit vectors with the rotation matrix .
[
] [ ] [
]
3-7
[
] [ ] [
] 3-8
[
] [ ] [
] 3-9
Stress transformation
The stress tensor defined in the global coordinate system at a critical location is defined as:
[
]
3-10
The shear and normal stress on an arbitrary plane given by the unit vectors a, b and n
can be calculated using following matrix operations:
[ ] [
] [
]
3-11
[ ] [
] [
]
3-12
is a projection of the resolved shear stress in the – direction, for a given plane, see
Figure 17.

19
Figure 17: Shear and normal stress components relative to the plane coordinate system.
Critical plane search
The angles chosen in the critical plane search are related to the specific geometry of the model
and the regions where crack initiation is most likely to occur [24]. The location of failure for
fillet welds subjected to transverse loading is predominantly in the weld toe [4], limiting the
critical plane search to the weld toe line. The plane search is performed by systematically and
incrementally varying the rotational angles, θ, φ and . As seen in Figure 16, it is possible
to rotate the planes in any general direction in order to find the critical plane. However, [26]
suggested that the critical plane approach should be modified to suit welded structures. One of
these modifications related the crack orientation with the weld geometry: when cracks form
in the weld toe region, they most predominantly initiate along the weld toe line. This
modification is adapted in the critical plane search assuming that potential shear planes are
parallel to the weld toe. For straight welds, the plane is oriented at = 0°. For weaved welds,
will follow the toe line tangent and vary with the location of the analyzed point, see Figure
18 (left). [22] The angle is calculated using trigonometric relations, and Figure 18 (right)
depicts the range chosen for angle φ relative to the weld geometry.
Figure 18: Rotational angle defined with respect to an arbitrary point on the weld toe line
(left), rotational angle φ and its defined range with respect to the model (right).
The search is performed by aligning the potential plane with the toe line, (fixing ), and
subsequently varying φ with 1° increments through its whole range. A 360° sweep of with
10° increments is performed for every plane (θ - φ combination) in order to compute the
direction of the resolved stresses. A detailed example of a critical plane search can be found in
[22].

20
Computing damage
The Findley damage parameter (3-1) is computed using the shear stress amplitude and the
maximum normal stress. The shear- and normal stresses in the geometry change with the time
since the test specimens are subjected to proportional constant amplitude loading. Figure 19
depicts the load time history of the nominally applied load of a typical simulation. Normal
and shear stresses in the weld toe are going to vary proportionally with the applied load. With
this load characteristic, it is sufficient to compute the stresses for only two points in the time
history in order to find the critical plane. The stress tensors (3-10) in a critical location in the
model are obtained from FE-simulations, for points 1 and 2.
Figure 19: Load time history of a nominally applied load.
The resultant shear stress (Figure 17) on a plane is in most cases changing in both
magnitude and direction with time. The shear stress is used to indicate the direction of
shear, tracing an imaginary closed curve using 3-12 on the plane. Several methods have been
developed to define the mean- and shear stress amplitude for a given plane, the longest chord
method being one of them and is used in this thesis. The longest chord is the maximum
resolved shear stress range Δτ inside the closed path created by the (beads 5-8) vector during
a load cycle. The longest chord is found by computing the difference of the traced curves
made by the vector for the corresponding directions, , and for the respective time
points 1 and 2. The maximum computed difference is the longest chord with the half chord
length defined as the shear stress amplitude, see Figure 20.
Figure 20: The resolved shear stress path for an arbitrary load cycle.
Computing the normal stress on each plane is more straightforward, the normal stress is
calculated using 3-11. The maximum normal stress is always found in time point 1 for this
load case. [22], [24]
21
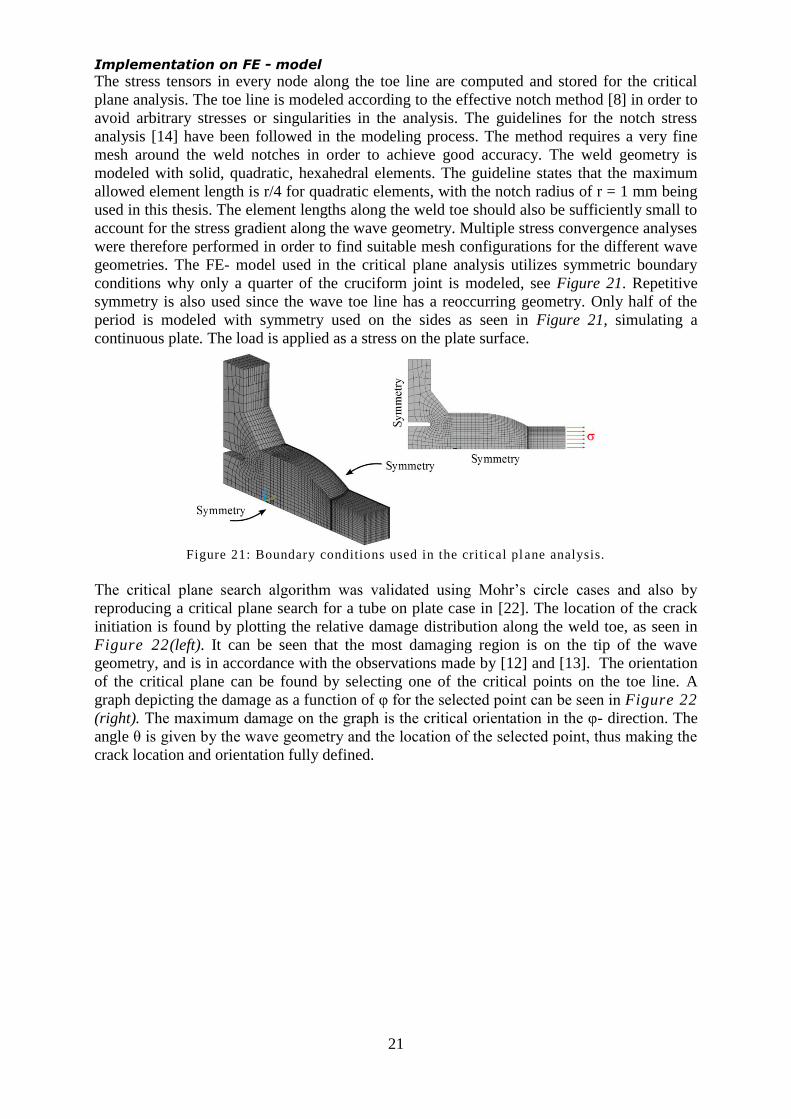
Implementation on FE - model
The stress tensors in every node along the toe line are computed and stored for the critical
plane analysis. The toe line is modeled according to the effective notch method [8] in order to
avoid arbitrary stresses or singularities in the analysis. The guidelines for the notch stress
analysis [14] have been followed in the modeling process. The method requires a very fine
mesh around the weld notches in order to achieve good accuracy. The weld geometry is
modeled with solid, quadratic, hexahedral elements. The guideline states that the maximum
allowed element length is r/4 for quadratic elements, with the notch radius of r = 1 mm being
used in this thesis. The element lengths along the weld toe should also be sufficiently small to
account for the stress gradient along the wave geometry. Multiple stress convergence analyses
were therefore performed in order to find suitable mesh configurations for the different wave
geometries. The FE- model used in the critical plane analysis utilizes symmetric boundary
conditions why only a quarter of the cruciform joint is modeled, see Figure 21. Repetitive
symmetry is also used since the wave toe line has a reoccurring geometry. Only half of the
period is modeled with symmetry used on the sides as seen in Figure 21, simulating a
continuous plate. The load is applied as a stress on the plate surface.
Figure 21: Boundary conditions used in the critical pl ane analysis.
The critical plane search algorithm was validated using Mohr’s circle cases and also by
reproducing a critical plane search for a tube on plate case in [22]. The location of the crack
initiation is found by plotting the relative damage distribution along the weld toe, as seen in
Figure 22(left). It can be seen that the most damaging region is on the tip of the wave
geometry, and is in accordance with the observations made by [12] and [13]. The orientation
of the critical plane can be found by selecting one of the critical points on the toe line. A
graph depicting the damage as a function of φ for the selected point can be seen in Figure 22
(right). The maximum damage on the graph is the critical orientation in the φ- direction. The
angle θ is given by the wave geometry and the location of the selected point, thus making the
crack location and orientation fully defined.

22
Figure 22: The relative Findley damage distribution along the weld toe (left), the critical plane
orientation for one point in the critical location of the toe line.
The damage as a function of the angle φ for its complete range of 360° is depicted in Figure
23. There are in this case four local maxima representing two damage planes, every second
peak is phase shifted 180° and shows a different direction on the same plane. The influence of
normal stress through the k - parameter and the location of the most damaging planes can also
be seen in Figure 23. The red line with k = 0 represents the damage for pure shear stress.
There are no big differences in damage location when taking the normal stress into account
for this particular load case. Note that the area of interest is for this case only in the range
45°< φ< 270°, as depicted in Figure 18 (right).
Figure 23: Damage as a function of φ and the effect of normal stress on shear planes.
14.5 15 15.5 16 16.5 17 17.5
0
0.5
1
1.5
2
2.5
3
3.5
4
4.5
Relat ive damage distribut ion
Y[m
m]
X [mm]
0.7
0.75
0.8
0.85
0.9
0.95
1
80 100 120 140 160 18020
30
40
50
60
70
80
90
100Damage in point ( 16.8265 , 0)
' [deg]
Fin
dle
yD
am
age
[MP
a]

23
3.3. Franc3D/NG The weld toe weaving geometry is three-dimensional and the crack growth arbitrary, there is
therefore a need to use an appropriate tool to reliably model the crack growth. Franc3D/NG is
a tool used to simulate crack growth in three-dimensional engineering structures. It can
simulate arbitrary crack growth in geometries subjected to complex loading conditions.
Franc3D/NG is used in conjunction with commercial FEM packages, with ANSYS Classic
[21] being supported and used in this thesis. The process of an analysis using FRANC3D/NG
can be described in the following steps:
1) Creation of an uncracked model with applied loads and boundary conditions, see Figure
24, using FEM software, exporting the FE mesh of a desired region to be used as a sub-
model. Figure 24: FE-model of a cruciform welded joint, modeled with half symmetry.
2) The mesh file is read into Franc3D/NG where a crack of desired shape, size and
orientation is introduced, the sub- model is then remeshed with the crack. Quadratic
elements have to be used in order to calculate the SIF’s. The crack front is modeled by
using several quarter point wedge elements along the front, surrounded by brick elements.
The rest of the sub-model volume is meshed with pyramid and tetrahedral elements, see
Figure 25.
Figure 25: The crack front template [27] .
3) The remeshed sub-model is reincorporated with the whole model in the FEM software
(Figure 26), where a stress and deformation analysis is performed.

24
Figure 26: whole FEM model with remeshed sub -model
4) The displacements from the analysis in the previous step are imported to Franc3d/NG,
where the SIF’s are computed for all node points along the crack-front. The SIF’s can be
computed using displacement correlation technique, M-integral (interaction integral) or
strain energy release rates using the J-integral. The M-integral is used in this thesis and the
J integral is generally used to verify the M integral values [28].
5) Crack extension for the next crack growth increment is computed using a proprietary
formula 3-13, weighting the user specified extension. The extension is computed for every
cross section i, along the crack front. The kink angle for the crack propagation is
calculated based on maximum tensile stress (hoop stress) criterion, most often being the
driving mode in crack growth. The Paris law is used as the fatigue growth rate model in
the simulations. [29]
(
( ))
3-13
The new crack shape is modeled using a polynomial fit curve through the extended points
depicted in Figure 27. Remeshing is then performed on the sub-model for the new crack
increment.
Figure 27- Crack front extension.
The process is iterated between points 3-5 until the desired crack size or number of defined
iterations. [27]

25
3.4. 3D Fracture modeling
The crack is inserted into the model according to the procedures outlined in 3.2 and 3.3. The
initial crack shape is assumed to be semi- elliptical with the a/c – ratio of 1 with an initial size
of 0.1 mm. A. Bhatti [30] investigated crack growth from cold laps using different initial
crack shapes, and showed that they do not have a big influence on the crack development and
fatigue life. A. M. Al-Mukhtar et al [31] investigated several different sources finding that
LEFM analyses with initial crack sizes under 0.1 mm may be dubious and not always
applicable, most recommended initial crack sizes were 0.1 mm or bigger.
The fatigue life of the joint is assumed to be consumed when the crack depth has reached half
the plate thickness. This assumption is used unless the crack tip on the plate surface reaches
the cusp region before that, thus stopping the simulation. [31] The fatigue life is assumed to
only comprise of the crack propagation life, taking no account for the life in the crack
initiation phase.
The crack growth increment in the simulations is gradually increasing with the crack size a,
taking the highly nonlinear part of the SIF vs. crack length curve into account. A total of 20 -
25 growth increments were performed in every fracture analysis with the final crack size
being 4 - 5 mm depending on the plate thickness.
Fracture analyses were performed for some simple cases using Franc3D/NG in order to find
suitable simulation settings. Simulations of a semielliptical surface crack on a finite plate
were in good agreement with analytic solutions calculated using Newman-Raju SIF-
equations in [15]. A simulation was also performed for a non-load carrying fillet weld in
accordance with task 3 in [32]. Both SIF’s and the fatigue life were in good agreement with
the presented results obtained using different analytical and numerical methods.
Butt welds
Models representing the bead on plate welds from [12] were created in order to try to
reproduce the observed crack growth. The wave width and bead height were estimated based
on the published figures, a depiction of the geometry with the measurements can be seen in
Figure 28. Other geometric parameters like the toe radii are taken as an average based on the
published data.
Figure 28: Bead on plate geometry and its dimensions.
Load cases
Two load cases were investigated, three point bending and transverse loading. Half symmetry
was used in both cases with repetitive symmetry on the sides. The use of repetitive symmetry
is possible for this load case since the initiation site from the critical analysis is symmetric in
regards to the wave geometry. Only half of the wave period was therefore modeled, it would
because of the symmetry simulate crack growth occurring on every wave tip. The interaction
with neighboring cracks would be taken account for as the tip grows towards the wave cusp,
due to the increasing compliance. The simulations were performed on welds with the wave
geometry of P =12 mm with different toe breaking angles, χ = 40°, 100°, 140° as found in
[10]. The boundary conditions and applied displacements for the three point bending case are
depicted in Figure 29 . The same boundary conditions used here can also be found in [33].

26
Figure 29: Applied boundary conditions and displacements for the three point bending load
case.
The displacement is applied on the whole symmetry cross section and calculated using Euler-
Bernoulli beam theory. The weld bead is neglected and the whole geometry is assumed to
have a constant cross section with the dimensions of the plate thickness by the half wave
period. Displacements simulating a stress range of 100 MPa in the highest stressed region of
the ‘beam’ were applied, with the load ratio R = 0. A displacement that would result in
nominal stresses of the magnitude of 100 MPa in the highest stressed region would translate
to nominal stresses of 80 MPa at the surface of the wave tip. This is due to the stress
decreasing linearly along the beam length. The loading condition simulated is constant
amplitude with R = 0.
The boundary conditions and applied stresses for the transverse load case are depicted in
Figure 30.
Figure 30: Applied boundary conditions and stresses in transverse load direction.
Cruciform joints
The weaved weld geometries are modeled with half symmetry and with repetitive symmetry
on the sides as seen in Figure 31. In this case a whole period is modeled around the cusp
region. This will result in the simulation of cracks growing on every second wave tip, and
thus disregard crack interaction effects. This is done in order to be able to compare with
results from the straight as-welded and leg deviation models which are modeled with half
symmetry on two planes and only one crack is introduced. The joints are modeled with no
penetration and an oval shaped root crack with the radius of 1mm. All geometries are
subjected to loads in the non-load carrying direction, transverse of the weld. The load is
applied as a stress range of 100 MPa on the surface with R = 0.5. The SIF’s are scaled when
fatigue lives for other stress ranges are calculated. The toe radii, weld flank angles and leg
deviations were measured as described in 2.1 An average from all the specimens are
calculated and used in the model, the assigned dimensions can be seen in Figure 31.
Figure 31: Illustration of the FE –models of the a) As-welded, b) Extended leg and c) Weaved
cruciform joints.

27
Simulation procedure
The fracture analysis is performed on the weaved welds using different combinations of the
toe breaking angle χ and wave period P. The geometric configurations are presented in Table
2.
Table 2: The simulation plan for the weaved weld geometries on the cruciform joints.
Toe breaking angle χ [deg] Period P [mm]
40° 6 9 12 15
100° 6 9 12 15
140° 6 9 12 15
The weaved welds are compared with two straight welds, one as-welded and one with
extended legs. Figure 32 depicts the wave toe geometry for different χ values.
Figure 32: The wave geometry for different toe breaking angles χ.
Fatigue life computation
The fatigue life is calculated numerically using the Paris power law, as recommended by the
IIW in [8], see equation 3-14. The computation is performed in Matlab [34] using the
obtained SIF ranges from the simulations. Trapezoidal integration is used in order to avoid
under- or overestimation of the fatigue life for every integration increment .
3-14
The variable a is the crack length, N is the number of cycles, is the SIF range. The fatigue
life is calculated using the mode I SIF ranges in the depth ( a ) direction, the modus II and III
SIF ranges are negligible in comparison, see Figure 38 . C and m are material constants, for
steel √ with the failure probability of 2.3% and the slope is
used as recommended by IIW. These parameters are based on testing with the load ratio 0.5.
Crack growth will only occur if the stress intensity range is above the threshold value
√ , and is checked for all simulations. [8]. No modified versions to the Paris
law are used. The load ratio is taken account for in the material parameter C. Residual stresses
are neglected and only the fatigue propagation life is assumed to be part of the fatigue life.

28
4.Results 4.1. Critical plane The maximum damage on the weld toe was at the wave tip for every simulation, thus being
the crack initiation site in the fracture simulations, see Figure 33. The initiation angle was the
same, or very similar for all the wave geometries due the initiation site being at the wave tip.
The cross section of the weld profile at the wave tip would look the same for any variation of
the wave geometry, but also for the weld profile of the extended leg specimens. The extended
leg welds had as expected a constant damage along the whole toe line. The critical angles for
the different simulations can be seen in Table 3.
Figure 33: Relative damage for toe breaking angles χ =40° a), χ =100° b), χ =140° c) and
extended leg d).
13.5 14 14.5 15 15.5 16 16.5 17 17.5
0
0.5
1
1.5
2
2.5
3
3.5
4
4.5
Relat ive damage distribut ion
Y[m
m]
X [mm]
0.65
0.7
0.75
0.8
0.85
0.9
0.95
1
14.5 15 15.5 16 16.5 17 17.5
0
0.5
1
1.5
2
2.5
3
3.5
4
4.5
Relat ive damage distribut ion
Y[m
m]
X [mm]
0.7
0.75
0.8
0.85
0.9
0.95
1
14.5 15 15.5 16 16.5 17 17.5 18
0
0.5
1
1.5
2
2.5
3
3.5
4
4.5
Relat ive damage distribut ion
Y[m
m]
X [mm]
0.75
0.8
0.85
0.9
0.95
1
14 15 16 17 18 19
0
1
2
3
4
5
6
7
Relat ive damage distribut ion
Y[m
m]
X [mm]
0.8
0.85
0.9
0.95
1
a) b)
c) d)

29
Table 3: Critical plane angles defined by φ for different toe weaving, extended leg and as-
welded geometries.
Critical angle φ [deg] χ = 40 ° χ = 100 ° χ = 140 °
P = 6 mm 140 ° 136 ° 136 °
P = 9 mm 136 ° 140 ° 136 °
P = 12 mm 136 ° 136 ° 136 °
P = 15 mm 136 ° 136 ° 136 °
Extended leg 145 °
As-welded 129 °
4.2. 3D Fracture analysis Simulated cracks grown to their final size are shown in Figure 34 a) - c), for the as-welded,
extended leg and weaved specimens. The crack growth in the depth direction was dominated
by mode I growth for all cases, see Figure 34 d) and Figure 38. The final crack shape of
specimen c) is representative of all the performed simulations for the wave geometries.
Figure 34: Final crack shapes for a) As- welded, b) Extended leg, c) Toe weaving.
d) Crack path in the depth direction of the weaved specimen.
Crack paths of the weaved specimens are depicted in Figure 36. The paths for the toe
breaking angles 40°, 90° and 140° are shown in graphs for every wave period. A wave toe
line shape with the toe breaking angle of 100° is used as reference. The fracture simulations
show the same crack growth behavior at the surface as in the performed fatigue tests, see
Figure 35, but also as observed in [13]. The crack does not follow the toe line and bridges the
wave cusps.
Figure 35: A fractured weaved weld specimen, seen from above.

30
Figure 36: Crack paths at the surface on the cruciform joints for wave periods: a) 6 mm, b) 9
mm, c) 12 mm, d) 15 mm.

31
The crack paths for the butt joints are depicted in Figure 37.
Figure 37: Crack paths at the plate surface for but welds. T ensile load case (left), three point
bending (right).
Stress intensity factors were very similar for all wave geometries, in both depth (a) and at the
surface (c) -direction. The SIF’s representing the wave geometries are depicted in Figure 38
and Figure 39.
Figure 38: SIF’s for cruciform joint with weaved welds in the depth (a) direction.
0 0.5 1 1.5 2 2.5 3 3.5 4 4.5-2
0
2
4
6
8
10
12
P = 12, = 140
Crack length a [mm]
SIF
MP
A
m
KI a
KII a
KIII a
32
Figure 39: SIF’s for cruciform joint with weaved welds at the surface (c – direction).
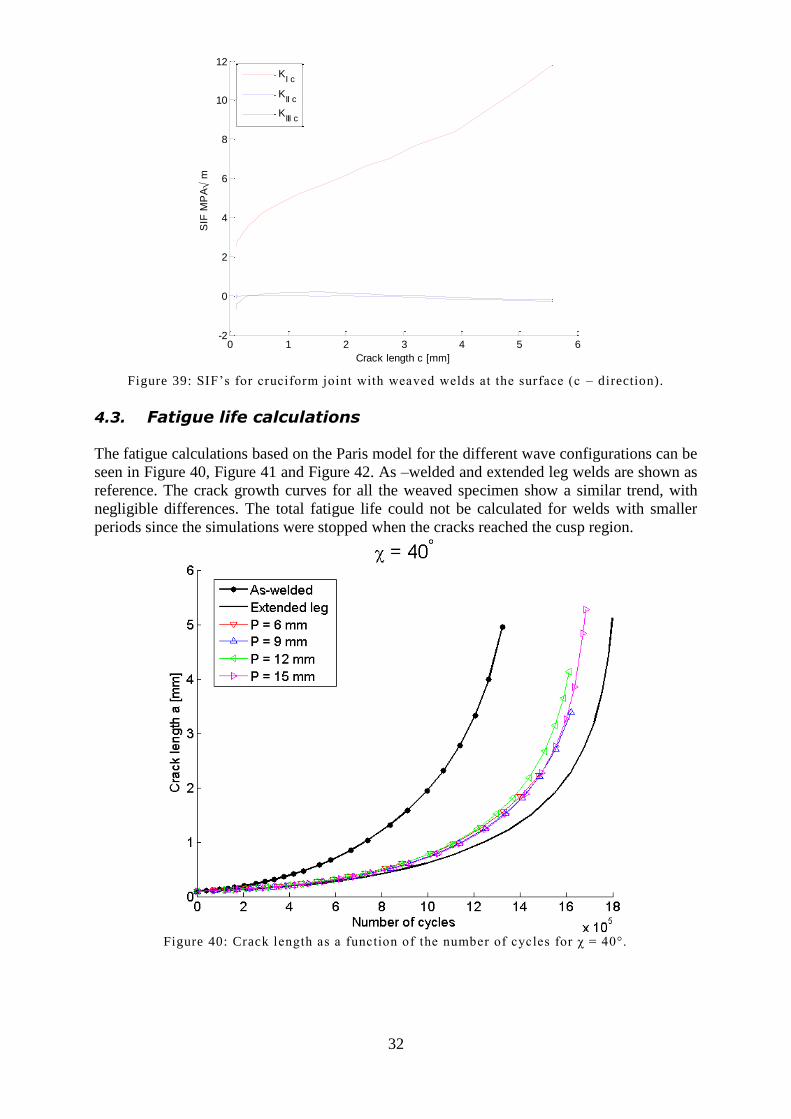
4.3. Fatigue life calculations
The fatigue calculations based on the Paris model for the different wave configurations can be
seen in Figure 40, Figure 41 and Figure 42. As –welded and extended leg welds are shown as
reference. The crack growth curves for all the weaved specimen show a similar trend, with
negligible differences. The total fatigue life could not be calculated for welds with smaller
periods since the simulations were stopped when the cracks reached the cusp region.
Figure 40: Crack length as a function of the number of cycles for χ = 40°.
0 1 2 3 4 5 6-2
0
2
4
6
8
10
12
P = 12, = 140
Crack length c [mm]
SIF
MP
A
m
K
I c
KII c
KIII c

33
Figure 41: Crack length as a function of the number of cycles for χ = 100°.
Figure 42: Crack length as a function of the number of cycles for χ = 140°.

34
4.4. Fatigue testing and post evaluation
Table 4 presents the test results for the weaved and extended leg specimens. They were
calculated in accordance with the IIW recommendations [8]. Both the extended leg and
weaved specimens show similar fatigue characteristics. There is negligible difference in slope
and the characteristic FAT values probably only differ due to the different amount of tested
specimens. There is a need for more testing in order to quantify the potential improvement of
these methods, since the current FAT- values are affected by the high scatter.
Table 4: Test result summary of toe weaved and extended leg specimens.
Mean value /
Standard deviation Toe weaving Extended leg
Failed / Run outs 9/3 12/4
m – natural slope 3,37 3,35
Log C (m = 3) 12,53 / 0,192 12,54 / 0,177
Nr of standard dev. 2,80 2,58
FAT at Pf 50 %
(N = 2e6, m = 3) 120 120
FAT at Pf 5 %
(N = 2e6, m = 3) 94 96
Figure 43 shows the fatigue test results and the calculated fatigue lives from the simulations.
The simulated curves where calculated by scaling the SIF ranges. The characteristic FAT 80
curve is used as reference and represents the structural detail of an as-welded cruciform joint,
see [8]. Run-outs for the weaved and extended leg specimens were re-run on higher stress
ranges. The results could be used if they fell within the fatigue life interval of the specimens
tested at that higher stress range.
Figure 43: Simulated and tested fatigue lives of weaved and extended leg specimens.
The local weld surface geometry was analyzed by evaluating the scans using the numerical
algorithm. Cross sections at the crack initiation sites were studied in order to assess the cause
of the initiation, see Figure 44 a) for an example. The crack initiation was in this case most
probably caused by a cold lap, its maximum depth being at the initiation point, see Figure 44
b).

35
Figure 44: Scan of the local weld toe geometry, seen from above a), geometrical parameters
obtained from the scan b).
Weld geometry parameters such as toe radii, weld flank angles, leg lengths and undercut
depths were examined at the crack initiation sites and plotted for all specimens, see Figure 45.
Figure 45: Weld geometry parameters of the specimens at the crack initiation sites. The weaved
specimens (top left) and (top right). Extended leg specimens (bottom).

36
The calculated FAT values are extrapolations of the fatigue lives to 2 million cycles of each
specimen using the inverse slope m=3.
The stress concentration factor at the weld toe notches were calculated for all the simulated
geometries and are presented in Figure 46. Specimens with extended leg and toe weaving had
a reduction in the notch stress concentration factor compared to the as-welded welds resulting
in the higher fatigue lives.
Figure 46: Stress concentration factor at the weld toe for weaved, extended and as -welded
welds.
1.51.61.71.81.9
22.12.22.32.42.5
P= 6 χ= 40°
P= 9 χ= 40°
P= 12 χ= 40°
P= 15 χ= 40°
P= 6 χ=
100°
P= 9 χ=
100°
P= 12 χ=
100°
P= 15 χ=
100°
P= 6 χ=
140°
P= 9 χ=
140°
P= 12 χ=
140°
P= 15 χ=
140°
Kt n
otc
h
- Kt weaved, range tip to cusp Kt extended leg Kt aswelded
37
5.Discussion
Both simulations and fatigue tests were performed on the weaved specimens, with different
toe breaking angles and period lengths. The results show that the weaving parameters, χ and P
don’t have any discernable influence on the crack growth and fatigue life. This is mainly due
to the inability of the crack tip to grow along the weld toe line, creating the crack tip
anchoring effect described by [12]. The crack front grew instead perpendicular to the applied
load (governed by mode I growth) bridging the wave tips. This crack growth behavior was
observed both in simulations and fatigue testing and as well by [13].
The fatigue tests show a slight improvement for weaved (FAT 94 MPa) and extended leg
(FAT 96 MPa) specimens compared to the as-welded (FAT 80 MPA) characteristic curve,
even in spite of the high occurrence of undercuts. There was a high scatter in fatigue life,
highly influenced by the presence of undercuts. Specimens with the longest fatigue lives had
only small or no undercuts. The increased fatigue life was instead a result of the local weld
geometry improvement. Both techniques allowed for a smoother transition between baseplate
and weld, reducing the weld flank angle and the stress concentration factor.
All welds fell within the VC weld class (normal quality) in the Volvo quality standard [17]
when undercut defects (<1 mm) were considered. The majority of the toe radii were as well
within the acceptance levels for that weld class (>0.3mm). Note that only the crack initiation
points were analyzed. The weld quality VC was obtained welding the specimens without any
welding procedure specification. A consequence is that these suggested improvement
techniques are heavily dependent on the application. Fatigue improvement will therefore vary
depending on how well optimized the welding process is.
The fatigue life calculated from simulations, showed good agreement with the fatigue tests,
mainly with specimens that had initial defects such as undercuts. This was due to the
calculations only being based on the fatigue life in the crack propagation phase. An initial
crack size of 0.1 mm was used as recommended by [31], and is a reasonable assumption when
looking at the measured undercut depths in Figure 45. No consideration was therefore taken
for the fatigue life in the crack initiation phase. Simulations would however better correspond
to defect free specimens if the crack initiation phase was included.
The weaving technique is not suitable for loads in longitudinal direction. The cusp regions of
the weaved welds will act as initiation sites, making the application of toe weaving more
limited compared to the extended leg technique. A good understanding of the loading
condition is therefore required when applying toe weaving. From a production point of view,
the toe weaving technique is more time and knowledge demanding than the extended leg
technique. The extended leg technique is therefore the preferred of the two, and focus should
be put to further develop that technique.

38
6.Conclusions
This thesis evaluated two potential weld improvement techniques, toe weaving and extended
leg technique by:
- Performing fatigue tests of non-load carrying cruciform joints.
- Analyzing the local weld geometries and crack initiation sites.
- Performing a parametric study of the weaved geometry using crack growth
analysis.
Following conclusions could be made from the work:
The parameters defining the toe weaving geometry, P & χ, had no influence on the
crack growth and fatigue life in testing and simulations.
Both the toe weaving and extended leg specimens had an improved fatigue life
compared to as-welded joints, shown both in testing and simulations.
The main reason for the fatigue life improvement was a smoother transition between
the weld and baseplate, due to the second pass weld. This led to smaller stress
concentration factors at the weld toe.
Toe weaving and extended leg techniques had similar fatigue strength.
The weaving technique is not suitable for welded joints loaded in the longitudinal
direction, making its use more limited compared to the extended leg technique.
Weaved welds are harder to produce and more time consuming compared to the
straight extended leg welds.
Future work should involve optimizing the welding process to avoid defects such as
undercuts. The high occurrence of defects with the test specimens was probably due to them
being welded manually, and not in accordance with a specified welding procedure.
Furthermore, it should be investigated if there is any possibility to optimize the extended leg
geometry with regards to joint types, loading conditions and plate thicknesses.
39
7.References
[1] Z. Barsoum, "Residual stress analysis and fatigue assessment of welded structures,
Doctoral Thesis,Dept. of Aeronautical and Vehicle Engineering, KTH, Sweden 2008.".
[2] [Online]. Available: http://www.vinnova.se/sv/Resultat/Projekt/Effekta/Latta-
hogpresterande-svetsade-strukturer---LIGHTSTRUCT/. [Accessed january 2014].
[3] Franc3d Version 6.0. Copyright 2005–2011. Fracture Analysis Consultants Inc..
[4] Z. Barsoum and B. Jonsson, "FATIGUE ASSESSMENT AND LEFM ANALYSIS OF
CRUCIFORM JOINTS FABRICATED WITH DIFFERENT WELDING PROCESSES,"
Welding in the world, vol. 52, no. 7-8, pp. 93 - 105, 2008.
[5] P. J. Haagensen and S. J. Maddox, "IIW Recommendations on methods for improving
the fatigue strength of welded joints: IIW-2142-110," Woodhead Publishing Ltd., 2013.
[6] A. C. Nussbaumer, "Course on fatigue and fracture mechanics - Influence of residual
stresses and post-welding improvement methods," Document submitted in fullfilment of
Article 8°, Alinea c) from the Portugese Decreto Lei n° 239/2007, 2008.
[7] G. Marquis, E. Mikkola, H. Yildirim and Z. Barsoum, "Fatigue strength improvement of
steel structures by high-frequency mechanical impact: proposed fatigue assessment
guidelines," DOI 10.1007/s40194-013-0075-x, 2013.
[8] A. Hobbacher, "IIW RECOMMENDATIONS FOR FATIGUE DESIGN OF WELDED
JOINTS AND COMPONENTS, WRC," Welding Research Council Bulletin, WRC 520.
[9] U. M. D. B. J.L Otegui, "Effect of weld process on early growth on fatigue cracks in steel
T joints," Int. J. Fatigue, vol. 13, no. 1, pp. 45-58, 1991.
[10] M. D. Chapetti and J. L. Otegui, "Importance of toe irregularity for fatigue resistance of
automatic welds," Int. J. Fatigue, vol. 17, no. 8, pp. 531-538, 1995.
[11] M. D. Chapetti and J. L. Otegui, "A technique to produce automatic welds with enhanced
fatigue crack propagation lives under transverse loading," Int. J. Pres. Ves. & Piping,
vol. 70, pp. 173-181, 1997.
[12] M. D. Chapetti and J. L. Otegui, "Controlled toe waviness as a means to increase fatigue
resistance of automatic welds in transverse loading.," Int. J.Fatigue, vol. 19, no. 10, pp.
667-675, 1997.
[13] T. Skriko, T. Björk and T. Nykänen, "Effects of weaving technique on the fatigue
strength of transverse loaded fillet welds made of ultra-high-strength steel, IIW-doc.
XIII-2473r1-13.".
[14] W. Fricke, "IIW-Doc. XIII-2240r2-08/XV-1289r2-08, Guideline for the Fatigue
Assessment by Notch Stress Analysis for Welded Structures," International Institute of
Welding, Hamburg, 2010.
[15] J. C. Newman and I. S. Raju, "Stress-intensity factor equations for crack in three-
dimensional finite bodies subjected to tension and bending loads," Langley Research
Center, Virginia 23665, 1984.
[16] W. Fricke, "Fatigue analysis of welded joints: State of development," Marine Structures,
vol. 16, no. 3, pp. 185-200, 2002.
[17] "Volvo Group weld quality standard, STD 181-0004; 2008".
[18] GFMesstechnik GmbH, http://www.gfm3d.com (2013, accessed may 2013).
[19] T. Stenberg, E. Lindgren and Z. Barsoum, "Development of an algorithm for quality
inspection of welded structures," J. Engineering Manufacture, vol. 226, no. 6, pp. 1033-
1041, 2012.
[20] A. Carpinteri, R. Brighenti, H. Huth and S. Vantadori, "Fatigue growth of a surface crack
40
in a welded T-joint," International journal of fatigue, vol. 27, no. 1, pp. 59-69, 2005.
[21] ANSYS Classic Version 14.0, Copyright 2011 SAS IP, Inc.
[22] M. Bäckström, "Multiaxial fatigue life assessment of welds based on nominal and hot
spot stresses," VTT Technical research centre of Finland, 2003.
[23] Y.-L. Lee, M. E. Barkey and H.-T. Kang, Metal Fatigue Analysis Handbook Practical
problem-solving techniques for compiter-aided engineering, Butterworth Heinemann,
2011.
[24] L. Susmel, "A simple and efficient numerical algorithm to determine the orientation of
the critical plane in multiaxial fatigue problems," Int. J. Fatigue, vol. 32, pp. 1875-1883,
2010.
[25] L. Råde and B. Westergren, Mathematics Handbook for Science and Engineering, fifth
edition, Lund: Studentlitteratur, Lund, 2008.
[26] G. Marquis, M. Bäckström and A. Siljander, "Multiaxial fatigue damage parameters for
welded joints: Design code and critical plane approaches.," in In: Blom,A.F. (ed.).Welded
High-Strength Steel Structures. Proceedings of the First North European Engineering
and Science Conference (NESCO I), Sweden, Stockholm 8-9 October. London: EMAS
Publishing. Pp. 127–141., Stockholm, 1997.
[27] B. C. A. P.A. Wawrzynek, "Advances in Simulation of Arbitrary 3D Crack Growh using
FRANC3D/NG," Cornell University, Ithaca, NY, USA.
[28] Fracture Analysis Consultants, Inc, " Franc 3D Version 6 Reference Manual,"
www.fracanalysis.com, 2011.
[29] Fracture Analysis Consultants, Inc, "www.fracanalysis.com," Feb 2013. [Online].
[30] A. A. Bhatti, "3D Fracture analysis of cold lap weld defect in welded structures," Master
Thesis, Dept. of Aeronautical and Vehicle Engineering, KTH, Srockholm, 2010.
[31] A. M. Al-Mukhtar, H. Biermann, P. Hübner and S. Henkel, "The Effect of Weld Profile
and Geometries of Butt Weld Joints on Fatigue Life Under Cyclic Tensile Loading,"
Journal of materials and engineering, vol. 20, no. 8, pp. 1385-1391, 2011.
[32] A. Hobbacher, "Round Robin Calculations of Fatigue Assessment by Fracture
Mechanics, IIW-Doc. XIII-2373r5-11," 2012.
[33] A. F. M. Arif and B. S. Yilbas, "Three-point bend testing of HVOF Inconel 625 coating:
FEM simulation and experimental investigation," Surface & Coatings technology, vol.
201, no. 3-4, pp. 1873-1879, 2006.
[34] MATLAB ( 7.14.0.739) R2012a, Copyright 1984-2012, The MathWorks Inc..
41
TRITA-AVE AVE 2014:04
ISSN 1651-7660
www.kth.se
www.lightweightstructures.se