Embed Size (px)
Citation preview

Nordic Steel Construction Conference 2012
Hotel Bristol, Oslo, Norway
5-7 September 2012
Fatigue Assessment of Weld Terminations in Welded Cover-Plate Details;
a Comparison of Local Approaches
Mohsen Heshmatia, Mohammad Al-Emrania, Bo Edlunda
a Chalmers University of Technology, Dept. of Civil and Environmental Engineering, Göteborg, Sweden
Abstract: Local fatigue assessment approaches have drawn engineers’ attention since their
advent. However, up to now, none of the available fatigue assessment codes has explicitly
given instructions for assessing details with weld terminations using these approaches. In the
present paper, the structural hot spot stress concept, according to different suggestions, as well
as the effective notch stress method are reviewed and applied to cover-plate details, with and
without transverse end weld. The predicted fatigue lives according to these methods are com-
pared with each other and with a large set of fatigue test results. Eventually, based on the
comparisons, recommendations for the assessment of weld terminations are given.
1 Introduction
The profound developments of the computer technologies in the past few decades have led to
the increasing application of computer based numerical methods. As a result, procedures for
the application of new FE methods for fatigue assessment of welded details have been pro-
posed in the literature [1-4]. Moreover, the advancements of welding techniques have resulted
in more complex welded details, to which neither a nominal stress nor a design category can
be assigned [5]. Therefore, local fatigue assessment approaches, which are based on the local
characteristics of fatigue phenomenon, have increasingly adopted by fatigue design associa-
tions [6,7]. As these methods are generally based on numerical methods such as the finite el-
ement method, the modelling and calculation instructions have been progressively updated.
However, up to now, none of the fatigue related codes and guidelines have explicitly given
instructions for assessing the weld terminations using the local concepts.
The stress distribution over the plate thickness in the vicinity of a weld toe is non-linear.
This peculiarity of stress distribution in welded components is primarily attributed to two dis-
tinct stress raising factors; macro-geometric stress raisers and weld notch effect. The Structur-
al Hot Spot Stress (SHSS) disregards the notch effect caused by the weld profile and compris-
es all other geometric variations at the crack initiation area (hot spot) [1,8]. The hot spot

2 Nordic Steel Construction Conference 2012
stress, by definition, is a fictitious value. Nevertheless, as demonstrated in [1], in plate and
shell structures it corresponds to the sum of membrane and bending stresses at the weld toe.
The conventional method for the SHSS determination is to extrapolate the perpendicular
surface stress component at certain reference points to the weld toe [7]. The utilized stress can
be obtained either from experiment or appropriate finite element modelling. In addition to
that, over the last few years, by further advancements of computational possibilities, other var-
iants of the structural hot spot stress method have been developed. Among these methods, par-
ticularly the approaches proposed by Dong et al. [9] and Xiao and Yamada [10] have drawn
more attention. Fig. 1 shows a summary of the most common structural stress determination
approaches.
A relatively more advanced local fatigue assessment approach is known as the effective
notch stress method. This method, that does not consider the elastic-plastic material behaviour
at the crack tip, is based on the highest computed elastic stress (notch stress) at the critical
points, i.e. weld toe and weld root. The notch stress is consisted of the sum of geometrical
stress and non-linear stress peak and consequently includes all the stress raisers effects at the
local notch. The effective notch stress method was first introduced by Radaj and Sonsino [3],
by considering stress averaging in the micro-support theory according to Neuber Rule with a
fictitious radius of 1mm for plates thicker than 5mm [7].
In order to investigate the credibility of the abovementioned fatigue assessment methods in
case of weld terminations, partial length cover-plate details with and without transverse end
weld are studied. Partial-length cover-plates are usually welded to the flanges of steel bridge
girders in order to increase the moment capacity and consequently the allowable traffic load
and span of the bridge. Numerous studies [6-8] have shown that the cover-plate end zones
have a very low fatigue resistance, see Fig. 2. According to the most well-known fatigue de-
sign codes and guidelines, the cover-plate end is the most severe of all details. The availability
of fatigue test results for this detail, with various end zone configurations, has made it suitable
for this case study.
a) Surface stress extrapolation b) Dong method c) Xiao and Yamada method
Fig. 1: Structural stress according to different approaches
a) With transverse end weld b) Without transverse end weld
Fig. 2: Fatigue cracks in cover-plate ends with different end weld configurations

Nordic Steel Construction Conference 2012 3
2 Structural hot spot stress determination methods
2.1 Surface stress extrapolation
The surface stress extrapolation is the conventional method to exclude the non-linear stress
peak from the surface stress and determine the SHSS. In this method the SHSS can be
achieved by extrapolating the surface stress towards the weld toe at certain reference points.
These points are located within a reasonable distance from the weld toe where the stress is not
influenced by the weld geometry. Comparative investigations have shown that for the fatigue
cracks initiating from the main-plate surface, the reference points are located at distances from
weld toe which are fractions of the plate thickness. It is generally accepted that at a distance of
0.4t from the weld toe, the stress is not anymore affected by the weld geometry. An assump-
tion of linear stress distribution is normally sufficient. In such a case, the second extrapolation
reference point is placed at 1.0t from the weld toe. However, in cases of pronounced non-
linear structural increase towards the weld toe (e.g. welded cover-plate on a beam flange), lin-
ear extrapolation might underestimate the actual SHSS. Alternatively, a quadratic extrapola-
tion of the stresses at 0.4t, 0.9t and 1.4t is suggested.
The surface stress profile in front of the weld toe can be obtained by means of finite ele-
ment analysis. Nevertheless, systematic stress analysis of various details with different ele-
ment types and mesh qualities have confirmed that certain rules for the finite element model-
ling and stress evaluation have to be essentially followed to obtain comparable results
[2,8,11,12]. IIW recommendations [7], proposes two meshing densities for shell and solid el-
ements; fine and coarse mesh. In this study, quadratic extrapolation of the stresses obtained
from 3D solid element models with fine meshes is used.
2.2 Dong method
Dong [9] has proposed another method for the structural stress calculation based on trough
thickness stress linearization at a distance δ from the weld toe. As approaching the weld toe,
the obtained stress values become affected by the asymptotic singularity caused by the notch.
Consequently, the local stresses near the notch are mesh size sensitive. The Dong method is
claimed to be mesh insensitive as it makes use of the stresses at a distance δ from the weld
toe. In this method, the structural stress can be derived by establishing the equilibrium condi-
tions at the weld toe for the normal and shear stresses acting in the distance δ (see Fig. 3). As
illustrated in Fig. 3c, for the case of non-monotonic through thickness stress distribution, such
as symmetric fillet welded attachments or thick sections, the linearization is performed to a
finite depth t1≤t. Subsequently by imposing equilibrium conditions between sections A-A´ and
B-B´, it can be concluded that the structural stress components must satisfy the following
conditions:
∫∫ ⋅⋅+⋅⋅=δ
yx
t
xm dx(x)τt
dy(y)σt
σ0
10
1
11 1
(1)
∫∫∫ ⋅⋅+⋅⋅+⋅⋅=⋅+⋅δ
στδσσ000
2
1
2
1 11
62dxx(x)dy(y)dyy(y)σ
tty
t
xy
t
xbm (2)
Although the Dong method is claimed to be mesh insensitive, investigations reported in
[11,12] have shown a considerable mesh sensitivity in case of solid elements. Disregarding
the influence of the shear stresses acting in the lateral faces of the elements has been found to
be the reason for this observation. Nevertheless, according to [12], at δ= 0.4t, the influence of
the side shear stresses is negligible.

4 Nordic Steel Construction Conference 2012
2.3 Xiao and Yamada method
Xiao and Yamada [10] have proposed an unconventional structural stress concept based on
the calculated stress at depth 1mm below the weld toe. In order to obtain the structural stress
according to this procedure, the finite element model has to be constructed with a necessarily
fine mesh that is capable of providing the stress at 1mm in depth with an acceptable accuracy.
This method has been evaluated in various investigations [13,14]. The results are generally
reported to be in good agreement with experimental evaluations. Fricke and Kahl [13] have
recommended using only elements without mid-side nodes in case of shell elements of 1mm
length. Furthermore, based on assessments of partially load-carrying cover-plates and fully
load-carrying lap joints, Feltz and Fricke [14] suggested utilizing maximum principal stress
component of the finite element analysis results.
3 Effective Notch Stress (ENS) method
The fatigue life, irrespective of the joint geometry, can be correlated to the effective notch
stress range using a single design class. The notch stress can only be computed using numeri-
cal methods such as the finite element method. For plates thicker than 5mm, weld toe or root
is rounded with the reference radius of 1mm. However, in order for the numerical methods
such as the finite element method to be capable of calculating the total stress at the critical
sections, a sufficient element density has to be maintained. Thus, in order to get accurate re-
sults, it is principally important in this method to model the anticipated crack initiation area
with an extremely fine mesh. This can be achieved by using 3D solid elements as well as 2D
planar elements as long as a certain mesh size is generated.
Fricke [15] has given the practical information for analysis according to this method. It
should be noted that, although the approach can be applied to complex details, it requires con-
siderably more modelling and analysis work effort than the SHSS approach. Despite the fact
that the practical application of the ENS method is generally well-defined, it is devoid of any
instructions regarding the assessment of weld terminations. Aiming to obtain valid weld end’s
representative modelling and assessment procedures, Kaffenberger et al. [16] conducted a
comparative experimental and numerical study. The study was primarily aimed to obtain rec-
ommendations for thin sheet structures. Therefore, in order to avoid modelling incompatibili-
ties for thicker structures, a standardised model is proposed for t=2.24 mm and r=0.2 mm. The
proposed model can be scaled up linearly for other plate thicknesses as shown in Fig. 4. The
authors have demonstrated the applicability of this model to plates up to 20 mm thick.
a) Trough thickness stress dis-
tribution
b) Monotonic stress distribution c) Non-monotonic stress dis-
tribution
Fig. 3: The structural stress according to Dong

Nordic Steel Construction Conference 2012 5
4 Fatigue life assessment of cover-plate details
4.1 Existing fatigue test data
I-beams with welded cover-plates are among the most fatigue tested details. This is, on the
one hand, due to the frequent application of this detail in the bridge industry, and on the other
hand, as a consequence of its very poor exhibited fatigue strength. In this study, a total number
of 260 fatigue test data of square-ended cover-plate details, with and without transverse end
welds, are collected [17,18] (see Fig. 2). Table 1 presents a summary of the collected test se-
ries, while all the test data are plotted in Fig. 5. It should be mentioned that, the crack initia-
tion location was reported similarly depending on the end weld configuration, in all cases. For
the case of welded end cover-plates (W), the fatigue crack initiated from the weld toe in the
flange mid-section, whereas fatigue cracking initiated from the weld end in the side-section of
the flange for not-welded end cover-plates (NW), see Fig. 2.
Table 1: The collected fatigue test series of square-ended cover-plate details; statistical evaluation
of the data is performed according to EC 3 and with a fixed slope of 3.
Detail Data End weld Main plate [mm] Cover plate [mm] tc/tm ∆σmean ∆σC St.D.
Thickness Width Thickness Width [MPa] [MPa]
CT W 30 W 9.5 171 19 114 2 62.7 54.3 0.103
CT U 18 NW 9.5 171 19 114 2 64.9 56.2 0.100
CR W 102 W 9.5 171 14.3 114 1.5 62.0 54.4 0.099
CR U 99 NW 9.5 171 14.3 114 1.5 68.4 58.5 0.121
CS W 5 W 19 127 12.7 101 0.7 79.6 72.0 0.056
CS U 6 NW 19 127 12.7 101 0.7 89.6 72.1 0.116
All tests 260 W&NW - - - - - 65.4 54.8 0.136
As it is apparent in Table 1, cover-plates without end welds exhibit negligibly higher fa-
tigue strength than those with transverse end welds. Therefore, it can be concluded that, the
fatigue life of cover-plate details is practically independent of the end weld configuration.
This observation, which is consistent with the previous studies [17,19], implies that the stress
concentration severity of cover-plates with and without transverse end welds has to be identi-
cal. Furthermore, the fatigue assessment of seam welds according to local approaches is well
established and verified. Hence, a comparative study of cover-plates with and without end
welds can be performed to evaluate the validity of the applied approach for fatigue assessment
of weld ends.
a) Construction of idealised weld end b) Meshing recommendations
Fig. 4: Modelling of weld terminations according to the ENS method as proposed in [16]

6 Nordic Steel Construction Conference 2012
4.2 Fatigue life assessment according to the SHSS approach
As discussed before, the structural hot spot stress can be obtained in different ways. The basis
of all these methods is to exclude the notch effect from the total stress value. Thus, as long as
the same weld stiffness is provided, the hot spot stress would be independent of the weld
shape. This characteristic of the SHSS approach makes it less affected by a correct representa-
tion of the weld profile compared to other local fatigue assessment methods. The effect of
modelling the shape of weld ends is investigated in this study by computing the hot spot stress
for different weld end models as depicted in Fig. 6. The results confirm the insignificant varia-
tion of the structural hot spot stress value for the investigated details.
For the Dong stress calculation, the cover-plates with transverse end welds were treated ac-
cording to the non-monotonic through thickness stress distribution with t1 equal to the flange
thickness. This was due to the presence of web plate underneath the crack initiation location
in these details. For the case of cover-plates without transverse end welds, a monotonic stress
distribution through the flange thickness was assumed.
Calculation of the hot-spot stress according to the Dong method requires a determination of
the section at which equilibrium is to be satisfied. There is thus a need to study how the calcu-
lated hot spot stress varies as a function of the distance δ. As shown in Fig. 7a, the structural
stress obtained from the Dong method deviates as δ changes. This finding supports the notion
raised in other studies that disregarding the shear stresses on the element sides, makes the
Dong method δ-dependent. However, as proposed in [12], this effect is minimized by choos-
ing δ=0.4t.
Fig. 5: Fatigue test results of square-ended cover-plate details
a) Type a b) Type b c) Type c
Fig. 6: Different methods to model the weld end

Nordic Steel Construction Conference 2012 7
The structural stress calculation results obtained from different methods for CR cover-plate
test series are plotted in Fig. 7b. As it was shown in Table 1 for this test series, cover-plates
without transverse end weld (CR U) have exhibited slightly higher fatigue lives than those
with transverse end weld (CR W). Nevertheless, as it is apparent in Fig. 7b, a higher stress
concentration factor is obtained for cover-plates without transverse end weld, irrespective of
the SHSS derivation method. This observation, which is inconsistent with the experimental
results, is significantly reduced when the hot spot stress is calculated according to the Dong
method, where the two derived stress concentration factors are almost identical.
Fig. 8 demonstrates the fatigue lives for the cover-plate details derived from fatigue tests
and predicted by different fatigue assessment approaches according to Eurocode3 [6]. As can
be seen, when using the SHSS approach, the predicted fatigue lives for cover-plate details
without transverse end weld are significantly more conservative than those for cover-plate de-
tails with transverse end weld. However, the fatigue life predicted by the Dong method is in a
better agreement with the test results. For the case of cover-plates with transverse end weld,
both the conventional extrapolation [7], and Xiao and Yamada [10] methods are capable of
predicting the fatigue life with an acceptable accuracy, provided that 20node quadratic ele-
ments are used. The nominal stress method, on the other hand, considers a single fatigue de-
sign class for cover-plate details irrespective of the end weld condition, and accordingly yields
a) Structural stress concentration factor as a func-
tion of distance from weld toe (δ) b) Structural stress concentration factors obtained
from different methods for cover-plates Fig. 7: Variations of the structural stress concentration factor
Fig. 8: Fatigue lives for the cover-plate details derived from fatigue tests and predicted by different
fatigue assessment approaches

8 Nordic Steel Construction Conference 2012
the same fatigue life prediction for both test series. When using the nominal stress method, the
predicted fatigue life for the CR U test series is very close to the test results, whereas it is only
slightly overestimated for the CR W test series. Having mentioned that, the nominal stress
classifications have been directly obtained from experimental results, the acceptable con-
sistency of fatigue life predictions can be justified.
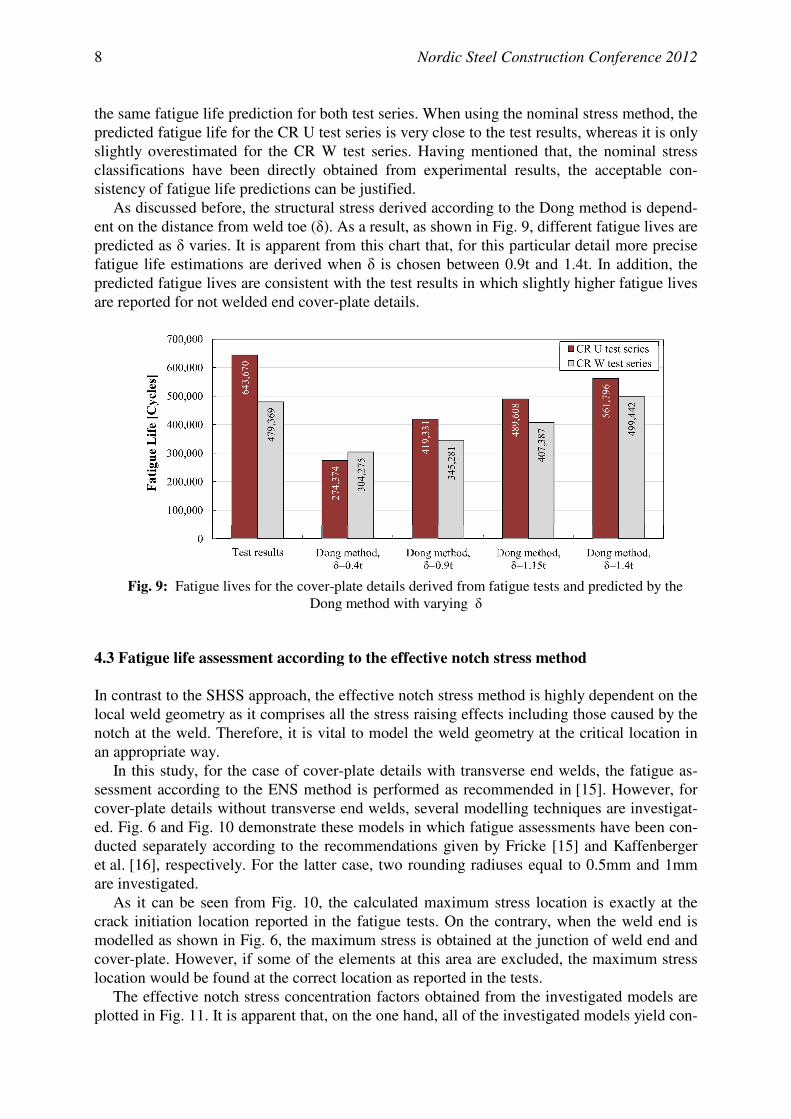
As discussed before, the structural stress derived according to the Dong method is depend-
ent on the distance from weld toe (δ). As a result, as shown in Fig. 9, different fatigue lives are
predicted as δ varies. It is apparent from this chart that, for this particular detail more precise
fatigue life estimations are derived when δ is chosen between 0.9t and 1.4t. In addition, the
predicted fatigue lives are consistent with the test results in which slightly higher fatigue lives
are reported for not welded end cover-plate details.
4.3 Fatigue life assessment according to the effective notch stress method
In contrast to the SHSS approach, the effective notch stress method is highly dependent on the
local weld geometry as it comprises all the stress raising effects including those caused by the
notch at the weld. Therefore, it is vital to model the weld geometry at the critical location in
an appropriate way.
In this study, for the case of cover-plate details with transverse end welds, the fatigue as-
sessment according to the ENS method is performed as recommended in [15]. However, for
cover-plate details without transverse end welds, several modelling techniques are investigat-
ed. Fig. 6 and Fig. 10 demonstrate these models in which fatigue assessments have been con-
ducted separately according to the recommendations given by Fricke [15] and Kaffenberger
et al. [16], respectively. For the latter case, two rounding radiuses equal to 0.5mm and 1mm
are investigated.
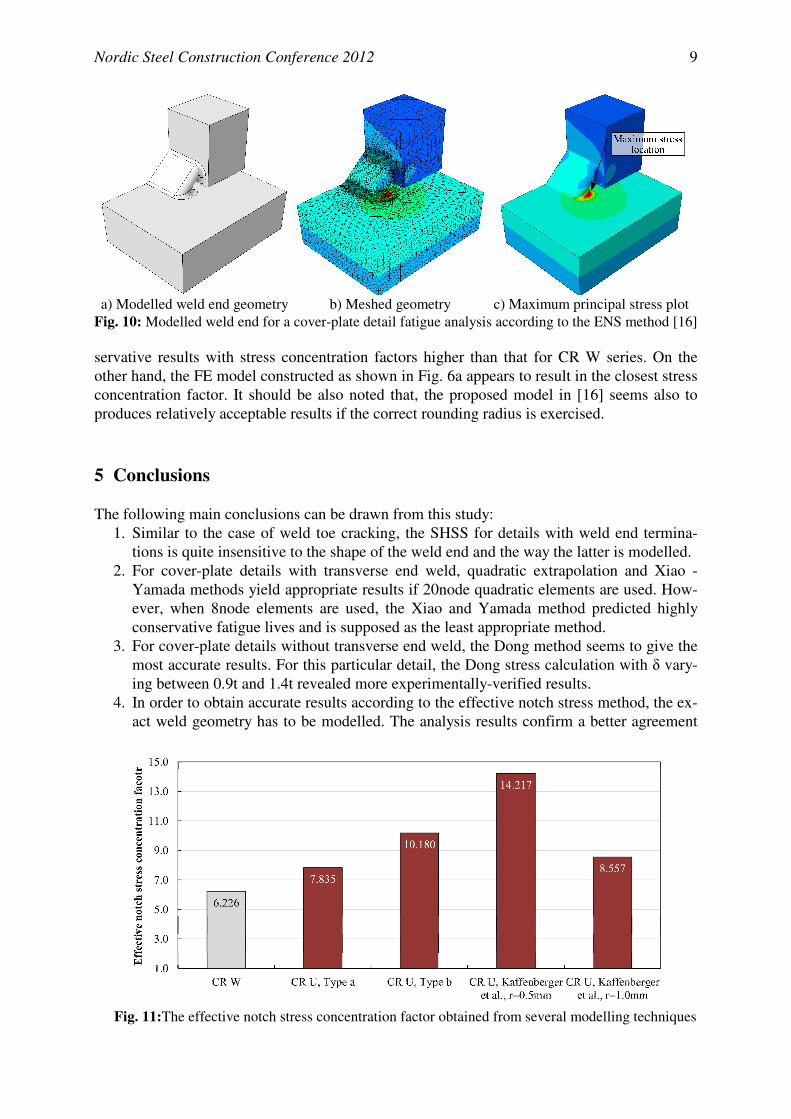
As it can be seen from Fig. 10, the calculated maximum stress location is exactly at the
crack initiation location reported in the fatigue tests. On the contrary, when the weld end is
modelled as shown in Fig. 6, the maximum stress is obtained at the junction of weld end and
cover-plate. However, if some of the elements at this area are excluded, the maximum stress
location would be found at the correct location as reported in the tests.
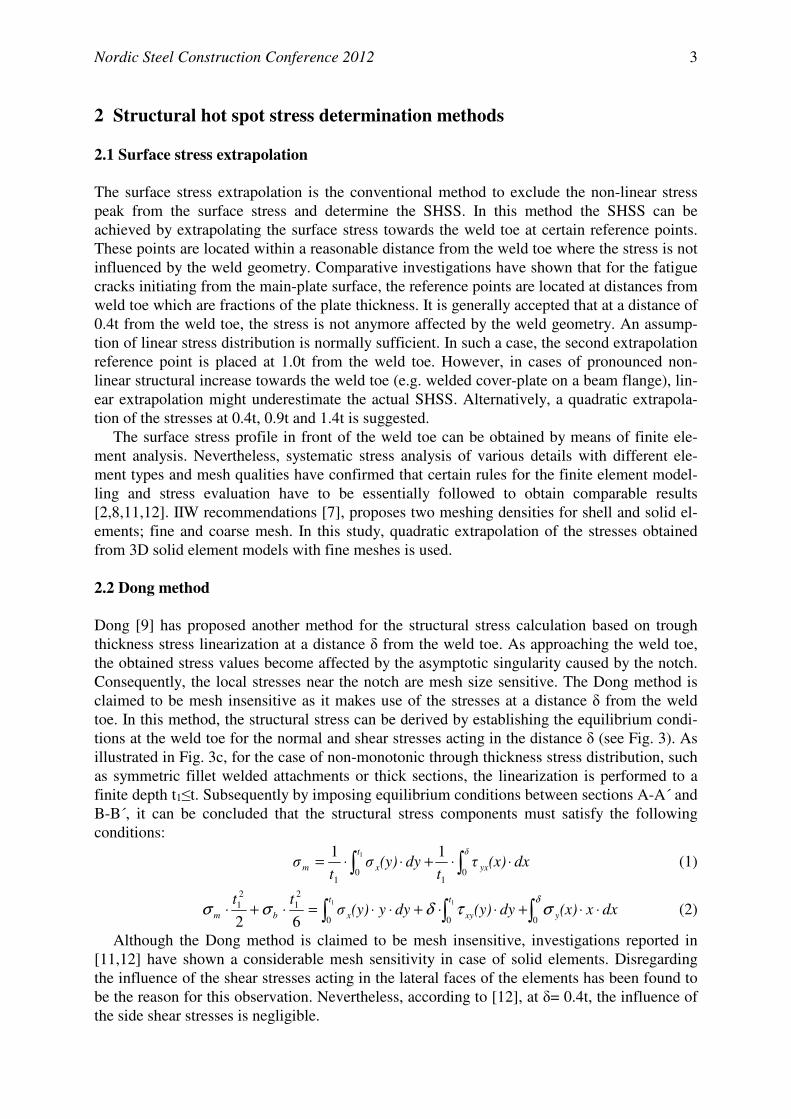
The effective notch stress concentration factors obtained from the investigated models are
plotted in Fig. 11. It is apparent that, on the one hand, all of the investigated models yield con-
Fig. 9: Fatigue lives for the cover-plate details derived from fatigue tests and predicted by the
Dong method with varying δ
Nordic Steel Construction Conference 2012 9
servative results with stress concentration factors higher than that for CR W series. On the
other hand, the FE model constructed as shown in Fig. 6a appears to result in the closest stress
concentration factor. It should be also noted that, the proposed model in [16] seems also to
produces relatively acceptable results if the correct rounding radius is exercised.
5 Conclusions
The following main conclusions can be drawn from this study:
1. Similar to the case of weld toe cracking, the SHSS for details with weld end termina-
tions is quite insensitive to the shape of the weld end and the way the latter is modelled.
2. For cover-plate details with transverse end weld, quadratic extrapolation and Xiao -
Yamada methods yield appropriate results if 20node quadratic elements are used. How-
ever, when 8node elements are used, the Xiao and Yamada method predicted highly
conservative fatigue lives and is supposed as the least appropriate method.
3. For cover-plate details without transverse end weld, the Dong method seems to give the
most accurate results. For this particular detail, the Dong stress calculation with δ vary-
ing between 0.9t and 1.4t revealed more experimentally-verified results.
4. In order to obtain accurate results according to the effective notch stress method, the ex-
act weld geometry has to be modelled. The analysis results confirm a better agreement
Fig. 11:The effective notch stress concentration factor obtained from several modelling techniques
a) Modelled weld end geometry b) Meshed geometry c) Maximum principal stress plot
Fig. 10: Modelled weld end for a cover-plate detail fatigue analysis according to the ENS method [16]

10 Nordic Steel Construction Conference 2012
with the test results when the weld termination is modelled as shown in Fig.6a.
5. Providing that an appropriate rounding radius is applied, acceptable results can be ex-
pected from the method proposed by Kaffenberger et al. [16] for weld end assessments.
A radius of 1mm seems to yield the best results for the details studied in this paper.
References
[1] Radaj D, Design and analysis of fatigue resistant welded structures, Woodhead, 1990.
[2] Fricke W, Recommended hot-spot analysis procedure for structural details of ships and
FPSOs based on round-robin FE analyses, International Journal of Offshore and Polar
Engineering, 12(1), 40-47, 2002.
[3] Radaj D, Sonsino C M, and Fricke W, Fatigue assessment of welded joints by local ap-
proaches, Woodhead Publishing, second edition, 2006.
[4] Lotsberg I, Fatigue design of plated structures using finite element analysis, Ships Off-
shore Structures, 1(1), 45-54, 2006.
[5] Marquis G, and Samuelsson J, Modelling and fatigue life assessment of complex struc-
tures, Materialwissenschaft und Werkstofftechnik, 36(11), 678-684, November 2005.
[6] Eurocode3, Design of steel structures: Fatigue, European Standard, May 2005.
[7] Hobbacher A, Recommendations for fatigue design of welded joints and components,
IIW document no. Technical report, IIW-1823-07, International Institute of Welding,
December 2008.
[8] Niemi E, Fricke W, Maddox S J, Fatigue Analysis of Welded Components: Designer’s
Guide to the Structural Hot-spot Stress Approach, Woodhead Publishing, 2006.
[9] Dong P, A structural stress definition and numerical implementation for fatigue analy-
sis of welded joints, International Journal of Fatigue, 23(10), 865-876, 2001.
[10] Xiao Z G, and Yamada K, A method of determining geometric stress for fatigue strength
evaluation of steel welded joints, Int. journal of fatigue, 26(12), 1277-1293, 2004.
[11] Doerk O, Fricke W, and Weissenborn C, Comparison of different calculation methods
for structural stresses at welded joints, Int. journal of fatigue, 25(5), 359-369, 2003.
[12] Poutiainen I, Tanskanen P, and Marquis G, Finite element methods for structural hot
spot stress determination-a comparison of procedures, Int. journal of fatigue, 26(11),
1147-1157, 2004.
[13] Fricke W, and Kahl A, Comparison of different structural stress approaches for fatigue
assessment of welded ship structures, Marine structures, 18(7-8), 473-488, 2005.
[14] Feltz O, and Fricke W, Fatigue tests and numerical analyses of partial-load and full-
load carrying fillet welds at cover plates and lap joints, Welding in the World, 54(7-8),
225–233, 2010.
[15] Fricke W, Guideline for the fatigue assessment by notch stress analysis for welded
structures, International Institute of Welding, 2008.
[16] Kaffenberger M, Malikoutsakis M, Savaidis G, Vormwald M, Fatigue resistance of
weld ends, Computational Materials Science, 52(1), 287-292, 2002.
[17] Fisher J W, Frank K H, Hirt M A, and McNamee B M, Effect of weldments on the fa-
tigue strength of steel beams, Fritz engineering laboratory report No. 334.2, 1969.
[18] Hall L R, Stallmeyer J E, The fatigue strength of flexural members, Fatigue committee,
welding research council, 1959.
[19] Munse W H, and Stallmeyer J E, Fatigue in welded beams and girders, Highway Re-
search Board Bulletin, 1962.

Nordic Steel Construction Conference 2012
Hotel Bristol, Oslo, Norway
5-7 September 2012
Fatigue Assessment of Weld Terminations in Welded Cover-Plate Details;
a Comparison of Local Approaches
Mohsen Heshmatia, Mohammad Al-Emrania, Bo Edlunda
a Chalmers University of Technology, Dept. of Civil and Environmental Engineering, Göteborg, Sweden
Abstract: Local fatigue assessment approaches have drawn engineers’ attention since their
advent. However, up to now, none of the available fatigue assessment codes has explicitly
given instructions for assessing details with weld terminations using these approaches. In the
present paper, the structural hot spot stress concept, according to different suggestions, as well
as the effective notch stress method are reviewed and applied to cover-plate details, with and
without transverse end weld. The predicted fatigue lives according to these methods are com-
pared with each other and with a large set of fatigue test results. Eventually, based on the
comparisons, recommendations for the assessment of weld terminations are given.
1 Introduction
The profound developments of the computer technologies in the past few decades have led to
the increasing application of computer based numerical methods. As a result, procedures for
the application of new FE methods for fatigue assessment of welded details have been pro-
posed in the literature [1-4]. Moreover, the advancements of welding techniques have resulted
in more complex welded details, to which neither a nominal stress nor a design category can
be assigned [5]. Therefore, local fatigue assessment approaches, which are based on the local
characteristics of fatigue phenomenon, have increasingly adopted by fatigue design associa-
tions [6,7]. As these methods are generally based on numerical methods such as the finite el-
ement method, the modelling and calculation instructions have been progressively updated.
However, up to now, none of the fatigue related codes and guidelines have explicitly given
instructions for assessing the weld terminations using the local concepts.
The stress distribution over the plate thickness in the vicinity of a weld toe is non-linear.
This peculiarity of stress distribution in welded components is primarily attributed to two dis-
tinct stress raising factors; macro-geometric stress raisers and weld notch effect. The Structur-
al Hot Spot Stress (SHSS) disregards the notch effect caused by the weld profile and compris-
es all other geometric variations at the crack initiation area (hot spot) [1,8]. The hot spot

2 Nordic Steel Construction Conference 2012
stress, by definition, is a fictitious value. Nevertheless, as demonstrated in [1], in plate and
shell structures it corresponds to the sum of membrane and bending stresses at the weld toe.
The conventional method for the SHSS determination is to extrapolate the perpendicular
surface stress component at certain reference points to the weld toe [7]. The utilized stress can
be obtained either from experiment or appropriate finite element modelling. In addition to
that, over the last few years, by further advancements of computational possibilities, other var-
iants of the structural hot spot stress method have been developed. Among these methods, par-
ticularly the approaches proposed by Dong et al. [9] and Xiao and Yamada [10] have drawn
more attention. Fig. 1 shows a summary of the most common structural stress determination
approaches.
A relatively more advanced local fatigue assessment approach is known as the effective
notch stress method. This method, that does not consider the elastic-plastic material behaviour
at the crack tip, is based on the highest computed elastic stress (notch stress) at the critical
points, i.e. weld toe and weld root. The notch stress is consisted of the sum of geometrical
stress and non-linear stress peak and consequently includes all the stress raisers effects at the
local notch. The effective notch stress method was first introduced by Radaj and Sonsino [3],
by considering stress averaging in the micro-support theory according to Neuber Rule with a
fictitious radius of 1mm for plates thicker than 5mm [7].
In order to investigate the credibility of the abovementioned fatigue assessment methods in
case of weld terminations, partial length cover-plate details with and without transverse end
weld are studied. Partial-length cover-plates are usually welded to the flanges of steel bridge
girders in order to increase the moment capacity and consequently the allowable traffic load
and span of the bridge. Numerous studies [6-8] have shown that the cover-plate end zones
have a very low fatigue resistance, see Fig. 2. According to the most well-known fatigue de-
sign codes and guidelines, the cover-plate end is the most severe of all details. The availability
of fatigue test results for this detail, with various end zone configurations, has made it suitable
for this case study.
a) Surface stress extrapolation b) Dong method c) Xiao and Yamada method
Fig. 1: Structural stress according to different approaches
a) With transverse end weld b) Without transverse end weld
Fig. 2: Fatigue cracks in cover-plate ends with different end weld configurations
Nordic Steel Construction Conference 2012 3
2 Structural hot spot stress determination methods
2.1 Surface stress extrapolation
The surface stress extrapolation is the conventional method to exclude the non-linear stress
peak from the surface stress and determine the SHSS. In this method the SHSS can be
achieved by extrapolating the surface stress towards the weld toe at certain reference points.
These points are located within a reasonable distance from the weld toe where the stress is not
influenced by the weld geometry. Comparative investigations have shown that for the fatigue
cracks initiating from the main-plate surface, the reference points are located at distances from
weld toe which are fractions of the plate thickness. It is generally accepted that at a distance of
0.4t from the weld toe, the stress is not anymore affected by the weld geometry. An assump-
tion of linear stress distribution is normally sufficient. In such a case, the second extrapolation
reference point is placed at 1.0t from the weld toe. However, in cases of pronounced non-
linear structural increase towards the weld toe (e.g. welded cover-plate on a beam flange), lin-
ear extrapolation might underestimate the actual SHSS. Alternatively, a quadratic extrapola-
tion of the stresses at 0.4t, 0.9t and 1.4t is suggested.
The surface stress profile in front of the weld toe can be obtained by means of finite ele-
ment analysis. Nevertheless, systematic stress analysis of various details with different ele-
ment types and mesh qualities have confirmed that certain rules for the finite element model-
ling and stress evaluation have to be essentially followed to obtain comparable results
[2,8,11,12]. IIW recommendations [7], proposes two meshing densities for shell and solid el-
ements; fine and coarse mesh. In this study, quadratic extrapolation of the stresses obtained
from 3D solid element models with fine meshes is used.
2.2 Dong method
Dong [9] has proposed another method for the structural stress calculation based on trough
thickness stress linearization at a distance δ from the weld toe. As approaching the weld toe,
the obtained stress values become affected by the asymptotic singularity caused by the notch.
Consequently, the local stresses near the notch are mesh size sensitive. The Dong method is
claimed to be mesh insensitive as it makes use of the stresses at a distance δ from the weld
toe. In this method, the structural stress can be derived by establishing the equilibrium condi-
tions at the weld toe for the normal and shear stresses acting in the distance δ (see Fig. 3). As
illustrated in Fig. 3c, for the case of non-monotonic through thickness stress distribution, such
as symmetric fillet welded attachments or thick sections, the linearization is performed to a
finite depth t1≤t. Subsequently by imposing equilibrium conditions between sections A-A´ and
B-B´, it can be concluded that the structural stress components must satisfy the following
conditions:
∫∫ ⋅⋅+⋅⋅=δ
yx
t
xm dx(x)τt
dy(y)σt
σ0
10
1
11 1
(1)
∫∫∫ ⋅⋅+⋅⋅+⋅⋅=⋅+⋅δ
στδσσ000
2
1
2
1 11
62dxx(x)dy(y)dyy(y)σ
tty
t
xy
t
xbm (2)
Although the Dong method is claimed to be mesh insensitive, investigations reported in
[11,12] have shown a considerable mesh sensitivity in case of solid elements. Disregarding
the influence of the shear stresses acting in the lateral faces of the elements has been found to
be the reason for this observation. Nevertheless, according to [12], at δ= 0.4t, the influence of
the side shear stresses is negligible.

4 Nordic Steel Construction Conference 2012
2.3 Xiao and Yamada method
Xiao and Yamada [10] have proposed an unconventional structural stress concept based on
the calculated stress at depth 1mm below the weld toe. In order to obtain the structural stress
according to this procedure, the finite element model has to be constructed with a necessarily
fine mesh that is capable of providing the stress at 1mm in depth with an acceptable accuracy.
This method has been evaluated in various investigations [13,14]. The results are generally
reported to be in good agreement with experimental evaluations. Fricke and Kahl [13] have
recommended using only elements without mid-side nodes in case of shell elements of 1mm
length. Furthermore, based on assessments of partially load-carrying cover-plates and fully
load-carrying lap joints, Feltz and Fricke [14] suggested utilizing maximum principal stress
component of the finite element analysis results.
3 Effective Notch Stress (ENS) method
The fatigue life, irrespective of the joint geometry, can be correlated to the effective notch
stress range using a single design class. The notch stress can only be computed using numeri-
cal methods such as the finite element method. For plates thicker than 5mm, weld toe or root
is rounded with the reference radius of 1mm. However, in order for the numerical methods
such as the finite element method to be capable of calculating the total stress at the critical
sections, a sufficient element density has to be maintained. Thus, in order to get accurate re-
sults, it is principally important in this method to model the anticipated crack initiation area
with an extremely fine mesh. This can be achieved by using 3D solid elements as well as 2D
planar elements as long as a certain mesh size is generated.
Fricke [15] has given the practical information for analysis according to this method. It
should be noted that, although the approach can be applied to complex details, it requires con-
siderably more modelling and analysis work effort than the SHSS approach. Despite the fact
that the practical application of the ENS method is generally well-defined, it is devoid of any
instructions regarding the assessment of weld terminations. Aiming to obtain valid weld end’s
representative modelling and assessment procedures, Kaffenberger et al. [16] conducted a
comparative experimental and numerical study. The study was primarily aimed to obtain rec-
ommendations for thin sheet structures. Therefore, in order to avoid modelling incompatibili-
ties for thicker structures, a standardised model is proposed for t=2.24 mm and r=0.2 mm. The
proposed model can be scaled up linearly for other plate thicknesses as shown in Fig. 4. The
authors have demonstrated the applicability of this model to plates up to 20 mm thick.
a) Trough thickness stress dis-
tribution
b) Monotonic stress distribution c) Non-monotonic stress dis-
tribution
Fig. 3: The structural stress according to Dong

Nordic Steel Construction Conference 2012 5
4 Fatigue life assessment of cover-plate details
4.1 Existing fatigue test data
I-beams with welded cover-plates are among the most fatigue tested details. This is, on the
one hand, due to the frequent application of this detail in the bridge industry, and on the other
hand, as a consequence of its very poor exhibited fatigue strength. In this study, a total number
of 260 fatigue test data of square-ended cover-plate details, with and without transverse end
welds, are collected [17,18] (see Fig. 2). Table 1 presents a summary of the collected test se-
ries, while all the test data are plotted in Fig. 5. It should be mentioned that, the crack initia-
tion location was reported similarly depending on the end weld configuration, in all cases. For
the case of welded end cover-plates (W), the fatigue crack initiated from the weld toe in the
flange mid-section, whereas fatigue cracking initiated from the weld end in the side-section of
the flange for not-welded end cover-plates (NW), see Fig. 2.
Table 1: The collected fatigue test series of square-ended cover-plate details; statistical evaluation
of the data is performed according to EC 3 and with a fixed slope of 3.
Detail Data End weld Main plate [mm] Cover plate [mm] tc/tm ∆σmean ∆σC St.D.
Thickness Width Thickness Width [MPa] [MPa]
CT W 30 W 9.5 171 19 114 2 62.7 54.3 0.103
CT U 18 NW 9.5 171 19 114 2 64.9 56.2 0.100
CR W 102 W 9.5 171 14.3 114 1.5 62.0 54.4 0.099
CR U 99 NW 9.5 171 14.3 114 1.5 68.4 58.5 0.121
CS W 5 W 19 127 12.7 101 0.7 79.6 72.0 0.056
CS U 6 NW 19 127 12.7 101 0.7 89.6 72.1 0.116
All tests 260 W&NW - - - - - 65.4 54.8 0.136
As it is apparent in Table 1, cover-plates without end welds exhibit negligibly higher fa-
tigue strength than those with transverse end welds. Therefore, it can be concluded that, the
fatigue life of cover-plate details is practically independent of the end weld configuration.
This observation, which is consistent with the previous studies [17,19], implies that the stress
concentration severity of cover-plates with and without transverse end welds has to be identi-
cal. Furthermore, the fatigue assessment of seam welds according to local approaches is well
established and verified. Hence, a comparative study of cover-plates with and without end
welds can be performed to evaluate the validity of the applied approach for fatigue assessment
of weld ends.
a) Construction of idealised weld end b) Meshing recommendations
Fig. 4: Modelling of weld terminations according to the ENS method as proposed in [16]

6 Nordic Steel Construction Conference 2012
4.2 Fatigue life assessment according to the SHSS approach
As discussed before, the structural hot spot stress can be obtained in different ways. The basis
of all these methods is to exclude the notch effect from the total stress value. Thus, as long as
the same weld stiffness is provided, the hot spot stress would be independent of the weld
shape. This characteristic of the SHSS approach makes it less affected by a correct representa-
tion of the weld profile compared to other local fatigue assessment methods. The effect of
modelling the shape of weld ends is investigated in this study by computing the hot spot stress
for different weld end models as depicted in Fig. 6. The results confirm the insignificant varia-
tion of the structural hot spot stress value for the investigated details.
For the Dong stress calculation, the cover-plates with transverse end welds were treated ac-
cording to the non-monotonic through thickness stress distribution with t1 equal to the flange
thickness. This was due to the presence of web plate underneath the crack initiation location
in these details. For the case of cover-plates without transverse end welds, a monotonic stress
distribution through the flange thickness was assumed.
Calculation of the hot-spot stress according to the Dong method requires a determination of
the section at which equilibrium is to be satisfied. There is thus a need to study how the calcu-
lated hot spot stress varies as a function of the distance δ. As shown in Fig. 7a, the structural
stress obtained from the Dong method deviates as δ changes. This finding supports the notion
raised in other studies that disregarding the shear stresses on the element sides, makes the
Dong method δ-dependent. However, as proposed in [12], this effect is minimized by choos-
ing δ=0.4t.
Fig. 5: Fatigue test results of square-ended cover-plate details
a) Type a b) Type b c) Type c
Fig. 6: Different methods to model the weld end

Nordic Steel Construction Conference 2012 7
The structural stress calculation results obtained from different methods for CR cover-plate
test series are plotted in Fig. 7b. As it was shown in Table 1 for this test series, cover-plates
without transverse end weld (CR U) have exhibited slightly higher fatigue lives than those
with transverse end weld (CR W). Nevertheless, as it is apparent in Fig. 7b, a higher stress
concentration factor is obtained for cover-plates without transverse end weld, irrespective of
the SHSS derivation method. This observation, which is inconsistent with the experimental
results, is significantly reduced when the hot spot stress is calculated according to the Dong
method, where the two derived stress concentration factors are almost identical.
Fig. 8 demonstrates the fatigue lives for the cover-plate details derived from fatigue tests
and predicted by different fatigue assessment approaches according to Eurocode3 [6]. As can
be seen, when using the SHSS approach, the predicted fatigue lives for cover-plate details
without transverse end weld are significantly more conservative than those for cover-plate de-
tails with transverse end weld. However, the fatigue life predicted by the Dong method is in a
better agreement with the test results. For the case of cover-plates with transverse end weld,
both the conventional extrapolation [7], and Xiao and Yamada [10] methods are capable of
predicting the fatigue life with an acceptable accuracy, provided that 20node quadratic ele-
ments are used. The nominal stress method, on the other hand, considers a single fatigue de-
sign class for cover-plate details irrespective of the end weld condition, and accordingly yields
a) Structural stress concentration factor as a func-
tion of distance from weld toe (δ) b) Structural stress concentration factors obtained
from different methods for cover-plates Fig. 7: Variations of the structural stress concentration factor
Fig. 8: Fatigue lives for the cover-plate details derived from fatigue tests and predicted by different
fatigue assessment approaches
8 Nordic Steel Construction Conference 2012
the same fatigue life prediction for both test series. When using the nominal stress method, the
predicted fatigue life for the CR U test series is very close to the test results, whereas it is only
slightly overestimated for the CR W test series. Having mentioned that, the nominal stress
classifications have been directly obtained from experimental results, the acceptable con-
sistency of fatigue life predictions can be justified.
As discussed before, the structural stress derived according to the Dong method is depend-
ent on the distance from weld toe (δ). As a result, as shown in Fig. 9, different fatigue lives are
predicted as δ varies. It is apparent from this chart that, for this particular detail more precise
fatigue life estimations are derived when δ is chosen between 0.9t and 1.4t. In addition, the
predicted fatigue lives are consistent with the test results in which slightly higher fatigue lives
are reported for not welded end cover-plate details.
4.3 Fatigue life assessment according to the effective notch stress method
In contrast to the SHSS approach, the effective notch stress method is highly dependent on the
local weld geometry as it comprises all the stress raising effects including those caused by the
notch at the weld. Therefore, it is vital to model the weld geometry at the critical location in
an appropriate way.
In this study, for the case of cover-plate details with transverse end welds, the fatigue as-
sessment according to the ENS method is performed as recommended in [15]. However, for
cover-plate details without transverse end welds, several modelling techniques are investigat-
ed. Fig. 6 and Fig. 10 demonstrate these models in which fatigue assessments have been con-
ducted separately according to the recommendations given by Fricke [15] and Kaffenberger
et al. [16], respectively. For the latter case, two rounding radiuses equal to 0.5mm and 1mm
are investigated.
As it can be seen from Fig. 10, the calculated maximum stress location is exactly at the
crack initiation location reported in the fatigue tests. On the contrary, when the weld end is
modelled as shown in Fig. 6, the maximum stress is obtained at the junction of weld end and
cover-plate. However, if some of the elements at this area are excluded, the maximum stress
location would be found at the correct location as reported in the tests.
The effective notch stress concentration factors obtained from the investigated models are
plotted in Fig. 11. It is apparent that, on the one hand, all of the investigated models yield con-
Fig. 9: Fatigue lives for the cover-plate details derived from fatigue tests and predicted by the
Dong method with varying δ

Nordic Steel Construction Conference 2012 9
servative results with stress concentration factors higher than that for CR W series. On the
other hand, the FE model constructed as shown in Fig. 6a appears to result in the closest stress
concentration factor. It should be also noted that, the proposed model in [16] seems also to
produces relatively acceptable results if the correct rounding radius is exercised.
5 Conclusions
The following main conclusions can be drawn from this study:
1. Similar to the case of weld toe cracking, the SHSS for details with weld end termina-
tions is quite insensitive to the shape of the weld end and the way the latter is modelled.
2. For cover-plate details with transverse end weld, quadratic extrapolation and Xiao -
Yamada methods yield appropriate results if 20node quadratic elements are used. How-
ever, when 8node elements are used, the Xiao and Yamada method predicted highly
conservative fatigue lives and is supposed as the least appropriate method.
3. For cover-plate details without transverse end weld, the Dong method seems to give the
most accurate results. For this particular detail, the Dong stress calculation with δ vary-
ing between 0.9t and 1.4t revealed more experimentally-verified results.
4. In order to obtain accurate results according to the effective notch stress method, the ex-
act weld geometry has to be modelled. The analysis results confirm a better agreement
Fig. 11:The effective notch stress concentration factor obtained from several modelling techniques
a) Modelled weld end geometry b) Meshed geometry c) Maximum principal stress plot
Fig. 10: Modelled weld end for a cover-plate detail fatigue analysis according to the ENS method [16]

10 Nordic Steel Construction Conference 2012
with the test results when the weld termination is modelled as shown in Fig.6a.
5. Providing that an appropriate rounding radius is applied, acceptable results can be ex-
pected from the method proposed by Kaffenberger et al. [16] for weld end assessments.
A radius of 1mm seems to yield the best results for the details studied in this paper.
References
[1] Radaj D, Design and analysis of fatigue resistant welded structures, Woodhead, 1990.
[2] Fricke W, Recommended hot-spot analysis procedure for structural details of ships and
FPSOs based on round-robin FE analyses, International Journal of Offshore and Polar
Engineering, 12(1), 40-47, 2002.
[3] Radaj D, Sonsino C M, and Fricke W, Fatigue assessment of welded joints by local ap-
proaches, Woodhead Publishing, second edition, 2006.
[4] Lotsberg I, Fatigue design of plated structures using finite element analysis, Ships Off-
shore Structures, 1(1), 45-54, 2006.
[5] Marquis G, and Samuelsson J, Modelling and fatigue life assessment of complex struc-
tures, Materialwissenschaft und Werkstofftechnik, 36(11), 678-684, November 2005.
[6] Eurocode3, Design of steel structures: Fatigue, European Standard, May 2005.
[7] Hobbacher A, Recommendations for fatigue design of welded joints and components,
IIW document no. Technical report, IIW-1823-07, International Institute of Welding,
December 2008.
[8] Niemi E, Fricke W, Maddox S J, Fatigue Analysis of Welded Components: Designer’s
Guide to the Structural Hot-spot Stress Approach, Woodhead Publishing, 2006.
[9] Dong P, A structural stress definition and numerical implementation for fatigue analy-
sis of welded joints, International Journal of Fatigue, 23(10), 865-876, 2001.
[10] Xiao Z G, and Yamada K, A method of determining geometric stress for fatigue strength
evaluation of steel welded joints, Int. journal of fatigue, 26(12), 1277-1293, 2004.
[11] Doerk O, Fricke W, and Weissenborn C, Comparison of different calculation methods
for structural stresses at welded joints, Int. journal of fatigue, 25(5), 359-369, 2003.
[12] Poutiainen I, Tanskanen P, and Marquis G, Finite element methods for structural hot
spot stress determination-a comparison of procedures, Int. journal of fatigue, 26(11),
1147-1157, 2004.
[13] Fricke W, and Kahl A, Comparison of different structural stress approaches for fatigue
assessment of welded ship structures, Marine structures, 18(7-8), 473-488, 2005.
[14] Feltz O, and Fricke W, Fatigue tests and numerical analyses of partial-load and full-
load carrying fillet welds at cover plates and lap joints, Welding in the World, 54(7-8),
225–233, 2010.
[15] Fricke W, Guideline for the fatigue assessment by notch stress analysis for welded
structures, International Institute of Welding, 2008.
[16] Kaffenberger M, Malikoutsakis M, Savaidis G, Vormwald M, Fatigue resistance of
weld ends, Computational Materials Science, 52(1), 287-292, 2002.
[17] Fisher J W, Frank K H, Hirt M A, and McNamee B M, Effect of weldments on the fa-
tigue strength of steel beams, Fritz engineering laboratory report No. 334.2, 1969.
[18] Hall L R, Stallmeyer J E, The fatigue strength of flexural members, Fatigue committee,
welding research council, 1959.
[19] Munse W H, and Stallmeyer J E, Fatigue in welded beams and girders, Highway Re-
search Board Bulletin, 1962.