Embed Size (px)
Citation preview

FARMERS INVESTMENT b0~',,~,,',:, ~'0 BOX 7 SAHUARITA, ARIZONA 85629-0007 U.s A I NO\l16 '08
fARMING AND fARM MANAGEMENT PRpcESSING AND M ~~F.TING: ;-:-;:;.-;:--
SAN SIMON FAfuVf, AZ TIlE PECA.~ STOREBLUR THREE GROVES, GEORGIA GREEN VALLEY PEe
f-RlCHAJtDS.\WALDENPRESIDENT & CEO
November 11,2009
Ms. Sandy EtaPhoenix Area OfficeBureau of ReclamationU. S. Dept oflnterior6150 W. Thunderbird RoadGlendale, AZ 85306-400 I
Dear Ms. Eto:
EST. 1937
Enclosed is a copy of the Design Criteria Report prepared by Kimley-Horn on behalf of FarmersTnvestmcnt Co., which was presented to the Central Arizona Project in June as a draft review andfinalized last month.
Please include this report in the administrative record regarding the Community WaterCo.lRosernont Copper Co. proposed CAP pipeline. liyau decide to decline to include this in theadministrative record, please advise so as to your decision in writing.
Thank you for attention in this matter.
President
RSW:pgEnclosure
cc: Bruce EllisCarlos Ronstadt
Tel: (520) 879~7400 Fax: (520) 791-2853

I
•FARMER'S INVESTMENT CO.CAP WATER LINEDESIGN CONCEPT REPORT
FICO PROPERlYPima County, Arizona
Prepared for:
•FARMER'S INVESTMENT CO.1625 E. Sahuarita RoadSahuarita, Arizona 85629
Prepared by:
Kimley~Hornand Associates, Inc.7878 NOt1h 16th Street, Suite 300Phoenix, Arizona 85020
191521002October 2009Copyrighl 0 2009. Kimlcy-Hom Ind Associates, Inc.
Kimley·Hornand Associates, Inc.
,

FARMER'S INVESTMENT CO.CAP WATER LINEDESIGN CONCEPT REPORT
FICO PROPERTYPima County, Arizona
Prepared for:
•FARMER'S INVESTMENT CO.1625 E. Sahuarita RoadSahuarita, Arizona 85629
Prepared by:
Kimley~Hornand Associates, Inc.7878 North 16th Street, Suite 300Phoenix, Arizona 85020
191~21002
October 2009Copyright 0 2009. KimJey-Hom and Associates, me.
,

,
FARMER'S INVESTMENT CO.CAP WATER LINEDESIGN CONCEPT REPORT
FICO PROPERTYPima County, Arizona
Prepared for:
•FARMER'S INVESTMENT CO.1625 E. Sahuarita RoadSahuarita, Arizona 85629
Prepared by:
Kimley-Horn and Associates, Inc.7878 North 16th Street. Suite 300Phoenix, Arizona 85020
191521002OCtobcr 2009Copyright 0 2009, Kirnley-Hom ~nd Associates. hl<;,K:\PHX_Civil\191521OOQ\ANC-eAP PIPELlNE\CAP DCRI2009FICO_Waterline DCR.OOcx

•Table of Contents ,
1.0 Introduction .......•....••.•.............................•.............................•....................................................... 1
1.1 General Description & Location 1
1.2 Topographic Conditions , 2
1.3 Stakeholder Issues 2
1.4 Complelnentary Studies 2
2.0 Water System 5
2.1 Upstream Hydraulics 5
2.2 Design Criteria 5
2.3 Pipe Material 6
2.4 Right-of~Way 6
3.0 Water Line Analysis 6
3.1 Hydraulic Break Considerations 7
3.2 Booster System 7
4.0 Conclusion 7
5.0 Refercnces 8
FiguresFigure 1- Vicinity Map 3
Figure 2 - USGS Topographic Map , : 4
Figure 3 - Proposed Water Line 9
TablesTable 1 - Booster System Results 7
AppendicesAppcndix A: CAP Capacity Letter
Appendix B: Booster System Output
Appendix C: Terminus and Pima Mine Road Water Model Report
CAl' Wattr /.i1Ie ~sign ReportOctober 2009

<81.0 INTRODUCTION
This Design Concept Report (Repon) has been prepared for The Fanner's Investment Co. (FICO) toevaluate the benefits of providing a supplemental water source to Fleo's property through the extensionof an existing 36" Central Arizona Project/City ofTucson water line (CAP Line) located along the southside of Pima Mine Road. Currently the 38' line ends just east of the turnout for the Pima Mine RoadRecharge Facility. It is anticipated that the proposed 36" Hne will COMect to existing line and extendsouth to exit lhe Pima Mine Road right-of-way (R.O.W.), crossing under a section of Union Pacificrailroad tracks and the railroad's R..O.W. The CAP line will then discharge into a small segment of openchannel section, located within an casement on FICO Property. Pumps will be installed within the openchannel section to deliver water for use by FICO. A line e:ttending from the pumps will then be locatedwithin a proposod waterline easement, continuing cast along FICO property, south of the southernR.O.W. line of Pima Mine Road and the railroad R.O.W., then south on FICO Property, parallel to thewcstern R.O.W. line ofOId Nogales Highway alignment terminating at the south side of East SahuaritaRoad. For the purposes of this Report, the Study Area consists of the FICO property north of EastSahuarita Road. As part of the evaluation, both a gravity system and booster pump system were assessed.The gravity system was eliminated because it will not provide the consistency that FICO requires forirrigation of their fann.
1.1 General Desc::riptioD & Location
The FICO property consists of approximately 10.5 square miles (6,721 acres) and is located in southernPima County, Ari7..Otla. (Figure 1 and Figure 2). The FICO property is comprised of two non-contiguoussegmcn~ both located east side of Interstate 19 (1-19). The Santa Cruz River is located within portions ofboth segments.
The FICO property is comprised of two fanns - the "Continental Ranch" segment and the "SahuaritaPamls" segment. The Continental Ranch segment is approximately 1,644 acres in llrea and the SahuaritaPanns segment is ftpproximately5,077 acres in area, totaling 6,721 acres. The SallUarita Farms segment,located north of East Sahuarita Road, comprises the Study Area. The majority of tile FICO property is anactive pecan orcbard (Green Valley Pecan Company), irrigated by lUeans of groundwater wells thatdischarge to a series of ditches, distributing water throughout the farm by flood irrigation. FICO hascontracted with Kimley-Hom and Associates, tnc. to evaluate the feasibility of supplementing the StudyArea water supply with Central Arizona Project (CAP) water.
The undeveloped areas within the study area consist of typical SOlloran Desert $ClUb. The dominantvegetation observed includes: mesquite trees, four wing saltbush, and various grass, forbs, and weedyspecies.
The Study Area lies within portions of the incorporated Town of Sahuarita and unincorporated portions orPima County. In addition to agricultural~based business, the project vicinity generally consists ofresidential and light commercial land use to the north, undeveloped land to the east and south, andresidential land use to the west. The FICO property and Study area is depicted in Figures 1 and 2; theStudy Are-.a is generally located within:
1 Township 16 South, Range 14 East, Section 31;
2 Township 17 South, Range 14 East, Sections 5-8;
3 Township 17 South, Range 13 East, Section 12.
CAP W".Itr liltr /Jnip hponOcfober 1009

•1.2 Topographic Conditions
The ground surface elevation within the study area rises from approximately 2,662 feet above mean sealevel (MSt) within the northern portion to 2.706 feet above MSL within the southern portion of the StudyArea. The general drainage pattern for the area is primarily south to north.
1.3 Stakebolder Issues
The land surrounding the Study Area has experienced increased development activity in recent years;development activity is expected to continue in the future. There are significant improvementsanticipated in the ncar future for Pima Mine Road, Old Nogales Highway, and East Sahuarita Road.These improvements will include road widening and utility installations within the R.O.W. There isconcern that the location ofa line within these roadway corridors will be limited or will require relocationliS development occurs. lbereforc, it is recommended that the proposed water line be located in aneasement outside oflhe existing and proposed R.O.W. on FlCO Property.
The farm currently holds a Ground Water Saving Facility (GSF) Permit. A GSF program is regarded "in·lieu" of a recharge project. The pumped groundwater saved by the use of CAP water for irrigation wooldaccrue as long-teon storage credits. These credits could lhen be used to offset groundwater pumping inefforts to meet groundwater pumping restrictions.
The existing 36" CAP Iiue discussed above is restricted to a 24" line where it crosses Pima Mine RoadBridge, constricting the amount of water that could otherwise be Available to the project. Additional watercould be available if the 24" line crossing the bridge were "up-sized" to 36". This Report does notevaluate the conditions if the 24" line were to be up--sizod. It is our understanding the existing bridgecannot accommodate lines larger than the existing 24" line without compromising the structural integrityof the bridge supporting members. However, according to the Town of Sahuarita, the existing bridge isscheduled for replacement sometime in the near future. The new bridge should be designed toaccommodate a 36" line, removing the current constriction. These improvements are not part of anyproposed improvements associated with this project, thus, only the 24" line was evaluated.
1.4 Complementary Studies
The following existing studies were reviewed and referenced as necessary in the pn.'Paratiol1 of thisReport:
• Terminlls (l1Id Pima Mine Road Waler Model by CClltral Arizona Projcct dated Fcbruary 5, 2009
• Proposed Relocation ofPump Station and Storage Facilities/or Sahuarita Acres by FarmersWater Company; April 10, 2009
2 CAP Water Ullt lks(g" ReporlOcro!Jul009

Sahuarita Farms
STUDY AREA
,)r
- - •3
Continental Ranch
,....o 0.5 1FICO PropertiesPima County, Arizona
Figure 1. Vicinity Map
SI""""'eo
•
.•',,,-_,. KimOy·Hom....... _ ., and Associates, Inc.
2

STUDY AREA
A N 0 ~\
T
".
,.... -
l
r
1
I
Sourdl: U.S.Geological Survey
, ,'",- .~,
t" - ...~
'""~ -, ,
, '
f
StudyArea
,-..-="-'-11'---"",
,I
•
AR 0N
,
,
Figure 2. USGS Topographic Map
",i", USGS Maps Names:·w sells and Fort Huacucha
s 100,000 .scale......_,.. K'lmOy-Hom...... _ ., and Associates, Inc.
FICO PropertiesPima County, Arizona
o 0.5 1w_
2
Miles
3 •
3

2.0 WATER SYSTEM f•
'Ibis Report evaluates the extension of an existing 36" CAP/City of Tucson water line located along thesouth side of Pima Mine Road. Currently, the 36" CAP/City of Tucson water line located along tbe southside of Pima Mine Road. The 36" line ends just east of the turnout for the Pima Mine Road RechargeFacility. The existing line ends with the eastern branch of the tee capped. It is anticipated that theproposed 36" line will connect to the eastern branch of the existing tee and exit the Pima Mine Roadright~of-way (RO.W.), crossing under the railroad's R.O.W. and discharging into a open channel sectionslocated within an easement 011 FICO property. Pumps will be installed in the open chmmel section anddischarge into a line thai continues to the east. The line will then be located within a proJX>sed waterlineeasement. continuing cast along FICO property. south of the southern R.O.W. line of Pima Mine Roadand the railroad R.O.W" then south on FICO Property. parallel 10 the westem R.O.W.line ofOld NogalesHighway alignment terminating at the south side of East Sahuarita Road. (See Figure 4). TIle 18" linesshown in East Sahuarita Road are for use of irrigation oflhe Green Valley Pecan Company only are not apari of this project. They are shown for modeling purposes only and will not be constructed with theproposed 36'·!ille.
2.1 Upstreatn lIydrauUcs
Development and analysis of the water system for the Study Area was based on the Terminus and PimaMine Road Water Model by Central Arizona Project (CAP Study). This study can be found in AppendixC. The CAP study outlines the available water for transmission through the 36" line 10 the Study Areabased on Ihe four different scenarios listed below:
t. Contract deliveries + max. flow to the PMP south;
2. Contract deliveries + max flow wI 36" pipe on bridge;
3. Existing deliveries + max flow to the PMP south;
4. Existing deliveries + max flow wi 36" pipe on bridge.
In each scenario. the flow available to the Study Area was' determined by maximizing flow to the PimaMine Road Pipe (PMP South) while maintaining 10 pounds per square inch (psi) residual pressure at thePim.:, Mine Road Tumoutlocatedjust upstream of the PMR South node. This residual pressure, accordingto the CAP study, would ensure adequate flow to lhe Pima Mine Road Recharge Project.
Oflhe four scenarios described above. the contract deliveries plus maximum flow to the PMP South noderesulted in the lowest available flow; 14.1 cubic feet per second (cfs); 6,328 gallons per minute (gpm); or27.97 acre feet per day (ac-fi/day). Based on the June 24. 2009 letter from CAP to Mr. Richard Walden(See Appendix A) 8,000 acre fet.1 per II months is currently available. This equates to 12.2 cfs, 5,485gpm, or 24.24 ac~flJday. If the 24" segment of the line is upgraded.to 36" an additional 20,000 acre feetper 11 months will be available. This will bring the total flow available from this project to 28,000 acrefeet per II months. Is equates to 42.78 cfs, 19.199 gpm, or 84.85 ac-filday. The 12.2 efs currentlyavailable will be utilized for this report.
2.2 Design Criteria
The water line for the Study Area was evaluated and designed consistent with the criteria outlined in theCap Study and Arizona Department of Environmental Quality (ADEQ) Bulletin 10. Additional DesignCriteria;
• Max.imum demand = 42.8 efs (19.199 gpm; 84.85 ae-ft/day)• Current demand = 12.2 efs (5,485 gpm; 24.24 ae-ftIday)
, CAP Woter lJne [)ejign ReportOctober lOOl1

11"""1-" Kmey-Hom~_u and_,Ioc. •• Darcy-Weisbach friction factors
• Concrete pipe = 0.005 ft I
• Steel = 0.001 ft• PVC" 0.0004 ft
• For the purposes of this evaluation,. the pipe material was calculated using concretevalues
• Minimum pressure at PMR tumout = IOpsi• Diameter of line on Pima Road bridge = 24"
2.3 Pipe Material
In order to achieve delivery of 12.2 cfs to the intersection of Old Nogales Highway and East SahuaritaRoad, the booster pump will need to increase pressure within the pipeline to approximately 67 psi;therefore, many materials for the pipeline could be chosen to adequately handle the anticipated pressureand other safety-related factors.
A variety of materials can be used in this application including:• Ductile lrOll (DIP)• Weldcd S'eel (AWWAC200)• Concrete Cylinder Pipe (AWWA 301 or 303)• PVC C-90S• HDPE (DR-II)
2.4 Right-of-Way
It appears that the connection point of the existing 36" line is located within Town of Sahuarita R.O.W.for PimA Mine Road. The railroad tracks appear 10 exist on property owned by ASARCO. During thedesign process, authorization to enter and work within the RO.W. will be obtained. Easements forconstruction on ASARCO property will also be obtained prior 10 construction. It.O.W. coordination mustoccur between Pima County, the Town of Sahuarita, the Union Pacific Railroad, and ASARCO Inc. Oncethe line has entered FICO property, the alignment will remain within a dedicated easement on the FICOproperty for the entire length, until it crosses the Town of Sahuarita R.O.W., on East Sahuarita Road.
3.0 WATER LINE ANALYSIS
In order to properly evaluate the proposed water line in concert with the existing CAP system, wereproduced the model created within the CAP Study and evaluated the 36" line as an extension to theCAP system. The network analysis of the water system, using WaterCAD version 7.0, was created todemonstrate that the design standards outlined in Section 2.2 will be met.
The 12.2 cfs demand was the maximum demand assumed available. The 12.2 cfs is not sufficient toremove the Study Area from reliance on well water for irrigation purposes, but can certainly act as asupplement. According to irrigation documents provided by FICO, there are two orchard areas north ofEast Sahuarita Road, west and east of Old Nogales within the Study Area. The 12.2 crs can provide all ofthe inigation needs west of the Highway and 62% (12.2 vs. 19.76 cfs) of the irrigation needs for east ofthe Ilighway.
•

•3.1 Hydraulic Break Considerations,
The CAP line will discharge into a channel to create a hydraulic break between the two systems. 1ltischannel will be sized to provide five minutes of storage for the full 42.8 efs that may be available withupgrades to the CAP line. The channel to provide this storage will be a trapezoidal channel with a lOPwidth of 15 feet and a bottom width of 10 feet. This proposed channel will be 105 feet in length and 10feet in depth. It is anticipated that a free discharge valve will be utilized at the discharge point. Thisvalve will be operated so that opens and closes with a five minute operational period.
3.2 Booster System
In order to provide the greatest flexibility to water delivery for the study area, a booster system wasevaluated. The pump system will be sized to provide the full 12.2 efs to all nodes along the proposedwaterline. The results of the pressure and flow evaluation can be found in Table I nnd Figure 4. Onlyselect nodes were evaluated since demand and flow wil! not change between nodes. The nodes evaluatedwere the most extreme cases of the system, as well as nodes where additional tumout pipes may belocated.
Table 1 - Booster System Results
Elevation .Max Max M-ax Approx.Point Flow Flow Flow Ava~rt~ead(It) r,r" (orlm\ • (.c-ftld.··\
5 2674 12.2 5,485 24.24 40.58
6 2690 12.2 5,485 24.24 23.13
8 2706 12.2 5,485 24.24 5.36
9 2704 12.2 5,485 24.24 7.35
The preliminary evaluation of the booster pump system revealed the following characteristics:• 5,485 gpm discharge capacity• 67 feet of total dynamic head
The same evaluation indicated that the pump system could include either vertical turbine or centrifugalpumps.
4.0 CONCLUSION
The evaluation an open channel section and booster system for the proposed 36" water line within theproposed alignment indicates that water from the existing CAP line within Pima Mine Road can bebrought to and utilized within the Study Area.
A number of pipe materials can be used to accommodate this project; however, DIP or PVC will beutilized to provide the greatest flexibility to future uses and connections and minimize costs.
7 CAP ""oler Line Des/gil IUtpOI'/OcIQbcl" 2009

111"'1-" Kmey-Homlll.J_r l and Associates, Inc.
5.0 REFERENCES •·-
I
Termil/lis lIlId Pima Mille Road Water Model by Central Arizona Project dated February 5, 2009
Proposed Reloetrtion ofPump Station {md SJorage Facilities for Stlhtmrila Acres by Fanners WaterCompany; April IO. 2009
Engineering Bulletin 10 - Gllidelillesfor the Qms/rllction ojWater Systems. Arizona Department orEnvironmental Quality. May 1978
2006. WaterCAD VI.O Haestad Methods. Inc.
8 CAP Wmt'r liM Du¢'r ~ponOdobu 1()(J9

•.."""~- ._-- ..........-......._-
l""1_n KirnIoy-Hom-......J_U and ASsodates, Inc.0 .... "'"------------
-_..-_-aocc.o ...
- ...~ -PROPOSED WATER LINE
FIGURE #3FICO PROPERTY
EXISTING 24~ UNE
ON """'"
LJ 'f.~
BOOSTER CAPACITY _ 5,485 GPI,l 0 67' TOH
"" "",
APPFlQX.POINT ELEVATION FLOW now flOW H,'"
(CfS) (GPU)(Ac-n
(rT).,, 2674 12.2 5.485 24.24, 2690 12.2 5.4M 24.24
• 2706 12.2 5.4~ 24.24
• 2704 12.2 5.485 24.24
, • 1
Wi£llo.- - - - - - - PROPOS£O J6- nco lIIIE
------- EXISTING 36- Qry OF1\JCSOO/CAP LNE
(X1STIHG 24" ClTY OFlUC'SONfCAF' l"[
~__ 1,00- EXJS~C CONTOUR
r BOOSTER STATlON
_ OPEN OiANNEl SECTION
--
BOOSTER SYSTEM
.-_..

.-
Appendix A: CAP Capacity Letter,
CAP WOW" !.llle Duigll ReprtflOctober 2009

,•
P.O. Box 43020 • Phoenix, AZ 85080·302023636 N. 7th flr", • Pho.ni~ AZ 85024
623-869-2333 • WWliv.cap-az.com
Inne 24. 2009
Mr. Virgil DavisCommunity Water Company ofGreen ValleyISO I S La Canada DriveQreco Valley, AX 85622-1600
Mr.lticbard WaldenFarmers Investment Company1625 E. Sabuarila Rd.Sah""rita, Ariza"" 85629
Gentlemen:
At our meeting ofMay t9,2009, we discussed the potential for both ofyouforganizations to use some oftbc available capacity ill the e,o.sting 36- Pima fyfine RoadPipeline. I agreed that CAP staffwould review the system capacity as it OOW exists withthe 24- pipelin.e section acrosslbe Santa CruzRiver and what additional capacity wouldbe available ifdlat section was rqllaced with -a 36- pipe.
The system, as it exists, can safely flow 58 cfs which will deliver"about 38,000 acre feet(af) over an 1J...month period, allowing one month for planned canal system maintenance.CAP plans for an optimum scheduleof30,OOO aD'yea.r with an average flow of4S cf:; attile Pima Mine Road Recharge site. Historicatry operations are more variable, achievingabout 25,000 afwith flows peaking a little above 50 d's. In.summary, there is about 8,000aUyear availabl~ C"4pacity with an available flow rate that could vary from 5 to 50 cfs butwould nonnally be 1010 12 cfs that would delivec 700-800 ~D1Dnth.
The Pima :Mine Road Recharge Project and the delivery pipeline is $bared 50150 betweenCAWeD and Tucson Water with certain rights to use unused capacity ofeither party.There is abo Ii cOmmitment of 1Ocfs delivery into tho Santa Cruz River Oil behalfof theTahono O'odham Nation ifl"cquested. lfthe pipeline sect:ionacross the river is upsit.edand the commitment to deliver to the SanJa Cruz River is not needed, an additional 30 cfsofdelivery capacity is available. That would delivec an" additional 20,000 -.fQ.ver theassumed 1I-month operating period.
""'.

Mr. Virgil DavisMr. Richard WaldenJUlie 24, 2009Page 2
,
IfdeUvery needs and schedules were carefully coordlDated, the·existing configurationcould reasonably be expected to provide 8,000 to 10,000 afper year at flow- rates of 5 to15 ds. IfbOlh GVWC and FICO desired to connoot at the.end ofthc CJPsting pipeline thatcapacity CQuid be shared ill some collaborative and proportional manner.
IfGVWC were to pay the cost ofupsizing the 24" section to 36". an additional 20.000 afper year could.be deliv«ed t<>GVWC.
It must be understood that any agreement to us;c the existing pipeline requires the consentofCA-WeD and Tucson Water. Specific scheduling.and operating parameters 'WOuld beestablished and deliveries to the Pima Mine Road Recltatge Project would. if needed.take precedent oVer deliveries to GVWe or FICA.
Sincerely.
b!!frFDeputy' General Manager
Copy: Mr. Dennis RuleThcsen WaterPO Box2nl0Tucson AZ85726·721.0

,.
Mr, Virgil DavisMr. Richard Waldenlund4,2009Page 3 I
,{.."
.. ,.,'::.
Blind copy: PiitriCk DentTom BarbourBrian HenningTim KacerekRandy RandolphSuzanne Ticknor
c.":",,,, •., .. ,. '_: _" .~. " . ".'L'· """ '" .. ~._" ,."., c., ,,,,~ " ',..... " ....,,,~')

Appendix B: Booster System Output
CAl' Waler Un!! Desig" lIefJO'"rOclob!!r 1009

Scenario: FICO with Hydraulic BreakSteady State Analysis
Junction Report
l .... EI&V'tion ""'" Base Flow 0."""" Calalla~~d Pressurep~(It) ,"', calcu\aled ydraulk: Gra eel H2O ....,,"', '0' (ft)
J-N2 2.000.00 ""'. 0.00 0.00 2,716.94 56.83 56."J-N3 2.664.00 ""'" 0.00 0.00 2.7HI.24 52.13 52.24J-N4 2.672.00 Z~ 000 0.00 2.715.13 43.04 43.13J-N5 2.674.00 Zoo. 0.00 0.00 2.714.e7 40.58 40.57
J·N6 2.690.00 Zone 0.00 000 2,713.17 23.13 23.17J.N7 2,706.00 Zone 12.20 12.20 2,711.37 5.36 5.37
J·N8 2,706.00 Zone 0.00 0.00 2,711.37 5.36 5.37
J·N9 2.704.00 Zone 000 0.00 2.711.37 7.35 7.37
TItle: FICO· Nogalos Hwy Irrigationk:\... \rnodcf\cap nogales watllr lIt~t 6-3-09,wOO10123109 09:09:15 .oJ8enlley SysleMs, Inc. Haestad Methods Solullon Cenler Watertown, CT 067115 USA
Project Englr'leer: D, P'lr'iqulrlWaterCAD \/7.0 [07,oo,049,ooj
+1-203-155-1666 Page 1 of 1

Scenario: FICO with Hydraulic BreakSteady State Analysis
Pipe Report
f,
,-
label Length Diameter Start Malerial Stop Discharge pstream Structu ownstream Structur Pressure Headloss Veiocity(ftl (in) Noo, Node {cl'Il) Hydraulic Grade Hydraul:c Grade Pipe Grndient (fUll)
(ft) (ft) Headloss {ftl1000rt}(ft)
P·N2 2,009.00 36.0 J-N2 Concrat J.N3 12.20 2,716.94 2,716,24 0.71 0,35 1.73
P-N3 3,133.00 36.0 J-N3 Concrete J-N' 12.20 2,716.24 2,715,13 1.11 0,35 1.73P-N4 1,317,00 36.0 J-N' Concrete J-N5 12.20 2,715.13 2,71467 0.45 0,35 1.73
P-N5 4,231.00 36.0 J-N5 Cencrel J-N6 12.20 2,714.67 2,713.17 1.49 0,35 1 1.73
P-N' 5,116.00 36,0 J·N6 Cancrol J·N7 12.20 2,713.17 2,711.37 1.80 0,35 1.73
P-N7 1,878.00 18.0 J-N? Concret J-N8 0.00 2,711.37 2,711.37 0.00 0.00 0.00P-N8 2,453.00 18,0 J-N7 Ceneret J-N9 0.00 2,711.37 2,711,37 0.00 0.00 0,00
Pump1 964.00 36,0 R·1 Coneret PUMP-1 12.20 2.651.50 2,651.16 0.34 0.35 1.73Pump2 2.500.00 360 PUMP.1 Concrlll J-N2 12,20 2,717.83 2,716.94 0.88 0.35 1.73
Till",: FICO - Nogales Hwy Irrigalloflk:\, .. lmo::lel\cap nQgOlles water ext 6·3-09.wcd101:23109 09:07:33 [email protected] Syslems, IflC. Haeslad Method", Solution Center WatertowF'l, CT 06795 USA
PrOject EF'lglneer: D. PatriqulnWaterCAD v7.0 [07.oo.049.00J
+1-203-755-1666 Page 1 of 1

Scenario: FICO with Hydraulic BreakSteady State Analysis
Pump Report
label E~vaticrl eone'" Intake Oischarwe Dischallle Pomp Cal<:ula:ed(ftl Status Pump Pump (els) Head WaterG"". G_ (ft) Powe<
(ftl (1'l:) (Hp)
PUMP-1 2.651.50 0, U151.16 2.717.63 12.20 66.67 92.16
Tille: FICO - Nogales Hwy IrrigotiOr'!k:I",\mgdel\cap nogales water ext 6-.3-09.wcd10f23109 09:08:47 ANBenlll!=y Systems, Inc. Haestad Methods SolutiOfl Center Watertown. CT 067S5 USA
Project Engln~r: D. Potriql,Jil1WaterCAD v7_0 (07.oo,049,00J
i 1-203-75(;"666 . Pago , of 1

Scenario: FICO with Hydraulic BreakSteady State Analysis
Reservoir Report
lab~ Elevatioll Z~ ,,,... Calculaled(flJ (m) +.ralll!C Grade
,ft)
R·' 2.651.50 Zoo. -12.20 2.651.50
Title: FICO - Nogales Hwy Irrigationk;\... ln1odel\cap nogales Wl'ltllr A)(I 6-3-QO.wcd10123109 09:09:13 !OJBenUey Systems, Inc Haeslad Methods So\ution.Cllnler
Project Engineer: D. P.uiquinWaterCAD v7.0 (07.00.04g.00)
Watertown. CT O$71'l!> USA. +1-203-755.1666 PlIge 1 or 1

SCenario: FICO with Hydraulic Break
R-1 PUMP-1 J-N2
~+-,Pump1 pump~
~ T'a. J-N3
J~ "it
a. I J-N4
1 ta. I J-N5
,
I
*Ja. I
J-N6
CDza.
•J-N!P-N8 I J-R'N7 J-N8
• ----e'-FICO·__~
.\._---~.-._ c.;'O:CItHl ~-.-..-. .... "-- _<;T_......."-':l\If.,_
",-~p._
~"''''fD7_''''_-''''I
"-''''

Appendix C: Terminus and Pima Mine Road Water Model Report,
CAP Waler U'I<! Desigll R~po'-IOctober }OQ9

..,
CENTRAL ARIZONA PROJECT
TERMINUS AND PIMA MINE ROADWATER MODEL
STEADY STATE ANALYSISFebruary 5, 2009

CENTRAL ARIZONA PROJECT - TERMINUS AND P1MA MINE ROADWATER MODEL
STEADY STATE ANALYSISFebruary 5, 2009
Gentral Arizona Project Engineering Resources Division has conducted ahydraulic analysis of the Reach 6 Pipeline and the Pima Mine Road Pipeline(PMRP) to determine if additional capacity exists for water deliveries in thePMRP. The analysis was performed using BenUey WatsrCAD VB XM software.
Features Included in this study include the Black Mountain Operating Reservoir(BMOR). Terminus Turnout, and the Pima Mine Road Recharge Project. Theturnouts induded in this analysis are San Xavier, ASARCO, santa Cruz River,Pima Mine Road Pilot, and Pima Mine Road Expansion turnouts. An additionalturnout was added at the end of the PMRP to e....aluate the available capacity foradditional water deliveries. This turnout is located at the east end of the PMRP(labeled "PMP South" in the model). All of the components of the model listedabove can be seen more clearly on Attachment 1 - "PMR Pipe Layout."
The PMRP Is a 36" mortar-lined mortar coated steel pipe. There is 465' sectionthat Is 24" in diameter where the pipeline crosses the Santa Cruz River. Thissection is attached to the bridge and can be seen above grade from the road(labeled "P-Bridge" in the model). This section is a critical component of thepipeline with respect to capacity. Consequently, the modeling scenarios in thisreport evaluate the Impact of upsizing this section of the pipeline to a 36"diameter pipe.
Assumptions:The following assumptions were made.
• All pipe elevations listed are invert elevations and In datum NAVGP 1929Vertical.
• The outlet invert elevation of the BMOR is 2,849.0 ft. The model assumes6 ft of water in the BMQR to give a hydraulic grade of 2,855.0 ft.
• All concrete pipes assume a roughness height of 0.005 ft.• All steel pipes assume a roughness height of 0.001 ft.• A hydraulic grade of 2674.65 was maintained at the PMR turnout for
deliveries to the PMR recharge project. This hydraulic grade linecorresponds to a minimum pressure of 10 psi needed for deliveries at therecharge project.

Scenarios:l,
.-
The modeled scenarios consist of two cases. The first represent the estimatedmaximum daily deliveries that are currently being made from the BMOR. Thesecond includes deliveries in the PMRP as described in the Inter-GovernmentalAgreement ([GA) between CAWeD and the City of Tucson. The IGA quantifiesthe amount of capacity in the pipeline at 68 cubic feet per second (cis), 58 cis forthe recharge project and 10 cfs for recharge deliveries into the Santa Cruz River.The difference in the two cases is the 10 cfs allocated for deliveries to the river.The remaining system deliveries are identical. The cases are described in thereport as the "Contract Deliveries Scenario" (those defined by the [GA) and the"Existing Deliveries Scenario" (those that do not include deliveries to the SantaCruz River).
Each of the cases is modeled under two conditions, the first being the existingPMRP, and the second with the 24N section upsized to 36 inches.
The resulting four scenarios are described below.
• Contract Deliveries1A. Contract Deliveries + Max PM? South Scenario18. Contract Deliveries + Max PM? South w/36" Pipe on Bridge Scenario
• Existing Deliveries2A. Existing Deliveries + Max PMP South Scenario2B. Existing Deliveries + Max PMP South wi 36" Pipe on Bridge Scenario
Each of the scenarios detennines the amount of water that can be delivered atthe PMP south scenario by maintaining 10 psi at the PMR recharge projectturnout (labeled "PMR Turnout" in the model).

1A. Contract Deliveries + Max PMP South Scenario I
Scenario 1A, the Contract Deliveries + Max PMP South Scenario, was run to findthe maximum amount of water that could be delivered at the PMP South junction.The PMP South junction is located east of the recharge project. For this scenario,the demand flow at the junction was maximized while maintaining 10 psi fordelivery of water to the Pima Mine Road Recharge Project at the junction labeledPMR Turnout. See the tables below for the results of Scenario 1A.
Junction Report 1A
label Elevation Demand Hydraulic Pressure Pressure(ft) (cfs) Grade (ttl (psi) Head (ft)
ASARCO TURNOUT 2,785.00 17.0 2,810.88 11.2 25.88PMP SOUTH 2,651.50 14.1 2,674.55 10.0 23.05PMR EXPANSION 1 1-},62X,:'!.0•. 6.0 2,667.23 17.4 40.23PMR EXPANSION 2 2,622.00 6.0 2,666.77 19.4 44.77PMR EXPANSION 3 2,621.50 6.0 2,666.66 19.5 45.16PMR PILOT 1 2,639.70 10.0 2,655.33 6.8 15.63--..-- ----.PMR PILOT 2 2,639.60 10.0 2,654.13 6.3 14.53PMR PILOT 3 2,637.70 10.0 2,651.09 5.8 13.39PMR PILOT 4 2,637.60 10.0 2,650.95 5.8 13.35PMR TURNOUT 2,651.50 0.0 2,674.58 10.0 23.08SAN XAVIER
2,777.00 28.0 2,821.85 19.4 44.85TURNOUT -SANTACRUZ
2,657.40 10.0 2,720.04 27.1 62.64TURNOUTTERMINUS TURNOUT 2,785.03 0.0 2,817.86 14.2 32.83
Reservoir Reoort 1A
LabelElevation (Outlet Invert) Hydraulic Grade Outflow
1ft) (ft) (cfs)
Black Mountain ReselVoir 2,849.00 2,855.00 127.1
It was determined that the PMP South junction would deliver an additional 14 cfsthrough the PMRP. The water velocity in the 24~ section at the bridge is 23 feetper second (fps) for this scenario. Pipe velocities in this range are outside thenormal design guidelines for a water distribution system of this pressure class.Delivering raw water at 23 fps is a scour concern for the mortar-coated pipe. Inaddition, transients are a significant concern with velocities of this magnitude.

.-
18. Contract Deliveries + Max PMP South Scenario W36" Pipe on Bridge
Scenario 1B, the Contract Deliveries + Max PM? South wi 36" Bridge Scenario,was run to see how much water could be delivered at the PMP South junction ifthe 24~ pipe on the Lower Santa Cruz Bridge was upgraded to a 36" pipe. Afterup-sizing the 24" pipe to a 36" pipe in the model, the demand flow at the PMPSouth junction was maximized again while still maintaining 10 psi for delivery atPMR Turnout. All of the other turnouts in the model assumed the same demandas Scenario 1A. Junction Report 18 and Reservo;r Report 18 summarize theresults of this scenario.
18RJ unction elJort
label Elevation Demand Hydraulic Pressure Pressure(ft) (cis) Grade (ft) (psi) Head (ft)
ASARCO TURNOUT 2,785.00 17.0 2,806.06 9.1 21.06
PMPSOUTH 2,651,50 21.9 2,674.65 10.0 23.15PMR EXPANSION 1 2,627.00 6.0 2,667.36 17.5 40.36PMR EXPANSION 2 2,622.00 6.0 2,666.90 19.4 44.90PMR EXPANSION 3 2,621.50 6.0 2,666.79 19.6 45.29PMR PILOT 1 2,639.70 10.0 2,655.46 6.8 15.76PMR PILOT 2 .... ~~39~Q. 10.0 2,654.25 6.3 14.65PMR PILOT 3 2,637.70 10.0 2,651.22 5.8 13.52PMR PILOT 4 2,637.60 10.0 2,651.08 5.8 13.48PMRTURNOUT 2,651.50 0.0 2,674.71 10.0 23.21SAN XAVIER
2,777.00 28.0 2,817.69 17.6 40.69TURNOUTSANTACRUZ
2,657,40 10.0 2,695.93 16.7 38.53TURNOUTTERMINUS TURNOUT 2,785.03 0.0 2,813.04 12.1 28.01
Reservoir ReDort 1B
Label Elevation (Outlet Invert) Hydraulic Grade Outflow(ft) (ft) (cis)
Black Mountain Reservoir 2,849.00 2,855,00 134.9
It was determined that the PMP South Junction would deliver an additional 22 cfsthrough the PMRP. The water velocity PMRP pipeline'is 11.3 fps which is moreconsistent with the design range for this type of raw water delivery system.

/lA. Existing Deliveries + Max PMP South Scenario
Scenario 2A, the Existing Deliveries + Max PMP South Scenario, was run to findthe maximum amount of water that could be delivered at the PMP South junctionunder the conditions of the eXisting demands. A minimum of 10 psi wasmaintained for the Pima Mine Road Recharge Project while maximizing theavallable water at PMP South. All of the other tumouts in the model assumed thesame demand as Scenario 2. See the tables below for the results of Scenario2A.
2ARJ unction eDort
Label Elevation Demand Hydraulic Pressure Pressure1ft) (ers) Grade 1ft) (psi) Head (ft)-
ASARCO TURNOUT 2,785.00 17.0 2,812.71 12.0 27.71PMPSOUTH 2,651.50 21.0 2.674.47 9.9 22.97PMR EXPANSION 1 2,627.00 6.0 2,667.17 17.4 40.17PMR EXPANSION 2 2,622.00 8.0 2.666.71 19.3 44.71PMR EXPANSION 3 2,621.50 6.0 2,666.60 19.5 45.10PMR PILOT 1 2,639.70 10.0 2,655.27 6.7 15.57PMR PILOT 2 2,639.60 10.0 2,654.07 6.3 14.47PMR PILOT 3 2,637.70 10.0 2,651.03 5.8 13.33PMR PILOT 4 2,637.60 10.0 2,650.89 5.7 13.29PMRTURNOUT 2,651.50 0.0 2,674:!2 10.0 23.02SAN XAVIER
2,777.00 28.0 2,823.43 20.1 46.43TURNOUTSANTACRUZ
2,657.40 0.0 2,729.15 31.0 71.75TURNOUT _._--TERMINUS TURNOUT 2,785.03 0.0 2,819.69 15.0 34.66
Reservoir Reoort 2A
LabelElevation (Outlet Invert) HydraUlic Grade Outflow
(ft) 1ft) (cfsl
Black Mountain Reservoir 2,849.00 2,855.00 124
It was determined that the PM? South Junction would deliver an additional 21 cfsthrough the PMRP. The water velocity in the 24" section at the bridge is 25.2feet per second (fps) for this scenario. Pipe velocities in this range are outsidethe normal design guidelines for a water distribution system of this pressureclass. Delivering raw water at 23 fps is a scour concern for the mortar-coatedpipe. In addition, transients are a significant concern with velocities of thismagnitude.
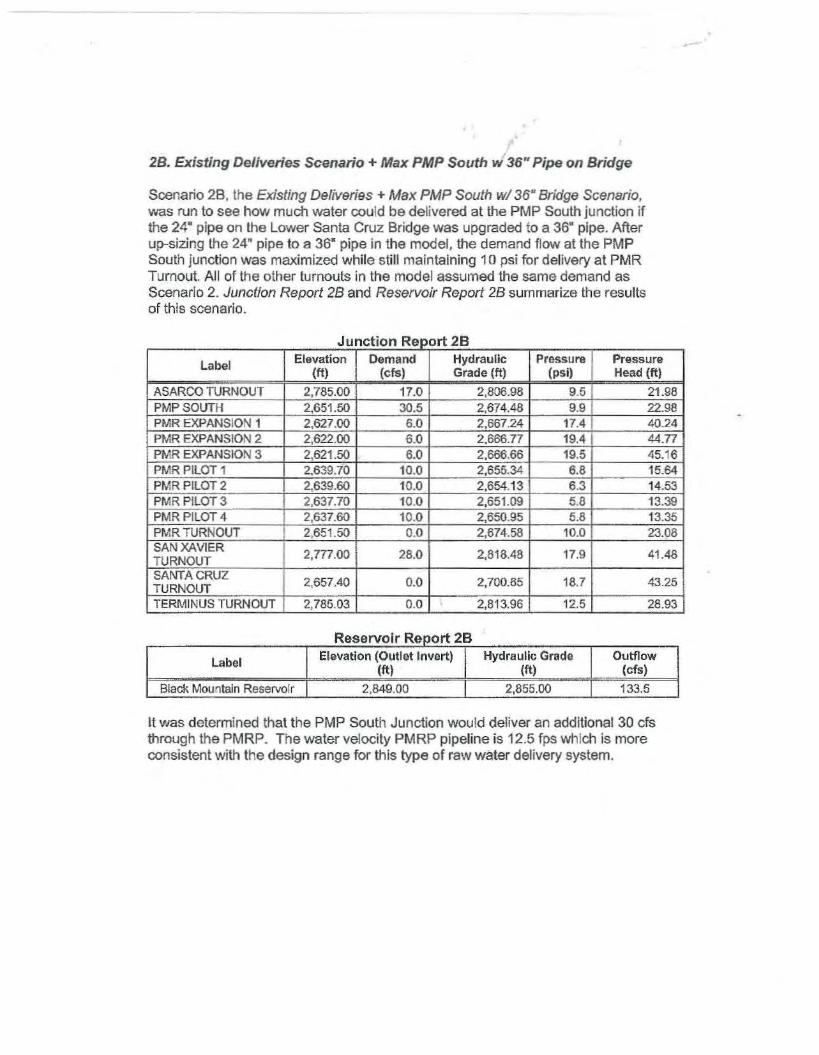
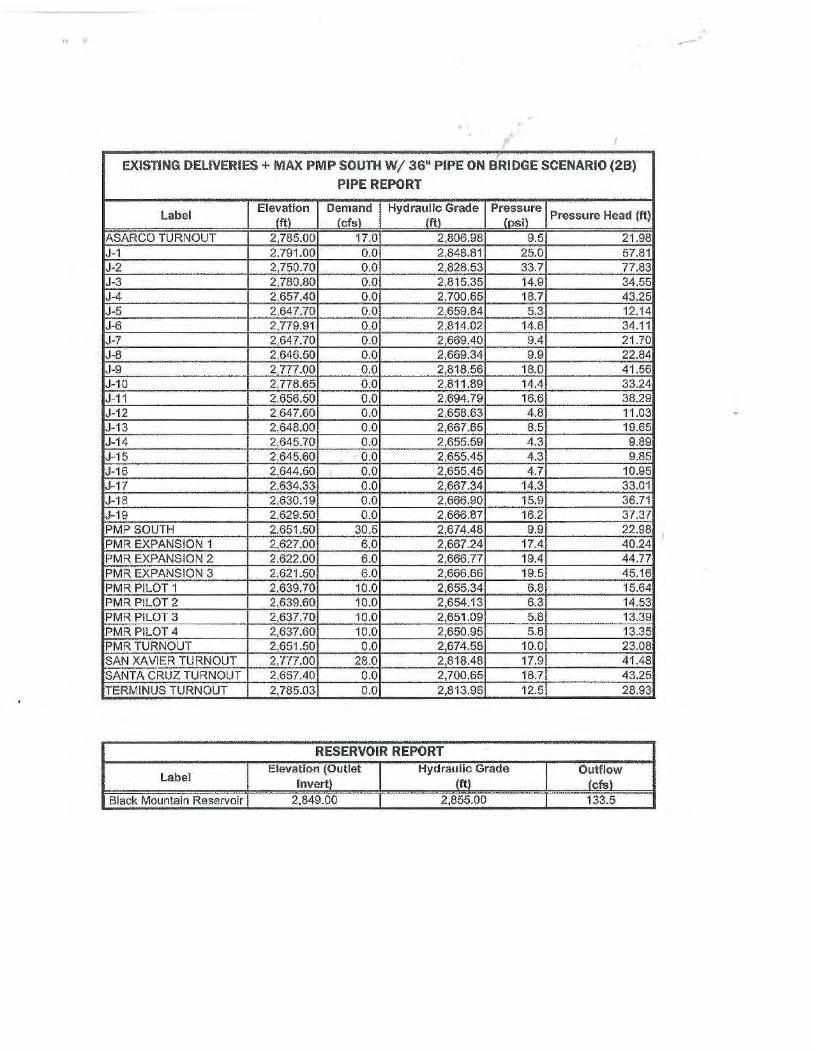
2B. Existing Deliveries Scenario + Max PMP South vi36" Pipe on Bridge
Scenario 28, the ExisJing Deliveries + Max PMP South wI 36- Bridge Scenario.was run to see how much water could be delivered at the PM? South junction ifthe 24- pipe on the Lower Santa Cruz Bridge was upgraded to a 36- pipe. Afterup-sizing the 24" pipe to a 36" pipe in the model, the demand flow at the PMPSouth junction was maximized while stilt maintaining 10 psi for delivery at PMRTurnout. All of the other turnouts in the model assumed the same demand asScenario 2. Junction Report 28 and Reservoir Report 28 summarize the resultsof this scenario.
rt 28r RJ unc Ion .'0Label Elevation Demand Hydraulic Pressure Pressure
(ft) (ets) Grade (ft) (psi) Head (ftl
ASARCO TURNOUT 2,785.00 17.0 2,806.98 9.5 21.98PMPSOUTH 2,651.50 30.5 2,674.48 9.9 22.98PMR EXPANSION 1 2,627.00 5.0 2,667.24 17.4 40.24PMR EXPANSION 2 2,622.00 5.0 2,666.77 19.4 44.nPMR EXPANSION 3 2,621.50 6.0 2,666.66 19.5 45.16PMR PILOT 1 2,639.70 10.0 2,655.34 5.8 15.64PMR PILOT 2 2,639.60 10.0 2,654.13 6.3 14.53PMRP1LOT3 2,637.70 10.0 2,651.09 5.8 13.39PMRPILOT4 2,637.60 10.0 2,650.95 5.8 13.35PMRTURNOUT 2,651.50 0.0 2,674.58 10.0 23.08SAN XAVIER 2,n7.00 28.0 2,818.48 17.9 41.48TURNOUTSANTACRUZ 2,657.40 0.0 2,700.65 18.7 43.25TURNOUTTERMINUS TURNOUT 2,785.03 0.0 2,813.96 12.5 28.93
28IRReservo r eoort
LabelElevation (Outlet Invert) Hydraulic Grade Outflow
(ft) (ft) (cfs)
Black Mountain Reservoir 2,849.00 2,855.00 133.5
It was determined that the PMP South Junction would deliver an additional 30 cfsthrough the PMRP. The water velocity PMRP pipeline is 12.5 fps which is moreconsistent with the design range for this type of raw water delivery system.

Conclusions:
Given the high velocities that result from additional flows in the PRMP. it is notrecommended that additional capacity be allocated for this pipeline in its currentconfiguration. The high flow velocities increase the risk of system damage due tomaterial scour of the mortar coating and potential transients.
To accommodate additional flows in this system, it is recommended that the 24section of pipe be replaced with 36" diameler pipe. This change will allowapproximately 22 cfs of additional capacity to be allocated from the system.
Any new connections that are made to the system should include a transientevaluation to evaluate impacts of the connection. Once identified, impacts willneed to be addressed in the design effort for new connections to this system.

ATTACHMENTS
,

ATIACHMENT1PMR PIPE LAYOUT
,
.-

•oJ
~l 0z;,1 ' .1 ~z., ~
III "'1 "''i '"-1I, • 8~~ - ,"'I' •• ~
I"'.,'~ I
luu ,-I '
.,
I•II

ATTACHMENT 2WATERCAD DATA
,

, . ,
CONTRACT DELIVERIES + MAX PMP SOUTH SCENARIO (iA)
JUNCTION REPORT
LabelElevation
Demand (cis)Hydraulic Grade Pressure Pressure Head
Iftl {ftl In,[1 {ft'
ASARCO TURNOUT 2,785.00 17.0 2,810.88 11.2 25.88J-1 2,791.00 0.0 2,849.38 25.3 58.38J-2 2,750.70 0.0 2,830.98 34.7 80.28J-3 2,'180.80 0.0 2,819.09 16.6 38.29J-4 2,657.40 0.0 2,720.13 27.1 62.73J-5 2,647.70 0.0 2,659.84 5.3 12.14J-6 2,779.91 0.0 2,817.92 16.4 38.01J-7 2,647.70 0.0 2,669.39 9.4 21.69J-8 2,646.50 0.0 "2,669.33 9.9 22.83J-9 2,777.00 0.0 2.821.93 19.4 44.93J-10 2,778.65 0.0 2,816.08 16.2 37.43J·11 2,656.50 0.0 2,688.05 13.7 31.55J-12 2,647.60 0.0 2,658.63 4.8 11.03J·13 2,648.00 0.0 2667.65 8.5 19.65J-14 2,645.70 0.0 2,655.59 4.3 9.89J-15 2,645.60 0.0 2,655.45 4.3 9.85J-16 2644.50 0.0 2,655.45 47 10.95J·17 2,634.33 0.0 2,667.34 14.3 33.01J·18 2630.19 0.0 2,666.90 15.9 36.71J-19 2,629.50 0.0 2,666.87 16.2 37.37PMPSOUTH 2,651.50 14.1 2,674.65 10.0 23.05PMR EXPANSION 1 2,627.00 6.0 2667.23 17.4 40.23PMR EXPANSION 2 2,622.00 6.0 2,666.77 19.4 44.77PMR EXPANSION 3 2,621.50 6.0 2,666.66 19.5 45.16PMR PILOT 1 2639.70 10.0 2,655.33 6.8 15.63PMR PILOT 2 2,639.60 10.0 \ 2654.13 6.3 14.53PMR PILOT 3 2,637.70 10.0 2,651.09 5.6 13.39PMR PILOT 4 2,637.60 10.0 2,650.95 5.8 13.35PMR TURNOUT 2,651.50 0.0 2674.58 10.0 23.08SAN XAVIER TURNOUT 2,777.00 28.0 2,821.85 19.4 44.85$ANTA CRUZ TURNOUT 2,657.40 10.0 2,720.04 27.1 62.64TERMINUS TURNOUT 2785.03 0.0 2,817.86 14.2 32.83
RESERVOIR REPORT
LabelElevation (Outlet Invert) Hydraulic Grade Outflow
{ft, {ft' fcfsl
Black Mountain Reservoir 2,849.00 2,855.00 127.1

CONTRACTUAL DEUVERIES + MAX PMP SOUTH SCENARIO (tAlPIPE REPORT
L;lbel III Active? Length (ft) StntNodo Stop NodeDiameter
Material Darcy·Weisbach e F1~ Velocity Headloss Gradient HeadlO$sin\ 'ft ,~ ,,", 'ftIft' ft'
" TRUE 5,655.66 Black Mountain Reservoir J-' 72 Concrete 0.005 m 4.50 0.00099 5.62
'-7 TRUE 18536.00 J-' H n Concrete 0.005 m 4.50 0.00099 18.41,-, TRUE 400.00 J-6 PMR PILOT 1 16 Steel 0.001 " 7.16 0.01126 4.50,-. TRUE SOO.OO J4 SANTA CRUZ TURNOUT " Steel 0.001 10 1.41 O.W017 0.09e-5 TRUE 430.00 J~ J-6 54 Concrele 0.005 99 6.23 0.00272 1.17P-6 TRUE 400.00 TERMINUS TURNOUT ASARCO TURNOUT " Sleel 0.001 " 8.62 0.01746 6.98P-7 TRUE 770.14 J-6 TERMiNUS TURNOlIT 54 Concrete 0.005 " 1.07 0.00008 0.00P-S TRUE 950.00 PMRTURNOUT J.7 36 Steel 0.001 58 8.21 0.00546 5.18'-S TRUE 111.HI J·7 J-S 36 Sleel 0.001 1B 2.55 0.00055 0.06P·l0 TRUE 9109.02 J·7 J-9 72 Concrele 0.005 127 4.50 0.00099 9.05P·l1 TRUE 4.689.98 J·9 J.' 72 Concrete 0.005 99 3.50 0.00061 2.84P·12 TRUE 45.00 J·9 SAN XAVIER TURNOUT 36 Concrete 0.005 " 396 0.00184 0.08P-13 TRUE 67.95 PMRTURNOUT PMPSOUTH 36 Steel 0.001 " '.99 0.00034 0.02PH TRUE 169.45 J-6 MO 36 Steel 0.001 82 11.61 0.01086 ,,,P·15 TRUE 8,832.00 J·10 J4 36 Sleel 0.001 " 11.61 0.01086 95.95P-16 TRUE 1,605.00 J·11 PMR TURNOUT '6 S,.. 0.001 n 10.20 0.00840 13.48P-17 TRUE 100.00 J-5 J·12 " S"'. 0.001 30 9.55 0.01208 1.21P·18 TRUE 355.3.4- J·13 J-6 " Steel 0.001 " 12.73 0.02138 7.81P-19 TRUE 81.68 J 7 '" 24 Steel 0.001 " 12.73 0.02138 1.75P-20 TRUE 400.00 J·12 PMR PILOT 2 16 Steel 0.001 16 7.16 0.01126 4.50P-21 TRUE 3.650.00 J-8 ~" 36 Steel 0.001 16 2.55 0.00055 '.00P·22 TRUE 560.62 J·12 J-14 " Steel 0.001 70 6.37 0.00542 3.04P-23 TRUE 400.00 J·14 PMR PILOT 3 16 Steel 0.001 16 7.16 0.01126 4.50P-24 TRUE 100.00 J-14 J-15 " Steel 0.001 16 3.18 0.00139 0.14P·2S TRUE 400.00 J-15 PMRPILOT4 16 S"", 0.001 16 7.16 0.01126 4.50P·26 TRUE 256.90 J·15 J-16 24 Steel 0.001 0 000 OO0סס.0 0.00P77 TRUE 200.00 J-17 PMR EXPANSION 1 " 8,,"' 0.001 6 1.91 0.00051 ~16
P-28 TRUE 1,750.00 J·17 J·18 36 Steel 0.001 " 1.70 0.00025 0.44 'p.", TRUE 250.00 J·18 PMR EXPANSION 2 " Sleel 0.001 6 1.91 0.00051 0.13P30 TRUE 500.00 J·18 M9 36 Steel 0.001 6 0.85 OO7סס.0 0.03P~11 TRUE 400.00 J·'9 PMR EXPANSION 3 24 Steel 0.001 6 1.91 0.00051 0.21P BRIDGE TRUE 455.00 H J·11 24 Steel 0.001 77 22.95 0.06898 32.08

CONTRACT DEUVERIES + MAX PMP SOUTH WI 36" PIPE ON BRIDGE SCENARIO (1.8)
JUNCTION REPORT
Label E~...ation (tt)Demand Hydraulic Grade Pressure Pressure Head
lefs' 1ft' losll 1ft,ASARCO TURNOUT 2,785.00 17.0 2,806.06 9.1 21.06J-1 2,791.00 0.0 2,848,68 25.0 57.68J-2 2,750.70 0.0 2827.95 33.4 77.25J-3 2,760.80 0.0 2814.47 14.6 33.67J-4 2,657.40 0.0 2,696.01 16.7 38.61J-5 2,647.70 0.0 2659.97 5.3 12.27J-6 2779.91 0.0 2,813.11 14.4 33.20J-7 2,647.70 0.0 2669.52 9.4 21.82J-8 2,646.50 0.0 2,669.46 9.9 22.96J-9 2,777.00 0.0 2,817.77 17.6 40.77J·,O 2,77a.65 0.0 2,810.90 14.0 32.25J-l1 2656.50 0.0 2,691.23 15.0 34.73J-12 2.647.60 0.0 2,658.76 4.8 11.16J·13 2,648.00 0.0 2,667.78 8.6 19.78J-14 2,645.70 0.0 2,655.72 4.3 10.02J·15 2,645.60 0.0 2,655.58 4.3 9.98J·16 2,644.50 0.0 2.655.58 4.8 11.08J·17 2634.33 0.0 2,667.46 14.3 33.13J·18 2630.19 0.0 2,667.03 15.9 36.84J-19 2629.50 0.0 2.667.00 18.2 37.50PMPSOUTH 2651.50 2'.9 2674.65 10.0 23.15PMR EXPANSION 1 2,627.00 6.0 2667.36 17.5 40.36PMR EXPANSION 2 2,622.00 6.0 2.666.90 19.4 44.90PMR EXPANSION 3 2621.50 6.0 2,666.79 19.6 45.29PMRPILOT 1 2639.70 10.0 2,655.46 6.8 15.76PMR PILOT 2 2.639.60 10.0 2654.25 8.3 14.65PMR PILOT 3 2.637.70 10.0 2,651.22 5.8 13.52PMR PILOT 4 2637.60 10.0 2,651.08 5.8 13.48PMR TURNOUT 2651.50 0.0 2674.71 10.0 23.21SAN XAVIER TURNOUT 2,777.00 28.0 2817.69 17.6 40.69SANTA CRUZ TURNOUT 2,657.40 10.0 2,695.93 16.7 38.53TERMINUS TURNOUT 2785.03 0.0 2,813.04 12.1 28.01
RESERVOIR REPORT
LabelElevation (Outlet Invert) Hydraulic Grade Outflow
Iftl 1ft' lefslBlack. ~.ountain Reservoir 2,849.00 2,855.00 134.9

CONTRACT DEUVERIES + MAX PMP SOUTH WI 36" PIPE ON BRIDGE SCENARIO (1B)PIPE REPORT
l~bel Is Active? lerlgth {tt) Start Nodll Stop Node Oill,~ter Materia! Darcy.":~~sbach e ~!~~ lJel~~ty Headlo~~,:radierlt Headlossm I, ftI, IV «
po' TRUE 5.655,88 Black Mountain Reservoir J-' 72 Concrete 0.005 '" 4.77 0.00112 6.32P-2 TRUE 18.536.00 J-' J~ 72 Concrete 0.005 '" 4.77 0.00112 20,72P-3 TRUE .wO.DO J-5 PMRPILOT 1 " Steel 0.001 " 7.16 0.01126 4.50P~ TRUE SDO.OO J~ SANTA CRUZ 1 URNOUT " Steel 0.001 " 1.41 0.00018 0.09P-' TRUE 430.00 J-3 J~ 54 COncrete 0.005 '07 6.72 0.00316 1.36P-6 TRUE 400.00 TERMINUS TURNOUT ASARCO TURNOlJT " Steel 0.001 H 9.62 0.01746 6.98po' TRUE 77D.14 J-6 TERMINUS TURNOUT 54 Concrete 0,005 H 1.07 0.00008 0.06P-8 TRUE 950.00 PMRTURNOUT J-' " Sleel 0,001 58 8.21 0.00S46 5.18
" TRUE 111.18 H J·e " Steel 0.001 " 2.55 0,00055 0.05P-1Q TRUE 9,109.02 J-2 J-9 72 Coocrele (1.005 '" 4,77 0.00112 10.18P" TRUE 4.689.98 J-' J-3 72 Concrete 0,005 '" 3.78 0.00070 3.30P-12 TRUE 45.00 J-9 SAN XAVIER TURNOUT " Concrete 0.005 28 3.96 0,00183 0.08P-13 TRUE 67.95 PMRTURNOUT PMP SOlm-l " Steel 0,001 22 3.10 0.00080 0.05P_14 TRUE t69.45 J~ J-l0 " Sle~ 0.001 90 12,72 0.0130t 2.20P-15 TRUE 8,832.00 ~" H " Sleel 11.001 90 12,72 0.01311t 114.89
'" TRUE 1,605.0a '" PMRTURNOUT " Sleel 0.001 SO 11,30 0.01029 16.52P-17 TRUE 100.00 J-5 J-12 24 Sleel 0.001 30 9,55 0.01208 1.21?-18 TRUE 365.34 J-1:$ J-5 24 Sleel 0.001 4Q 12.73 0.02138 7.81?-19 TRUE 81.68 J-7 J-13 24 Steel 0.001 4Q 12.73 0.02138 1.75P'20 TRUE 400.00 J·12 PMR PILOT 21 " St'" 0.001 " 7.16 0.01126 4.50P-21 TRUE 3.650.00 J-S J-17 36 Slel!l 0.001 " 2.55 0.00055 2.00P-22 TRUE 560.62 ~" J-14 24 St'" 0.001 20 6,37 0.00542 3.04P-23 TRUE 400.00 J-14 PMR PILOT 3 " Sleel 0.001 " 7,18 0.01126 4.50P-24 TRUE 1GO.00 ~" J-15 24 Steel 0.001 " 3,18 0.00139 0.14P-25 TRUE 400.00 J-15 PMR PILOT 4 " Sleel 0.001 " 7.16 0.01126 4.50P-26 TRUE 256.90 J-15 J-16 24 Steel 0.001 0 0.00 0.00000 0.00P-27 TRUE 2aO.00 J-17 PMR EXPANSION 1 24 Steel 0.001 , 1.91 0.00051 0.10P-28 TRUE 1.750.00 J-17 J-18 36 St"" 0.001 " 1.70 0.00025 0.44P-29 TRUE 250.00 J-18 PMR EXPANSION 2 24 Steel 0.001 6 1.91 0.00051 0.13 -P-30 TRUE 500.00 J-18 J-19 36 Sleel 0.001 , 0.85 0.00007 0.03P~1 TRUE 4GO.00 J-19 PMR EXPANSION 3 24 Steel 0.0111 , 1.91 0.00051 0.21P-BRIDGE TRUE 465.00 J~ J-11 36 Sleel 0.001 80 11.30 0.01029 4.19

f
EXISTING DELIVERIES + MAX PMP SOUTH SCENARIO (2A)JUNCTION REPORT
Label Ele;;tion Demand Hydraulic Grade Pressure Pressure Headfefs' 'ft· Ins;\ Iftl
ASARCO TURNOUT 2,785.00 17.0 2,812.71 12.0 27.71J-1 2,791.00 00 2,849.65 25.4 58-65J-2 2,750.70 0.0 2,832.13 35.2 81.43J-3 2,780.80 0.0 2,820.85 17.3 40.05J-4 2,657.40 00 2.729.15 31.0 71.75J-5 2,647.70 0.0 2659.78 5.2 12.08J-B 2,779.91 0.0 2,819.75 17.2 39.84J-7 2,647.70 0.0 2,669.33 9.4 21.63J-8 2,646.50 0.0 2,669.27 9.9 22.77J-9 2,777.00 0.0 2,823.52 20.1 46.52J-10 2,778.65 0.0 2,818.05 17.0 39.40Jw 11 2,656.50 0.0 2,690.67 14.8 34.17J-12 2,647.60 0.0 2,658.57 4.7 10.97J-13 2,648.00 0.0 2,667.59 8.5 19.59J-14 2,645.70 0.0 2,655.53 4.3 9.83J·15 2,645.60 0.0 2,655.39 4.2 9.79J·16 2,644.50 0.0 2,655.39 4.7 10.89J-17 2,634.33 0.0 2,667.28 14.3 32.95J-18 2,630.19 0.0 2,666.84 15.9 36.65J-19 2,629.50 0.0 2,666.81 16.1 37.31PMPSOUTH 2,651.50 21.0 2,574.47 9.9 22.97PMR EXPANSION 1 2627.00 6.0 2,667.17 17.4 40.17PMR EXPANSION 2 2,622.00 6.0 2,666.71 19.3 44.71PMR EXPANSION 3 2,621.50 6.0 2666.60 19.5 45.10PMR PILOT 1 2,639.70 10.0 2655.27 6.7 15.57PMR PILOT 2 2,639.60 10.0 2,654.07 6.3 14.47PMR PILOT 3 2,637.70 10.0 2,651.03 5.8 13.33PMR PILOT 4 2,637.60 10.0 2,650.89 5.7 13.29PMRTURNOUT 2,651.50 0.0 2,674.52 10.0 23.02SAN XAVIER TURNOUT 2,777.00 28.0 2,823.43 20.1 46.43SANTA CRUZ TURNOUT 2,657.40 0.0 2,729.15 31.0 71.75TERMINUS TURNOUT 2,785.03 0.0 2,819.59 15.0 34.66
RESERVOIR REPORT
labelElevation~~utlet HYdra~~~Grade Outflow
Invert 'clslBlack Mountain Reservoir 2,849.00 2,855.00 124

EXISTING DELIVERIES + MAX PMP SOUTH SCENARIO (2A)PIPE REPORT
....b.1 • Adi",? Le"lltk (RJ Start Node stop Node ~~ter Material o.rey.~~bach0 F~w Velocity H"d~,::ttldieot H~:",. I "b "",p., TRUE 5655.88 Bleck MOlA"ltaio ReSi'!rvolr .J.> 72 Concre1e 0.005 ,2< 4.39 0.00095 5.35p~ TRUE 18,536.00 J-l J-' 72 COnctele 0.005 ,2< .." 0.00095 17.52p~ TRUE 400.00 J-5 PMR PILOT 1 15 ...., 0.001 10 7.16 0.0112& '.00p~ TRUE 500.00 J-< SANTA CRUZ TURNOUT " Stu. 0.001 0 0.00 0.00000 0.00p., TRUE 430.00 J-3 J-5 54 Coocrete 0.005 " '.il< 0.00255 1.10p~ TRUE 400.00 TERMINUS TURNOUT ASARCO TURNOUT 18 Sl<el 0.001 " 9.112 0.01746 •."p., TRUE 770.14 J~ TERMINUS TURNOUT 64 Concrete 0.005 " 1.07 0.00008 0.00p~ TRUE fl50.00 PMRTURNOUT J.' " Steel 0.001 " 8.21 0.00546 6.18p., TRUE 111.18 J·7 J.• " Sleel 0.001 18 2.55 0.Oa055 0.00p·1a TRUE 9 109.02 J.' J~ 12 Concrele 0.005 ". 4.39 0.00095 8.61P.11 TRUE 4589.98 J., J.J 72 Concrete 0.005 .. 3.40 0.01)057 '.56P.12 TRUE 45.0a J-9 SAN XAVIER TURNOUT 36 Concrete 0.005 28 J." 0.00183 0.08P·13 TRUE 67.95 PMR TURNOUT PMPSOUTH 36 Slecol 0.001 " 2.97 0.00074 0.05P.14 TRUE 169.45 J~ J·l0 35 5,..' 0.001 " 11.16 0.01007 1.71P·1S TRUE 8832.00 HO J-< 36 Slnl 0.001 " 11.18 0.01007 88.00P.16 T~UE 111tlS.OO J-11 PMR TURNOUT 36 Sl<el 0.001 " 11.18 0,01 007 16.15P·17 TRU 100.00 J.O J-" 2< ''''' 0.001 3<l '.55 0.01208 WP·18 TRUE 3&5.34 J-13 J-5 24 St.. 0.001 <0 12.73 0.021Ja 7.81P·10 TRUE 81.68 J-7 J-" 24 ''''' 0.001 <0 12.73 0.02138 1.15P·20 TRUE 400.00 J-12 Pt.RR PILOT 2 " S!eel 0.001 10 7.1fS 0.01126 '.00p·2l TRUE 3.650.00 J~ J-l1 36 5.... 0.001 16 2.51:i 0.00055 ~OO
P.22 TRUE 560.62 J-12 J-14 ,. Steel 0.001 20 5.37 0.00542 'il<P·23 TRUE 400.00 J-14 PMRPltOT3 16 51eel 0.001 " 1.16 0.01126 '.00P·24 TRUE 100.00 J-14 J-15 2< Stu, 0.001 10 3.1& 0.00139
~~p~, TRUE 400.00 J-15 PtvlR PILOT 4 16 Sleel 0.001 10 7.16 0.01126 ••1'-26 TRUE '-'6.90 J-15 J-15 ,. ..... 0.001 0 0.00 0.00000 O.P·21 TRUE 200.00 J-17 PMR EXPANSION 1 ,. Sleel 0.001 • 1.91 0.00051 O. 0P~8 TRUE 1.750.00 J-17 J-16 36 51"" 0.001 12 1.70 0.0002!i 0."'4P·29 TRUE 250.00 J-16 PMR EXPANSION 2 ,. 51..1 0.001 0 181 0.0001:i1 0.13P-30 TRUE 600.00 J-16 J-19 36 5I~1 0.001 8 0.B5 OO7סס.0 0.03P·31 TRUE <00.00 J.H' PMR EXPANSION 3 2< Ste.1 0.001 • 1.91 0.0Q()S1 0.21?-BRIOOE. TRUE 465.00 H J-" ,. Steel 0.001 8 25.15 0.08216 38.48
" ,
EXISTING DELIVERIES + MAX PMP SOUTH WI 36" PIPE ON BRIDGE SCENARIO (2B)
PIPE REPORT
LabelElevation Demand Hydraulic Grade Pressure
Pressure Head (tt)1ft' lefs\ Iftl (nsil
ASARCO TURNOUT 2,785.00 17.0 2,806.98 9.5 21.98J-1 2,791.00 0.0 2,848.81 25.0 57.81J-2 2750.70 0.0 2,828.53 33.7 77.83J-3 2,780.80 0.0 2,815.35 14.9 34.55J-4 2,657.40 0.0 2,700.65 18.7 43.25J-5 2,647.70 0.0 2,659.84 5.3 12.14J-6 2,779.91 0.0 2,814.02 14.8 34.11J-7 2,647.70 0.0 2,669.40 9.4 21.70J-6 2,646.50 0.0 2,669.34 9.9 22.84J-9 2777.00 0.0 2,818.56 18.0 41.56J-10 2,778.65 0.0 2,811.89 14.4 33.24J-11 2,656.50 0.0 2,694.79 16.6 38.29J-12 2,647.60 0.0 2,658.63 4.6 11.03J-13 2,648.00 0.0 2,667.65 6.5 19.65J~14 2,645.70 0.0 2,655.59 4.3 9.89J~15 2,645.60 0.0 2655.45 4.3 9.85J~16 2,644.50 0.0 2,655.45 4.7 10.95J~17 2,634.33 0.0 2,667.34 14.3 33.01J-18 2,630.19 0.0 2,666.90 15.9 36.71J-19 2,629.50 0.0 2,666.87 16.2 37.37PMP SOUTH 2,651.50 30.5 2,674.48 9.9 22.98PMR EXPANSION 1 2,627.00 6.0 2,667.24 17.4 40.24PMR EXPANSION 2 2,622.00 6.0 2,666.77 19.4 44.77PMR EXPANSION 3 2,621.50 6.0 2,666.66 19.5 45.16PMR PILOT 1 2,639.70 10.0 2655.34 6.6 15.64PMR PILOT 2 2,639.60 10.0 2654.13 6.3 14.53PMR PILOT 3 2,637.70 10.0 2.651.09 5.6 13.39PMR PILOT 4 2,637.60 10.0 2650.95 5.6 13.35PMR TURNOUT 2,651.50 0.0 2,674.58 10.0 23.08SAN XAVIER TURNOUT 2,777.00 28.0 2,818.48 17.9 41.48SANTA CRUZ TURNOUT 2,657.40 0.0 2,700.65 18.7 43.25TERMINUS TURNOUT 2,785.03 0.0 2,813.96 12.5 28.93
RESERVOIR REPORT
LabelElevation (Outlet Hydraulic Grade Outflow
Invert\ Iftl Iclsl
Black Mountain Reservoir 2,849.00 2,855.00 133.5

EXISTING DELIVERIES + MAX PMP SOUTH WI 36" PIPE ON BRIDGE SCENARIO (28)
PIPE REPORT
Label Is Active? Lengttl (ft) Start Node Stop Node Dia~~ler Material Darc!I-Weisbach e F~. Velocity Headloss Gradient Headloss
'" '"' (:f,,1 ,w. Wft "'p~, rnUE 5655.88 Black Mountain Reservoir " " Concrele 0.005 133 4.72 0.00109 6.19P~2 TRUE 18,536,00 J~1 J-2 " Concrete 0.005 133 4.72 0.00109 20.28P~3 rnUE 400.00 H PMR PILOT 1 16 Steel 0.001 10 7.16 0.01126 'SOP~' TRUE 500.00 H SANTA CRUZ TURNOUT 36 Steel 0.001 0 0.00 0.00000 O~OO
P~5 TRUE 430,00 J~3 H 54 Concrete 0.005 105 6.53 0.00308 1.32
P~' TRUE 400.00 TERMINUS TURNOUT ASARCO TURNOUT 18 .,"'" 0.001 17 9.52 O.Cl1746 6.98P~7 TRUE 770.14 J-6 TERMINUS TURNOUT " Concrete 0.005 17 1.07 0.00008 O~W
P~8 TRUE 950.00 PMRTURNOUT J.7 38 Steel 0.001 68 8.21 0.00546 5.18P~' TRUE 111.18 J~7 J~ 38 S""', 0.001 18 2.55 0.00055 0.06P·l0 TRUE R 109.02 J~2 H n Com:r~l~ 0.005 133 4.72 0_00109 9.97P-l1 TRUE 0I.,689,sa J-9 J-3 n Concrete 0.005 105 3.73 0.00068 3.21P·1Z TRUE 45.00 J~9 SAN XAVIER TURNOUT 36 Concrete 0.005 28 3% 0.00184 O~""
P·13 TRUE 67,95 PMRTURNOUT Pl'ilP SOUTH 36 sre" 0.001 30 4.31 0.00153 0.10P·14 TRUE 159,45 J-6 J·10 36 S""', 0.001 sa 12.51 0.01260 2.13P·15 TRUE 8,832,00 J·10 H 36 Steel 0.001 sa 12.51 0.01259 111.24P·16 rnUE 1505,00 J·11 PMR TURNDllT 36 S"'" 0.001 sa 12.51 0.01259 20.21P·17 TRUE 100,00 J~5 J.12 " S"'" 0,001 30 9,55 0.Q1205 1.21P.18 TRUE 365.34 J-13 J-6 " S"'" 0.001 40 12.73 0.02138 7.81P-19 TRUE 61.68 J~7 J-13 " S"'" 0.001 40 12.73 0.02138 1.75P-20 TRUE 4CO.OO J-12 PMR PILOT 2 16 Sleel 0.001 10 7.16 0.01126 4.50P-2:1 TRUE 3,550.00 J-S J-17 36 S""', 0.001 " 2.55 0.00055 2.00
P-22 TRUE 560,52 J-12 - J-14 " S""', 0.001 ZO 6.37 0.00542 3~"
P-23 TRUE 400.00 J-14 PMR PILOT 3 18 Steel 0.001 10 7.16 0.01126 4,50
P-24 rnUE 100.00 J-14· J-15 24 Steel 0.001 10 3.18 0.00139 0.14
P-2S TRUE 400.00 J-15 PMR PILOT 4 16 Steel 0.001 10 7.16 0.01126 ,~
1'-26 TRUE 256.90 J-15 J-1O 24 Steel 0.001 , 0.00 0.00000 0.00P-27 TRUE 200.00 J-17 PMR EXPANSION 1 24 Stt:el 0.001 6 1.91 0.00051 0.'"P28 TRUE 1 750.00 J_17 J-18 35 Steel 0.001 12 1.70 0.00025 0.«P-2:9 TRUE 2:50.00 J-1e PMR EXPANSION 2 24 Steel 0.001 6 1.91 0.00051 0.13P-30 TRUE 500.00 J-18 J19 35 Steel 0.001 6 0.85 0.00007 0-03P-31 TRUE 400.00 J-19 PMR EXPANSION 3 24 Steel 0.001 6 1.91 0.00051 0.21P-8RIDGE TRUE 485.00 J4 ~11 36 Steel O.0!l1 88 12.51 0.01260 5.86
,