Embed Size (px)
Citation preview

Hessen 2018 / 2019Facts and Figures
© o
tt-p
ho
to.d
e: D
r. C
arst
en O
tt
www.invest-in-hessen.com

InfrastructureHessen in the Heart of Europe
Europe’s largest international airports
Hessen in Germany
Economic StructureSelected structural data compared by federal states
Hessen and its administrative districts
Financial Centre FrankfurtFinancial institutions
FinTech Incubators
Trade FairsInternational trade fair location Frankfurt
Hessen trade fair calendar 2019
Labour Market and WorkforceEmployees by economic sector
International employees
Training in Hessen
The ten largest industrial employers in Hessen
Hessen InternationalHessen in international comparison
The most important foreign trade goods
Major trading partners
Foreign direct investment in Hessen
Research and DevelopmentTechnology location Hessen
Universities and research institutes
Selected Hessian universities
2
CONTENTS
3
4
5
7
6
8
9
10
11
12
13
14
15
16
17
18
20
22
23
21

Source: Eurostat | DE-CIX | Calculations: HA Hessen Agentur3
INFRASTRUCTURE
HESSEN IN THE HEART OF EUROPE
All European business centres within a
2.5 hour flying radius
Europe’s connecting city
44 million consumers within a
radius of 200 km around Frankfurt
In the centre of European markets
510 million affluent consumers in Europe
The gateway to Europe
Moscow
Warsaw
Dublin
Madrid
FRANKFURT
Copenhagen
AmsterdamLondon
Paris
Rome
Stockholm
IstanbulLisbonLargest internet exchange point
worldwide in Frankfurt
Data traffic hub

4
INFRASTRUCTURE
EUROPE’S LARGEST INTERNATIONAL AIRPORTS
Transfer passengers
Passengers per year
Metric tons of cargo per year
Direct flights per week
China: 68
USA: 204
India: 37
2.2 million
61 %
64.5 million
5,045Summer Flight Schedule Frankfurt 2018:
99 Airlines
311 Destinations
98 Countries
Traffic volume by sector 2017
Cargo (total traffic
in 1,000 metric tons)
Passengers(total trafficin millions)
Aircraft movements
(in thousands)
Frankfurt (FRA) 2,229 64.5 475.6
Paris (CDG) 2,135 65.9 479.2
Amsterdam (AMS) 1,695 63.6 496.3
London (LHR) 1,640 75.7 475.0
Frankfurt Airport
Source: ACI Europe | Fraport AG | Research: HA Hessen Agentur
| GB: 283
| Japan: 36
| Korea: 19

Stockholm
Moscow
Warsaw
LondonBerlin
Brussels
Paris
Frankfurt
ViennaBudapest
IstanbulRome
Madrid
15 h
1.5 h
12 h 3 h
Source: Statista 2017 | Deutsche Bahn | Research: HA Hessen Agentur 20175
INFRASTRUCTURE
HESSEN IN GERMANY
Frankfurter Kreuz (A3/A5)
one of the busiest motorway
junctions in Europe with 368,000vehicles per day
340 Long-distance trains,
290 Regional trains, and
350,000 Travellers pass through
Frankfurt Central Station every day
Direct access to the European high-speed rail network
Latest evening „cut-off time” for the delivery of goods in Germany
Top ranking for broadband expansion
Northern Hessen Cluster: fast, comprehensive Internet coverage
Odenwaldkreis – nationwide leader in broadband coverage

Selected German Federal States 2017 Germany HessenBaden-
Wuerttemberg BavariaLower
SaxonyNorth Rhine-
Westphalia
GDP per person employed*in €
73,680 81,265 78,748 78,830 70,832 73,385
Gross value added in billion € 2,941 252 445 536 260 623
Tertiary sector in %
(measured by gross value added) 68.7 74.0 60.3 64.8 65.2 72.1
Population in millions 82.7 6.2 11.0 12.9 7.9 17.9
Area in km² 357,340 21,116 35,751 70,550 47,615 34,110
Inhabitants per km² 232 296 308 184 167 525
6
ECONOMIC STRUCTURE
SELECTED STRUCTURAL DATA COMPARED BY FEDERAL STATES
Source: German Federal Statistical Office | German State Statistical Offices | German Federal Employment Agency Statistics | German Regional Accounts Working Group | Calculations: HA Hessen Agentur | *2016
Source: Hessian State Statistical Office | German Federal Employment Agency Statistics | Calculations: HA Hessen Agentur | *20167
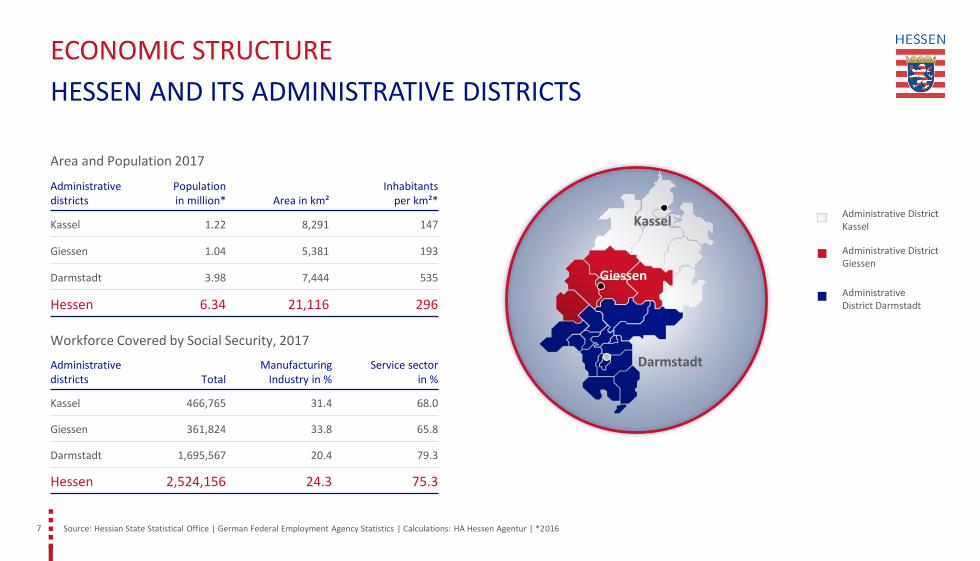
ECONOMIC STRUCTURE
HESSEN AND ITS ADMINISTRATIVE DISTRICTS
Area and Population 2017
Administrative districts
Population in million* Area in km²
Inhabitants per km²*
Kassel 1.22 8,291 147
Giessen 1.04 5,381 193
Darmstadt 3.98 7,444 535
Hessen 6.34 21,116 296
Workforce Covered by Social Security, 2017
Administrative districts Total
Manufacturing Industry in %
Service sector in %
Kassel 466,765 31.4 68.0
Giessen 361,824 33.8 65.8
Darmstadt 1,695,567 20.4 79.3
Hessen 2,524,156 24.3 75.3
Administrative District Kassel
Administrative District Giessen
Administrative District Darmstadt
Darmstadt
Giessen
Kassel
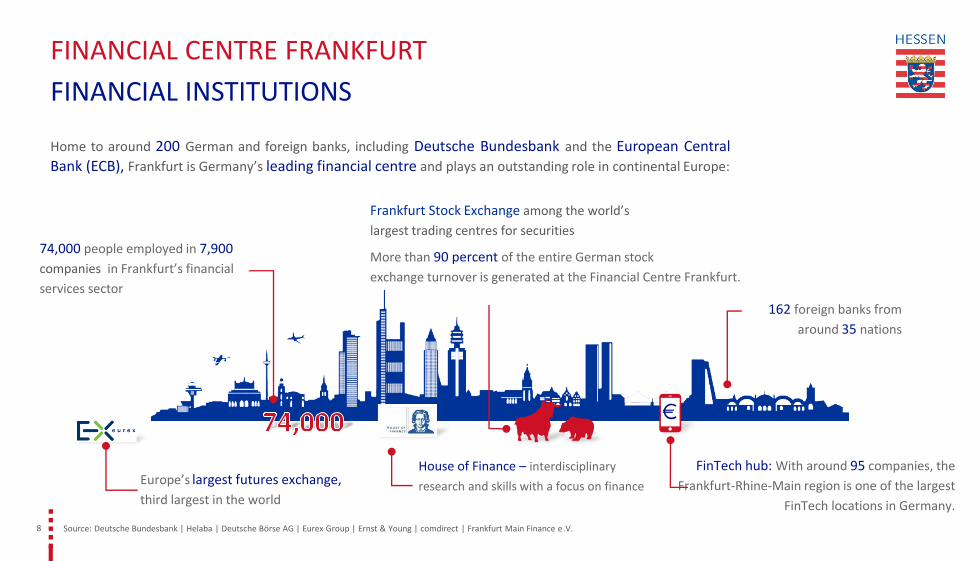
FINANCIAL CENTRE FRANKFURT
FINANCIAL INSTITUTIONS
8
Home to around 200 German and foreign banks, including Deutsche Bundesbank and the European CentralBank (ECB), Frankfurt is Germany’s leading financial centre and plays an outstanding role in continental Europe:
74,000 people employed in 7,900
companies in Frankfurt’s financial
services sector
Frankfurt Stock Exchange among the world’s
largest trading centres for securities
More than 90 percent of the entire German stock
exchange turnover is generated at the Financial Centre Frankfurt.
House of Finance – interdisciplinary
research and skills with a focus on finance
FinTech hub: With around 95 companies, the
Frankfurt-Rhine-Main region is one of the largest
FinTech locations in Germany.
Europe’s largest futures exchange,
third largest in the world
Source: Deutsche Bundesbank | Helaba | Deutsche Börse AG | Eurex Group | Ernst & Young | comdirect | Frankfurt Main Finance e.V.
162 foreign banks from
around 35 nations

FINANCIAL CENTRE FRANKFURT
FINTECH INCUBATORS
9
Focus FinTech:
50 percent of venture capital from 2012 to 2017
VABN - Aurelis Real Estate
Accelerator Frankfurt GmbH
Digital Factory Deutsche
Bank
FinTech Lab – FinTech Group AG
Main Incubator – Commerzbank
FinTech Hub
German Stock Exchange
FinTech businesses
Source: Deutsche Bundesbank | Helaba| Deutsche Börse AG | Ernst & Young | comdirect | Frankfurt Main Finance e.V.
TechQuartier -Frankfurt’s FinTech
Community
Frankfurt’s TechQuartier (TQ)
serves as a central contact point
for start-up
and FinTech companies.
Source: Messe Frankfurt, Annual Report 201710
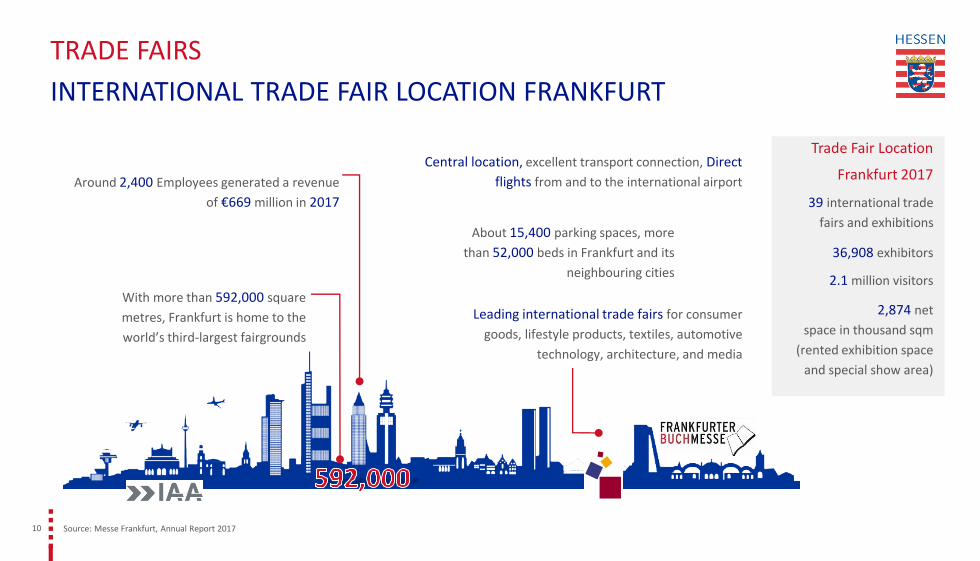
TRADE FAIRS
INTERNATIONAL TRADE FAIR LOCATION FRANKFURT
36,908 exhibitors
2,874 net
space in thousand sqm
(rented exhibition space
and special show area)
Trade Fair Location
Frankfurt 2017
39 international trade
fairs and exhibitions
2.1 million visitors
Leading international trade fairs for consumer
goods, lifestyle products, textiles, automotive
technology, architecture, and media
Central location, excellent transport connection, Direct
flights from and to the international airport
About 15,400 parking spaces, more
than 52,000 beds in Frankfurt and its
neighbouring cities
With more than 592,000 square
metres, Frankfurt is home to the
world’s third-largest fairgrounds
Around 2,400 Employees generated a revenue
of €669 million in 2017

2019 Trade Fair Location
08–11 Jan Heimtextil – International trade fair for home and contract textiles Frankfurt
25–29 Jan Christmasworld / Floradekora – International trade fair for seasonal and festive decorations Frankfurt
26–29 Jan Creativeworld – International trade fair for hobby, craft and art supplies Frankfurt
26–29 Jan Paperworld – Leading International Trade Fair for Paper, Office Supplies and Stationery Frankfurt
08–12 Feb Ambiente – International consumer goods fair of the sectors Dining - Giving - Living Frankfurt
16–18 Feb I.L.M. Winter Styles – International Leather Goods Fair Offenbach
11–15 Mar ISH – Leading international trade fair for the responsible management of water and energy in buildings, bathroom design, heating, and air-conditioning technologies
Frankfurt
02–05 Apr Prolight + Sound – International trade fair of technologies and services for entertainment, integrated systems and creation Frankfurt
02–05 Apr Musikmesse – International trade fair for musical instruments and sheet music, music production and marketing Frankfurt
14–17. May Techtextil – Leading international trade fair for technical textiles and nonwovens Frankfurt
29 Jun–02 Jul Tendence – International consumer goods fair for the home and gifts sector Frankfurt
10–22 Sep IAA Cars – International Motor Show Frankfurt
07–09 Sep I.L.M. Summer Styles – International leather goods fair Offenbach
16–20 Oct Frankfurt Book Fair – International trade fair for books, multimedia & communication Frankfurt
12–15 Nov formnext – International exhibition and conference on the next generation of manufacturing technologies Frankfurt
TRADE FAIRS
HESSEN TRADE FAIR CALENDAR 2019
Source: Messe Frankfurt | Messe Offenbach 11
International trade fairs and exhibitions (selection)
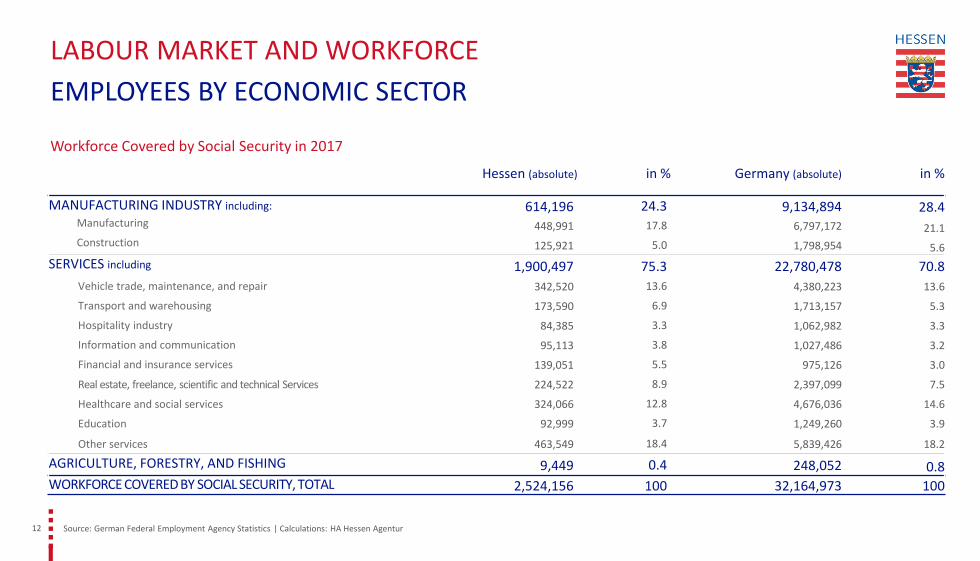
LABOUR MARKET AND WORKFORCE
EMPLOYEES BY ECONOMIC SECTOR
12
Workforce Covered by Social Security in 2017
Hessen (absolute) in % Germany (absolute) in %
MANUFACTURING INDUSTRY including: 614,196 24.3 9,134,894 28.4Manufacturing 448,991 17.8 6,797,172 21.1Construction 125,921 5.0 1,798,954 5.6
SERVICES including 1,900,497 75.3 22,780,478 70.8
Vehicle trade, maintenance, and repair 342,520 13.6 4,380,223 13.6
Transport and warehousing 173,590 6.9 1,713,157 5.3
Hospitality industry 84,385 3.3 1,062,982 3.3
Information and communication 95,113 3.8 1,027,486 3.2
Financial and insurance services 139,051 5.5 975,126 3.0
Real estate, freelance, scientific and technical Services 224,522 8.9 2,397,099 7.5
Healthcare and social services 324,066 12.8 4,676,036 14.6
Education 92,999 3.7 1,249,260 3.9
Other services 463,549 18.4 5,839,426 18.2
AGRICULTURE, FORESTRY, AND FISHING 9,449 0.4 248,052 0.8WORKFORCE COVERED BY SOCIAL SECURITY, TOTAL 2,524,156 100 32,164,973 100
Source: German Federal Employment Agency Statistics | Calculations: HA Hessen Agentur

Germany
16.0
14.0
12.0
10.0
8.0
6.0
4.0
2.0
0.0
Hessen is international and offers excellent employment prospects to both German and
foreign employees. Employment numbers have been rising particularly dynamic since
2013. In Hessen, the number of employed persons rose by more than 9% during this
period, while the increase of German workers was at around 5%. This means that
currently 14.5% of employees have a foreign nationality – an above-average figure
compared with the rest of Germany. The proportion of highly qualified employees is
also above average in Hessen. 18.3 % of employees have an academic degree.
13
LABOUR MARKET AND WORKFORCE
INTERNATIONAL EMPLOYEES
Percentage of international employees (%)
Number of employees in 1,000
Year Total from international communities
2013 2,315 258
2014 2,360 282
2015 2,409 308
2016 2,458 336
2017 2,524 366
Development of employment 2013-2017
Source: German Federal Employment Agency Statistics | Calculations: HA Hessen Agentur
11.111.9
12.8
13.714.5
7.98.5
9.210.0
10.8
2013 2014 2015 2016 2017
Hessen

Vocational training is crucial for Hessen's innovative strength and competitiveness. An essential
pillar is the dual training system. It provides companies with qualified and practically trained
specialists who can contribute to the company's value chain right after training. 38,226 new
training contracts were concluded in Hessen in 2018. With only 4.6 percent, youth
unemployment is at a welcome low level, both in the national and international comparison,
not least due to the great importance of dual training. It provides trainees with advancement
qualifications within the respective occupational groups or access to higher education
without a secondary school certificate.
In addition to standard university programmes, advancement is also possible in the form
of dual study programmes, where practical on-the-job study content in companies is
combined with the theoretical content in dual universities to offer a more practice-
oriented course of study. More and more companies, universities and young people are
seeing the advantages of a dual study programme: 30 courses at 17 universities and
vocational academies, and more than 10,000 graduates in the past ten years speak for
themselves.
14 * As of July 2018
LABOUR MARKET AND WORKFORCE
TRAINING IN HESSEN
Youth unemployment rates in EU countries in %
Selected states and Hessen in comparison, September 2018
Source: German Federal Institute for Vocational Education and Training (BIBB) | Statista | HMWEVW | HMWK
4.6
6.3
7.5
9.6
11
14.9
16.8
20.4
31.6
34.3
37.9
Hessen
Germany
Netherlands
Poland
Great Britain*
EU-28
Sweden
France
Italy
Spain
Greece*

Rank / Company Industry Locations in Hessen
Employees in Hessen, 2017
1 Continental Corporation AutomotiveFrankfurt, Korbach, Karben, Schwalbach am Taunus, Babenhausen
16,600
2 Volkswagen AG Automotive Baunatal 16,000
3 Opel Automobile GmbH Automotive Rüsselsheim 15,000
4 Merck Group Chemical and pharmaceutical Darmstadt, Gernsheim, Wiesbaden 10,000
5 Fresenius SE & Co KGaAChemical and pharmaceutical,medical technology
Bad Homburg, Bad Hersfeld, Bensheim, Biebesheim, Friedberg
8,600
6 B. Braun Melsungen AGChemical and Pharmaceutical, medical technology
Melsungen, Spangenberg, Bad Arolsen 7,400
7 Sanofi-Aventis Germany GmbH Chemical and pharmaceutical Frankfurt (Höchst) 7,000
8 Evonik Industries AG Chemical and pharmaceuticalDarmstadt, Hanau, Weiterstadt, Steinau a.d. Str., Bad König
5,900
9 Siemens AG Electronics, mechanical engineering, medical technologyBad Hersfeld, Eschborn, Frankfurt, Höchst, Kassel
5,700
10 Viessmann Works GmbH & Co. KG Metal industry, electronics Allendorf, Gladenbach, Frankfurt, Kassel 5,000
Source: HA Hessen Agentur 201715
LABOUR MARKET AND WORKFORCE
THE TEN LARGEST INDUSTRIAL EMPLOYERS IN HESSEN

HESSEN INTERNATIONAL
HESSEN IN INTERNATIONAL COMPARISON
16
Gross domestic product (GDP) per capita (in 1,000 €)
Hessen and selected countries in comparison
52.7
44.839.9 39.4
35.2 34.1 34.029.8 28.3 26.3
18.412.7
9.5
USA
Hes
sen
Can
ada
Ge
rman
y
Gre
at B
rita
in
Fran
ce
Jap
an
EU-2
8
Ital
y
Rep
. Ko
rea
Sau
di A
rab
ia
Arg
enti
na
Ru
ssia
Source: World Bank | German Regional Accounts Working Group | Calculations: HA Hessen Agentur 2017

Demand for chemicals and pharmaceutical goods continued abroad in 2017,
imports dominated by electrical products
The Hessian economy exported goods to the value of 62.3 billion euros in 2017. This
corresponds to an increase of 6.6 percent compared to the previous year. On the import side,
Hessen recorded a growth of 8.7 percent with an import volume of 93.7 billion euros.
The products of the chemical and pharmaceutical industries are by far Hessen’s greatest export
success. In 2017, they continue to head the rankings of the most important export goods with a
volume of 17.2 billion euros. This corresponds to 27.7 percent of Hessen's export volume. They
are followed by products in mechanical and vehicle engineering as well as electrical
engineering. These product groups are also the most important import goods. Electrical
engineering products account for the largest import volume with 15.5 billion euros, followed by
chemical and pharmaceutical products with 12.6 billion euros – with a combined share of over
30 percent of total imports.
Please note: Due to the different demarcations between export (special trade) and import
(general trade), netting is not possible.
Source: Hessian State Statistical Office | Calculations: HA Hessen Agentur17
HESSEN INTERNATIONAL
THE MOST IMPORTANT FOREIGN TRADE GOODS
Product groupsExports 2017
in € millionImports 2017
in € million
Food industry 2,788 4,117
Raw materials 216 6,558
Intermediate products 3,888 8,907
Finished goods, including: 53,914 69,321
Chemical and pharmaceutical products
17,231 12,602
Machinery 7,065 10,129
Vehicles, vehicle parts and accessories
6,310 8,961
Electrical engineering products 6,642 15,507
Other goods 1,460 4,597
Total 62,266 93,500

The USA accounted for 11.3 percent of all Hessian exports in 2017. It is followed by France
and the Netherlands with a share of 7.7 percent and 7.3 percent respectively, followed by
Great Britain with 6.5 percent. Another non-EU country with an export volume of almost
3.7 billion euros is China, which, alongside the USA, is among the TOP-10 exporting
countries.
The majority of Hessen's exports, 66 percent, go to countries within Europe.
The second most important market for exports is Asia with a share of 16.4 percent,
followed by North and South America with 15.6 percent. Within Asia, China is the most
important customer for Hessen's exports, with an export share of 5.9 percent.
Exports 2017 (selected countries)
Source: Hessian State Statistical Office | Calculations: HA Hessen Agentur 18
HESSEN INTERNATIONAL
MAJOR TRADING PARTNERS
Rank / CountryHessen
in € million
Percentage of total exports (%)
USA 7,007 11.3
France 4,817 7.7
Netherlands 4,550 7.3
Great Britain 4,075 6.5
PR China 3,672 5.9
Poland 3,457 5.6
Italy 3,062 4.9
Austria 2,775 4.5
Spain 2,323 3.7
Belgium 2,179 3.5
Other countries 24,349 39.1
Total 62,266 100
Two thirds of exports go to European countries –The United States are the most important trading partner,ahead of China

The United States and the People's Republic of China are Hessen's leading trading partners.
Since 2016, China has been the most important source market for Hessian importers with a
volume of 11.2 billion euros, which corresponds to a share of almost twelve percent of
Hessen's total imports. The United States rank second with an import volume of 8.9 billion
euros and a share of 9.5 percent of total imports.
More than 58 percent of the goods are imported from European countries to Hessen. As in
the export sector, Asia ranks second with an import share of 27.7 percent, followed by the
Americas, which account for 11.4 percent.
Imports 2017 (selected countries)
19
HESSEN INTERNATIONAL
MAJOR TRADING PARTNERS
Rank / CountryHessen
(€ millions)
Percentage of total imports (%)
PR China 11,158 11.9
USA 8,857 9.5
Russia 6,337 6.8
Netherlands 5,778 6.2
Switzerland 5,229 5.6
France 4,794 5.1
Italy 4,468 4.8
Japan 4,208 4.5
Belgium 3,969 4.2
Great Britain 3,663 3.9
Other countries 35,039 37.5
Total 93,500 100
Goods from China and the US account for the largest share of Hessen’simport volume
Source: Hessian State Statistical Office, preliminary figures | Calculations: HA Hessen Agentur

Distribution of foreign investment in Germany by federal state
Foreign direct investment in Hessen by country
Source: Deutsche Bundesbank | Calculations: HA Hessen Agentur | At the end of 201620
HESSEN INTERNATIONAL
FOREIGN DIRECT INVESTMENT IN HESSEN
Country of Origin (TOP-10) in billion € Percentage
Netherlands 23.2 31.1
Luxembourg 9.2 12.3
Great Britain 6.6 8.9
France 5.7 7.6
South Korea 3.8 5.1
Switzerland 3.8 5.1
Sweden 3.6 4.9
Ireland 3.2 4.3
Japan 2.9 4.0
Austria 2.4 3.3
Other countries 10.0 13.4
Total 74.4 100
Germany: 497 billion €Hessen: 74 billion €
29.2%
21.3%
15.0%
9.9%
11.8%
12.8 % North Rhine-Westphalia
Bavaria
Hessen
Baden-Württemberg
City states
Other federal states

Industry 4.0-oriented enterprises in Germancities*
*Ranking of 71 cities >100,000 residents
21
RESEARCH AND DEVELOPMENT
TECHNOLOGY LOCATION HESSEN
Research and development in EU comparison
➢ significant R&D expenditure: 2.9 % of the GDP (EU-28 2.0 %)
➢ among the TOP 10 of the most innovative Regions in Europe
➢ above-average proportion of highly qualified employees with
academic qualifications
➢ strong engagement of the corporate sector: 75 % of R&D-
expenditures are made by companies
(EU-28: 64.9%)
Source: German Federal Statistical Office | Eurostat | Hessian State Statistical Office | German Economic Institute 2018
➢ Frankfurt and Darmstadt among the TOP 5 of the
Industry 4.0-oriented business locations in Germany
Rank City Value
1 Frankfurt am Main 8.4
2 Wolfsburg 8.3
3 Stuttgart 8.3
4 Darmstadt 8.2
5 Karlsruhe 8.1
6 Munich 7.7
7 Ulm 7.6
8 Jena 7.1
9 Erlangen 6.7
10 Düsseldorf 6.7

RESEARCH AND DEVELOPMENT
UNIVERSITIES AND RESEARCH INSTITUTES
22
Around 80 Universities, research institutes, and institutions for academic education
3,500 businesses in about
40 cluster and network initiatives
Above-average number of universities and higher
education institutions: 6.1 Universities per
1 million inhabitants (Germany: 5.2)
Around 40 technology and start-up centres
132 entrepreneurs per 10,000 employed persons
(Germany 125)
20 national institutes for basic and applied research
7 Universities
15 Other universities
16 Universities of Applied Sciences
1 Helmholtz Association institute
8 Max Planck Institutes
7 Fraunhofer Institutes
4 Gottfried-Wilhelm-Leibnitz Research Institutes
25 Other research institutes
Source: German Federal Statistical Office | DFG German Research Foundation | Hessian State Statistical Office
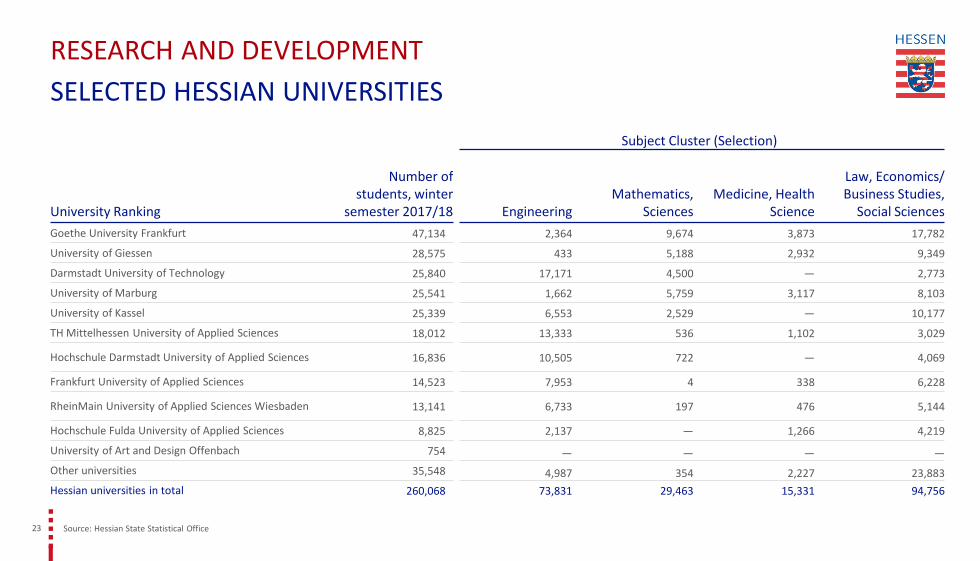
Source: Hessian State Statistical Office 23
RESEARCH AND DEVELOPMENT
SELECTED HESSIAN UNIVERSITIES
Subject Cluster (Selection)
University Ranking
Number of students, winter
semester 2017/18 EngineeringMathematics,
SciencesMedicine, Health
Science
Law, Economics/Business Studies,
Social Sciences
Goethe University Frankfurt 47,134 2,364 9,674 3,873 17,782
University of Giessen 28,575 433 5,188 2,932 9,349
Darmstadt University of Technology 25,840 17,171 4,500 — 2,773
University of Marburg 25,541 1,662 5,759 3,117 8,103
University of Kassel 25,339 6,553 2,529 — 10,177
TH Mittelhessen University of Applied Sciences 18,012 13,333 536 1,102 3,029
Hochschule Darmstadt University of Applied Sciences 16,836 10,505 722 — 4,069
Frankfurt University of Applied Sciences 14,523 7,953 4 338 6,228
RheinMain University of Applied Sciences Wiesbaden 13,141 6,733 197 476 5,144
Hochschule Fulda University of Applied Sciences 8,825 2,137 — 1,266 4,219
University of Art and Design Offenbach 754 — — — —
Other universities 35,548 4,987 354 2,227 23,883
Hessian universities in total 260,068 73,831 29,463 15,331 94,756

Hessen Trade & Invest GmbHKonradinerallee 965189 [email protected] | www.htai.de/enTel. +49 611 95017 85
www.invest-in-hessen.com