Embed Size (px)
Citation preview

23
Delhi Business Review Vol. 15, No. 1 (January - June 2014)
EXTENSIBLE BUSINESS REPORTING LANGUAGE (XBRL)A PERCEPTUAL STUDY
Pooja Dhingra*Ajay Kr. Singh**Gaurav Magu***
URPOSEIN India Ministry of Corporate Affairs has mandated certain companies to file Balance Sheetand Profit & Loss Account using the Extensible Business Reporting Language (XBRL) taxonomy.
The study highlights the preparedness of Accounting Community for the same. The purpose of thisresearch is to empirically examine the impact of demographic factors on the perceived benefits andobstacles in adopting XBRL in India.
Design/Methodology/Approach: The data on these variables was collected by employing an onlineand hand filled survey questionnaire. Total 185 usable questionnaires were examined. Responseswere collected from the accounting professionals, practicing chartered accountants, managers of reputedcompanies selected randomly. By conducting EFA factors of XBRL awareness, benefits from XBRLadoption and perceived obstacles in XBRL adoption were extracted. A comparison among the groupsof respondents was done on the basis of demographics of years of experience and nature ofoccupation.
Findings: The awareness on XBRL is at nascent stage in India. There is difference in the perceptionof the accounting community on the basis of level of experience and type of occupation with regard tothe Awareness and perceived obstacles in adoption of XBRL, though there is no difference in theirperception with regard to its perceived benefits.
Research Limitations/Implications: The implications of the findings are discussed in the contextof promoting the adoption of XBRL technology. More education and training needs to be imparted.XBRL should be taught in universities too as future language of accounting reporting.
Key Words: eXtensible Business Reporting Language, XBRL, XML, Integrated Reporting.
IntroductionOn April 16, 2013, the International Integrated Reporting Council (IIRC) issued its “Consultation Draftof the International Integrated Reporting Framework” (the CD) as a proposed framework for how tocreate an integrated report and what to include in that report. XBRL is mentioned explicitly in thissection of the CD as a possible technology platform for integrated reporting as it is used around theworld by regulators and agencies as the standard for structured digital disclosures of financial information.XBRL is a logical consideration for providing similar benefits to integrated reports that combine financialand non-financial information (Monterio, 2013). In India, XBRL taxonomies have been created and
* Assistant Professor, Shri Ram College of Commerce, University of Delhi, Delhi, India; M.Phil Scholar (Accounting), Departmentof Commerce, Faculty of Commerce and Business, Delhi School of Economics, University of Delhi, Delhi, India.
** Associate Professor, Department of Commerce, Faculty of Commerce and Business, Delhi School of Economics, University ofDelhi, Delhi, India.
*** Legal & Compliance Head, SmartAnalyst, Gurgaon, India.
P

24
Pooja Dhingra, Ajay Kr. Singh, and Gaurav Magu
mandated by Reserve Bank of India (RBI), Securities and Exchange Board of India (SEBI), and Ministryof Corporate Affairs (MCA). It is expected that many other regulatory and national jurisdiction bodiessuch as Sales Tax and Income Tax authorities will be coming up with their specific reporting requirementusing XBRL (Essential Features of XBRL Reporting Software – Deloitte).
XBRL as a Platform for Communication of Integrated ReportingThe Integrated Reporting framework makes explicit reference to XBRL as a “standardized technologyplatform that may be used for it.” It goes on to say that “XBRL improves the way information iscreated, processed, distributed, and analyzed by providing standardized definitions, labels, calculations,references, and contexts applicable to individual numbers and narrative text.” XBRL is a logical choice forintegrated reports as it provides the same benefits to non-financial data as can be provided to financialdata. An integrated report leads to a broader explanation of performance than more traditional corporatereporting by “describing, and measuring where practicable, the material elements of value creation andthe relationships between them. In particular, it makes visible all the capitals (financial, manufactured,intellectual, human, social, relationship, and natural) on which value creation (past, present, andfuture) depends, how the organization uses those capitals and its effects on them” (Monterio, 2013).
Conceptual Framework of XBRLIn business, technology and process, improvement is viewed as making life easier, increasing efficiency,decreasing cost, or adding more consumer value. Similarly, the motivation behind changes in reportingtechnology and new standards is to improve the reporting process for accountants and their clients.
A challenge for the management of an enterprise that uses traditional EDI (Electronic Data Interchange)systems is that sharing data with other companies or different divisions within the same company maybe thwarted by groups with each enterprise that use reporting system that adhere to their owncommunication standard (Bergeron, 2003).
As a result, each reporting group within the enterprise may be forced to exchange data using paper forms.When multiple vendor-specific communication standards are used within an enterprise, integratingthe different systems is generally accomplished by installing a new enterprise-wide system. Alternatively,system interfaces can be developed that allow the existing or legacy systems to share data with eachother. A traditional system interface provides for the communication of data from one legacy system toanother at several levels. The highest level of an interface deals with the conversion of data formats andunits. For example, the accounting system used by management in Milan office may handle payroll ineuros, while the accounting system in New York records payroll in U.S. dollars (Bergeron, 2003).
Various Interfaces Required for Communication between Systems.
Source: Primary Data.
System A
System C System D
System B
Interface
AB
Interface AD Interface
BC
Interface AC
Interface BD
Interface CD
A&B
B&C
C&D
A&D
A&C
B&D

25
Delhi Business Review Vol. 15, No. 1 (January - June 2014)
To provide sharing between for example, for different systems – say company and its three recentaquired companies – six different interfaces have to be developed.
With the success of the internet as a conduit for e-commerce, e-mail, and general communications, thelanguage used to make static Web pages, Hypertext Markup Language (HTML), became a de factostandard virtually overnight. However, when companies began to explore sharing transaction data inreal time instead of simply creating online brochures, developers looked elsewhere. As a result, severallanguages were developed to allow integration of databases over the Internet. One of these languages,XML (eXtensible Markup Language), a relative of HTML, is rapidly gaining popularity in the informationtechnology community. XML is gaining support across every industry that relies on e-commerce andon Internet for communications. As its name suggests, XML is extensible, or easily modified (Bergeron,2003).
One of the evolving extensions or evolutions of XML is the eXtensible Business Reporting Language(XBRL). Reporting systems that communicate with each other through a common XML-based standard,such as XBRL, are much less complex than those communicating through multiple, dedicated interfaces.As an extension of XML, XBRL is itself an extensible language, meaning that its vocabulary can beeasily modified to suit the changing needs of the finance industry. Although XBRL is a reportinglanguage, its use extend beyond simple financial reporting (Essentials of XBRL: Financial Reporting inthe 21st Century).
DefinitioneXtensible Business Reporting Language is an open, platform-independent, international standardfor the timely, accurate, efficient, and cost-effective electronic storage, manipulation, repurposing,and communication of financial and business reporting data.
Even though XBRL has backing from Microsoft, IBM, Adobe, Sun Microsystems, and other industryleaders, it is a non-proprietary, open language. As a result, the definitions within the XBRL standardare freely available.
Another characteristic of XBRL, which it inherits from XML, is that it is platform independent.Just as English is the accepted language of business for most of the world, XML runs on all of themajor computer hardware under the most common operating systems.
XBRL vis-à-vis EDIElectronic data interchange is an entrenched technology throughout the world for business transactions.Large corporations that can afford to invest in EDI systems have traditionally realized significantsavings over doing business with paper invoices, receipts, and related tracking documents. EDI systemsdiffer from XML-based systems primarily in their difficulty to learn and the time involved in editingand modifying forms and reports. Making changes in an EDI system typically requires programmer’sfamiliarity with BASIC, COBOL, or some other compiled programming language. Furthermore, sinceevery EDI system is different, every programming task involves new challenges and uncertainties thatresult in an extended development and maintenance cycle.
From a financial reporting perspective, EDI systems are limited because they are primarily transactionbased and not designed to track historical financial data.
Timely, accurate financial reporting data is invaluable to management and to corporate decision making,regardless of the underlying business model. XBRL is fundamentally about efficient information sharingwith increased speed and efficiency. Its also about enhanced distribution and rapid analysis of businessdata (Bergeron, 2003). For the accounting professional, the benefits of computerizing a paper-basedpractice are obvious: fewer errors of omission and commission potentially lower cost (depending onreporting volume), and a computing infrastructure that can be used to perform additional analysis andprovide customers with service beyond basic reporting (Bergeron, 2003). For the corporate manager,the payoff of moving to XBRL-based reporting is predominantly in the timely access to business intelligence
26
Pooja Dhingra, Ajay Kr. Singh, and Gaurav Magu
and the ability to use a variety of web-enabled tools to help in making operational decisions. These toolscan be used to compare, e.g., the performance of public companies in the same market. Using Microsoft’sXBRL-enabled Office suite of tools, including the Excel spreadsheet and Access database applications,managers have the ability to take in near-real-time data from their operations and perform what-ifanalysis, graph the results, and save the analysis for future reference.
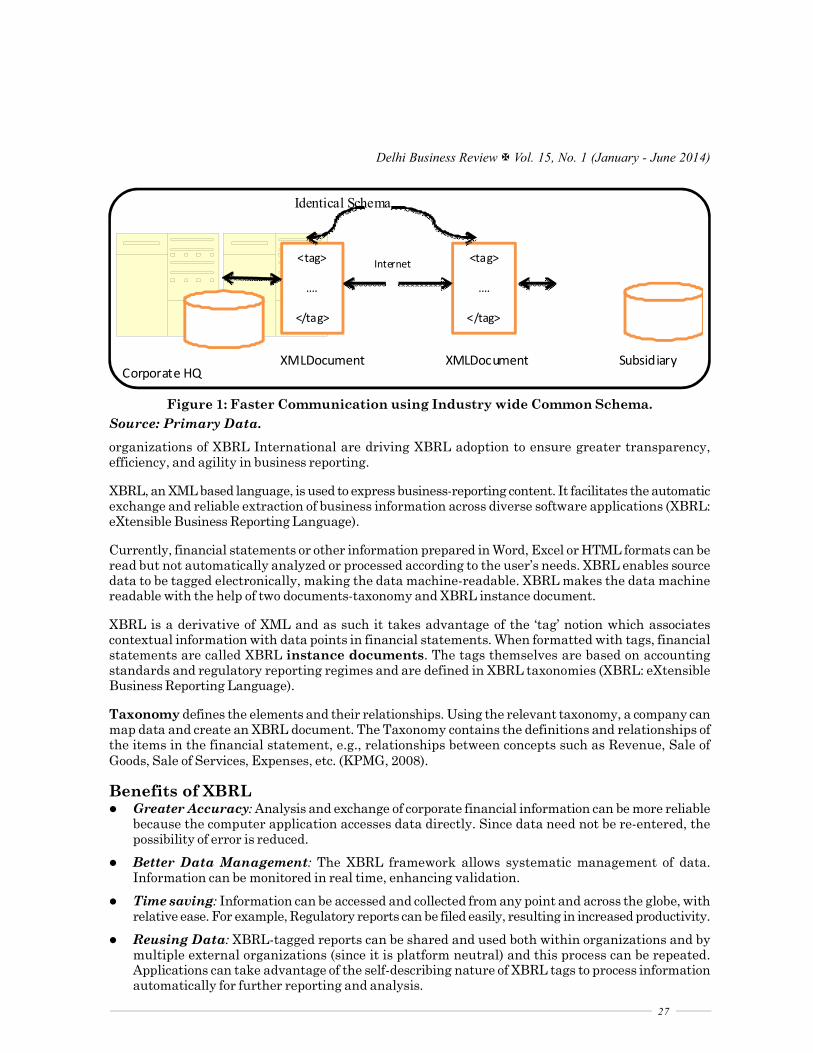
Just as the Unique Product Code (UPC) and bar code transformed the retail goods business, XBRL ispositioned to transform the financial reporting business by providing timelier, accurate, efficient, andcost-effective reporting (Bergeron, 2003). Just as a UPC bar code allows every item to be automaticallyentered into the checkout register in a goods store, every piece of financial transaction data stored inXBRL format needn’t be manually rekeyed (Deloitte, 2011). As long as the systems communicate viathe same dialect of XBRL, there will be no keying errors and data will be transferred from one systemto another at an equivalent speed of light.
In the Figure 1, the documents exchanged between corporate headquarters and the subsidiary isguaranteed to be readable by the other party, since the document shared an industry-wide schema.
XBRL is an electronic language; a royalty-free open specification developed by XBRL International Inc.,a not-for-profit consortium of 500 leading companies and agencies from around the world. The
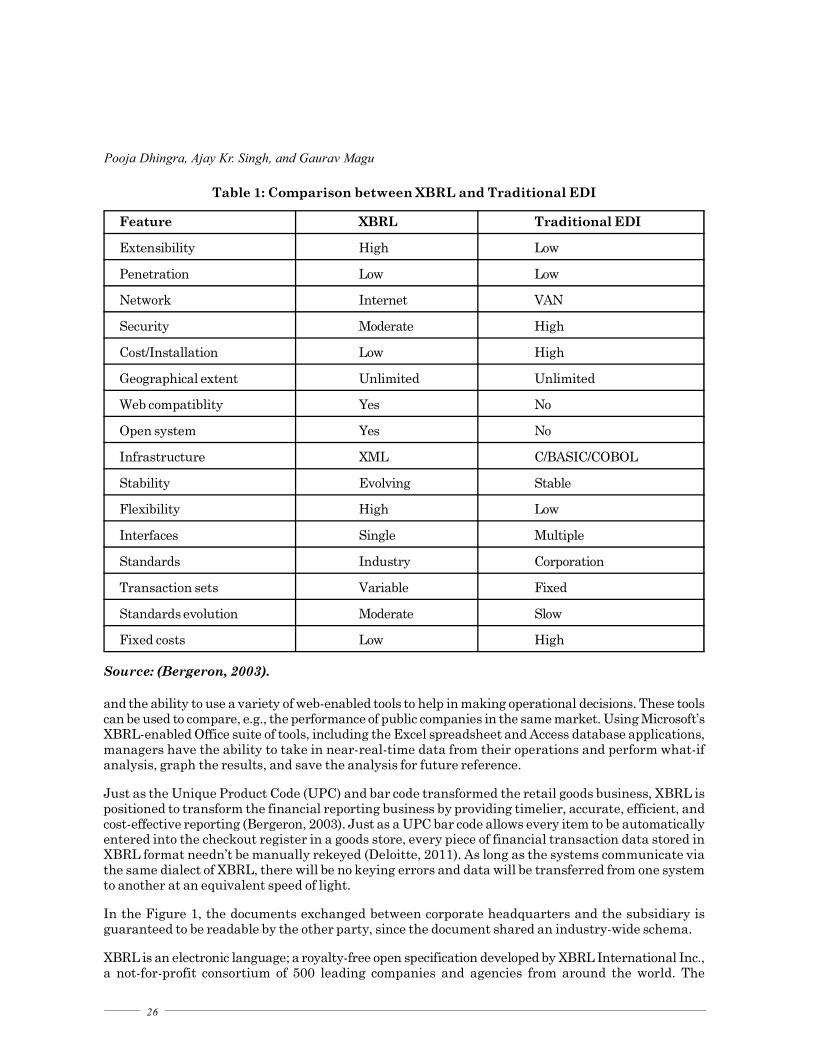
Table 1: Comparison between XBRL and Traditional EDI
Feature XBRL Traditional EDI
Extensibility High Low
Penetration Low Low
Network Internet VAN
Security Moderate High
Cost/Installation Low High
Geographical extent Unlimited Unlimited
Web compatiblity Yes No
Open system Yes No
Infrastructure XML C/BASIC/COBOL
Stability Evolving Stable
Flexibility High Low
Interfaces Single Multiple
Standards Industry Corporation
Transaction sets Variable Fixed
Standards evolution Moderate Slow
Fixed costs Low High
Source: (Bergeron, 2003).
27
Delhi Business Review Vol. 15, No. 1 (January - June 2014)
organizations of XBRL International are driving XBRL adoption to ensure greater transparency,efficiency, and agility in business reporting.
XBRL, an XML based language, is used to express business-reporting content. It facilitates the automaticexchange and reliable extraction of business information across diverse software applications (XBRL:eXtensible Business Reporting Language).
Currently, financial statements or other information prepared in Word, Excel or HTML formats can beread but not automatically analyzed or processed according to the user’s needs. XBRL enables sourcedata to be tagged electronically, making the data machine-readable. XBRL makes the data machinereadable with the help of two documents-taxonomy and XBRL instance document.
XBRL is a derivative of XML and as such it takes advantage of the ‘tag’ notion which associatescontextual information with data points in financial statements. When formatted with tags, financialstatements are called XBRL instance documents. The tags themselves are based on accountingstandards and regulatory reporting regimes and are defined in XBRL taxonomies (XBRL: eXtensibleBusiness Reporting Language).
Taxonomy defines the elements and their relationships. Using the relevant taxonomy, a company canmap data and create an XBRL document. The Taxonomy contains the definitions and relationships ofthe items in the financial statement, e.g., relationships between concepts such as Revenue, Sale ofGoods, Sale of Services, Expenses, etc. (KPMG, 2008).
Benefits of XBRL Greater Accuracy: Analysis and exchange of corporate financial information can be more reliable
because the computer application accesses data directly. Since data need not be re-entered, thepossibility of error is reduced.
Better Data Management: The XBRL framework allows systematic management of data.Information can be monitored in real time, enhancing validation.
Time saving: Information can be accessed and collected from any point and across the globe, withrelative ease. For example, Regulatory reports can be filed easily, resulting in increased productivity.
Reusing Data: XBRL-tagged reports can be shared and used both within organizations and bymultiple external organizations (since it is platform neutral) and this process can be repeated.Applications can take advantage of the self-describing nature of XBRL tags to process informationautomatically for further reporting and analysis.
Identical Schema
<tag>
….
</tag>
<tag>
….
</tag>
Internet
XMLDocument XMLDocument Subsidiary Corporate HQ
Figure 1: Faster Communication using Industry wide Common Schema.
Source: Primary Data.
28
Pooja Dhingra, Ajay Kr. Singh, and Gaurav Magu
Data Validation: XBRL tagged reports can be validated for consistency and inter-relationshipsbetween various data elements.
Easier Document Reading: XBRL taxonomies enable the computer to read any document, e.g.,if the user is using say French, he can collect and reassemble data from documents written, say inFinnish or Welsh, if they are XBRL-tagged.
Transparency: XBRL allows for increased transparency of financial information to stakeholders,at a granular level, e.g., companies reporting under a common taxonomy provide specific detailsthat are immediately comparable by investors and analysts in investment decision making (XBRL:eXtensible Business Reporting Language).
This can benefit the organization in various ways, such as improved investor relations, investor coverage,and access to capital markets.
Though, India has started late in adopting XBRL, it has gained significant momentum in recent times.The Ministry of Corporate Affairs, The Securities and Exchange Board of India, The Reserve Bank ofIndia, and the Institute of Chartered Accountants of India have been responsible for the current set ofInitiatives.
Literature ReviewXBRL evolved over time as a response to corporate and regulatory challenges. Specification has beenextended to cover real business complexities, and each one of these corresponds to specificrecommendations published by XBRL International (Gonzalbez and Rodriguez, 2012). The use of themost advanced and rigorous standards in taxonomy development will help to a better assurance offuture XBRL reports, as pointed out by many authors (Cohen, 2009); (Lymer and Debreceny, 2003);(Boritz and Wo, 2008); (Plumlee and Plumlee, 2008); (Shrivastava and Kogan, 2009); (Gonzalbez andRodriguez, 2012). As a result, new specifications have been developed. Rawashdeh et al., (2011) examinedthe impact of demographic factors upon the XBRL adoption among consumers that provide insights toXBRL adopters and non-adopters. These include age, gender, education, experience, type of industry,and country. The research suggested that experience level was a good predictor of XBRL adopters andnon-adopters. The study concluded that most of the adopters were experienced people (Rawashdeh etal., 2011). According to (Doolin and Troshani, 2007) benefits of XBRL are not expected to be immediatebut will accumulate over time. Further, more organizations are influenced by other stakeholders (networkeffect) in the adoption decision and may see the risk of adverse actions by competitors and other partiesbased on the more detailed information provided via XBRL (Wagenhofer, 2003).
Several authors agree that the implementation of a relatively complex innovation like XBRL requiresspecific expertise which is not necessarily available in organizations (Gray and Miller, 2009).
Doolin and Troshani (2007) found that education is the essential driver of XBRL adoption, it is suggestedthat education can be used as an independent variable that provides details on the divergence betweenXBRL adopters and non-adopters (Rawashdeh et al., 2011).
There is a broad consensus on the fact that XBRL significantly improves the distribution of financialinformation among stakeholders. The basic financial information only needs to be prepared once andcan be provided in a wide range of formats and languages through different communication channels(e.g., web reporting). Additionally, electronic formats facilitate the consumption and reuse of theinformation. Stakeholders can easily satisfy their information needs. Each stakeholder can have theinformation in the preferred format and through the desired channel (Wickop et al., 2012).
Objectives of the StudyThe study was conducted with the following objectives:
1. To have an insight on functioning on XBRL.

29
Delhi Business Review Vol. 15, No. 1 (January - June 2014)
2. To study whether level of experience and the nature of occupation of accounting professionals affectthe level of awareness on XBRL (AWXBRL), perceived benefits (BENXBRL), and obstacles (OBXBRL)in implementation of XBRL in India.
Hypotheses
The following two hypotheses were made:
1. “H01”- AWXBRL, BENXBRL and OBXBRL do not significantly vary among the groups made onthe basis of experience of the respondents.
2. “Ha1”- AWXBRL do vary significantly among the groups made on the basis of experience of therespondents.
3. “H02”- BENXBRL do not significantly vary among the groups made on the basis of experience ofthe respondents.
4. “Ha2”- BENXBRL do vary significantly among the groups made on the basis of experience of therespondents.
5. “H03”- OBXBRL do not significantly vary among the groups made on the basis of experience of therespondents.
6. “Ha3”- OBXBRL do vary significantly among the groups made on the basis of experience of therespondents.
7. “H04”- AWXBRL do not significantly vary among the groups made on the basis of occupation of therespondents.
8. “Ha4”- AWXBRL do vary significantly among the groups made on the basis of occupation of therespondents.
9. “H05”- BENXBRL do not significantly vary among the groups made on the basis of occupation ofthe respondents.
10. “Ha5”- BENXBRL do vary significantly among the groups made on the basis of occupation of therespondents.
11. “H06”- OBXBRL do not significantly vary among the groups made on the basis of occupation of therespondents.
12. “Ha6”- OBXBRL do vary significantly among the groups made on the basis of occupation of therespondents.
Research MethodologyFor the purpose of meeting the research objectives, a survey method through questionnaire was usedand data were collected from accounting professionals. It was assumed that the respondents weresuitably exposed to the literature, research papers and various seminars related to the research idea.Thus, they fairly represent the accounting professionals bodies in India.
Based on intense review of past literature a questionnaire was designed which was pretested for contentvalidity on the sample of 33 respondents, which included Chartered Accountants, Academicians, andindustry experts. Each statement was measured on a 5 point Likert scale ranging from ‘StronglyDisagree to Strongly Agree’.
The final questionnaire was circulated online and offline to the Chartered Accountancy firms. Stratifiedrandom sampling method for data collection was adopted. Though the number of offline questionnairescirculated was quite high, only 190 could be collected, 48 questionnaires were received online, which

30
Pooja Dhingra, Ajay Kr. Singh, and Gaurav Magu
included responses from CAs and Accounting Professionals outside Delhi also. Out of the total 238questionnaires 185 were deemed fit for analysis. The time period for the data collection was March,2013 to December, 2013.
Research Tools and TechniquesStatistical Package for Social Sciences (SPSS) version 20 for windows was applied in the processof data input and compilation. For further analysis, AMOS 20 and Statistical Tool Package wereused. The multivariate statistical technique of Exploratory Factor Analysis was used to condensethe information contained in a number of original variables into smaller set of composite dimensionswith minimum loss of information (Hair, 2010). It has been long recognized that the precision (reliability)and the accuracy (validity) of verbal instruments are determined to a large degree by the design andconstruction of scales. Therefore, we have calculated Cronbach’s Alpha to test the reliability of thevariables under the present study.
Demographic Profile of RespondentsOnline survey and hand filled questionnaires administered mainly to qualified Chartered Accountants,as it is the CA community through which the change can get implemented, so their opinions were tested.
Sample Size- 185 respondents working in CA firms in Delhi, NCR, Kolkata, and Mumbai.
Table 2: Case Processing Summary
Case
Valid Missing Total
N Percent N Percent N Percent
Occupation1* Experience 174 94.1% 11 5.9% 185 100.0%
Table 3: Occupation* Experience Crosstabulation
Count
Experience Total
Less than 5-10 11-16 More than5 years years years 16 years
Occupation Practicing Chartered 17 28 6 35 86Accountant Accounting
Professional (Employed) 45 5 2 2 54
Manager 3 3 2 2 10
Other 14 5 3 2 24
Total 79 41 13 41 174
Data Analysis and FindingsTo proceed first reliability of the instrument was determined by using Cronbach’s alpha that was foundto be greater than 0.7 (i.e., 0.738) which is commonly accepted threshold (Nunnally and Berstein,1994), hence laying foundation for further analysis.
31
Delhi Business Review Vol. 15, No. 1 (January - June 2014)
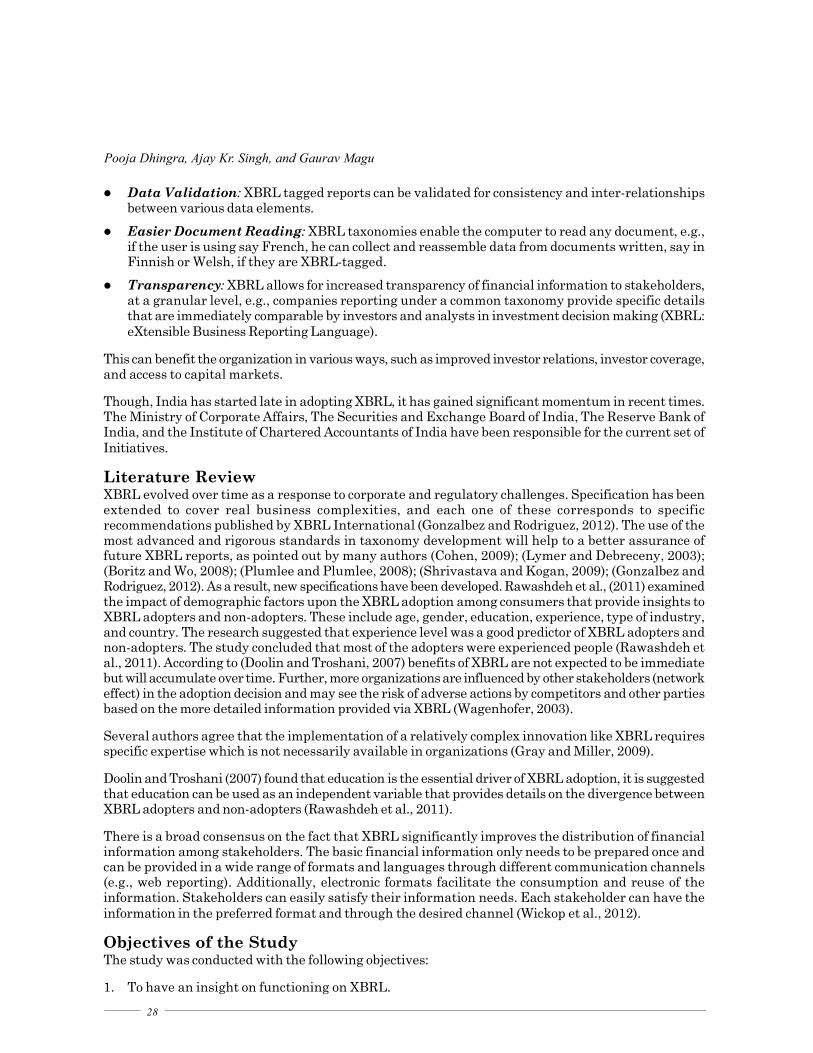
Table 5: Reliability Statistics
Cronbach’s Alpha No. of Items
0.738 22
Next, the appropriateness of factor analysis is examined in terms of presence of significant correlationsamong variables. For this, the Bartlett test of spherecity and Kaiser-Meyer-Olkin measure of samplingadequacy is used. The overall KMO is found to be 0.769 (greater than required 0.50) depicting that thefactor analysis is feasible on the basis of sampling adequacy. The Bartlett’s test is found to be highlysignificant as shown in Table 6.
Table 6: KMO and Bartlett’s Test
Kaiser-Meyer-Olkin Measure of Sampling Adequacy. 0.769
Bartlett’s Test of Sphericity Approx. Chi-Square 1106.294
Df 105
Sig. 0.000
Table 7: Awareness of XBRL
S. No. Items Factor Landings
1. My awareness about XBRL (eXtensible Business Reporting -0.441Language) is reasonably high.
2. As compared to traditional, paper-based disclosures,IFR (Internet Financial Reporting) allows companies todisseminate information to a broader audience on a timelierbasis. 0.604
3. With XBRL, all financial data are represented using elements(or tags) so that stakeholders can easily find the tagged data,extract or transform the data, and analyze the data withanalytical applications. 0.577
Table 8: Benefits of using XBRL
S. No. Items Factor Landings
1. Accelerates and facilitate the comparison of financial 0.628reports.
2. Save time when searching for financial information. 0.739
3. XBRL strengthens the value of information to be more 0.714credible.
4. Enables the company to produce reports that containfinancial and non-financial information. 0.702
5. Contribute to avoid errors in transcribing the data. 0.658

32
Pooja Dhingra, Ajay Kr. Singh, and Gaurav Magu
Table 9: Obstacles in adoption of XBRL
S. No. Items Factor Landings
1. Lack of experts in the field reduces the chances of imple-mentation and application of XBRL in companies. 0.701
2. Diversity and multiplicity of elements and components ofXBRL, makes it difficult to enforce. 0.834
3. The need for time and effort to learn the language of XBRL. 0.741
Hypothesis 1
To test the H01 (“H01”- AWXBRL, BENXBRL, and OBXBRL do not significantly vary among thegroups made on the basis of demographic variable of experience of the respondents), test of Normalityof AWXBRL,BXBRL, and OBXBRL was carried out and as per Kolmogorov Smrinovand Shapiro-Wilk Test data was not Normal. Therefore, rather than applying ‘ANOVA; Non Parametric Test,Kruskal Wallis was used.
The Kruskal-Wallis test is the nonparametric test equivalent to the one-way ANOVA, and an extensionof the Mann-Whitney U test to allow the comparison of more than two independent groups. Using theKruskal-WallisTest, we can decide whether the population distributions are identical.
Table 10: Hypothesis Test Summary
Null Hypothesis Test Sig. Decision
1. H01:AWXBRL do not Independent-Samples 0.043 Reject the null hypothesis.significantly vary among Kruskal-Wallis Testthe groups made on thebasis of experience of therespondents.
2. H02: BENXBRL do not Independent-Samples 0.164 Retain the null hypothesis.significantly vary among Kruskal-Wallis Testthe groups made on thebasis of experience of therespondents.
3. H03: OBXBRL do not Independent-Samples 0.014 Reject the null hypothesis.significantly vary among Kruskal-Wallis Testthe groups made on thebasis of experience of therespondents.
Asymptotic significances are displayed. The significance level is 0.05.
Table 10, shows that there is significant difference between the various experience categories ofrespondents in terms of Awareness of XBRL and Obstacles of XBRL, but no significant difference wasfound among these groups in terms of Benefits of XBRL.
Figure 2, shows the distribution of respondents in terms of Awareness on XBRL.

33
Delhi Business Review Vol. 15, No. 1 (January - June 2014)
Figure 3
Source: Primary Data.
Figure 2
Source: Primary Data.
To see which two categories of respondents significantly vary from each other, further pairwisecomparison was done using Post hoc Analysis as is shown in Figure 3.
Pairwise comparison signifies that there is significant difference in the level of awareness betweencategories of experience More than 16 years and less than 5 years.
Total N 185
Test Statistic 8.144
Degress of Freedom 3
Asymptotic Sig. (2-sided test) 0.043
1. The test statistic is adjusted for ties.
Sample 1 – Sample 2 Test Std. Std. Test Sig. Adj. Sig.Statistic Error Statistic
More than 16 years – 11-16 years 6.212 16.444 0.378 0.706 1.000
More than 16 years – 5-10 years 16.221 11.154 1.454 0.146 0.875
More than 16 years – less than 5 years 26.854 9.805 2.739 0.006 0.037
11-16 years – 5-10 years 10.009 16.267 0.615 0.538 1.000
11-16 years – less than 5 years 20.642 15.373 1.343 0.179 1.000
5-10 years – less than 5 years 10.633 9.505 1.119 0.263 1.000
Each row tests the null hypothesis that the Sample 1 and Sample 2 distributions are the same.
Asymptotic significance (2-sided tests) are displayed. The significance lelve is 0.05.
Pairwise Comparisons of Experience
Inependent-Samples Kruskal-Wallis Test

34
Pooja Dhingra, Ajay Kr. Singh, and Gaurav Magu
Figure 5
Source: Primary Data.
Figure 4, given below shows the distribution of responses on the perceived benefits of XBRL. No significantvariation was reported, so we retain the null hypothesis.
Figure 4
Source: Primary Data.
To check if there is significant variation in different categories of respondents on the basis of years ofexperience in terms of perceived Obstacles in adoption of XBRL, we proceeded with the Kruskal Wallisand found the following distribution in Figure 5.
The significant difference was found in at least one of the categories of respondents. To check whichgroup differ, pairwise comparison was done using Post hoc Analysis which is shown in the followingFigure 6.
Total N 185
Test Statistic 5.110
Degress of Freedom 3
Asymptotic Sig. (2-sided test) 0.164
1. The test statistic is adjusted for ties.2. Multiple comparisons are not performed because the overall test does not show
significant differences across samples.
Inependent-Samples Kruskal-Wallis Test
Total N 185
Test Statistic 10.626
Degress of Freedom 3
Asymptotic Sig. (2-sided test) 0.014
1. The test statistic is adjusted for ties.
Inependent-Samples Kruskal-Wallis Test

35
Delhi Business Review Vol. 15, No. 1 (January - June 2014)
Figure 6 shows that groups more than 16 years and less than 5 years differ in their perception on theperceived obstacles of XBRL, so we reject the null hypothesis.
Hypothesis 2
To test the H02 (“H02”- AWXBRL, BENXBRL, and OBXBRL do not significantly vary among thegroups made on the basis of demographic variable of occupation of the respondents), Kruskal Wallistest was applied, and the following results were drawn.
Table 11: Hypothesis Test Summary
Null Hypothesis Test Sig. Decision
1. H04: AWXBRL do not Independent-Samples 0.007 Reject the null hypothesis.significantly vary among Kruskal-Wallis Testthe groups made on thebasis of occupation of therespondents.
2. H05: BENXBRL do not Independent-Samples 0.505 Retain the null hypothesis.significantly vary among Kruskal-Wallis Testthe groups made on thebasis of occupation of therespondents.
3. H06: OBXBRL do not Independent-Samples 0.023 Reject the null hypothesis.significantly vary among Kruskal-Wallis Testthe group made on thebasis of occupation of therespondents.
Asymptotic significances are displayed. The significance level is 0.05.
Figure 6
Source: Primary Data.
Sample 1 – Sample 2 Test Std. Std. Test Sig. Adj. Sig.Statistic Error Statistic
More than 16 years – 5-10 years 17.721 10.916 1.623 0.104 0.627
More than 16 years – less than 5 years 27.157 9.595 2.830 0.005 0.028
More than 16 years – 11-16 years 41.712 16.093 2.592 0.010 0.057
5-10 years – Less than 5 years 9.435 9.302 1.014 0.310 1.000
5-10 years – 11-16 years -23.991 15.920 -1.507 0.132 0.791
Less than 5 years – 11-16 years -14.555 15.045 -0.967 0.333 1.000
Each row tests the null hypothesis that the Sample 1 and Sample 2 distributions are the same.
Asymptotic significance (2-sided tests) are displayed. The significance lelve is 0.05.
Pairwise Comparisons of Experience

36
Pooja Dhingra, Ajay Kr. Singh, and Gaurav Magu
Table 11 shows that there is significant difference between the various Occupation categories ofrespondents in terms of Awareness of XBRL and Obstacles of XBRL, but no significant difference wasfound among these groups in terms of Benefits of XBRL.
Figure 7 shows the distribution of respondents in terms of Awareness on XBRL.
Figure 7
Source: Primary Data.
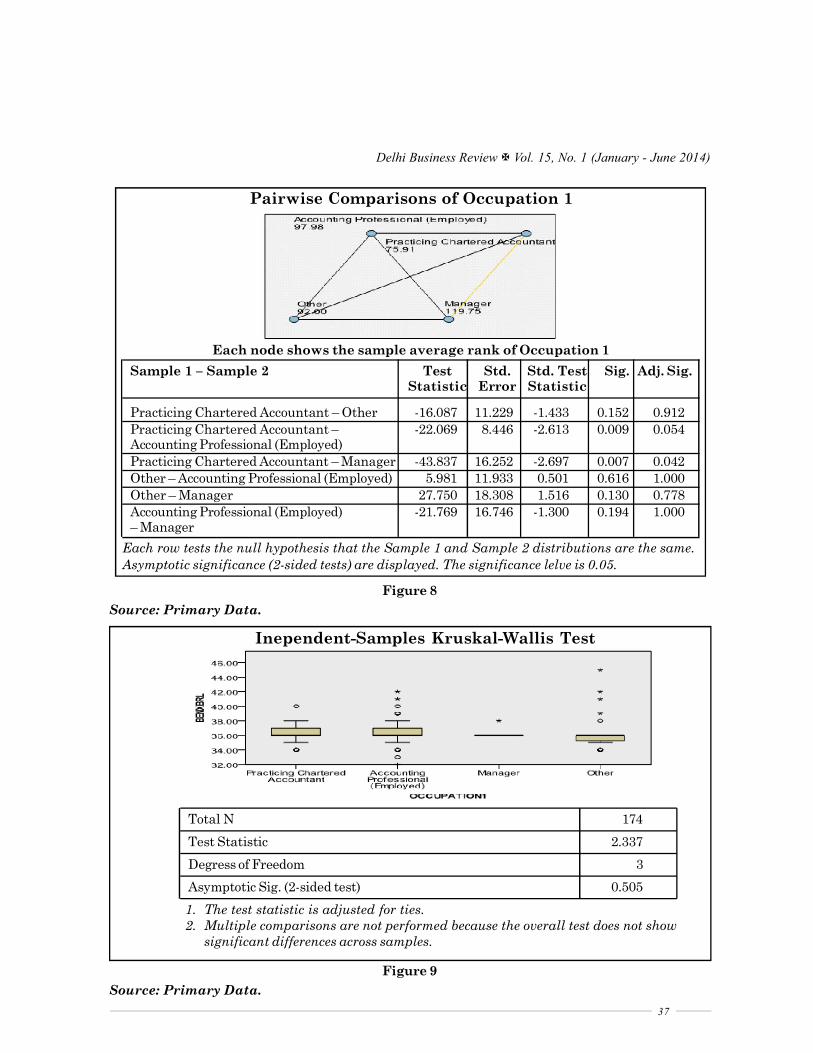
To see which two categories of respondents significantly vary from each other, further pairwisecomparison was done using Post hoc Analysis as is shown in Figure 8.
Pairwise comparison signifies that there is significant difference in the level of awareness betweencategories of Practicing Chartered Accountants and Manager.
Figure 9 shows the distribution of responses on the perceived benefits of XBRL. No significant variationwas reported, so we retain the null hypothesis.
To check if there is significant variation in different categories of respondents on basis of the Occupationin terms of perceived Obstacles in adoption of XBRL, we proceeded with the Kruskal Wallis Test andfound the following distribution in Figure 10.
The significant difference was found in at least one of the categories of respondents. To check whichgroup differ, pairwise comparison was done using Post hoc Analysis which is shown in the Figure 11.
Figure 11 show that groups Practicing Chartered Accountants and Managers, and Practicing CharteredAccountants and Other differ in their perception on the perceived obstacles of XBRL, so we reject thenull hypothesis.
ConclusionThe Integrated Reporting Framework makes overt mention to XBRL as a “standardized technologyplatform that may be used for Integrated Reporting”. It goes on to say that “XBRL improves the wayinformation is created, processed, distributed, and analyzed by providing standardized definitions, labels,calculations, references and contexts applicable to individual numbers and narrative text”. The very
Total N 174
Test Statistic 11.989
Degress of Freedom 3
Asymptotic Sig. (2-sided test) 0.007
1. The test statistic is adjusted for ties.
Inependent-Samples Kruskal-Wallis Test
37
Delhi Business Review Vol. 15, No. 1 (January - June 2014)
Figure 8
Source: Primary Data.
Figure 9
Source: Primary Data.
Inependent-Samples Kruskal-Wallis Test
Total N 174
Test Statistic 2.337
Degress of Freedom 3
Asymptotic Sig. (2-sided test) 0.505
1. The test statistic is adjusted for ties.2. Multiple comparisons are not performed because the overall test does not show
significant differences across samples.
Each node shows the sample average rank of Occupation 1
Sample 1 – Sample 2 Test Std. Std. Test Sig. Adj. Sig.Statistic Error Statistic
Practicing Chartered Accountant – Other -16.087 11.229 -1.433 0.152 0.912
Practicing Chartered Accountant – -22.069 8.446 -2.613 0.009 0.054Accounting Professional (Employed)
Practicing Chartered Accountant – Manager -43.837 16.252 -2.697 0.007 0.042
Other – Accounting Professional (Employed) 5.981 11.933 0.501 0.616 1.000
Other – Manager 27.750 18.308 1.516 0.130 0.778
Accounting Professional (Employed) -21.769 16.746 -1.300 0.194 1.000– Manager
Each row tests the null hypothesis that the Sample 1 and Sample 2 distributions are the same.
Asymptotic significance (2-sided tests) are displayed. The significance lelve is 0.05.
Pairwise Comparisons of Occupation 1

38
Pooja Dhingra, Ajay Kr. Singh, and Gaurav Magu
Figure 11
Source: Primary Data.
Figure 10
Source: Primary Data.
same benefits XBRL provides to financial data are possible for non financial data; it is, therefore, alogical choice for integrated reports.
Total N 174
Test Statistic 9.543
Degress of Freedom 3
Asymptotic Sig. (2-sided test) 0.023
1. The test statistic is adjusted for ties.
Inependent-Samples Kruskal-Wallis Test
Each node shows the sample average rank of Occupation 1
Sample 1 – Sample 2 Test Std. Std. Test Sig. Adj. Sig.Statistic Error Statistic
Practicing Chartered Accountant – -11.104 8.245 -1.347 0.178 1.000Accounting Professional (Employed)
Practicing Chartered Accountant – Other -23.653 10.962 -2.158 0.031 0.186
Practicing Chartered Accountant – Manager -39.265 15.865 -2.475 0.013 0.080
Accounting Professional (Employed) – Other -12.549 11.649 -1.077 0.281 1.000
Accounting Professional (Employed) -28.161 16.348 -1.723 0.085 0.510– Manager
Other – Manager 15.612 17.873 0.874 0.382 1.000
Each row tests the null hypothesis that the Sample 1 and Sample 2 distributions are the same.
Asymptotic significance (2-sided tests) are displayed. The significance lelve is 0.05.
Pairwise Comparisons of Occupation 1

39
Delhi Business Review Vol. 15, No. 1 (January - June 2014)
In India, vide general circular no.: 16/2012 dated 6th July 2012, Ministry of Corporate Affairs (MCA)has mandated that companies (except banking companies, Power companies, Non-Banking FinancialCompanies (NBFC) and Insurance companies) falling in the following categories will have to file theirBalance Sheet and Profit & Loss Account using the Extensible Business Reporting Language (XBRL)taxonomy for financial year commencing on or after 01.04.2011:
1. All companies listed with any Stock Exchange(s) in India and their Indian subsidiaries; or
2. All companies having paid up capital of Rupees five crore and above; or
3. All companies having turnover of Rupees one hundred crore and above; or
4. All companies who were required to file their financial statements for FY 2010-11, using XBRL.
For this, new Form 23AC-XBRL (For Balance Sheet) and 23ACA-XBRL (For Profit & Loss Account)have been made available on the MCA portal (Ministry of Corporate Affairs, Government of India).Through this paper, the authors have found out the Level of Awareness and our preparedness for thesame. It has been found that the Knowledge of XBRL is more in the new generation of CharteredAccountants, the reason for this may be that they are more updated with the recent developments orthey are more exposed to the seminars, etc., conducted by ICAI for dissemination of knowledge on thesame. It is time for the Indian universities to keep pace with developments taking place in the field ofAccounting and Reporting in India and rest of the World and to make inclusion of XBRL and Non-financial reporting in its curriculum.
ReferencesBergeron, B.P. (2003), Essentials of XBRL: Financial Reporting in 21st Century, Hoboken, New Jersey: John Wiley & SonsInc.
Boritz, J. and Wo, W. (2008), The SEC’s XBRL Voluntary Filing Program on EDGAR: A Case For Quality Assurance,Current Issues in Auditing, Vol. 2, No. 2, pp.A36-A50.
Cohen, E.E. (2009), XBRL’s Global Ledger Framework: Exploring the Standardised Missing Link to ERP Integration,International Journal of Disclosure and Governance, Vol. 6, No. 3, pp.188-206.
Deloitte (2011), XBRL: The New World of Reporting, Accessed on July 29, 2013, http://www.deloitte.com/assets/Dcom-India/Local%20Assets/Documents/XBRL_-_The_new_world_of_reporting.pdf.
Doolin, B. and Troshani, I. (2007), Organizational Adoption of XBRL, Electronic Markets, Vol. 17, No. 3, pp.199-209.
Essential Features of XBRL Reporting Software - Deloitte, Accessed on July 29, 2013, http://www.deloitte.com/assets/Dcom-India/Local%20Assets/Documents/XBRL_-_Essential_features.pdf.
Essentials of XBRL: Financial Reporting in the 21st Century, Accessed on July 29, 2013, http://books.google.co.in/books?id=a1NRYltkRIQC&pg=PA10&lpg=PA10&dq= Reporting+systems+that+communicate+with+each+other+through+a+common+XML+based+standard,+such+as+XBRL,+are+much+less+complex+than+those+communicating+through+multiple,+dedicated+interfaces&source=bl&ots=_TPjop9KTL&sig=qfbMdUNZFj_SQKBo19FaeurCgkQ&hl=en&sa=X&ei=qn2AU5bvH8vfoAS-h4LoCg&redir_esc=y#v= onepage&q=Reporting%20systems%20that%20communicate%20with%20each%20other%20through%20a%20common%20XML%20based%20standard%2C%20such%20as%20XBRL%2C%20are%20much%20less%20complex%20than%20those%20communicating%20through%20multiple%2C%20dedicated%20interfaces&f=false.
Gonzalbez, J.M. and Rodriguez, M.M. (2012), XBRL and Integrated Reporting: The Spanish Accounting AssociationTaxonomy Approach, The International Journal of Digital Accounting Research, Vol. 12, pp.59-91.
Gray, G. L. and Miller, D.W. (2009), XBRL: Solving Real-world Problems, International Journal of Disclosure & Governance,Vol. 6, No. 3, pp.207-223.
Hair, J.B. (2010), Multivariate Data Analysis (7th ed.), NJ, USA: Prentice Hall.
KPMG (2008), A Primer on XBRL, The Extensible Business Reporting Language, Accessed on July 29, 2013, https://www.kpmg.com/Global/en/topics/XBRL/Documents/19303-nss-xbrl-factsheet.pdf.
Lymer, A. and Debreceny, R. (2003), The Auditor and Corporate Reporting on the Internet: Challenges and InstitionalResponses, International Journal of Auditing, Vol. 7, pp.103-120.

40
Pooja Dhingra, Ajay Kr. Singh, and Gaurav Magu
Ministry of Corporate Affairs, Government of India, www.mca.gov.in. (n.d.), Accessed on January 22, 2014, http://www.mca.gov.in/MinistryV2/xbrl_faq1.html.
Monterio, B.J. (2013), Integrated Reporting and the Potential Role of XBRL, Strategic Finance Magazine, June 2013.
Nunnally, J. and Berstein, I. (1994), Psychometric Theory, McGraw-Hill Series in Psychology (3rd Edition), New York:McGraw-Hil, Inc.
Plumlee, R. and Plumlee, M. (2008), Assurance on XBRL for Financial Reporting, Accounting Horizons, Vol. 22, No. 3,pp.353-368.
Rawashdeh, A.A., Selamat, M.H., and Abdullah, M.S. (2011, July), Charateristics of Consumers Influencing AdoptionBehavior of XBRL, World Review of Business Research, Vol. 1, No. 3, pp.139-154.
Shrivastava, R. and Kogan, A. (2009), Assurance on XBRL Instance Document: A Conceptual Framework of Assertions,www.ssrn.com: http://ssrn.com/abstract=1289467.
Wagenhofer, A. (2003), Economic Consequences of Internet Finanacial Reporting, Schmalenbach Business Review, Vol. 55,pp.262-279.
Wickop, N.M., Schultz, M., and Nuttgens, M. (2012), XBRL: Impacts, Issues and Future Research Directions.
XBRL: eXtensible Business Reporting Language, www.xbrl.org. (n.d.), Accessed on January 14, 2014, http://www.xbrl.org/how-xbrl-works-1.


![An insight into XBRL [eXtensible Business Reporting Language]](https://img.dokumen.tips/doc/110x75/61fc9b5a9d50e757a521962c/an-insight-into-xbrl-extensible-business-reporting-language.jpg)


