Embed Size (px)
Citation preview

© Orica Limited Group
Economic and Commodity Market Outlook
David Thurtell, Market Intelligence Lead, (AusPac & Asia), Orica January 2014

• Reliable leading indicators suggest that there will be a further pick up in the world economy in H1 2014, which
should boost the demand for resource commodities. The recovery should continue in H2 2014 and 2015.
• Recent major policy changes by Beijing should underpin economic growth and the demand for resources in
the medium/long term. However, Beijing is now responding to widespread dissent about air pollution by
moving away from burning low value coal (and low grade Iron Ore). This should benefit Australian producers,
but hurt some Indonesian, American and Vietnamese producers. Chinese coal producers are under pressure
on a number of fronts; they will likely cede more market share to overseas producers.
• The Thermal Coal price is recovering, thanks to both an improving world economy and seasonal influences
(the Northern Hemisphere winter). Supply growth will largely offset any pick-up in demand in 2014, so
margins for Thermal Coal producers will remain low/poor.
• The Coking Coal price is only US$3-4/t above the cycle lows, and margins are very low. Plentiful stocks in
China are offsetting the impact of stronger-than-expected demand by steelmakers in major consuming
nations (such as China). An improving world economy will add to the impact of supply cuts in North America
and China, but the price should remain sub US$160/t, maintaining pressure on producer margins.
• Gold has suffered from a surge of investor liquidation and heightened import restrictions by India. Further falls
could easily occur, but cost support and strong Chinese demand should kick in at the $1,000-1,100/oz mark.
• Base metals should be firm. Copper should hold at around $7,000/t, as stronger world economic growth and
a scrap shortage offset the impact of rising mine supply. Margins will therefore remain healthy in 2014. Lead
and zinc will benefit from the stronger world outlook and a looming shortage of supply, with rising margins.
Overview
2

World: Key Leading Economic Indicators
Implications
• An improving world economy will boost commodity demand and prices in the next few months,
providing some stability for customers as they work to stabilize their cost base.
• World steel demand should pick up further, helping Iron Ore and Coking Coal prices.
• Energy demand should lift in the OECD, removing some of the slack in the Thermal Coal market.
The world economy continues its recovery
• The World Purchasing Managers’ Index rose to a 2-1/2-year high in November. This suggests a (further)
significant pick-up in global industrial output growth in the coming few months.
-15
-10
-5
0
5
10
15
32
37
42
47
52
57
62
Mar-04 Mar-06 Mar-08 Mar-10 Mar-12
WORLD IND. PRODUCTION VS WORLD PMIIndex
World PMI (lhs)
World IP lagged two
months (rhs)
annual% ch.
-18
-12
-6
0
6
12
20
30
40
50
60
70
Jul-77 Jul-81 Jul-85 Jul-89 Jul-93 Jul-97 Jul-01 Jul-05 Jul-09 Jul-13
OECD IND. PRODUCTION VS US ISM NEW ORDERSIndex
US ISM New Orders
(lhs)
OECD IP,
lagged 6 months (rhs)
annual
% ch.

US: Key Economic Indicators
The U.S. Fed is now winding back its bond buying
• The U.S. Federal Reserve is moving gently towards providing less monetary stimulus without causing a large
rise in long term U.S. bond yields: the housing and auto sectors are sensitive to interest rate moves.
• Unemployment continues to decline in the U.S., falling to 7.0% in November. Jobless Claims data point to
further falls in the U.S. unemployment rate in the coming months/quarters.
1
3
5
7
9
11
13
150
240
330
420
510
600
690
Feb-70 Feb-76 Feb-82 Feb-88 Feb-94 Feb-00 Feb-06 Feb-12
Initial Jobless
Claims, lagged 8 months (rhs)
US unemployment
rate (rhs)
U.S. UNEMPLOYMENT RATEVS INITIAL JOBLESS CLAIMS ('000s) %
400
800
1200
1600
2000
2400
400
800
1200
1600
2000
2400
Sep-02 Sep-04 Sep-06 Sep-08 Sep-10 Sep-12 Sep-14
US HOUSING INDICATORS'000s, annualised
Housing
Starts
Building
Permits
Source: Bloomberg

US : Key Economic Indicators
Manufacturing improving
• The U.S. Manufacturing New Orders series hit a 4-year high in December. Suggests a rise in Chinese exports.
• The average age of consumer durable goods – long-lasting items such as furniture, appliances and computers
– is the highest since 1962. Sets the stage for a rebound in consumer spending.
• Motor vehicle sales hit a six-year high in November. Strong auto sales are a very positive sign, since
households have lacked the confidence to make big-ticket purchase decisions for many years.
Implications
U.S. data points to firm growth in 2014, providing a good locomotive for the rest of the world.
6
8
10
12
14
16
18
20
22
6
8
10
12
14
16
18
20
22
Jan-94 Jan-97 Jan-00 Jan-03 Jan-06 Jan-09 Jan-12
US VEHICLE SALES INDICATORSmn, saar
Domestic
Manufactured
Total Sales
Source: Bloomberg
mn, saar
25
35
45
55
65
75
-40
-20
0
20
40
60
Feb-93 Feb-96 Feb-99 Feb-02 Feb-05 Feb-08 Feb-11
CHINESE EXPORT GROWTHVS US ISM NEW ORDERS
Indexannual% change
Source:BloombergChinese export growth,
lagged 3 months (lhs)
US ISM New
Orders (rhs)
Asia
CrisisEurozone
Crisis
Global Financial
Crisis

China: Power Indicators
Growth in power output has accelerated
• Industrial output is highly correlated to power output. Both have seen an acceleration in recent months.
• With hydro generation now experiencing a seasonal decline, Thermal Coal-fired power generation is bearing
more of the load.
0
7
14
21
28
-10
0
10
20
30
Jul-99 Jul-01 Jul-03 Jul-05 Jul-07 Jul-09 Jul-11 Jul-13
annual% change
annual% change
CHINESE ELECTRICITY &INDUSTRIAL OUTPUT
Industrial Production
smoothed (rhs)
Electricity
Output (lhs)
0
50
100
150
200
250
300
350
400
450
500
Jan-00 Jan-02 Jan-04 Jan-06 Jan-08 Jan-10 Jan-12
Thermal
Other (renewable etc)
Nuclear
Hydro
CHINESE POWER OUTPUT BY TYPE('bn KWh)
GFC
Eurozone Sovereign
Debt crisis
Source: Bloomberg
LATEST OBSERVATION: OCTOBER 2013
Implications
A mix of cyclical and seasonal influences have lifted Chinese Thermal Coal demand in recent months.

China: Key Economic Indicators
0
2
4
6
8
10
12
14
0
2
4
6
8
10
12
14
Mar-94 Mar-98 Mar-02 Mar-06 Mar-10 Mar-14
CHINESE GDP GROWTH annual% change
annual% change
Source: Bloomberg
Y/Y measure
new Q/Q
measure
China: settling for 7-8% rather than 10-11%
• China is growing at ~7.5-8.0%. Leading indicators suggest that this should be maintained as 2014 begins.
• Vehicle sales in November were the 2nd highest on record, putting annual growth at 16%.
• China’s new leadership’s has resolve to provide less State support to SOEs, increase their exposure to
competition and make them pay higher dividends. Increased dividends are aimed at raising social welfare
programmes and thus encouraging private consumption.
Implications
China’s growth has rebounded from its mid-term pause, but is settling in a lower band than averaged
over much of the past decade. Beijing is reforming to try to change the sources of economic growth.
-40
0
40
80
120
160
200
240
0
250
500
750
1000
1250
1500
1750
Jan-06 Jan-07 Jan-08 Jan-09 Jan-10 Jan-11 Jan-12 Jan-13 Jan-14
CHINESE CAR SALES('000s)
Source: Bloomberg
annual %
change
level (lhs)
growth (rhs)

• Since April, there have been large falls in commodity currencies against the US$ (and hence the Yuan). The
falls relate to the prospective end of easy U.S. money and the new (lower) normal level of growth in China.
• The move in the Indonesian Rupiah over the past 8 years had already enabled Indonesia to open up a
significant gap on Australia in the seaborne Thermal Coal market. The South African Rand is now around 6%
below its GFC low, whereas the AUD is some 40% higher than its GFC low.
Currency moves of commodity-producing and consuming nations
8
Implications
Falls have restored profitability of miners in some nations, but relative competitiveness has also been
altered. Chinese miners are being crushed by the strength of the Yuan.
0
20
40
60
80
100
120
140
160
180
200
Jan-05 Jan-07 Jan-09 Jan-11 Jan-13 Jan-15
AustralianDollar
Brazilian Real
South AfricanRand
Chilean Peso
Colombian Peso
IndonesianRupiah
Indian Rupee
Chinese Yuan
EXCHANGE RATE VS USDJan 2005 = 100
Canadian Dollar
Sources: Bloomberg, Orica
Russian Ruble
U.S. Fed says it's examining ending Q.E
32
-6 -6-7 -7 -8
-13 -14-15
-20 -20
-26
-6
6
-9
-2
-20
-13
-37
-17-19
-40
-61
-55
-44
-70
-60
-50
-40
-30
-20
-10
0
10
EU
RO
Ch
inese
Yuan
Co
lom
bia
n P
eso
Peru
via
n S
ol
Russia
n R
uble
Can
ad
ian D
olla
r
Yen
Ch
ilean P
eso
Austra
lian D
olla
r
Ind
ian R
up
ee
So
uth
Afric
an R
an
d
Bra
zilian
Real
Ind
onesia
n R
up
iah
since April 2013
since July 2011
EXCHANGE RATE CHANGES VS USD%
Sources: Bloomberg, Orica

40
50
60
70
80
90
100
110
120
Jan-13 Mar-13 May-13 Jul-13 Sep-13 Nov-13 Jan-14
actual price
FX-adjusted
INDONESIAN SUB-BIT COALUS$/t, FOB, Indonesia
40
50
60
70
80
90
100
110
120
Jan-13 Mar-13 May-13 Jul-13 Sep-13 Nov-13 Jan-14
actual price
FX-adjusted
AUSTRALIAN THERMAL COALUS$/t, FOB, Newcastle
Little wonder that supply is firm despite low US$ prices…
• Adjusting coal prices for the foreign currency moves of the past 7-8 months, Australian, Indonesian and South
African producers are now enjoying local currency returns that are higher than before the depreciation of
commodity currencies.
• Australian miners are maintaining production under ‘take-or-pay’ arrangements, and/or raising output to lower
unit costs.
• Indonesian producers have cut their stripping ratios.
Exchange rate-adjusted Thermal Coal prices
9
40
50
60
70
80
90
100
110
120
Jan-13 Mar-13 May-13 Jul-13 Sep-13 Nov-13 Jan-14
actual price
FX-adjusted
SOUTH AFRICAN THERMAL COALUS$/t, FOB, Richards Bay

• Of the major producers, China is the highest cost. At current prices, margins are very low in most countries.
• China became a net importer of Thermal Coal in 2009, as a result of both the changes to coal export tax
arrangements and a growing requirement for power generation, cement and fertilizer manufacture.
• Indonesia and Australia now account for 2/3 of Chinese Thermal Coal imports.
Thermal Coal producers
10

US Coal Production Update
(000's Short Tons)
2012
(act)
2013
(est)
YoY
Change
2014
(est)
2015
(est)
Appalachia Basin 291.3 276.3 -5.2% 279.8 269.8
Illinois Basin 179.0 183.3 2.4% 208.3 208.3
Western Total 539.3 527.9 -2.1% 551.9 536.9
(Wyoming - Powder River
Basin) 398.4 384.1 -3.6%
Total United States 1,009.6 987.4 -2.2% 1,040.0 1,015.0
Source: Preliminary estimates by EIA (Energy Information Administration) as of 1/7/14
US Coal producers face challenges
• US Coal market outlook shows slight
potential growth in 2014 with levels
falling back in 2015.
• Growth continues to differ by various
regions.
• Low natural gas prices and high supply
levels will continue to pressure coal
electricity generation supply into far
future.
• Export markets continue to be a
challenge, based on US regulation and
export port capacities.

Asian Thermal Coal Indicators
Chinese Thermal Coal stocks have started to rise
• Chinese Thermal Coal Imports have settled at around 15-16mt; we suspect that imports will rise in December
and January, as thermal coal power utilities consume large amounts of coal for winter heating.
• Chinese Port Stocks of Thermal Coal fell sharply in H2 2013 to 20m tonnes, but have since started to rise.
• Chinese Thermal Coal demand is likely to remain firm as winter peaks and the supply chain tightens.
• The worst of India’s growth slowdown appears to have passed. Indian coal stocks are very low, after Coal
India missed its production target by 15mt in the April-November period. Imports are almost certain to rise,
despite a very sharp fall in the Rupee in recent months.
0
500
1000
1500
2000
2500
3000
3500
Mar-10 Mar-11 Mar-12 Mar-13
CHINESE PORT STOCKSOF THERMAL COAL('000 tonnes)
Source: Bloomberg
0
3,000
6,000
9,000
12,000
15,000
18,000
21,000
Jan-05 Jan-07 Jan-09 Jan-11 Jan-13
Others
North Korea
Vietnam
Russia
Australia
Indonesia
CHINESE THERMAL COAL IMPORTS('000 tonnes)
Source: Bloomberg

Asian Thermal Coal Influences
Japanese Thermal Coal imports have been strong since Fukushima
• Japan is struggling to cope with the loss of nuclear power from the country’s electricity grid.
• Australia Thermal Coal suppliers have been the main beneficiary of the Fukushima accident.
• Indonesian exports declined sharply in 2013, from record levels.
• South Korea recently announced a flat tax (of US$20/t, and rising to US$30/t) on Thermal Coal imports
starting next July. This will hurt Thermal Coal consumption, but also induce the burning of higher value coal.
0
1,000
2,000
3,000
4,000
5,000
6,000
7,000
8,000
9,000
10,000
11,000
12,000
Jan-05 Jan-07 Jan-09 Jan-11 Jan-13
Indonesia Russia Australia USA Canada
JAPANESE THERMAL COAL IMPORTS('000 tonnes)
Source: Bloomberg
0
5,000
10,000
15,000
20,000
25,000
30,000
0
5,000
10,000
15,000
20,000
25,000
30,000
Jan-05 Jan-07 Jan-09 Jan-11 Jan-13
THERMAL COAL EXPORTS('000 tonnes) ('000 tonnes)
Indonesia
Australia
Source: Bloomberg, GTIS
South Africa
United States
Vietnam

Outlook
It appears that the Northern Hemisphere winter and improving world economic activity is more than
offsetting the impact on prices of firm supply growth. From here, supply growth will slow and demand
will rise, helping prices. But the sub-US$95/t price likely for many months will keep margins tight.
Thermal Coal prices are recovering slowly
• Thermal Coal prices have risen steadily since the end of August, but at ~US$84/t, Newcastle TC is still close
to cost of production for many producers. In recent weeks, signs of an improving world economy and buying
for peak (Northern Hemisphere) winter season, have more than offset the impact on price of strong supply.
• Indonesian Sub-bit prices have finally pushed back over the US$60/t mark, as seasonal demand peaks.
Thermal Coal Prices
$0
$30
$60
$90
$120
$150
$180
$210
$0
$30
$60
$90
$120
$150
$180
$210
04-Jan-08 04-Jan-09 04-Jan-10 04-Jan-11 04-Jan-12 04-Jan-13 04-Jan-14
Average Weekly Thermal Coal Index
NewcastleThermal Coal Index (A$/t)
Newcastle Thermal Coal Index (US$/t)
Indo Sub-bit marker (US$/t)
Source: Bloomberg, McCloskey
70
80
90
100
110
120
130
140
May-13 Nov-13 May-14 Nov-14 May-15 Nov-15 May-16 Nov-16
NEWCASTLE THERMAL COAL FUTURESUS$/tonne
mid July 2013 low
9 Dec 2013
3 May 2011
Source: Bloomberg
9 January 2014

• In recent months, the differential between China’s benchmark price and Australian and Indonesian benchmarks
returned to levels last seen in 2010.
• The rise in the differential in 2011-12 explains why China’s miners lost significant market share in that period
(see next slide over).
• Australian miners are maintaining output under ‘take-or-pay’ agreements, and/or raising output to cut unit costs.
China’s competitiveness in Thermal Coal production
15
Implications
The outlook is for Australian and Indonesian coal production to continue to grow firmly, helped by the
falling currencies of their countries. China’s miners are being affected by the strength of the Yuan.
-10
10
30
50
70
90
110
130
150
0
20
40
60
80
100
120
140
160
Dec-08 Dec-09 Dec-10 Dec-11 Dec-12 Dec-13
QINHUANGDAO COAL VS NEWCASTLE (spot, FOB)US$/tonne
Qinhuangdao coal price (lhs)
Newcastle coal price (lhs)
Qinhuangdao-Newcastle differential (rhs)
US$/tonne
-20
-10
0
10
20
30
40
50
60
70
80
90
100
110
120
30
40
50
60
70
80
90
100
110
120
130
140
150
160
170
Dec-08 Dec-09 Dec-10 Dec-11 Dec-12 Dec-13
QINHUANGDAO COAL VS INDO SUB-BIT (spot)US$/tonne
Qinhuangdao coal price (lhs)
Indo Sub-Bit coal price (lhs)
Qinhuangdao-Indo Sub-Bit differential (rhs)
US$/tonne

Trends in Chinese coal production
• In trend terms, after a decade of strong growth, Chinese coal output has declined noticeably since 2011. The
noticeable fall in the Thermal Coal price over the past eighteen months explains the decline in Chinese
domestic production. Safety crack-downs in Chinese mines could have also had an impact.
• The recent decline in coal production comes despite a rise in coal-fired power, cement and fertilizer output
over that time. Coal imports have thus filled the gap.
16
Implications
China is likely to import more coal, as cheap imports steal market share from local producers.
0
50
100
150
200
250
300
350
400
0
50
100
150
200
250
300
350
400
Jan-00 Jan-03 Jan-06 Jan-09 Jan-12
CHINESE COAL-FIRED POWER OUTPUT VS COAL PRODUCTION('bn KWh) (mt/month)
Coal production -1month fwd (rhs)
Coal -firedpower output (lhs)
0
50
100
150
200
250
300
350
400
0
50
100
150
200
250
300
350
400
Jan-01 Jan-04 Jan-07 Jan-10 Jan-13
CHINESE COAL PRODUCTION VS THERMAL COAL PRICE('bn KWh) (US$/t)
Coal production (lhs)
China Thermal Coal Price (rhs)

Coking Coal Prices
Coking Coal prices have declined significantly in recent months
• The spot Coking Coal price fell during Q4 2013 and early January 2014, and at US$135/t, has now largely
reversed the gains of the August/September 2013 period. Supply has risen significantly, and anecdotes
suggest that, with comfortable stockpiles and weak demand, Chinese buyers have backed away from buying.
• Reflecting the well supplied nature of the near-term market, the front part of the Chinese futures curve dipped
sharply during November. The whole curve then shifted down noticeably during December/early January.
Outlook
• In H1 2014, North American and Chinese output cuts should combine with stronger world economic
conditions to see the seaborne market tighten modestly.
$0
$50
$100
$150
$200
$250
$300
$350
$0
$50
$100
$150
$200
$250
$300
$350
01-Dec-10 01-Jun-11 01-Dec-11 01-Jun-12 01-Dec-12 01-Jun-13 01-Dec-13
Average Weekly Aus Hard Coking Coal Price
Aus Hard Coking Coal (US$/t)
Aus Hard Coking Coal (A$/t)
Source: McCloskey140
150
160
170
180
190
200
210
220
230
240
Jul-13 Sep-13 Nov-13 Jan-14 Mar-14 May-14 Jul-14 Sep-14 Nov-14
CHINESE COKING COAL FUTURESUS$/tonne
22 March 2013
9 December 2013
9 January 2014
Source: Bloomberg
6 November 2013

Chinese Coking Coal Imports
Chinese Coking Coal imports remain strong, thanks to firm steel production
• Chinese steel production has surprised with its resilience in 2013. Weakening now, partly due to seasonal
influences.
• Chinese steel mills have sought to diversify their suppliers since the Australian floods a few years ago.
• Chinese coking coal imports remain high. Stockpiles are very comfortable, allowing steel mills to take an
opportunistic approach to buying.
0
10
20
30
40
50
60
70
80
Jan Feb Mar Apr May Jun Jul Aug Sep Oct Nov Dec
CHINESE STEEL PRODUCTION mn tonnes
2009
20102011
2012
Source: National Bureau of Statistics
2013
0
1,000
2,000
3,000
4,000
5,000
6,000
7,000
8,000
Jan-05 Jan-07 Jan-09 Jan-11 Jan-13
Canada
Russia
USA
Australia
Others
Mongolia
CHINESE COKING COAL IMPORTS('000 tonnes)
Source: Bloomberg

Australian Coking Coal Exports
Australian Coking Coal exports hitting record levels
• Port data show that Queensland coal exports remained close to record levels in December. On a seasonally-
adjusted basis, it appears that Australian coking coal exports have been very strong since November 2012.
• Floods in late 2010/early 2011 had a major impact on production.
• ‘Take or pay’ contracts for rail and port usage have been influential.
Implications
• Price falls in recent quarters have pushed Australian miners to raise output, in order to cut unit costs .
3
6
9
12
15
18
5
8
11
14
17
20
Jan-05 Jan-06 Jan-07 Jan-08 Jan-09 Jan-10 Jan-11 Jan-12 Jan-13 Jan-14
AUST. COKING EXPORTS VS. QLD COAL EXPORTS
ACR QLD Coal Exports (lhs)
ABS Coking CoalExports (rhs)
mn tonnes mn tonnes
Sources:ABS, ACR
0
2,000
4,000
6,000
8,000
10,000
12,000
14,000
16,000
18,000
Jan-05 Jan-07 Jan-09 Jan-11 Jan-13
Others
India
Japan
South Korea
China
Taiwan
AUSTRALIAN COKING COAL EXPORTS('000 tonnes)
Source: Bloomberg

Coking Coal Exports
Seaborne supply has surged
• Australia dominates seaborne trade. Its exports have surged in recent years. The weaker AUD/USD is now
allowing Australian miners to undercut their competition.
• North American and Chinese producers are under huge pressure, thanks to their appreciating currencies.
• Mozambique?
-15
-10
-5
0
5
10
15
20
-27
-18
-9
0
9
18
27
36
Jan-92 Jan-96 Jan-00 Jan-04 Jan-08 Jan-12
WORLD STEEL PRODUCTION VS WORLD INDUSTRIAL PRODUCTION
Steel output (lhs)
World Industrial Production (rhs)
annual % ch.
annual % ch.
Sources: CPB, Bloomberg

• China is the lowest-cost producer of Coking Coal. Russia and South Africa are close behind.
• American producers are the highest cost, and are likely to be squeezed out by the impact of the falling AUD.
• Russian exports to China filled a gap left when flooding affected Australian Coking Coal production in 2011.
Coking Coal production
21
• At least 80% of the nation’s coal comes from regions where the United Nations says water supplies are
either “stressed” or in “absolute scarcity.”
• China has about 1,730 cubic metres of fresh water per person, close to the 1,700 cubic metre level the UN
deems “stressed.”
• The situation is worse in the north, where half China’s people, most of its coal and only 20% of its water,
are located.
• Shanxi – the nation’s biggest coal base, with about 28% of production – has per-capita water resources of
347 cubic metres, less than the Middle Eastern nation of Oman.
• Inner Mongolia and Shaanxi, which together contribute 40% of coal output, have less than 1,700 cubic
metres per person.
Other issues facing the Chinese coal industry 1. Water
22

• Air pollution in the major cities has become a major source of civil unrest. Environmental reform was included
in the reforms announced as a result of the recent Third Plenum meeting, which highlights the growing
importance of this area. In recent weeks, the State Council has proposed re-ignited talk of a ban on the
burning of low value coal. A draft policy is due soon.
• The Third Plenum communiqué said that the prices of electricity, fuel and other key resources would no longer
be kept artificially low. This suggests a shift away from coal-fired electricity to gas, nuclear and renewables.
• For many years, as people’s incomes and prosperity rose in line with the economy, Beijing could get away
with ignoring the environmental problems caused by lax regulations and a political system based around GDP
growth. Local officials were assessed purely on their GDP numbers. But following a series of scandals –
including the unexplained discovery of thousands of dead pigs and birds floating down one of the country’s
main rivers earlier this year, and a jump in the number of lung cancer victims – the government is now
changing its approach. Local and provincial government officials will now be held to account on environmental
and health targets, as well as targets on economic development.
• As a result of the Third Plenum, efforts to remove inefficient capacity in various industries will be intensified. In
late November 2013, Hebei Province shut down 11mt of steel capacity, with a further 50mt of capacity to be
shut. The government is moving to require the usage of higher quality ores/coal. Pollution controls are likely to
add to the cost of steelmaking over the next couple of years, reducing competitiveness.
• The environmental push may not see reduced coal consumption; growth in coal burn is crucial for economic
growth and alternatives are not of appropriate scale – indeed, increased gas output is more likely to target
refined crude products in industrial demand first. However, there is likely to be a further move to increase coal
production and consumption in Western China – with limited coal consumption growth on the Eastern
seaboard. This could be a problem for an oversupplied global thermal coal market, with the Chinese
contestable portion growing only slowly.
23
Other issues facing the Chinese coal industry 2. Air Pollution

• The Third Plenum communiqué released in mid November 2013 announced that State-Owned Enterprises
(SOEs) will be increasingly subject to market forces, and given reduced support by the Government.
• A system will be introduced to permit SOE bankruptcy so that only the “fittest survive”. The non-state sector
is encouraged to participate in SOE reform by taking equity positions.
• SOEs will be required to pay dividends of 30% of their ‘income’ by 2020, up from 10-15% at present. This
higher dividend requirement will put pressure on State-owned coal miners to cut costs and capital spending.
• China is currently feeling the impact of tighter monetary policy, and a crackdown on bank lending.
• China's State Council recently released new regulations that forbid the construction of coal mines with an
annual production capacity under 300,000 tonnes and gas outburst mines with an annual capacity less than
900,000 tonnes. Coal mines producing fewer than 90,000 tonnes annually will be phased out. The new
policies expect the Ministry of Finance (MoF) and the National Development and Reform Commission
(NDRC) to check on and remove arbitrary charges on coal miners around the country by the end of this
year. The new policies also strengthen the government's support of coal-electricity integration projects.
• In recent days, China’s National Development and Reform Commission (NDRC) and National Energy
Administration have proposed a number of reforms to China’s domestic coal industry. These reforms include
tax cuts to local coal producers, encouraging horizontal and vertical integration of coal producers, tightening
quality regulations and aiding the shutdown of loss-making coal capacity.
24
Other issues facing the Chinese coal industry 3. Lower State support and tighter finance

• The spot Iron Ore price has staged a recovery since June, as the world economy improves and the market
comes to terms with Chinese demand staying stronger than expected.
• However, the very recent (partly seasonal) slowdown in Chinese steel production and a rise in Chinese
Ports inventories of Iron Ore has hurt Iron Ore prices in the past month.
• The backwardation in futures curve has increased since the middle of the 2013, supporting the view that the
market tightened significantly in H2 2013.
Iron Ore prices have recovered...
25
$0
$50
$100
$150
$200
$250
$0
$50
$100
$150
$200
$250
04-Nov-08 04-Nov-09 04-Nov-10 04-Nov-11 04-Nov-12 04-Nov-13
Average Weekly Iron Index
Iron Ore Index (A$/t)
Iron Ore Index (US$/t)
Source: Bloomberg50
60
70
80
90
100
110
120
130
140
150
May-13 May-14 May-15 May-16
SINGAPORE IRON ORE FUTURESUS$/tonne
9 December 2013
28 Aug 2012 (cycle low)
7 Oct 2011
Source: Bloomberg
6 June 2013 (2013 low)
9 January 2014
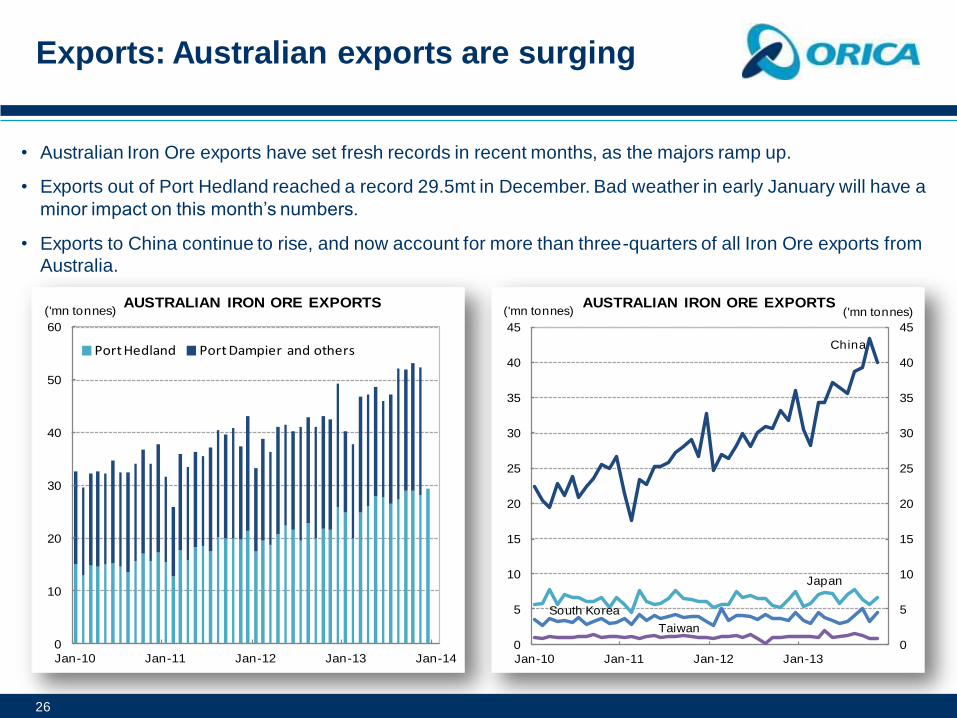
• Australian Iron Ore exports have set fresh records in recent months, as the majors ramp up.
• Exports out of Port Hedland reached a record 29.5mt in December. Bad weather in early January will have a
minor impact on this month’s numbers.
• Exports to China continue to rise, and now account for more than three-quarters of all Iron Ore exports from
Australia.
Exports: Australian exports are surging
26
0
10
20
30
40
50
60
Jan-10 Jan-11 Jan-12 Jan-13 Jan-14
Port Hedland Port Dampier and others
AUSTRALIAN IRON ORE EXPORTS('mn tonnes)
0
5
10
15
20
25
30
35
40
45
0
5
10
15
20
25
30
35
40
45
Jan-10 Jan-11 Jan-12 Jan-13
AUSTRALIAN IRON ORE EXPORTS('mn tonnes) ('mn tonnes)
China
Japan
Taiwan
South Korea

• While Australian Iron Ore exports have set fresh records in recent months, exports from other countries have
been flat in trend terms.
• Indian exports remain heavily constrained. The Indian Iron Ore sector has been in crisis for the past four years
with output falling from a peak of 220mt in 2009 to 138mt in 2012. The long-running clampdown on illegal
mining has persisted this year, and Wood Mackenzie (WM) forecast output at ~125mt in 2013. WM believes
Indian output will bottom out in 2013, as production restrictions are lifted. However, exports should not reach
significant heights: in the medium-to-long term, domestic demand will (more than) absorb domestic output.
• Chinese Iron Ore output has hit record levels in recent months, as the 2013 price recovery encourages output.
Australia is winning market share
27
0
10
20
30
40
50
60
Jan-07 Jan-08 Jan-09 Jan-10 Jan-11 Jan-12 Jan-13 Jan-14
IRON ORE EXPORTS('mn tonnes)
Australia
Brazil
Sources: Bloomberg, Orica, GTIS
Canada
India
South Africa
0
20
40
60
80
100
120
140
0
20
40
60
80
100
120
140
Jan-01 Jan-04 Jan-07 Jan-10 Jan-13
CHINESE IRON ORE &STEEL PRODUCTIONmn tonnes
Steel Production
Chinese Iron Ore production
mn tonnes
Source Bloomberg

• With iron ore spot prices holding above USD130, all major production hubs remain profitable
• Chinese Iron Ore producers dominate the highest quartile of Wood Mackenzie’s cost curve, closely
followed by Canada.
• Note: Wood Mackenzie surveys 61 Chinese mining operations, covering approximately 25% of Chinese
marketable Iron Ore output. Average cash cost across this sample is $107/t, although this is probably
overstates the true cost, given the high proportion of large state-owned mines included in the survey.
Chinese and Canadian producers will eventually be squeezed out
28
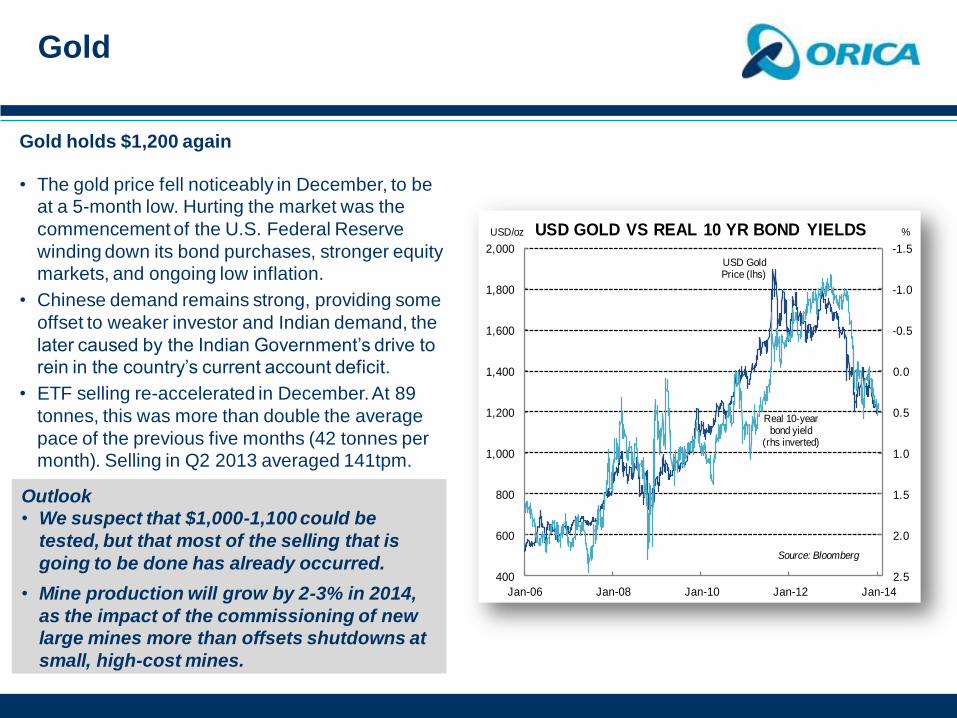
Gold holds $1,200 again
• The gold price fell noticeably in December, to be
at a 5-month low. Hurting the market was the
commencement of the U.S. Federal Reserve
winding down its bond purchases, stronger equity
markets, and ongoing low inflation.
• Chinese demand remains strong, providing some
offset to weaker investor and Indian demand, the
later caused by the Indian Government’s drive to
rein in the country’s current account deficit.
• ETF selling re-accelerated in December. At 89
tonnes, this was more than double the average
pace of the previous five months (42 tonnes per
month). Selling in Q2 2013 averaged 141tpm.
Gold
-1.5
-1.0
-0.5
0.0
0.5
1.0
1.5
2.0
2.5400
600
800
1,000
1,200
1,400
1,600
1,800
2,000
Jan-06 Jan-08 Jan-10 Jan-12 Jan-14
USD GOLD VS REAL 10 YR BOND YIELDSUSD/oz %
Real 10-year bond yield
(rhs inverted)
USD Gold Price (lhs)
Source: Bloomberg
Outlook
• We suspect that $1,000-1,100 could be
tested, but that most of the selling that is
going to be done has already occurred.
• Mine production will grow by 2-3% in 2014,
as the impact of the commissioning of new
large mines more than offsets shutdowns at
small, high-cost mines.

• After the Global Financial Crisis (GFC), gold bar and ETF demand surged, as investors sought safe-havens.
As a result of the GFC, some managers had their mandates changed to only allow physically-backed gold
holdings. This strategy aimed to avoid the counterparty risk associated with futures contracts.
• Since the peak in November 2012, the combined holdings of Comex longs and ETFs has fallen by >1400
tonnes (40%). Bar sales have probably more than matched that. The $64 question now is ‘how much more
gold will ETF and bar investors sell?’ The risk is that Comex players go heavily ‘short’.
• So, the equivalent of over half a year’s mine supply has hit the market over the past year. This has happened
just as Indian gold consumers have had large obstacles placed in front of them by their government.
Investment demand has been important - the rally saw bar demand dwarf ETF demand
30
0
200
400
600
800
1000
1200
1400
1600
1800
2000
2000 2002 2004 2006 2008 2010 2012
ETF's and related Products (tonnes)
Bar and coin hoarding (tonnes)
Gold Price (USD/oz)
BAR,COIN, ETF DEMAND VS GOLD PRICE
Source: World Gold Council
0
300
600
900
1200
1500
1800
2100
0
500
1000
1500
2000
2500
3000
3500
Mar-06 Mar-07 Mar-08 Mar-09 Mar-10 Mar-11 Mar-12 Mar-13
GOLD HOLDINGS - ETF & COMEXtonnes
ETF holdings (lhs)
Comex Fund Long
(rhs)
Sources: CFTC, ETF Securities
USD Gold Price
(rhs)
price

• From over 3,000 tonnes in the few years before the turn of the century, jewellery demand fell by more than 1/3
to around 2,000 tonnes per year in more recent years. The GFC wouldn’t have helped.
• Industrial demand was more resilient than jewellery demand. Typically, industrial demand comes from areas
that are less price-sensitive. That is because gold is more likely to be a small component of the overall product,
unlike gold jewellery.
• The sharp price fall so far in 2013 should stimulate jewellery and industrial demand, lending support to the price.
Gold fabrication demand has been hurt by the price gains of the past decade
31
0
450
900
1350
1800
0
180
360
540
720
1995 1998 2001 2004 2007 2010
INDUSTRIAL DEMAND VS GOLD PRICE
Industrial
demand (lhs)
Price (rhs)
$/oztonnes
550 tonnes
450 tonnes
0
300
600
900
1200
1500
1800
0
600
1200
1800
2400
3000
3600
1995 1998 2001 2004 2007 2010 2013
JEWELLERY DEMAND VS GOLD PRICE
Jewellery
demand (lhs)
Price (rhs)
$/oztonnes
2500 tonnes
2000 tonnes
3100 tonnesSource: World Gold Council

• The 1999 agreement by a group of European central
banks to restrict reserves sales to 400 tonnes per year
(and subsequent agreements capping sales at 500tpy),
gave much greater transparency to the gold market and
sparked the start of a 13-year rally in the gold price.
• Over the past decade, centrals banks collectively have
turned from being sellers of 500 tonnes per year to
being buyers of that amount: safe-haven demand
against the macroeconomic and sovereign debt
backdrop. Also, to guard against the impact of currency
de-basement that Quantitative Easing programmes
could create.
• The question from here is, will central banks follow the
pack and sell, or will they take advantage of lower
prices to increase their holdings? Central banks hold
gold for liquidity and diversification purposes, less so
because they think the price will rise. We don’t believe
central banks were participants in the recent sell-off: in
fact, some appear to have bought.
Central bank transactions
32
0
300
600
900
1200
1500
1800-750
-500
-250
0
250
500
750
1995 1998 2001 2004 2007 2010
OFFICIAL SECTOR SALESVS GOLD PRICE
Sales/Purchases
(lhs)
Price (rhs)
$/oztonnes
Source: World Gold Council
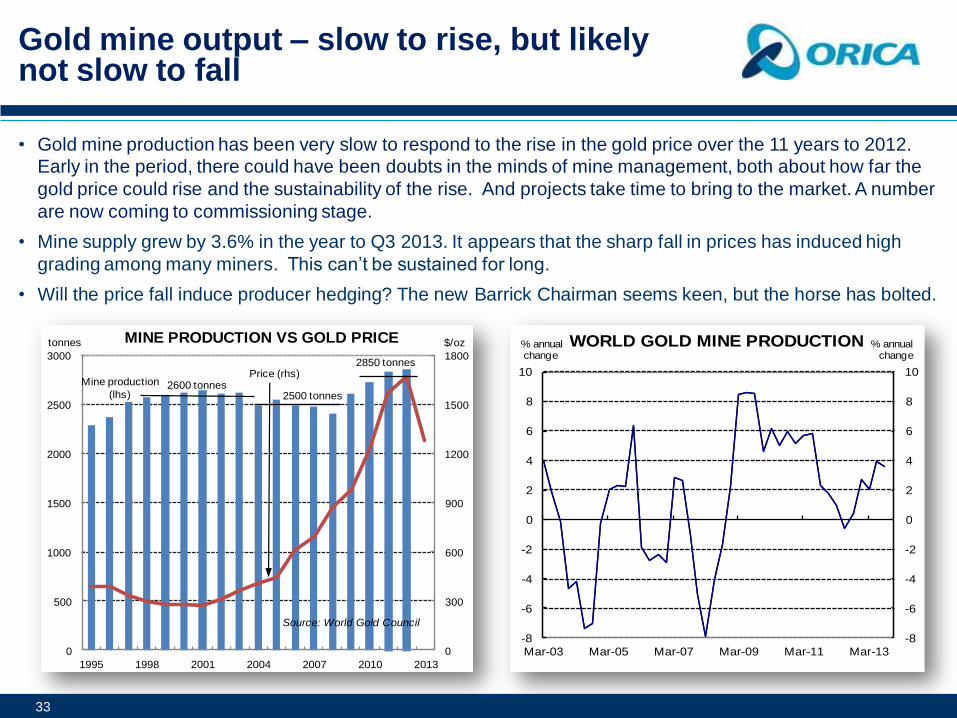
• Gold mine production has been very slow to respond to the rise in the gold price over the 11 years to 2012.
Early in the period, there could have been doubts in the minds of mine management, both about how far the
gold price could rise and the sustainability of the rise. And projects take time to bring to the market. A number
are now coming to commissioning stage.
• Mine supply grew by 3.6% in the year to Q3 2013. It appears that the sharp fall in prices has induced high
grading among many miners. This can’t be sustained for long.
• Will the price fall induce producer hedging? The new Barrick Chairman seems keen, but the horse has bolted.
Gold mine output – slow to rise, but likely not slow to fall
33
0
300
600
900
1200
1500
1800
0
500
1000
1500
2000
2500
3000
1995 1998 2001 2004 2007 2010 2013
MINE PRODUCTION VS GOLD PRICE
Mine production
(lhs)
Price (rhs)
$/oztonnes
2600 tonnes
2850 tonnes
2500 tonnes
Source: World Gold Council
-8
-6
-4
-2
0
2
4
6
8
10
-8
-6
-4
-2
0
2
4
6
8
10
Mar-03 Mar-05 Mar-07 Mar-09 Mar-11 Mar-13
WORLD GOLD MINE PRODUCTION % annualchange
% annualchange

Copper
Copper steady, and likely to remain that way...
• The copper price has been relatively stable in recent months. The market looked past a further sharp fall in
exchange stockpiles, judging it as largely a seasonal occurrence. Worries over surging mine supply have
been offset by chronic scrap shortages and strong Chinese demand.
• Activity has been strong in China’s infrastructure and construction sectors, leading to high levels of demand.
0
200000
400000
600000
800000
1000000
0
600000
1200000
1800000
2400000
3000000
Mar-00 Mar-02 Mar-04 Mar-06 Mar-08 Mar-10 Mar-12
COPPER DEMAND
China (lhs)
Germany
United States (rhs)
Developed Asia (rhs)
Source: WBMS
('000 tonnes) ('000 tonnes)
-12
-8
-4
0
4
8
12
16
-15
-10
-5
0
5
10
15
20
Jan-98 Jan-01 Jan-04 Jan-07 Jan-10 Jan-13
Industrial Production, lagged 1 quarter (rhs)
Copper demand (lhs)
COPPER DEMAND VS INDUSTRIAL PRODUCTION
annual % change
annual % change
Source: WBMS

Copper
Copper mine supply is growing firmly, after many years of problems
• Mine supply is showing strong growth at present, and after years of significant deficits, the market is likely to
show a modest surplus in 2013 and 2014.
0
300000
600000
900000
1200000
1500000
0
300000
600000
900000
1200000
1500000
Mar-95 Mar-98 Mar-01 Mar-04 Mar-07 Mar-10 Mar-13
COPPER MINE SUPPLY
Chile
NAFTA
Europe
Source: WBMS
tonnes per quarter
Oceania
Asia
Africa
tonnes per quarter
-5
0
5
10
15
Mar-96 Mar-99 Mar-02 Mar-05 Mar-08 Mar-11
COPPER MINE SUPPLYannual% ch.
Source: WBMS
Outlook
• The impact of an improvement in world economic growth is likely to be matched by rising mine supply over
the next couple of years.
• In the absence of major mine supply disruptions, the price will thus struggle to rise much above US$8,000
over that period. Chronic scrap shortages would likely see strong Chinese buying at the $6,500 mark.

Zinc and Lead
Lead and Zinc prices have recovered
• The International Lead and Zinc Study Group (ILZSG) forecasts zinc demand and supply to increase in
2014. The ILZSG projects zinc demand to increase by 5% 2014, after growth of 4.8%.
• LME lead stockpiles appear to have stabilised, after heavy falls over the past two years. ILZSG estimates
that there will have been a small 22kt surplus in the global lead market in 2013. In 2014, the market is
expected to be in deficit for the first time since 2009, with the extent of the shortage estimated at 23,000
tonnes.
0
50,000
100,000
150,000
200,000
250,000
300,000
350,000
400,000
450,000
$0
$400
$800
$1,200
$1,600
$2,000
$2,400
$2,800
$3,200
$3,600
04-Jan-08 04-Jan-10 04-Jan-12 04-Jan-14
Sto
ck
Le
ve
l (t
on
ne
s)
Pric
e
Average Weekly Lead Price & Stock Level
Lead (US$/t) Lead (A$/t) Stock Level
Source: Bloomberg50,000
250,000
450,000
650,000
850,000
1,050,000
1,250,000
1,450,000
$0
$500
$1,000
$1,500
$2,000
$2,500
$3,000
$3,500
04-Jan-08 04-Jan-10 04-Jan-12 04-Jan-14
Sto
ck
Le
ve
l (t
on
ne
s)
Pric
e
Average Weekly Zinc Price & Stock Level
Zinc (US$/t) Zinc (A$/t) Stock Level
Source: Bloomberg

Nickel
Nickel stocks have surged
• In December, nickel prices averaged
US$14,005/tonne for the month,
US$111/tonne higher than November’s
average.
• Nickel stocks ended the year at yet another
new high.
• Indonesia’s ban on exports of unprocessed
nickel ore is set to tighten the global nickel
market in 2014.

• Reliable leading indicators suggest that there will be a further pick up in the world economy in H1 2014, which
should boost the demand for resource commodities. The U.S. is taking over the locomotive role from China.
Hopefully, a firm Eurozone recovery will occur in 2015.
• Recent major policy changes by Beijing should underpin economic growth and the demand for resources in
the medium/long term. However, Beijing is now responding to widespread dissent about air pollution, by
moving away from burning low value coal and low grade Iron Ore. This should benefit Australian producers at
the expense of some Indonesian, American, Vietnamese and Chinese producers.
• Chinese and North American Coal and Iron Ore producers are under pressure on a number of fronts; they will
likely cede a larger share of the Chinese market to overseas producers.
• The Thermal Coal price is recovering, thanks to both an improving world economy and to seasonal influences
(the Northern Hemisphere winter). Supply growth will largely offset any pick-up in demand in 2014.
• The Coking Coal price is just US$3/t above the cycle lows. Strong supply and plentiful stocks in China are
offsetting the impact of stronger-than-expected demand by steelmakers in major consuming nations such as
China. An improving world economy will add to the impact of supply cuts in North America and China.
• Gold has suffered from a surge of investor liquidation and import restrictions by India. Further falls could
easily occur, but cost support and strong Chinese demand should kick in at the $1,000/oz mark.
• Base metals should benefit from stronger world economic growth and generally slower growth in supply.
Summary
38