Embed Size (px)
Citation preview
1
EXPERIMENTAL TESTING OF JOINTS FOR SEISMIC DESIGN OF LIGHTWEIGHT STRUCTURES.
PART 1: SCREWED JOINTS IN STRAPS*
Miquel Casafonta, Alfredo Arnedob, Francesc Rourea, and Antonio Rodríguez-Ferranc†
a
Departament de Resistència de Materials i Estructures a l’Enginyeria, E.T.S. d’Enginyeria Industrial de Barcelona,
Universitat Politècnica de Catalunya, Av. Diagonal 647, 08028, Barcelona, Spain
b Departament d’Enginyeria de la Construcció,
E.T.S. d’Enginyers de Camins, Canals i Ports de Barcelona, Universitat Politècnica de Catalunya, Jordi Girona 1, 08034, Barcelona, Spain
c Laboratori de Càlcul numèric (LaCàN), Departament de Matemàtica Aplicada III,
E.T.S. d’Enginyers de Camins, Canals i Ports de Barcelona, Universitat Politècnica de Catalunya, Jordi Girona 1, 08034, Barcelona, Spain
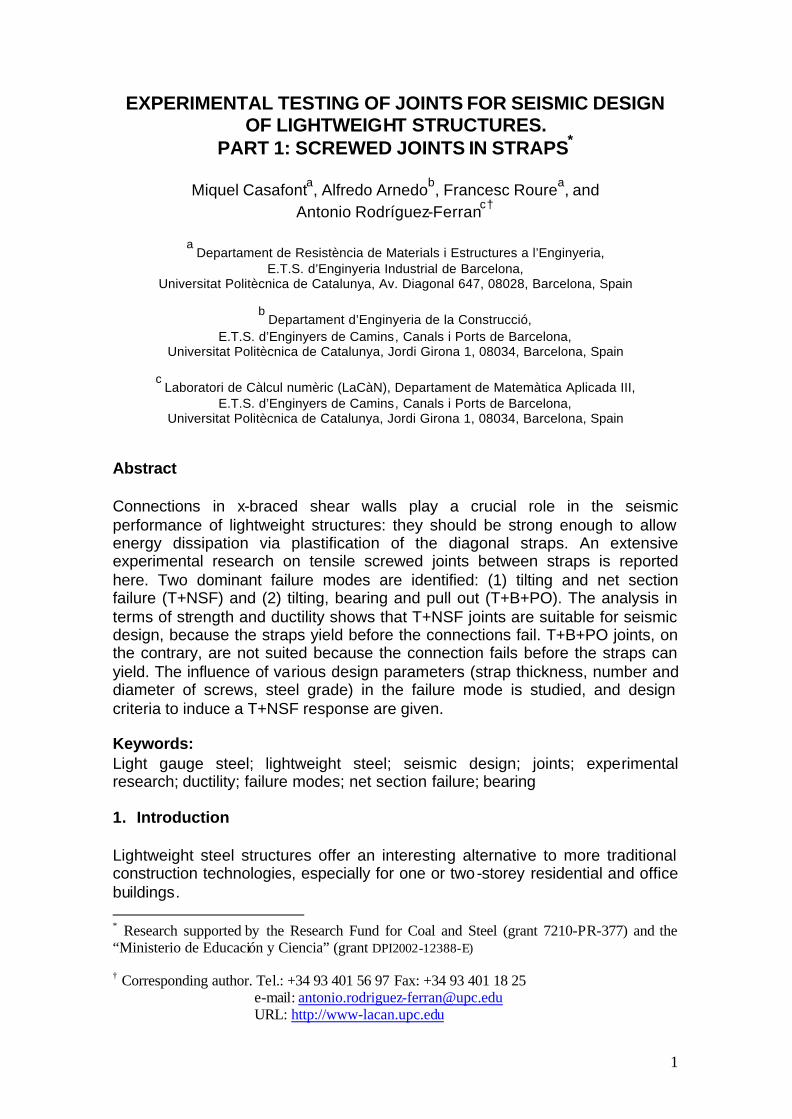
Abstract Connections in x-braced shear walls play a crucial role in the seismic performance of lightweight structures: they should be strong enough to allow energy dissipation via plastification of the diagonal straps. An extensive experimental research on tensile screwed joints between straps is reported here. Two dominant failure modes are identified: (1) tilting and net section failure (T+NSF) and (2) tilting, bearing and pull out (T+B+PO). The analysis in terms of strength and ductility shows that T+NSF joints are suitable for seismic design, because the straps yield before the connections fail. T+B+PO joints, on the contrary, are not suited because the connection fails before the straps can yield. The influence of various design parameters (strap thickness, number and diameter of screws, steel grade) in the failure mode is studied, and design criteria to induce a T+NSF response are given. Keywords: Light gauge steel; lightweight steel; seismic design; joints; experimental research; ductility; failure modes; net section failure; bearing 1. Introduction Lightweight steel structures offer an interesting alternative to more traditional construction technologies, especially for one or two-storey residential and office buildings. * Research supported by the Research Fund for Coal and Steel (grant 7210-PR-377) and the “Ministerio de Educación y Ciencia” (grant DPI2002-12388-E) † Corresponding author. Tel.: +34 93 401 56 97 Fax: +34 93 401 18 25 e-mail: [email protected] URL: http://www-lacan.upc.edu
2
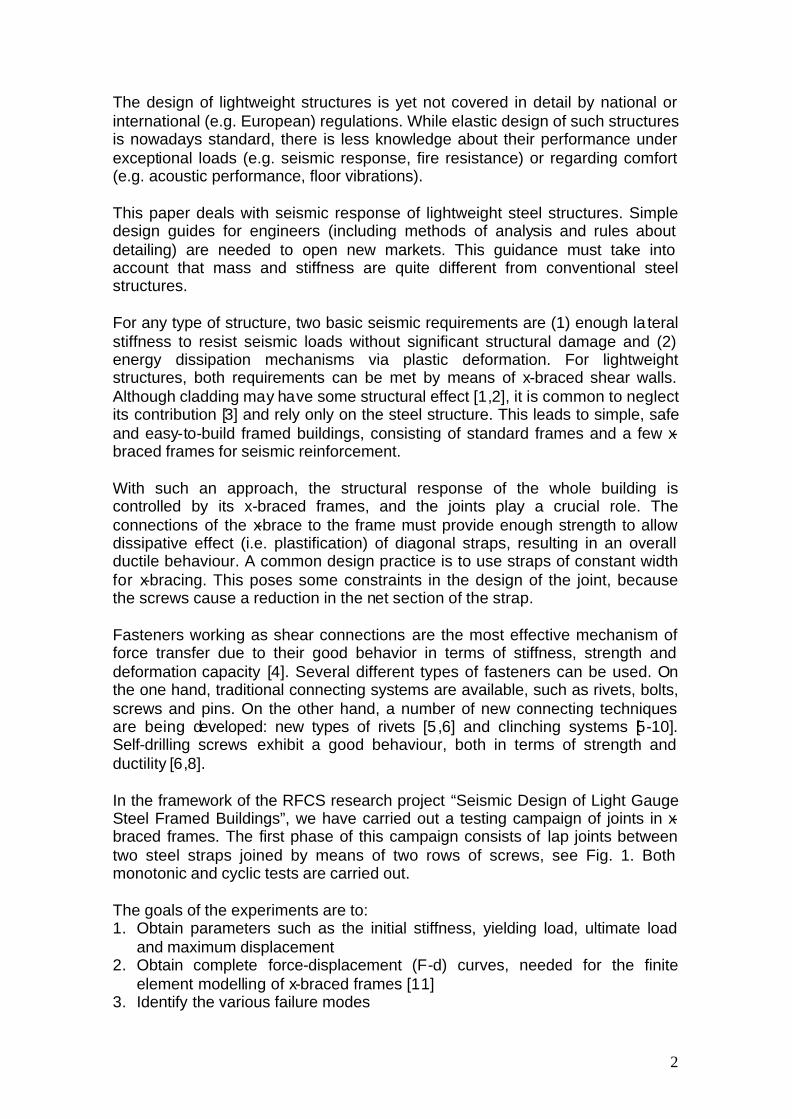
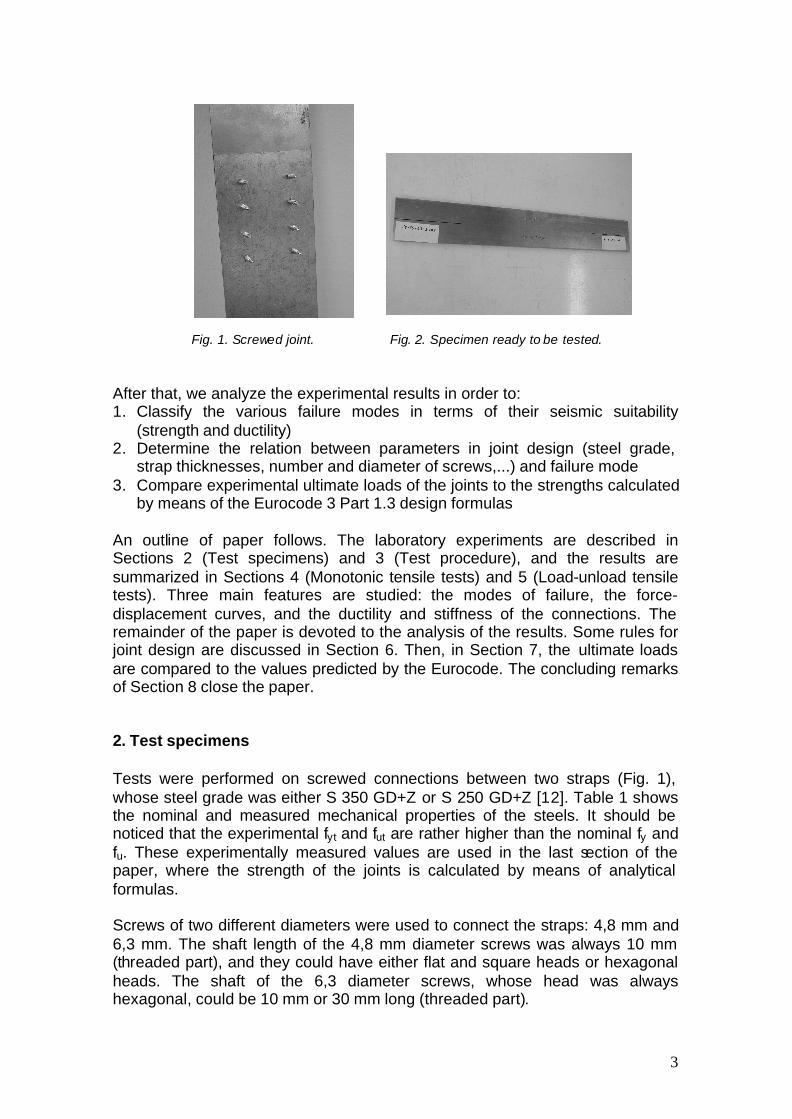
The design of lightweight structures is yet not covered in detail by national or international (e.g. European) regulations. While elastic design of such structures is nowadays standard, there is less knowledge about their performance under exceptional loads (e.g. seismic response, fire resistance) or regarding comfort (e.g. acoustic performance, floor vibrations). This paper deals with seismic response of lightweight steel structures. Simple design guides for engineers (including methods of analysis and rules about detailing) are needed to open new markets. This guidance must take into account that mass and stiffness are quite different from conventional steel structures. For any type of structure, two basic seismic requirements are (1) enough la teral stiffness to resist seismic loads without significant structural damage and (2) energy dissipation mechanisms via plastic deformation. For lightweight structures, both requirements can be met by means of x-braced shear walls. Although cladding may have some structural effect [1,2], it is common to neglect its contribution [3] and rely only on the steel structure. This leads to simple, safe and easy-to-build framed buildings, consisting of standard frames and a few x-braced frames for seismic reinforcement. With such an approach, the structural response of the whole building is controlled by its x-braced frames, and the joints play a crucial role. The connections of the x-brace to the frame must provide enough strength to allow dissipative effect (i.e. plastification) of diagonal straps, resulting in an overall ductile behaviour. A common design practice is to use straps of constant width for x-bracing. This poses some constraints in the design of the joint, because the screws cause a reduction in the net section of the strap. Fasteners working as shear connections are the most effective mechanism of force transfer due to their good behavior in terms of stiffness, strength and deformation capacity [4]. Several different types of fasteners can be used. On the one hand, traditional connecting systems are available, such as rivets, bolts, screws and pins. On the other hand, a number of new connecting techniques are being developed: new types of rivets [5 ,6] and clinching systems [5-10]. Self-drilling screws exhibit a good behaviour, both in terms of strength and ductility [6,8]. In the framework of the RFCS research project “Seismic Design of Light Gauge Steel Framed Buildings”, we have carried out a testing campaign of joints in x-braced frames. The first phase of this campaign consists of lap joints between two steel straps joined by means of two rows of screws, see Fig. 1. Both monotonic and cyclic tests are carried out. The goals of the experiments are to: 1. Obtain parameters such as the initial stiffness, yielding load, ultimate load
and maximum displacement 2. Obtain complete force-displacement (F-d) curves, needed for the finite
element modelling of x-braced frames [11] 3. Identify the various failure modes
3
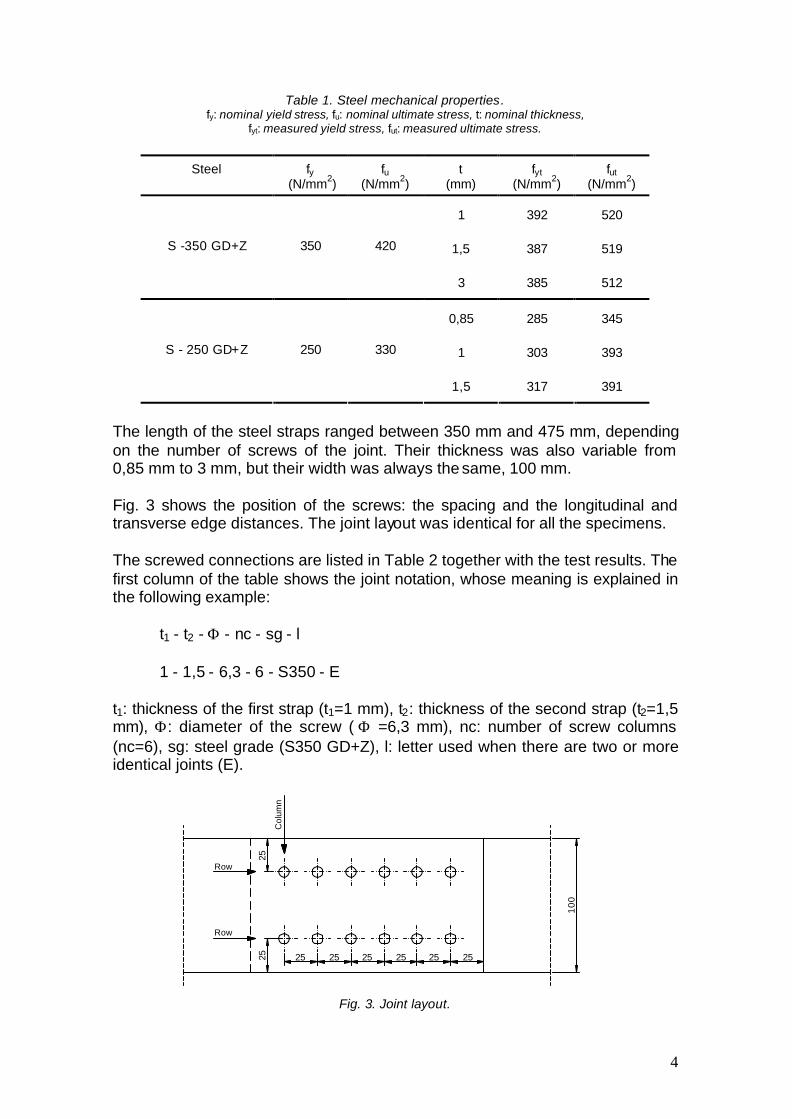
Fig. 1. Screwed joint. Fig. 2. Specimen ready to be tested. After that, we analyze the experimental results in order to: 1. Classify the various failure modes in terms of their seismic suitability
(strength and ductility) 2. Determine the relation between parameters in joint design (steel grade,
strap thicknesses, number and diameter of screws,...) and failure mode 3. Compare experimental ultimate loads of the joints to the strengths calculated
by means of the Eurocode 3 Part 1.3 design formulas An outline of paper follows. The laboratory experiments are described in Sections 2 (Test specimens) and 3 (Test procedure), and the results are summarized in Sections 4 (Monotonic tensile tests) and 5 (Load-unload tensile tests). Three main features are studied: the modes of failure, the force-displacement curves, and the ductility and stiffness of the connections. The remainder of the paper is devoted to the analysis of the results. Some rules for joint design are discussed in Section 6. Then, in Section 7, the ultimate loads are compared to the values predicted by the Eurocode. The concluding remarks of Section 8 close the paper. 2. Test specimens Tests were performed on screwed connections between two straps (Fig. 1), whose steel grade was either S 350 GD+Z or S 250 GD+Z [12]. Table 1 shows the nominal and measured mechanical properties of the steels. It should be noticed that the experimental fyt and fut are rather higher than the nominal fy and fu. These experimentally measured values are used in the last section of the paper, where the strength of the joints is calculated by means of analytical formulas. Screws of two different diameters were used to connect the straps: 4,8 mm and 6,3 mm. The shaft length of the 4,8 mm diameter screws was always 10 mm (threaded part), and they could have either flat and square heads or hexagonal heads. The shaft of the 6,3 diameter screws, whose head was always hexagonal, could be 10 mm or 30 mm long (threaded part).
4
Table 1. Steel mechanical properties. fy: nominal yield stress, fu: nominal ultimate stress, t: nominal thickness,
fyt: measured yield stress, fut: measured ultimate stress.
Steel
fy (N/mm2)
fu (N/mm2)
t (mm)
fyt (N/mm2)
fut (N/mm2)
1 392 520
1,5 387 519 S -350 GD+Z 350 420
3 385 512
0,85 285 345
1 303 393 S - 250 GD+Z 250 330
1,5 317 391
The length of the steel straps ranged between 350 mm and 475 mm, depending on the number of screws of the joint. Their thickness was also variable from 0,85 mm to 3 mm, but their width was always the same, 100 mm. Fig. 3 shows the position of the screws: the spacing and the longitudinal and transverse edge distances. The joint layout was identical for all the specimens. The screwed connections are listed in Table 2 together with the test results. The first column of the table shows the joint notation, whose meaning is explained in the following example:
t1 - t2 - Φ - nc - sg - l
1 - 1,5 - 6,3 - 6 - S350 - E t1: thickness of the first strap (t1=1 mm), t2: thickness of the second strap (t2=1,5 mm), Φ: diameter of the screw ( Φ =6,3 mm), nc: number of screw columns (nc=6), sg: steel grade (S350 GD+Z), l: letter used when there are two or more identical joints (E).
Fig. 3. Joint layout.
10
0
2525 25 25 25 25 25 25
Row
Row
Col
umn
5
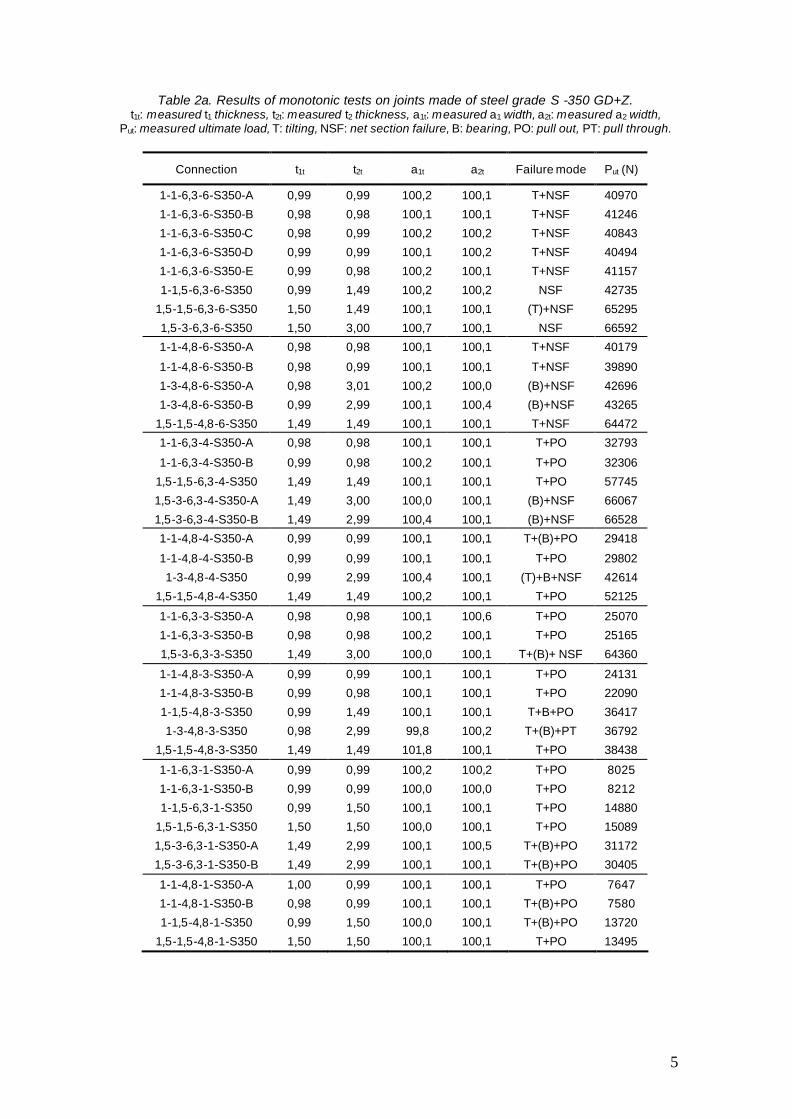
Table 2a. Results of monotonic tests on joints made of steel grade S -350 GD+Z. t1t: measured t1 thickness, t2t: measured t2 thickness, a1t: measured a1 width, a2t: measured a2 width,
Put: measured ultimate load, T: tilting, NSF: net section failure, B: bearing, PO: pull out, PT: pull through.
Connection t1t t2t a1t a2t Failure mode Put (N)
1-1-6,3-6-S350-A 0,99 0,99 100,2 100,1 T+NSF 40970
1-1-6,3-6-S350-B 0,98 0,98 100,1 100,1 T+NSF 41246
1-1-6,3-6-S350-C 0,98 0,99 100,2 100,2 T+NSF 40843
1-1-6,3-6-S350-D 0,99 0,99 100,1 100,2 T+NSF 40494
1-1-6,3-6-S350-E 0,99 0,98 100,2 100,1 T+NSF 41157
1-1,5-6,3-6-S350 0,99 1,49 100,2 100,2 NSF 42735
1,5-1,5-6,3-6-S350 1,50 1,49 100,1 100,1 (T)+NSF 65295
1,5-3-6,3-6-S350 1,50 3,00 100,7 100,1 NSF 66592
1-1-4,8-6-S350-A 0,98 0,98 100,1 100,1 T+NSF 40179
1-1-4,8-6-S350-B 0,98 0,99 100,1 100,1 T+NSF 39890
1-3-4,8-6-S350-A 0,98 3,01 100,2 100,0 (B)+NSF 42696
1-3-4,8-6-S350-B 0,99 2,99 100,1 100,4 (B)+NSF 43265
1,5-1,5-4,8-6-S350 1,49 1,49 100,1 100,1 T+NSF 64472
1-1-6,3-4-S350-A 0,98 0,98 100,1 100,1 T+PO 32793
1-1-6,3-4-S350-B 0,99 0,98 100,2 100,1 T+PO 32306
1,5-1,5-6,3-4-S350 1,49 1,49 100,1 100,1 T+PO 57745
1,5-3-6,3-4-S350-A 1,49 3,00 100,0 100,1 (B)+NSF 66067
1,5-3-6,3-4-S350-B 1,49 2,99 100,4 100,1 (B)+NSF 66528
1-1-4,8-4-S350-A 0,99 0,99 100,1 100,1 T+(B)+PO 29418
1-1-4,8-4-S350-B 0,99 0,99 100,1 100,1 T+PO 29802
1-3-4,8-4-S350 0,99 2,99 100,4 100,1 (T)+B+NSF 42614
1,5-1,5-4,8-4-S350 1,49 1,49 100,2 100,1 T+PO 52125
1-1-6,3-3-S350-A 0,98 0,98 100,1 100,6 T+PO 25070
1-1-6,3-3-S350-B 0,98 0,98 100,2 100,1 T+PO 25165
1,5-3-6,3-3-S350 1,49 3,00 100,0 100,1 T+(B)+ NSF 64360
1-1-4,8-3-S350-A 0,99 0,99 100,1 100,1 T+PO 24131
1-1-4,8-3-S350-B 0,99 0,98 100,1 100,1 T+PO 22090
1-1,5-4,8-3-S350 0,99 1,49 100,1 100,1 T+B+PO 36417
1-3-4,8-3-S350 0,98 2,99 99,8 100,2 T+(B)+PT 36792
1,5-1,5-4,8-3-S350 1,49 1,49 101,8 100,1 T+PO 38438
1-1-6,3-1-S350-A 0,99 0,99 100,2 100,2 T+PO 8025
1-1-6,3-1-S350-B 0,99 0,99 100,0 100,0 T+PO 8212
1-1,5-6,3-1-S350 0,99 1,50 100,1 100,1 T+PO 14880
1,5-1,5-6,3-1-S350 1,50 1,50 100,0 100,1 T+PO 15089
1,5-3-6,3-1-S350-A 1,49 2,99 100,1 100,5 T+(B)+PO 31172
1,5-3-6,3-1-S350-B 1,49 2,99 100,1 100,1 T+(B)+PO 30405
1-1-4,8-1-S350-A 1,00 0,99 100,1 100,1 T+PO 7647
1-1-4,8-1-S350-B 0,98 0,99 100,1 100,1 T+(B)+PO 7580
1-1,5-4,8-1-S350 0,99 1,50 100,0 100,1 T+(B)+PO 13720
1,5-1,5-4,8-1-S350 1,50 1,50 100,1 100,1 T+PO 13495
6
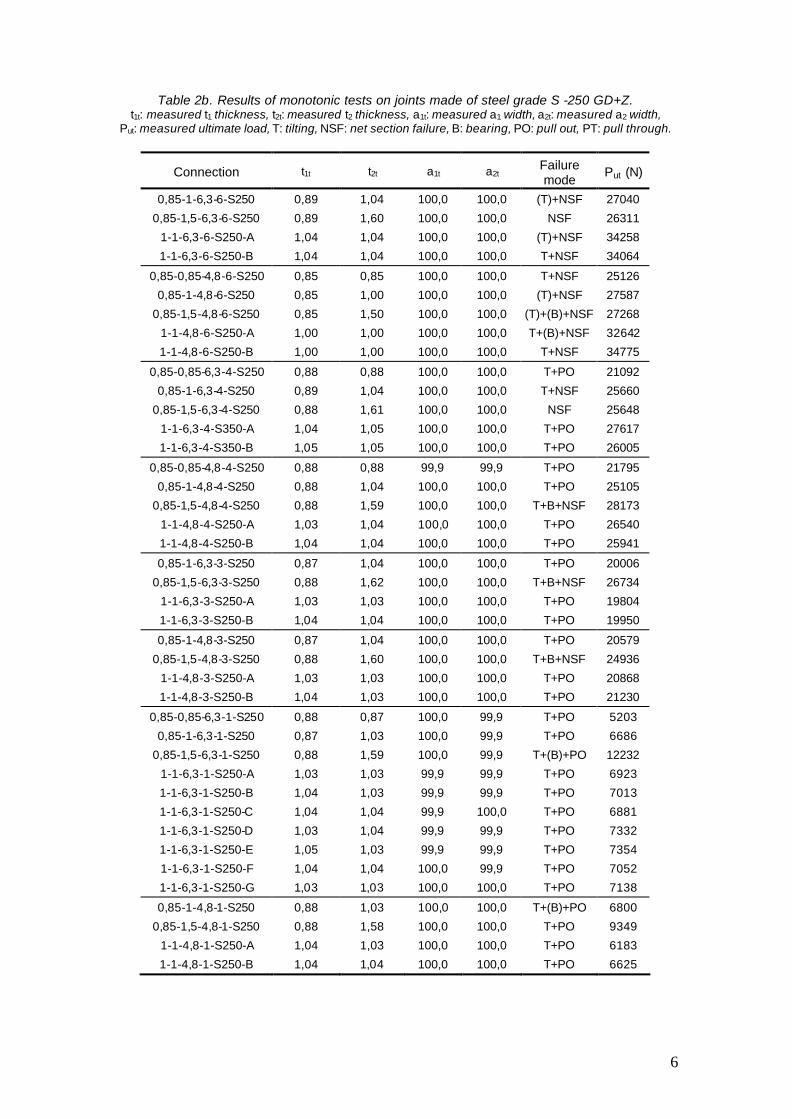
Table 2b. Results of monotonic tests on joints made of steel grade S -250 GD+Z. t1t: measured t1 thickness, t2t: measured t2 thickness, a1t: measured a1 width, a2t: measured a2 width,
Put: measured ultimate load, T: tilting, NSF: net section failure, B: bearing, PO: pull out, PT: pull through.
Connection t1t t2t a1t a2t Failure mode
Put (N)
0,85-1-6,3-6-S250 0,89 1,04 100,0 100,0 (T)+NSF 27040
0,85-1,5-6,3-6-S250 0,89 1,60 100,0 100,0 NSF 26311
1-1-6,3-6-S250-A 1,04 1,04 100,0 100,0 (T)+NSF 34258
1-1-6,3-6-S250-B 1,04 1,04 100,0 100,0 T+NSF 34064
0,85-0,85-4,8-6-S250 0,85 0,85 100,0 100,0 T+NSF 25126
0,85-1-4,8-6-S250 0,85 1,00 100,0 100,0 (T)+NSF 27587
0,85-1,5-4,8-6-S250 0,85 1,50 100,0 100,0 (T)+(B)+NSF 27268
1-1-4,8-6-S250-A 1,00 1,00 100,0 100,0 T+(B)+NSF 32642
1-1-4,8-6-S250-B 1,00 1,00 100,0 100,0 T+NSF 34775
0,85-0,85-6,3-4-S250 0,88 0,88 100,0 100,0 T+PO 21092
0,85-1-6,3-4-S250 0,89 1,04 100,0 100,0 T+NSF 25660
0,85-1,5-6,3-4-S250 0,88 1,61 100,0 100,0 NSF 25648
1-1-6,3-4-S350-A 1,04 1,05 100,0 100,0 T+PO 27617
1-1-6,3-4-S350-B 1,05 1,05 100,0 100,0 T+PO 26005
0,85-0,85-4,8-4-S250 0,88 0,88 99,9 99,9 T+PO 21795
0,85-1-4,8-4-S250 0,88 1,04 100,0 100,0 T+PO 25105
0,85-1,5-4,8-4-S250 0,88 1,59 100,0 100,0 T+B+NSF 28173
1-1-4,8-4-S250-A 1,03 1,04 100,0 100,0 T+PO 26540
1-1-4,8-4-S250-B 1,04 1,04 100,0 100,0 T+PO 25941
0,85-1-6,3-3-S250 0,87 1,04 100,0 100,0 T+PO 20006
0,85-1,5-6,3-3-S250 0,88 1,62 100,0 100,0 T+B+NSF 26734
1-1-6,3-3-S250-A 1,03 1,03 100,0 100,0 T+PO 19804
1-1-6,3-3-S250-B 1,04 1,04 100,0 100,0 T+PO 19950
0,85-1-4,8-3-S250 0,87 1,04 100,0 100,0 T+PO 20579
0,85-1,5-4,8-3-S250 0,88 1,60 100,0 100,0 T+B+NSF 24936
1-1-4,8-3-S250-A 1,03 1,03 100,0 100,0 T+PO 20868
1-1-4,8-3-S250-B 1,04 1,03 100,0 100,0 T+PO 21230
0,85-0,85-6,3-1-S250 0,88 0,87 100,0 99,9 T+PO 5203
0,85-1-6,3-1-S250 0,87 1,03 100,0 99,9 T+PO 6686
0,85-1,5-6,3-1-S250 0,88 1,59 100,0 99,9 T+(B)+PO 12232
1-1-6,3-1-S250-A 1,03 1,03 99,9 99,9 T+PO 6923
1-1-6,3-1-S250-B 1,04 1,03 99,9 99,9 T+PO 7013
1-1-6,3-1-S250-C 1,04 1,04 99,9 100,0 T+PO 6881
1-1-6,3-1-S250-D 1,03 1,04 99,9 99,9 T+PO 7332
1-1-6,3-1-S250-E 1,05 1,03 99,9 99,9 T+PO 7354
1-1-6,3-1-S250-F 1,04 1,04 100,0 99,9 T+PO 7052
1-1-6,3-1-S250-G 1,03 1,03 100,0 100,0 T+PO 7138
0,85-1-4,8-1-S250 0,88 1,03 100,0 100,0 T+(B)+PO 6800
0,85-1,5-4,8-1-S250 0,88 1,58 100,0 100,0 T+PO 9349
1-1-4,8-1-S250-A 1,04 1,03 100,0 100,0 T+PO 6183
1-1-4,8-1-S250-B 1,04 1,04 100,0 100,0 T+PO 6625
7
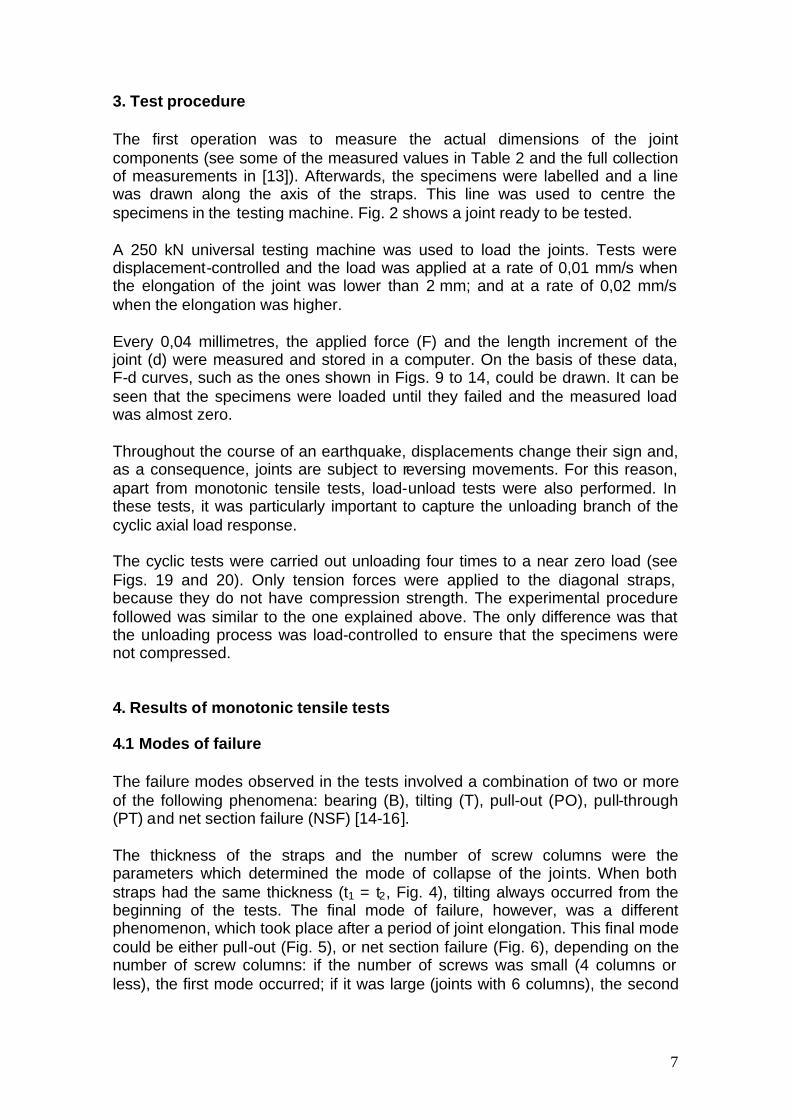
3. Test procedure The first operation was to measure the actual dimensions of the joint components (see some of the measured values in Table 2 and the full collection of measurements in [13]). Afterwards, the specimens were labelled and a line was drawn along the axis of the straps. This line was used to centre the specimens in the testing machine. Fig. 2 shows a joint ready to be tested. A 250 kN universal testing machine was used to load the joints. Tests were displacement-controlled and the load was applied at a rate of 0,01 mm/s when the elongation of the joint was lower than 2 mm; and at a rate of 0,02 mm/s when the elongation was higher. Every 0,04 millimetres, the applied force (F) and the length increment of the joint (d) were measured and stored in a computer. On the basis of these data, F-d curves, such as the ones shown in Figs. 9 to 14, could be drawn. It can be seen that the specimens were loaded until they failed and the measured load was almost zero. Throughout the course of an earthquake, displacements change their sign and, as a consequence, joints are subject to reversing movements. For this reason, apart from monotonic tensile tests, load-unload tests were also performed. In these tests, it was particularly important to capture the unloading branch of the cyclic axial load response. The cyclic tests were carried out unloading four times to a near zero load (see Figs. 19 and 20). Only tension forces were applied to the diagonal straps, because they do not have compression strength. The experimental procedure followed was similar to the one explained above. The only difference was that the unloading process was load-controlled to ensure that the specimens were not compressed. 4. Results of monotonic tensile tests 4.1 Modes of failure The failure modes observed in the tests involved a combination of two or more of the following phenomena: bearing (B), tilting (T), pull-out (PO), pull-through (PT) and net section failure (NSF) [14-16]. The thickness of the straps and the number of screw columns were the parameters which determined the mode of collapse of the joints. When both straps had the same thickness (t1 = t2, Fig. 4), tilting always occurred from the beginning of the tests. The final mode of failure, however, was a different phenomenon, which took place after a period of joint elongation. This final mode could be either pull-out (Fig. 5), or net section failure (Fig. 6), depending on the number of screw columns: if the number of screws was small (4 columns or less), the first mode occurred; if it was large (joints with 6 columns), the second
8
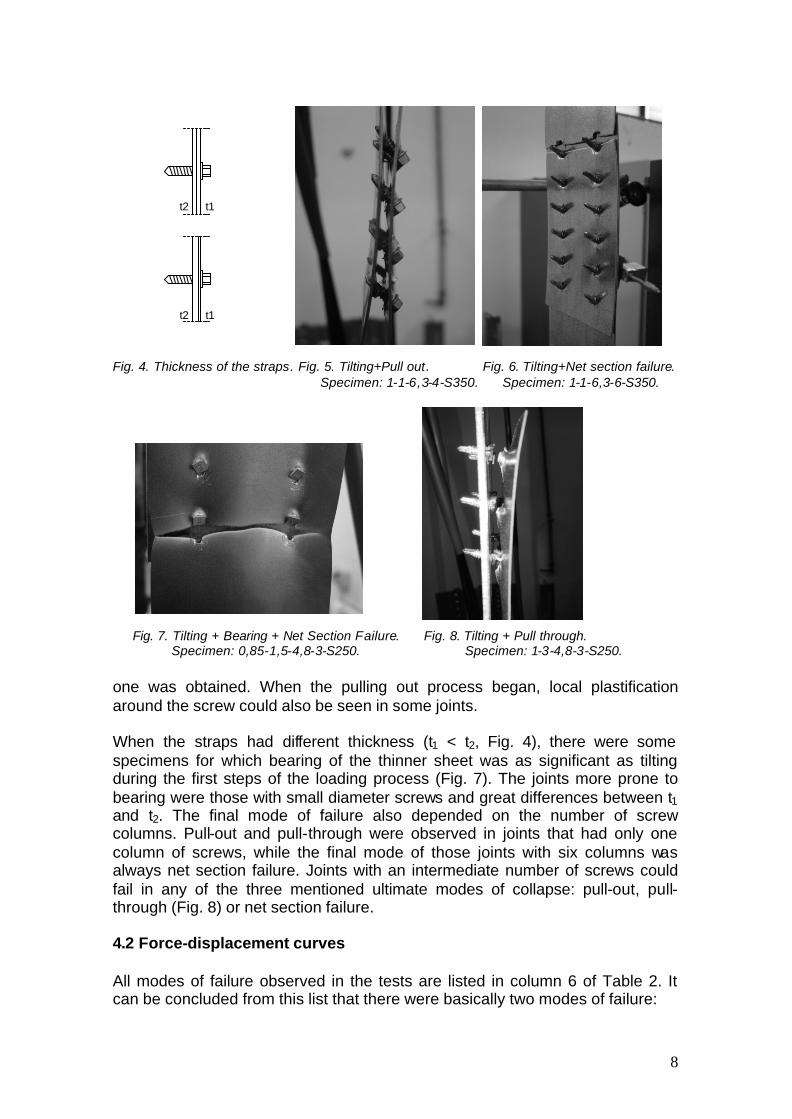
Fig. 4. Thickness of the straps. Fig. 5. Tilting+Pull out. Fig. 6. Tilting+Net section failure. Specimen: 1-1-6,3-4-S350. Specimen: 1-1-6,3-6-S350. Fig. 7. Tilting + Bearing + Net Section Failure. Fig. 8. Tilting + Pull through. Specimen: 0,85-1,5-4,8-3-S250. Specimen: 1-3-4,8-3-S250. one was obtained. When the pulling out process began, local plastification around the screw could also be seen in some joints. When the straps had different thickness (t1 < t2, Fig. 4), there were some specimens for which bearing of the thinner sheet was as significant as tilting during the first steps of the loading process (Fig. 7). The joints more prone to bearing were those with small diameter screws and great differences between t1 and t2. The final mode of failure also depended on the number of screw columns. Pull-out and pull-through were observed in joints that had only one column of screws, while the final mode of those joints with six columns was always net section failure. Joints with an intermediate number of screws could fail in any of the three mentioned ultimate modes of collapse: pull-out, pull-through (Fig. 8) or net section failure. 4.2 Force-displacement curves All modes of failure observed in the tests are listed in column 6 of Table 2. It can be concluded from this list that there were basically two modes of failure:
t1t2
t1t2
9
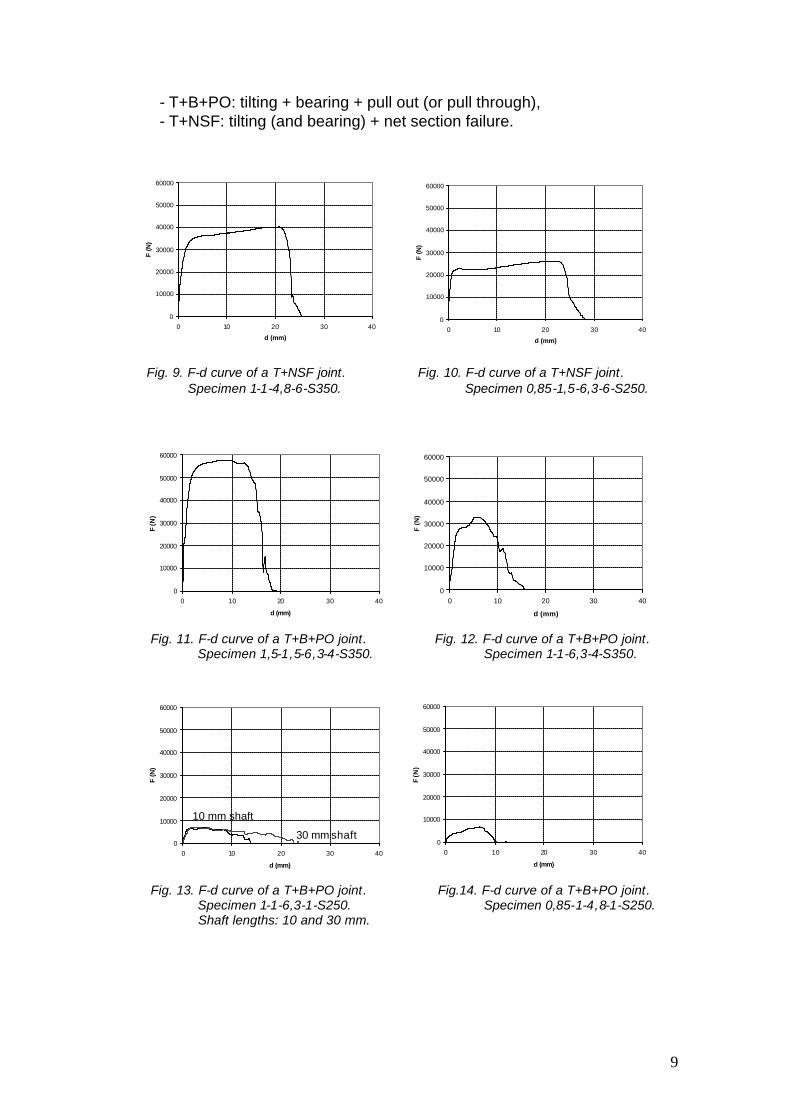
- T+B+PO: tilting + bearing + pull out (or pull through), - T+NSF: tilting (and bearing) + net section failure.
Fig. 9. F-d curve of a T+NSF joint. Fig. 10. F-d curve of a T+NSF joint. Specimen 1-1-4,8-6-S350. Specimen 0,85-1,5-6,3-6-S250. Fig. 11. F-d curve of a T+B+PO joint. Fig. 12. F-d curve of a T+B+PO joint. Specimen 1,5-1,5-6,3-4-S350. Specimen 1-1-6,3-4-S350. Fig. 13. F-d curve of a T+B+PO joint. Fig.14. F-d curve of a T+B+PO joint. Specimen 1-1-6,3-1-S250. Specimen 0,85-1-4,8-1-S250. Shaft lengths: 10 and 30 mm.
0
10000
20000
30000
40000
50000
60000
0 10 20 30 40
d (mm)
F (N
)
0
10000
20000
30000
40000
50000
60000
0 10 20 30 40
d (mm)
F (N
)
0
10000
20000
30000
40000
50000
60000
0 10 20 30 40
d (mm)
F (N
)
0
10000
20000
30000
40000
50000
60000
0 10 20 30 40
d (mm)
F (
N)
0
10000
20000
30000
40000
50000
60000
0 10 20 30 40
d (mm)
F (N
)
0
10000
20000
30000
40000
50000
60000
0 10 20 30 40
d (mm)
F (N
)
10 mm shaft
30 mm shaft
10
The behaviour of the joints which failed T+NSF was different from the behaviour of those which failed T+B+PO. Figs. 9 and 10 show the two types of F-d curves obtained for the joints that underwent the T+NSF mode. The first one (Fig. 9) has three branches: elastic behaviour, hardening and failure; while the second one has an additional yielding branch. Four types of F-d curves were observed for the joints that failed T+B+PO (Figs. 11 to 14). Actually, most of the tests on these joints gave the curves in Figs. 11 and 12. It might be said that the first one (Fig. 11) has three branches and the second one four, as in Figs. 9 and 10. However, these branches are not as clearly defined as for T+NSF joints, because both yielding and failure occur gradually. The F-d curves in Figs. 13 and 14 were observed in a few specimens that had a small number of screws (one or three columns). Curves in Fig. 13 have only two branches: elastic behaviour and failure; while curve in Fig. 14 can be seen as a special case of curve in Fig. 12. Fig. 13 also shows that the length of the failure branches increases with the length of the screw shaft. This behaviour is not observed in case of net section failure. 4.3 Ductility and stiffness of the connections The ductility of the connections was studied by means of the displacement ductility ratio yud ddr = , where du is the displacement corresponding to the
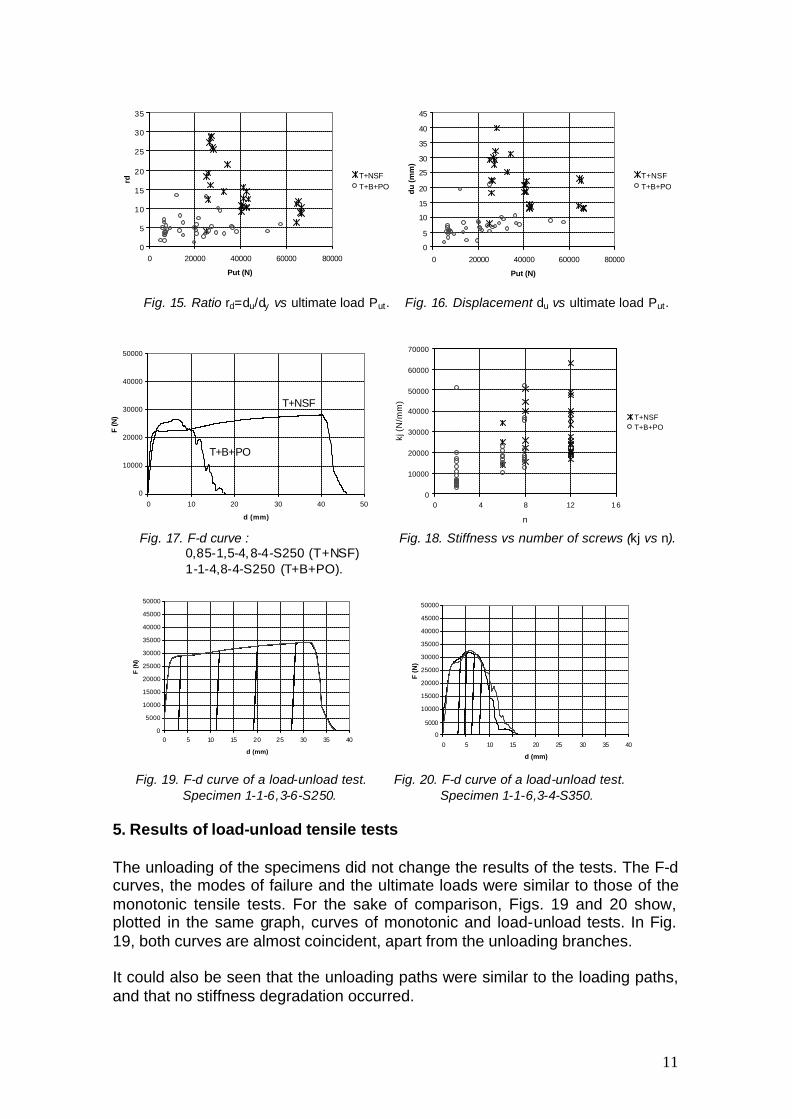
maximum load, and dy is the displacement at yielding. The connections showed medium to high degree of ductility, most of the ratios calculated are above 2. This can be seen in Fig. 15, which also reveals that the T+B+PO failure (circles) is less ductile than the T+NSF failure (crosses). The same trend is observed in Fig. 16, where du is plotted for all the joints tested. Fig. 17 demonstrates more clearly the loss of ductility associated to the T+B+PO failure. The F-d curves plotted correspond to joints that were similar and had also similar ultimate loads, but that failed in a different mode. The effect of screw number, screw diameter, sheet thickness and steel grade on ductility was also investigated. It was observed that ductility increased when the steel grade changed from S 350 GD+Z to S 250 GD + Z, and that, for those connections which failed T+B+PO, ductility was also slightly higher when the thickness of the straps was different (t1<t2). A modification of the other mentioned parameters affected ductility only when it provoked a change in the mode of failure from T+B+PO to T+NSF. Finally, the stiffness of the connections was calculated. Column 4 in tables 3, 4 and 5 shows the slope of the linear loading branch of the joints tested. It was observed that the stiffness of the connection depends mainly on the number of screws: the larger is the number of screws, the higher is the stiffness (Fig. 18).
11
Fig. 15. Ratio rd=du/dy vs ultimate load Put. Fig. 16. Displacement du vs ultimate load Put. Fig. 17. F-d curve : Fig. 18. Stiffness vs number of screws (kj vs n). 0,85-1,5-4,8-4-S250 (T+NSF) 1-1-4,8-4-S250 (T+B+PO). Fig. 19. F-d curve of a load-unload test. Fig. 20. F-d curve of a load-unload test. Specimen 1-1-6,3-6-S250. Specimen 1-1-6,3-4-S350. 5. Results of load-unload tensile tests The unloading of the specimens did not change the results of the tests. The F-d curves, the modes of failure and the ultimate loads were similar to those of the monotonic tensile tests. For the sake of comparison, Figs. 19 and 20 show, plotted in the same graph, curves of monotonic and load-unload tests. In Fig. 19, both curves are almost coincident, apart from the unloading branches. It could also be seen that the unloading paths were similar to the loading paths, and that no stiffness degradation occurred.
0
5
10
15
20
25
30
35
0 20000 40000 60000 80000
Put (N)
rd
T+NSFT+B+PO
0
5
10
15
20
25
30
35
40
45
0 20000 40000 60000 80000
Put (N)
du
(mm
)
T+NSFT+B+PO
0
10000
20000
30000
40000
50000
0 10 20 30 40 50
d (mm)
F (N
)
T+NSF
T+B+PO
0
10000
20000
30000
40000
50000
60000
70000
0 4 8 12 16
n
kj (
N/m
m)
T+NSFT+B+PO
0
5000
10000
15000
20000
25000
30000
35000
40000
45000
50000
0 5 10 15 20 25 30 35 40
d (mm)
F (
N)
0
5000
10000
15000
20000
25000
30000
35000
40000
45000
50000
0 5 10 15 20 25 30 35 40
d (mm)
F (N
)
12
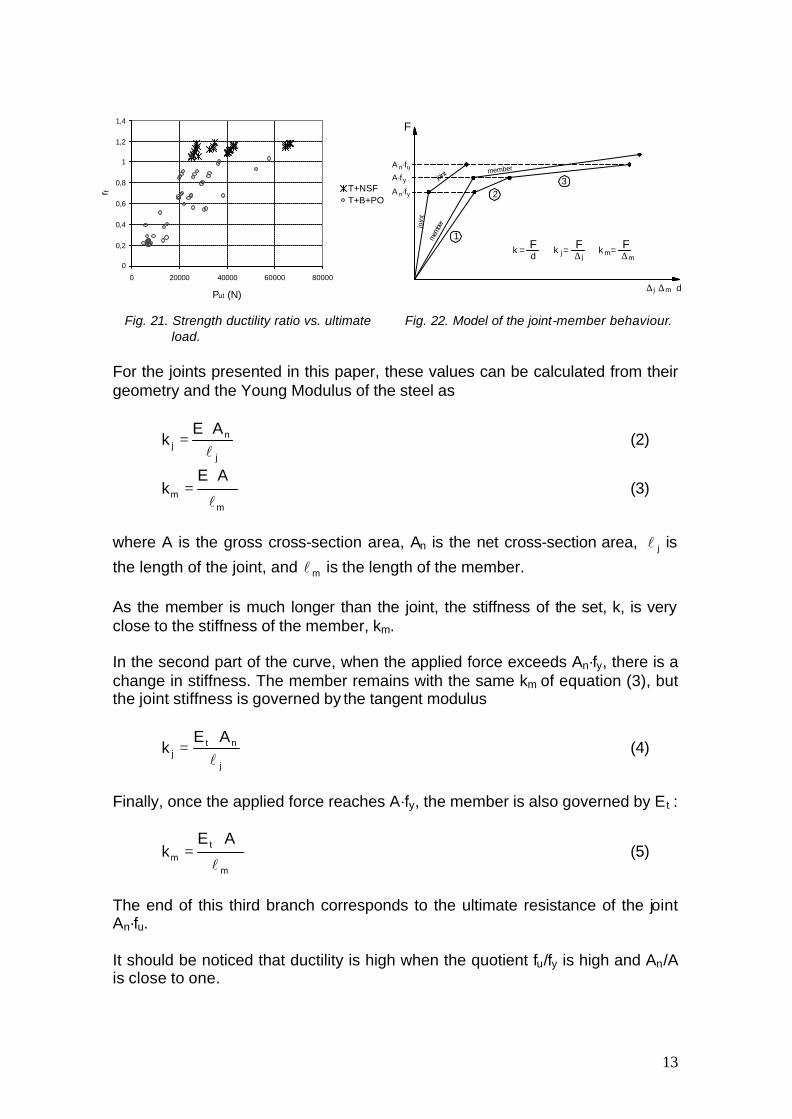
6. Joint design for x-braced dissipative frames As discussed in Section 1, diagonal straps may act as dissipative members when used as bracings of low rise cold-formed steel buildings. According to Eurocode 8 [17], some rules must be followed to ensure the dissipative action of the bracings. The main one is that they should be designed so that yielding of the straps takes place before failure of the connection and before collapse of the other members of the structure. The non-dissipative parts should have sufficient overstrength to allow the development of the cyclic yielding in the bracings. A new strength ductility ratio is defined to know in which degree the connections tested allow the dissipative action: ( )y ttutf fAPr ⋅= , where Put is the
experimental ultimate load of the connection, At is the measured gross cross section area of the thinner strap (from Table 2), and fyt is the measured yield stress of the steel (Table 1). Tables 3 to 5 and Fig. 21 show the ratios calculated for all the connections. In Section 4.3, it has been shown that medium values of rd were obtained for T+B+PO joints. It could also be seen that these joints can keep their strength for displacements higher than 3 mm (Figs. 12 and 14), which is the limit value of displacement chosen by the ECCS recommendations [18]. There is still strength after what is known as “the first drop at 3 mm”. Therefore, T+B+PO joints may be considered ductile. However, from the seismic point of view, and according to the approach presented in this paper, these joints are not suitable for x-braced dissipative frames. This is because their rf ratios are lower than one (Fig. 21), which means that they do not allow the dissipative action of the straps. Joints collapse before yielding of the bracings. On the contrary, all the joints which failed T+NSF show rf ductility factors greater than one. Therefore, these are the joints to be used in x-braced frames because, with them, yielding of the straps can occur. The effect of sheet thickness, number of screws and steel grade on rf was also investigated. Ductility was achieved only when a modification of these parameters led to a change in the mode of failure from T+B+PO to T+NSF. When the design of an x-braced frame with T+NSF joints is tackled by means of a beam finite element model, the behaviour of the set composed of the joint and the strap can be described with a trilinear curve (Fig. 22). In the first part of this curve, both the joint and the member subject to the axial force keep their original linear behaviour Therefore, the stiffness of the set is
mj kk
k11
1
+= (1)
where kj is the stiffness of the joint and km is the stiffness of the member.
13
Fig. 21. Strength ductility ratio vs. ultimate Fig. 22. Model of the joint-member behaviour. load. For the joints presented in this paper, these values can be calculated from their geometry and the Young Modulus of the steel as
j
nj
AEk
l⋅
= (2)
mm
AEk
l
⋅= (3)
where A is the gross cross-section area, An is the net cross-section area, jl is
the length of the joint, and ml is the length of the member. As the member is much longer than the joint, the stiffness of the set, k, is very close to the stiffness of the member, km. In the second part of the curve, when the applied force exceeds An·fy, there is a change in stiffness. The member remains with the same km of equation (3), but the joint stiffness is governed by the tangent modulus
j
ntj
AEk
l⋅
= (4)
Finally, once the applied force reaches A·fy, the member is also governed by E t :
m
tm
AEk
l
⋅= (5)
The end of this third branch corresponds to the ultimate resistance of the joint An·fu. It should be noticed that ductility is high when the quotient fu/fy is high and An/A is close to one.
F
d
1
23join
t
join
tm
embe
r
member
A ·f n y
yA·f uA ·f n
∆ j m∆
k =dF k = F
j ∆ jk =m
F∆m
0
0,2
0,4
0,6
0,8
1
1,2
1,4
0 20000 40000 60000 80000
Put (N)
r f T+NSF T+B+PO
14
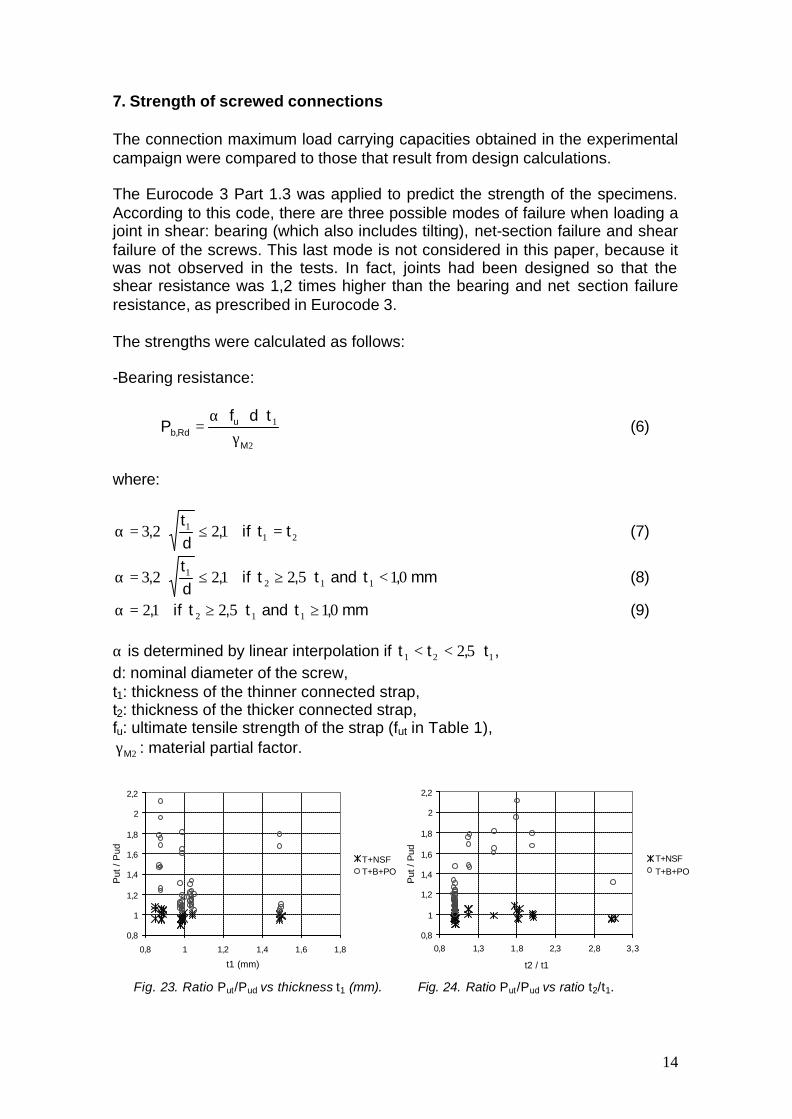
7. Strength of screwed connections The connection maximum load carrying capacities obtained in the experimental campaign were compared to those that result from design calculations. The Eurocode 3 Part 1.3 was applied to predict the strength of the specimens. According to this code, there are three possible modes of failure when loading a joint in shear: bearing (which also includes tilting), net-section failure and shear failure of the screws. This last mode is not considered in this paper, because it was not observed in the tests. In fact, joints had been designed so that the shear resistance was 1,2 times higher than the bearing and net section failure resistance, as prescribed in Eurocode 3. The strengths were calculated as follows: -Bearing resistance:
2
1
M
uRd,b
tdfP
γ⋅⋅⋅α
= (6)
where:
1223 1 ,dt
, ≤⋅=α if 21 tt = (7)
1223 1 ,dt
, ≤⋅=α if 12 52 t,t ⋅≥ and mm,t 011 < (8)
12,=α if 12 52 t,t ⋅≥ and mm,t 011 ≥ (9) α is determined by linear interpolation if 121 52 t,tt ⋅<< , d: nominal diameter of the screw, t1: thickness of the thinner connected strap, t2: thickness of the thicker connected strap, fu: ultimate tensile strength of the strap (fut in Table 1),
2Mγ : material partial factor.
Fig. 23. Ratio Put/Pud vs thickness t1 (mm). Fig. 24. Ratio Put/Pud vs ratio t2/t1.
0,8
1
1,2
1,4
1,6
1,8
2
2,2
0,8 1 1,2 1,4 1,6 1,8
t1 (mm)
Put
/ P
ud
T+NSFT+B+PO
0,8
1
1,2
1,4
1,6
1,8
2
2,2
0,8 1,3 1,8 2,3 2,8 3,3
t2 / t1
Put
/ P
ud
T+NSFT+B+PO
15
-Net-section resistance:
2M
unRd,n
fAP
γ⋅
= (10)
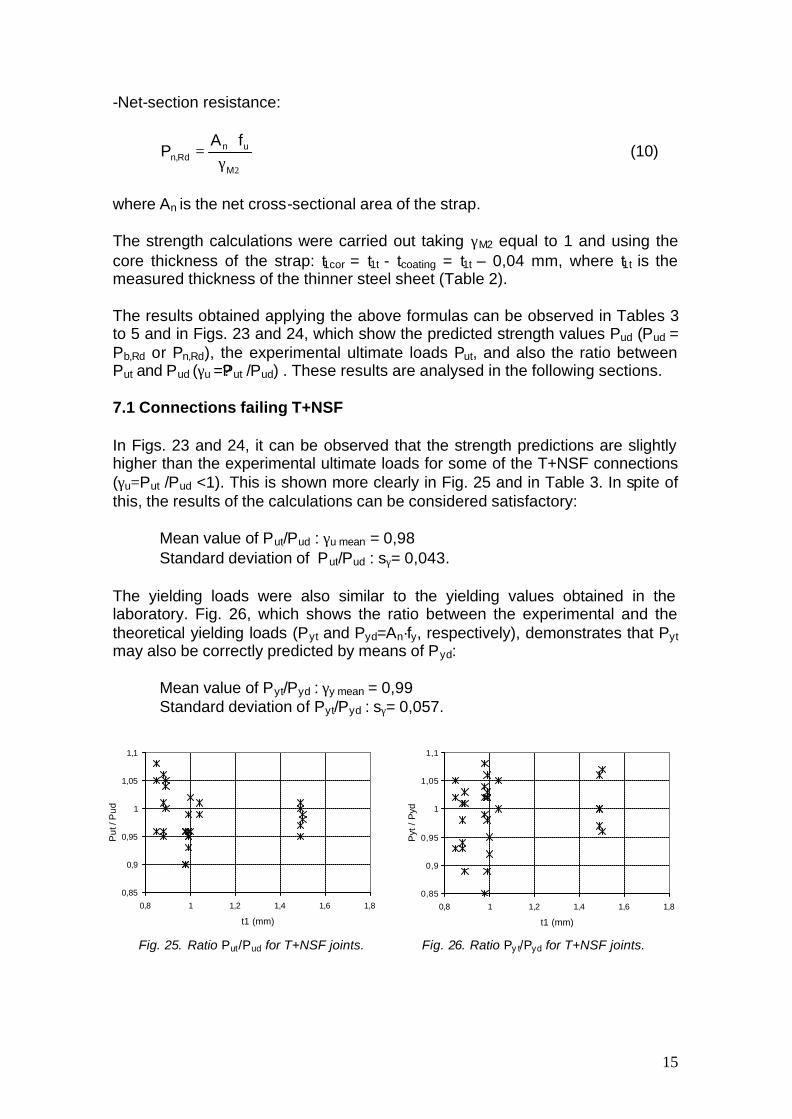
where An is the net cross-sectional area of the strap. The strength calculations were carried out taking γM2 equal to 1 and using the core thickness of the strap: t1cor = t1t - tcoating = t1t – 0,04 mm, where t1t is the measured thickness of the thinner steel sheet (Table 2). The results obtained applying the above formulas can be observed in Tables 3 to 5 and in Figs. 23 and 24, which show the predicted strength values Pud (Pud = Pb,Rd or Pn,Rd), the experimental ultimate loads Put, and also the ratio between Put and Pud (γu =?Put /Pud) . These results are analysed in the following sections. 7.1 Connections failing T+NSF In Figs. 23 and 24, it can be observed that the strength predictions are slightly higher than the experimental ultimate loads for some of the T+NSF connections (γu=Put /Pud <1). This is shown more clearly in Fig. 25 and in Table 3. In spite of this, the results of the calculations can be considered satisfactory: Mean value of Put/Pud : γu mean = 0,98
Standard deviation of Put/Pud : sγ= 0,043. The yielding loads were also similar to the yielding values obtained in the laboratory. Fig. 26, which shows the ratio between the experimental and the theoretical yielding loads (Pyt and Pyd=An·fy, respectively), demonstrates that Pyt may also be correctly predicted by means of Pyd: Mean value of Pyt/Pyd : γy mean = 0,99 Standard deviation of Pyt/Pyd : sγ= 0,057. Fig. 25. Ratio Put/Pud for T+NSF joints. Fig. 26. Ratio Py t/Pyd for T+NSF joints.
0,85
0,9
0,95
1
1,05
1,1
0,8 1 1,2 1,4 1,6 1,8
t1 (mm)
Put
/ P
ud
0,85
0,9
0,95
1
1,05
1,1
0,8 1 1,2 1,4 1,6 1,8
t1 (mm)
Pyt
/ P
yd
16
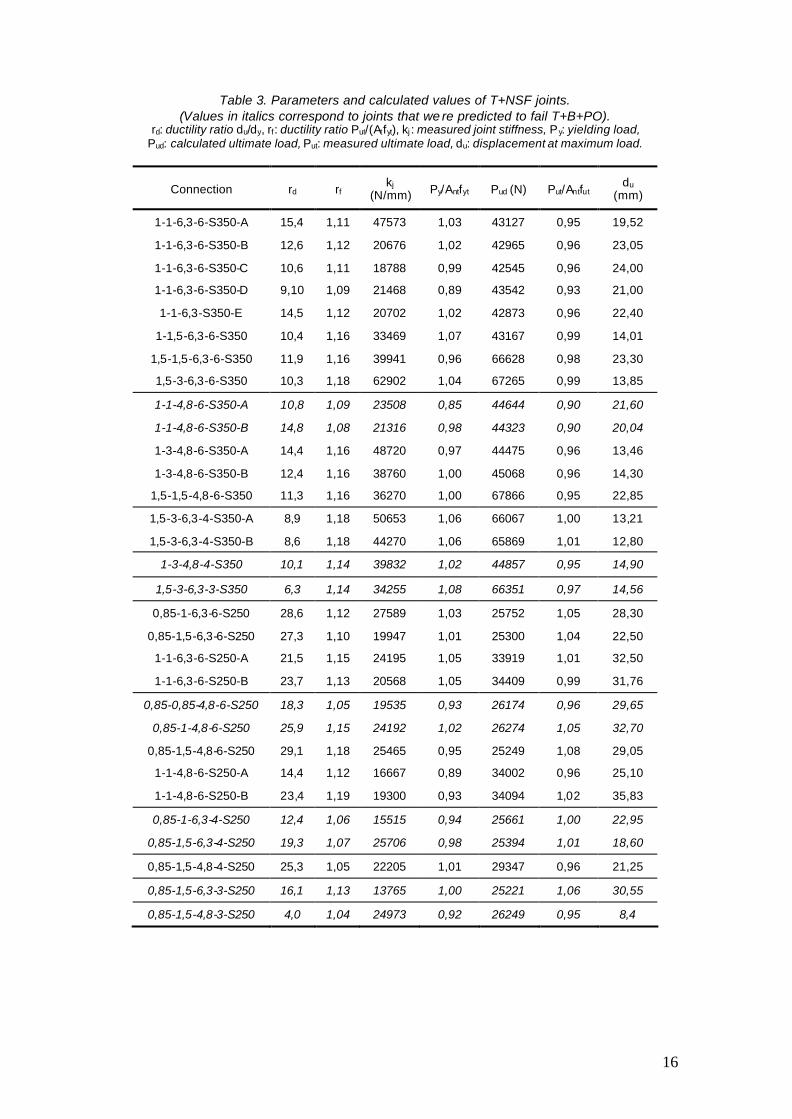
Table 3. Parameters and calculated values of T+NSF joints. (Values in italics correspond to joints that we re predicted to fail T+B+PO).
rd: ductility ratio du/dy, rf: ductility ratio Put/(Atfyt), kj : measured joint stiffness, Py: yielding load, Pud: calculated ultimate load, Put: measured ultimate load, du: displacement at maximum load.
Connection rd rf kj
(N/mm) Py/Antfyt Pud (N) Put/Antfut du
(mm)
1-1-6,3-6-S350-A 15,4 1,11 47573 1,03 43127 0,95 19,52
1-1-6,3-6-S350-B 12,6 1,12 20676 1,02 42965 0,96 23,05
1-1-6,3-6-S350-C 10,6 1,11 18788 0,99 42545 0,96 24,00
1-1-6,3-6-S350-D 9,10 1,09 21468 0,89 43542 0,93 21,00
1-1-6,3-S350-E 14,5 1,12 20702 1,02 42873 0,96 22,40
1-1,5-6,3-6-S350 10,4 1,16 33469 1,07 43167 0,99 14,01
1,5-1,5-6,3-6-S350 11,9 1,16 39941 0,96 66628 0,98 23,30
1,5-3-6,3-6-S350 10,3 1,18 62902 1,04 67265 0,99 13,85
1-1-4,8-6-S350-A 10,8 1,09 23508 0,85 44644 0,90 21,60
1-1-4,8-6-S350-B 14,8 1,08 21316 0,98 44323 0,90 20,04
1-3-4,8-6-S350-A 14,4 1,16 48720 0,97 44475 0,96 13,46
1-3-4,8-6-S350-B 12,4 1,16 38760 1,00 45068 0,96 14,30
1,5-1,5-4,8-6-S350 11,3 1,16 36270 1,00 67866 0,95 22,85
1,5-3-6,3-4-S350-A 8,9 1,18 50653 1,06 66067 1,00 13,21
1,5-3-6,3-4-S350-B 8,6 1,18 44270 1,06 65869 1,01 12,80
1-3-4,8-4-S350 10,1 1,14 39832 1,02 44857 0,95 14,90
1,5-3-6,3-3-S350 6,3 1,14 34255 1,08 66351 0,97 14,56
0,85-1-6,3-6-S250 28,6 1,12 27589 1,03 25752 1,05 28,30
0,85-1,5-6,3-6-S250 27,3 1,10 19947 1,01 25300 1,04 22,50
1-1-6,3-6-S250-A 21,5 1,15 24195 1,05 33919 1,01 32,50
1-1-6,3-6-S250-B 23,7 1,13 20568 1,05 34409 0,99 31,76
0,85-0,85-4,8-6-S250 18,3 1,05 19535 0,93 26174 0,96 29,65
0,85-1-4,8-6-S250 25,9 1,15 24192 1,02 26274 1,05 32,70
0,85-1,5-4,8-6-S250 29,1 1,18 25465 0,95 25249 1,08 29,05
1-1-4,8-6-S250-A 14,4 1,12 16667 0,89 34002 0,96 25,10
1-1-4,8-6-S250-B 23,4 1,19 19300 0,93 34094 1,02 35,83
0,85-1-6,3-4-S250 12,4 1,06 15515 0,94 25661 1,00 22,95
0,85-1,5-6,3-4-S250 19,3 1,07 25706 0,98 25394 1,01 18,60
0,85-1,5-4,8-4-S250 25,3 1,05 22205 1,01 29347 0,96 21,25
0,85-1,5-6,3-3-S250 16,1 1,13 13765 1,00 25221 1,06 30,55
0,85-1,5-4,8-3-S250 4,0 1,04 24973 0,92 26249 0,95 8,4
17
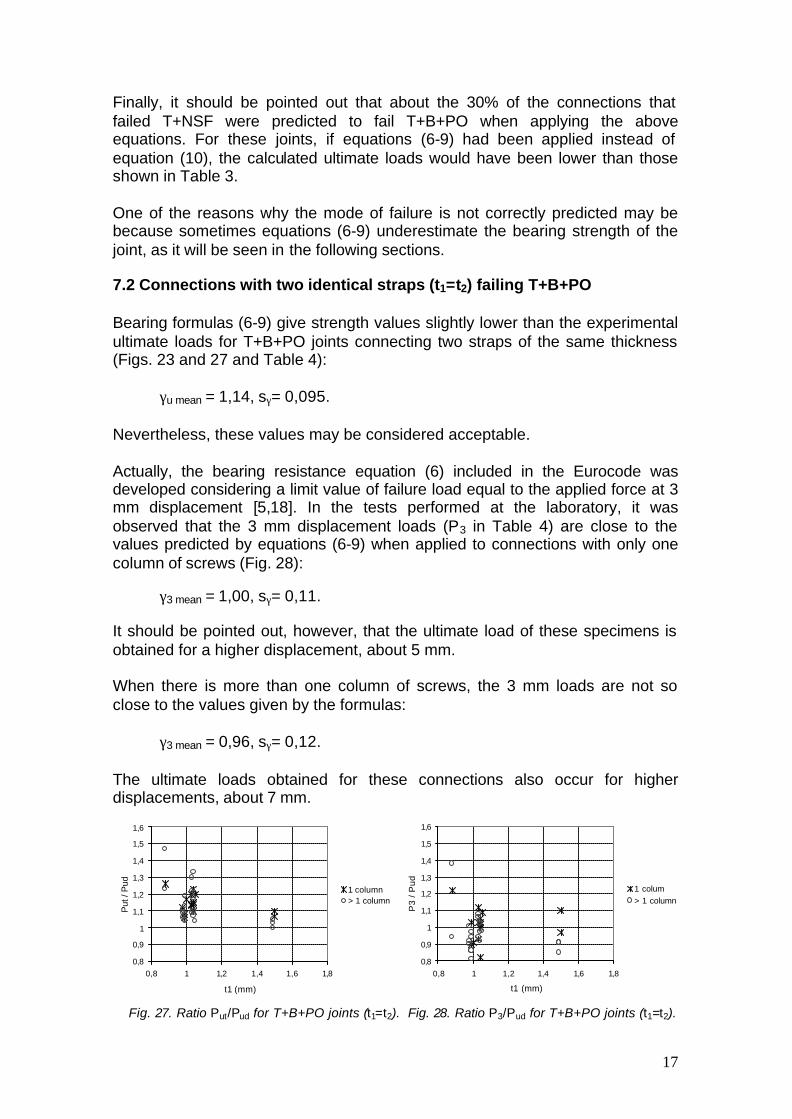
Finally, it should be pointed out that about the 30% of the connections that failed T+NSF were predicted to fail T+B+PO when applying the above equations. For these joints, if equations (6-9) had been applied instead of equation (10), the calculated ultimate loads would have been lower than those shown in Table 3. One of the reasons why the mode of failure is not correctly predicted may be because sometimes equations (6-9) underestimate the bearing strength of the joint, as it will be seen in the following sections. 7.2 Connections with two identical straps (t1=t2) failing T+B+PO Bearing formulas (6-9) give strength values slightly lower than the experimental ultimate loads for T+B+PO joints connecting two straps of the same thickness (Figs. 23 and 27 and Table 4): γu mean = 1,14, sγ= 0,095. Nevertheless, these values may be considered acceptable. Actually, the bearing resistance equation (6) included in the Eurocode was developed considering a limit value of failure load equal to the applied force at 3 mm displacement [5,18]. In the tests performed at the laboratory, it was observed that the 3 mm displacement loads (P3 in Table 4) are close to the values predicted by equations (6-9) when applied to connections with only one column of screws (Fig. 28): γ3 mean = 1,00, sγ= 0,11. It should be pointed out, however, that the ultimate load of these specimens is obtained for a higher displacement, about 5 mm. When there is more than one column of screws, the 3 mm loads are not so close to the values given by the formulas: γ3 mean = 0,96, sγ= 0,12. The ultimate loads obtained for these connections also occur for higher displacements, about 7 mm.
Fig. 27. Ratio Put/Pud for T+B+PO joints (t1=t2). Fig. 28. Ratio P3/Pud for T+B+PO joints (t1=t2).
0,8
0,9
1
1,1
1,2
1,3
1,4
1,5
1,6
0,8 1 1,2 1,4 1,6 1,8
t1 (mm)
Put
/ P
ud
1 column> 1 column
0,8
0,9
1
1,1
1,2
1,3
1,4
1,5
1,6
0,8 1 1,2 1,4 1,6 1,8
t1 (mm)
P3
/ Pud
1 colum> 1 column
18
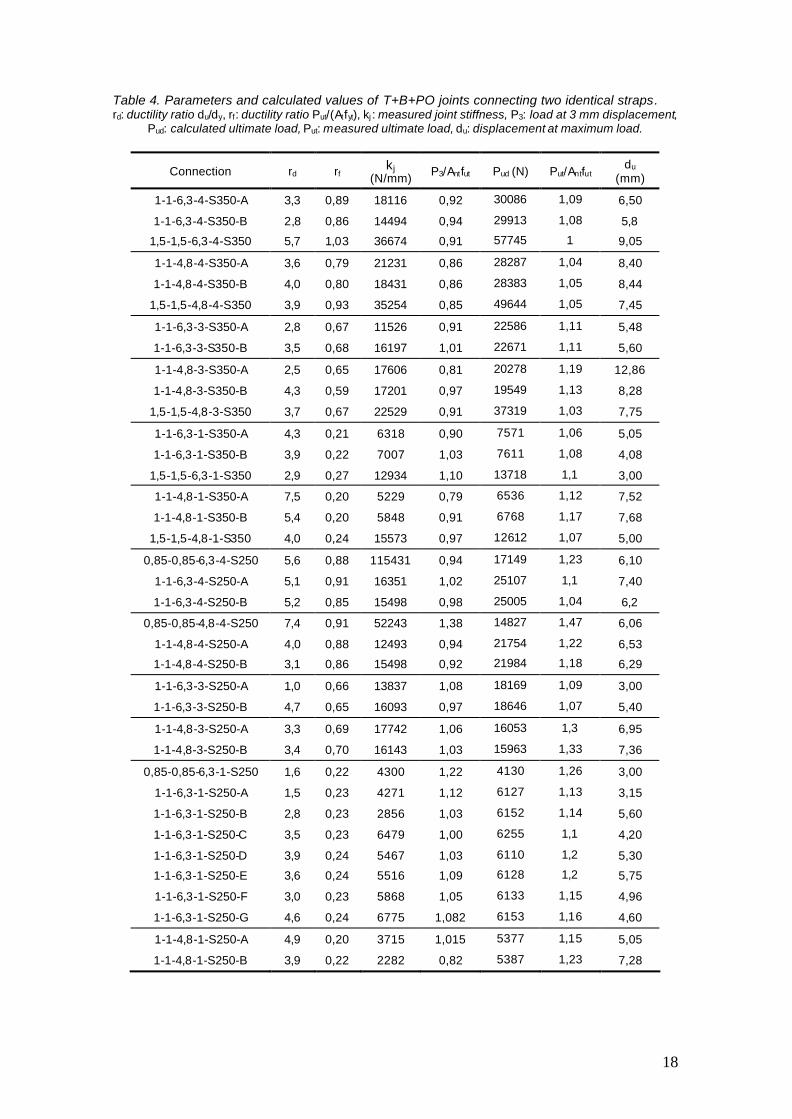
Table 4. Parameters and calculated values of T+B+PO joints connecting two identical straps. rd: ductility ratio du/dy, rf: ductility ratio Put/(Atfyt), kj : measured joint stiffness, P3: load at 3 mm displacement,
Pud: calculated ultimate load, Put: measured ultimate load, du: displacement at maximum load.
Connection rd rf kj (N/mm) P3/Antfut Pud (N) Put/Antfut
du (mm)
1-1-6,3-4-S350-A 3,3 0,89 18116 0,92 30086 1,09 6,50
1-1-6,3-4-S350-B 2,8 0,86 14494 0,94 29913 1,08 5,8
1,5-1,5-6,3-4-S350 5,7 1,03 36674 0,91 57745 1 9,05
1-1-4,8-4-S350-A 3,6 0,79 21231 0,86 28287 1,04 8,40
1-1-4,8-4-S350-B 4,0 0,80 18431 0,86 28383 1,05 8,44
1,5-1,5-4,8-4-S350 3,9 0,93 35254 0,85 49644 1,05 7,45
1-1-6,3-3-S350-A 2,8 0,67 11526 0,91 22586 1,11 5,48
1-1-6,3-3-S350-B 3,5 0,68 16197 1,01 22671 1,11 5,60
1-1-4,8-3-S350-A 2,5 0,65 17606 0,81 20278 1,19 12,86
1-1-4,8-3-S350-B 4,3 0,59 17201 0,97 19549 1,13 8,28
1,5-1,5-4,8-3-S350 3,7 0,67 22529 0,91 37319 1,03 7,75
1-1-6,3-1-S350-A 4,3 0,21 6318 0,90 7571 1,06 5,05
1-1-6,3-1-S350-B 3,9 0,22 7007 1,03 7611 1,08 4,08
1,5-1,5-6,3-1-S350 2,9 0,27 12934 1,10 13718 1,1 3,00
1-1-4,8-1-S350-A 7,5 0,20 5229 0,79 6536 1,12 7,52
1-1-4,8-1-S350-B 5,4 0,20 5848 0,91 6768 1,17 7,68
1,5-1,5-4,8-1-S350 4,0 0,24 15573 0,97 12612 1,07 5,00
0,85-0,85-6,3-4-S250 5,6 0,88 115431 0,94 17149 1,23 6,10
1-1-6,3-4-S250-A 5,1 0,91 16351 1,02 25107 1,1 7,40
1-1-6,3-4-S250-B 5,2 0,85 15498 0,98 25005 1,04 6,2
0,85-0,85-4,8-4-S250 7,4 0,91 52243 1,38 14827 1,47 6,06
1-1-4,8-4-S250-A 4,0 0,88 12493 0,94 21754 1,22 6,53
1-1-4,8-4-S250-B 3,1 0,86 15498 0,92 21984 1,18 6,29
1-1-6,3-3-S250-A 1,0 0,66 13837 1,08 18169 1,09 3,00
1-1-6,3-3-S250-B 4,7 0,65 16093 0,97 18646 1,07 5,40
1-1-4,8-3-S250-A 3,3 0,69 17742 1,06 16053 1,3 6,95
1-1-4,8-3-S250-B 3,4 0,70 16143 1,03 15963 1,33 7,36
0,85-0,85-6,3-1-S250 1,6 0,22 4300 1,22 4130 1,26 3,00
1-1-6,3-1-S250-A 1,5 0,23 4271 1,12 6127 1,13 3,15
1-1-6,3-1-S250-B 2,8 0,23 2856 1,03 6152 1,14 5,60
1-1-6,3-1-S250-C 3,5 0,23 6479 1,00 6255 1,1 4,20
1-1-6,3-1-S250-D 3,9 0,24 5467 1,03 6110 1,2 5,30
1-1-6,3-1-S250-E 3,6 0,24 5516 1,09 6128 1,2 5,75
1-1-6,3-1-S250-F 3,0 0,23 5868 1,05 6133 1,15 4,96
1-1-6,3-1-S250-G 4,6 0,24 6775 1,082 6153 1,16 4,60
1-1-4,8-1-S250-A 4,9 0,20 3715 1,015 5377 1,15 5,05
1-1-4,8-1-S250-B 3,9 0,22 2282 0,82 5387 1,23 7,28
19
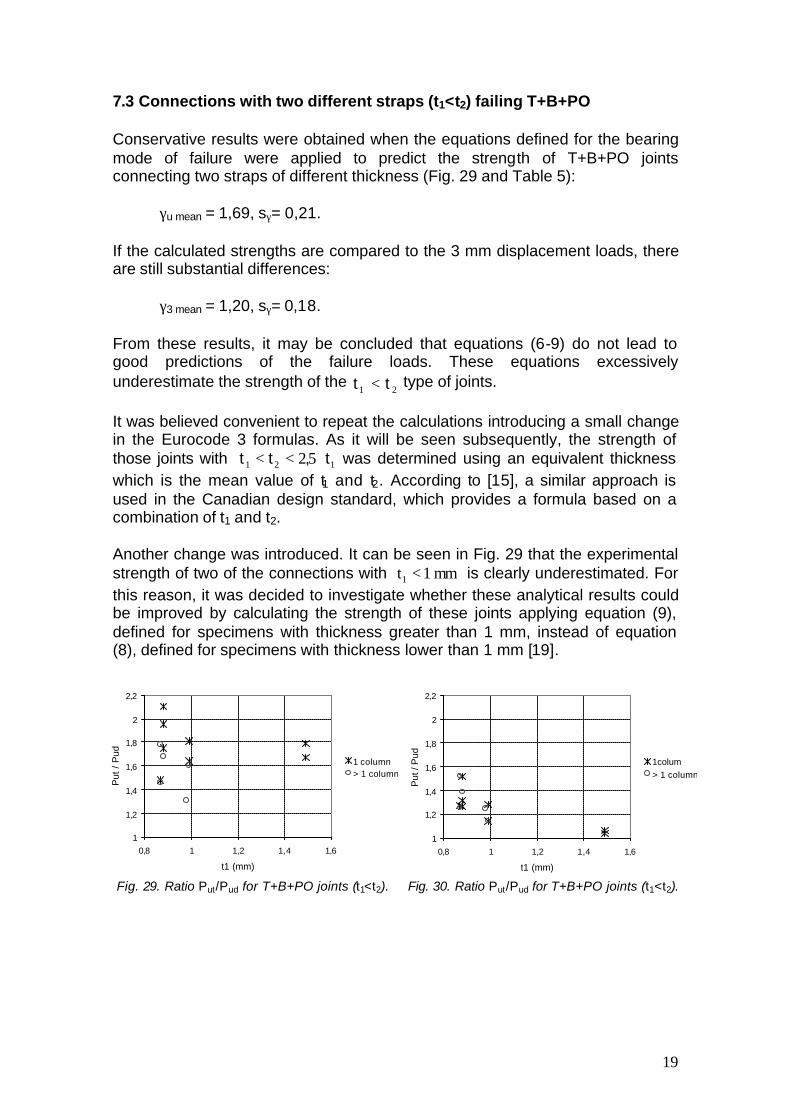
7.3 Connections with two different straps (t1<t2) failing T+B+PO Conservative results were obtained when the equations defined for the bearing mode of failure were applied to predict the strength of T+B+PO joints connecting two straps of different thickness (Fig. 29 and Table 5): γu mean = 1,69, sγ= 0,21. If the calculated strengths are compared to the 3 mm displacement loads, there are still substantial differences: γ3 mean = 1,20, sγ= 0,18. From these results, it may be concluded that equations (6-9) do not lead to good predictions of the failure loads. These equations excessively underestimate the strength of the
21 tt < type of joints. It was believed convenient to repeat the calculations introducing a small change in the Eurocode 3 formulas. As it will be seen subsequently, the strength of those joints with 121 52 t,tt ⋅<< was determined using an equivalent thickness which is the mean value of t1 and t2. According to [15], a similar approach is used in the Canadian design standard, which provides a formula based on a combination of t1 and t2. Another change was introduced. It can be seen in Fig. 29 that the experimental strength of two of the connections with mm1t1 < is clearly underestimated. For this reason, it was decided to investigate whether these analytical results could be improved by calculating the strength of these joints applying equation (9), defined for specimens with thickness greater than 1 mm, instead of equation (8), defined for specimens with thickness lower than 1 mm [19]. Fig. 29. Ratio Put/Pud for T+B+PO joints (t1<t2). Fig. 30. Ratio Put/Pud for T+B+PO joints (t1<t2).
1
1,2
1,4
1,6
1,8
2
2,2
0,8 1 1,2 1,4 1,6
t1 (mm)
Put
/ P
ud
1 column> 1 column
1
1,2
1,4
1,6
1,8
2
2,2
0,8 1 1,2 1,4 1,6
t1 (mm)
Put
/ P
ud
1colum> 1 column
20
Table 5. Parameters and calculated values of T+B+PO joints connecting two different straps. rd: ductility ratio du/dy, rf: ductility ratio Put/(Atfyt), kj : measured joint stiffness, P3: load at 3 mm displacement,
Pud: calculated ultimate load, Put: measured ultimate load, du: failure load displacement.
Connection rd rf kj
(N/mm) P3/Anfu Pud (N) Put/Anfu du
(mm)
1-1,5-4,8-3-S350 5,2 0,98 20490 1,06 22761 1,60 11,05
1-3-4,8-3-S350 4,9 1,00 18295 1,19 28086 1,31 8,40
1-1,5-6,3-1-S350 6,3 0,40 10570 1,16 9073 1,64 6,50
1,5-3-6,3-1-S350-A 9,2 0,55 51171 1,36 17415 1,79 7,55
1,5-3-6,3-1-S350-B 9,9 0,54 17071 0, 77 18207 1,67 9,94
1-1,5-4,8-1-S350 8,0 0,37 8524 1,14 7580 1,81 8,25
0,85-1-4,8-4-S250 12,9 1,05 17496 0,89 14943 1,68 20,69
0,85-1-6,3-3-S250 4,9 0,84 10110 1,23 13703 1,46 8,80
0,85-1-4,8-3-S250 4,1 0,86 13956 1,20 11561 1,78 8,70
0,85-1-6,3-1-S250 6,4 0,28 4410 1,07 4518 1,48 6,50
0,85-1,5-6,3-1-S250 13,3 0,51 5923 1,36 5797 2,11 19,45
0,85-1-4,8-1-S250 7,0 0,28 5824 1,11 3886 1,75 7,11
0,85-1,5-4,8-1-S250 4,7 0,39 19531 1,62 4795 1,95 4,3
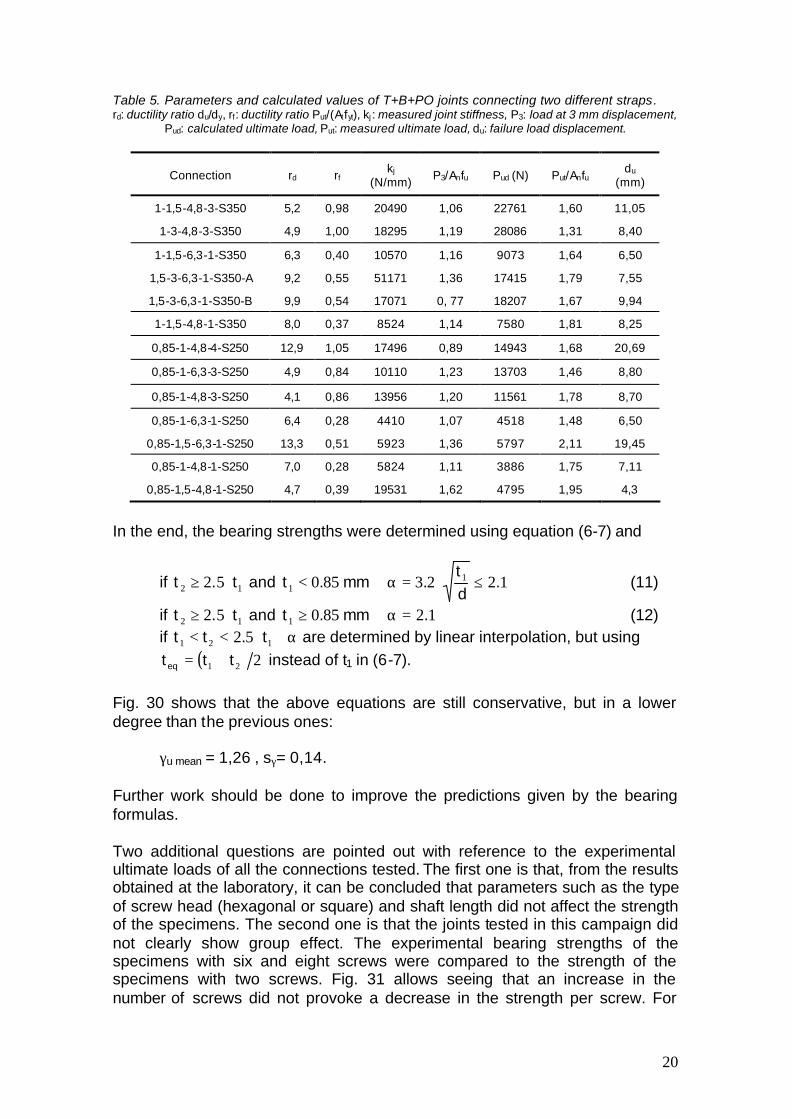
In the end, the bearing strengths were determined using equation (6-7) and
if 12 52 t.t ⋅≥ and mm.t 8501 < 1223 1 .dt
. ≤⋅=α (11)
if 12 52 t.t ⋅≥ and mm.t 8501 ≥ 12.=α (12) if 121 52 t.tt ⋅<< α are determined by linear interpolation, but using
( ) 221 ttt eq += instead of t1 in (6-7).
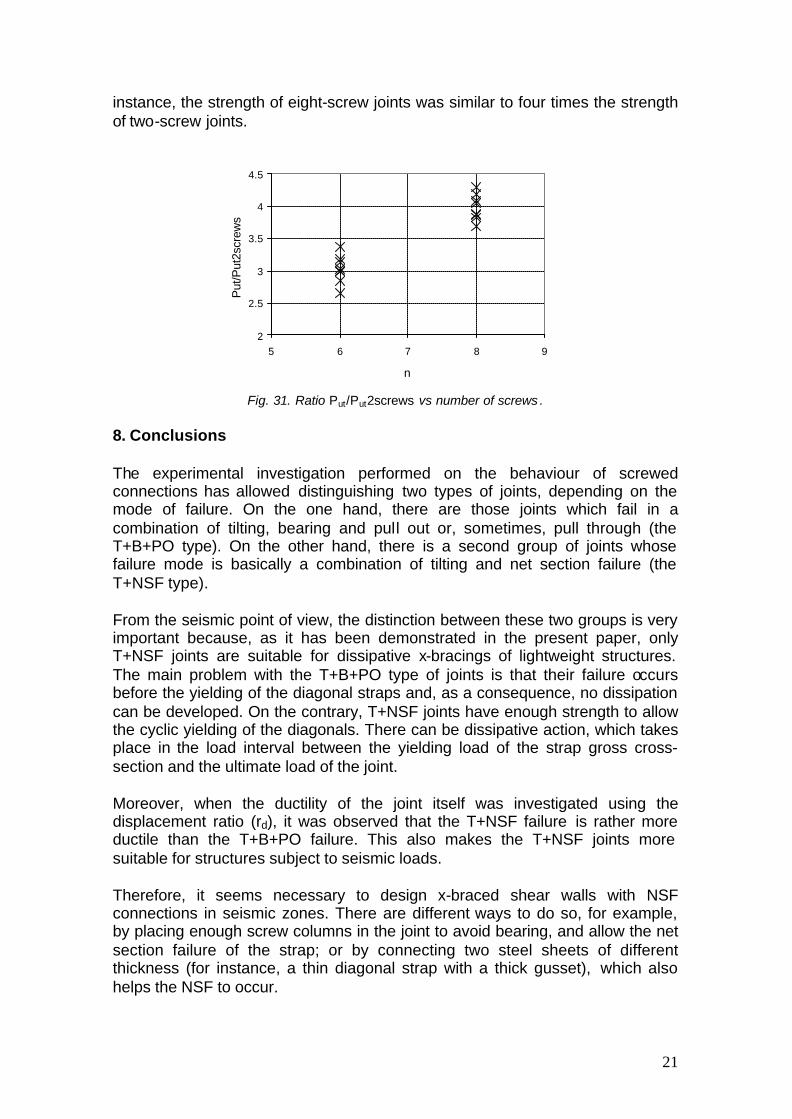
Fig. 30 shows that the above equations are still conservative, but in a lower degree than the previous ones: γu mean = 1,26 , sγ= 0,14. Further work should be done to improve the predictions given by the bearing formulas. Two additional questions are pointed out with reference to the experimental ultimate loads of all the connections tested. The first one is that, from the results obtained at the laboratory, it can be concluded that parameters such as the type of screw head (hexagonal or square) and shaft length did not affect the strength of the specimens. The second one is that the joints tested in this campaign did not clearly show group effect. The experimental bearing strengths of the specimens with six and eight screws were compared to the strength of the specimens with two screws. Fig. 31 allows seeing that an increase in the number of screws did not provoke a decrease in the strength per screw. For
21
instance, the strength of eight-screw joints was similar to four times the strength of two-screw joints.
Fig. 31. Ratio Put/Put2screws vs number of screws .
8. Conclusions The experimental investigation performed on the behaviour of screwed connections has allowed distinguishing two types of joints, depending on the mode of failure. On the one hand, there are those joints which fail in a combination of tilting, bearing and pull out or, sometimes, pull through (the T+B+PO type). On the other hand, there is a second group of joints whose failure mode is basically a combination of tilting and net section failure (the T+NSF type). From the seismic point of view, the distinction between these two groups is very important because, as it has been demonstrated in the present paper, only T+NSF joints are suitable for dissipative x-bracings of lightweight structures. The main problem with the T+B+PO type of joints is that their failure occurs before the yielding of the diagonal straps and, as a consequence, no dissipation can be developed. On the contrary, T+NSF joints have enough strength to allow the cyclic yielding of the diagonals. There can be dissipative action, which takes place in the load interval between the yielding load of the strap gross cross-section and the ultimate load of the joint. Moreover, when the ductility of the joint itself was investigated using the displacement ratio (rd), it was observed that the T+NSF failure is rather more ductile than the T+B+PO failure. This also makes the T+NSF joints more suitable for structures subject to seismic loads. Therefore, it seems necessary to design x-braced shear walls with NSF connections in seismic zones. There are different ways to do so, for example, by placing enough screw columns in the joint to avoid bearing, and allow the net section failure of the strap; or by connecting two steel sheets of different thickness (for instance, a thin diagonal strap with a thick gusset), which also helps the NSF to occur.
2
2.5
3
3.5
4
4.5
5 6 7 8 9
n
Put
/Put
2scr
ews
22
Another of the objectives of the experimental investigation was to study the force-displacement curves that resulted from the tests. The identification of the different types of curves and their characteristic parameters is required for finite element modelling. One of the main conclusions of this study was that to correctly model the behaviour of a NSF connection, both the elastic stiffness and the tangent stiffness of the joint and the strap must be taken into account. The last step of the experimental analysis was to compare the test ultimate loads and their corresponding design strengths, calculated according to the Eurocode 3 Part 1.3. It was verified that the equation defined for the net section failure gives satisfactory strength values. The bearing formulas also result in acceptable predictions of the ultimate loads, but only when they are applied to joints connecting two straps of the same thickness. When the thickness of the straps is different, very conservative design loads are obtained. It is believed that the main drawback of these formulas is that they do not appropriately take into account the thickness of the thicker strap. Finally, it should be pointed out that the experimental ultimate loads of the joints that fail T+B+PO occur for displacements higher than 3 mm, which is the reference value of the ECCS standards. Actually, the displacements corresponding to experimental strengths range from about 5 mm to 7 mm, depending on the number of screw columns. The collapse of the joint takes place later than expected and also for higher loads, which favours the appearance of the NSF mode of failure. This paper has presented the results of an investigation on screwed joints in straps. These results are part of the outcome of an experimental campaign which has a broader scope. It includes tests on bolted joints, stud-track corner joints and x-braced frames. In future contributions we intend to describe the results of these tests. References [1] De Matteis G, Landolfo R. Diaphragm action of sandwich panels in pin- joined steel structures: a seismic study. Journal of Earthquake Engineering 2000; 4(8):251-275.
[2] Fülöp LA, Dubina D. Performance of wall-stud cold-formed shear panels under monotonic and cyclic loading. Part I: Experimental research. Thin- Walled Structures 2004, 42(2):321-228.
[3] Technical Instructions. Design of Cold-Formed Loadbearing Steel Systems and Masonry Veneer / Steel Stud Walls. US Army Corps of Engineers, TI 809-07, 30 November 1998.
[4] Tomà AW. Developments in connections in cold -formed building structures and design specifications. Progress in Structural Engineering and Materials 2003; 5:145-152.
[5] Di Lorenzo G, Landolfo R. Shear experimental response of new connecting systems for cold-formed structures. Journal of Constructional Steel Research 2004; 60:561-579.
23
[6] Lennon R, Pedreschi R, Sinha BP. Comparative study of some mechanical connections in cold formed steel. Construction and Building Materials 1999; 13: 109-116.
[7] Pedreschi RF, Shina BP, Davies RJ, End fixity in cold-formed steel sections using press joining. Thin-Walled Structures 1997; 29(1-4):257-271.
[8] Kolari K. Load-sharing of press-joints in thin-walled steel structures. Fourth International Conference on Steel and Aluminium Structures, Light-Weight Steel and Aluminium Structures (ICSAS 99), Espoo 1999;577-584.
[9] Mäkeläinen P, Kesti J. Advanced method for lightweight steel joining. Journal of Constructional Steel Research 1999; 49:107-116.
[10] Mäkeläinen P, Kesti J, Lu W, Pasternak H, Komann S. Static and cyclic shear behaviour of the rosette-joint. Fourth International Conference on Steel and Aluminium Structures, Light-Weight Steel and Aluminium Structures (ICSAS 99), Espoo 1999; 586-592.
[11] Pastor N, Rodríguez-Ferran A. Hysteretic modelling of x-braced shear walls. Thin-Walled Structures 2005; 43(10):1567-1588.
[12] Eurocode 3: Design of steel structures - Part 1-3: General rules – supplementary rules for cold-formed members and sheeting. CEN European Committee for Standardisation, Brussels, 2004 (Draft).
[13] Morro T, Experimental campaign of shear connections used in light-gauge steel structures, Final Degree Thesis, Universitat Politècnica de Catalunya; 2004 (in Catalan).
[14] Yu WW. Cold-Formed Steel Design, 3rd Edition. Wiley; 2000.
[15] Rogers CA, Hancock GJ. Screwed connection tests of thin G550 and G300 sheet steels. Journal of Structural Engineering 1999; 125(2):128-136.
[16] LaBoube RA, Sokol MA. Behaviour of screw connections in residential construction. Journal of Structural Engineering 2002; 128(1):115-118.
[17] prEN 1998-1. Eurocode 8: Design of structures for earthquake resistance. Part 1. General rules, seismic actions and rules for buildings. CEN European Committee for standardization. Brussels, 2002 (Draft).
[18] Technical Committee 7. European Recommendations for the Testing of Connections in Profiled Steel Sheeting and Sections. ECCS publication no. 21. May 1983.
[19] Sala M, Screwed connections in light-gauge steel structures, Final Degree Thesis, Universitat Politècnica de Catalunya; 2004 (in Spanish).