Embed Size (px)
Citation preview

Executive summary
Health-care systems play a crucial role in supporting human health. They also have
major macroeconomic implications, an aspect that is not always properly acknowledged.
Countries spend very different amounts on healthcare, with spending in North America
(Canada and the United States) more than twice as much per capita as in the European Union
on average, and there are significant differences between EU countries too. Various explan-
atory factors such as income levels, population age structures and epidemiological profiles
cannot explain the differences between countries. Decisions on the optimal level of spending
should also consider various others factor, including the macroeconomic implications of
health-care systems.
Whatever amount is spent on health care, it should be spent efficiently, in order not to
waste resources and to improve the macroeconomic impacts. We demonstrate that there
are threshold effects whereby certain quantitative indicators of health tend to improve with
increased spending only up to certain amount of spending, but not further. Using a standard
method to measure efficiency, data envelopment analysis (DEA), we find significant differ-
ences between countries, suggesting that not all countries use existing technologies and best
practices to their full potential. This finding calls for policy responses.
Health-care systems matter for the macroeconomy because of their large size in
output, employment and research. They also have direct fiscal implications in terms of the
long-term sustainability of public finances, while health-care spending decisions influence
short-term economic development through the fiscal multiplier effect, which is substantial.
Most southern European countries cut health-care spending aggressively in recent years, like-
ly amplifying the depth of their recessions and possibly causing hysteresis effects from long-
term unemployment and reduced productivity. Fiscal consolidation strategies should aim to
preserve spending items that have large fiscal multipliers, including health-care expenditures.
Health-care systems also influence labour force participation, productivity and human
capital formation through various channels, and thereby have an influence on overall macro-
economic outcomes. They also play an important role in inequality, and we find that inequal-
ity of access to health care is particularly high in about one-third of EU countries, which calls
for policy responses.
It is essential that discussions of health systems consider both the opportunity cost and
the economic value of investing in health. Such an approach can help policymakers resist the
temptation to default to the potentially inefficient status quo.
Policy Contribution Issue n˚11 | August 2018 The macroeconomic
implications of healthcare
Zsolt Darvas, Nicolas Moës, Yana Myachenkova and David Pichler
Zsolt Darvas (zsolt.
[email protected]) is a
Senior Fellow at Bruegel.
Nicolas Moës (nicolas.
a Research Assistant at
Bruegel.
Yana Myachenkova
(yana.myachenkova@
bruegel.org) is a Research
Assistant at Bruegel.
David Pichler (david.
a Research Assistant at
Bruegel.
2 Policy Contribution | Issue n˚11 | August 2018
1 IntroductionHealth-care systems play a crucial role in supporting human health1. But health-care systems
also have major macroeconomic implications, an aspect that is not always properly acknowl-
edged. These implications include feedback effects on public revenues and expenditures.
Neglecting the macroeconomic impacts of health-care systems could lead to suboptimal
allocation of scarce public resources.
In the European Union, the human health and social work activities sector represents about
7.4 percent of total value added and 10.6 percent of total employment2. Furthermore, closely
connected to health care, the pharmaceutical sector heavily invests in long-term projects to
research and develop new drugs and processes. Among the top 1000 R&D investors in the EU,
19 percent of total R&D spending is by pharmaceutical and biotechnology companies3.
Beyond the sheer importance of health-care sectors, they exert various direct and indirect
effects on the macroeconomy. Their fiscal implications include their influence on fiscal
sustainability and economic development via public spending decisions. They influence the
labour market in terms of labour force participation, human capital formation, productivity
and inequality. It is therefore crucial to analyse the broader macroeconomic implications of
health-care spending decisions.
Health-care expenditure relative to GDP in the EU has increased in recent decades. Ageing
populations require higher spending, since older people typically use health-care services at a
much higher rate than young people. The deployment of new and more efficient technologies
involves higher costs. The cost of health care as a share of GDP could be twice as much by
2050 as it is now unless reforms are undertaken (Maisonneuve and Martins, 2013).
It is also important to emphasise that health-care systems are organised differently in dif-
ferent countries. A particular aspect is the difference between publicly and privately financed
expenditure, but there are further differences even within the publicly and privately financed
parts of health-care systems (Figure 1). Against this background, this Policy Contribution
tackles three questions:
• How should the optimal level of the public-sector health-care budget be determined? Dif-
ferent countries spend very different amounts (relative to GDP and population) on health
care. We highlight the most important aspects and the various trade-offs that arise from
the presence of multiple objectives and limited resources.
• How efficient are health-care systems in the EU? Whatever amount is allocated to health
care, it should be spent efficiently. We therefore look at the literature on measuring
health-care system efficiency and provide estimates comparing European Union coun-
tries with each other and some other countries. More efficient health-care systems have
better macroeconomic impacts.
• What are the macroeconomic implications of health-care systems? The macro impact of
health-care systems stems not only from their relatively large sizes, but also from their
outcomes. We argue that a proper consideration of the macro implications of health care
systems should be an important aspect of health-care spending decisions.
1 World Health Organisation (2000) defines health system activities as “all the activities whose primary purpose is to
promote, restore or maintain health”, while Murray and Frenk (2000) present a conceptual framework organising
the health system into different pools of activities, which are financing, provision, resource generation and stew-
ardship. In this Policy Contribution we take a similarly broad view of the health system.
2 In 2016. Source: Eurostat [nama_10_a64], NACE sector Q ‘Human health and social work activities’, which includes
various human health activities, residential care activities, social accommodation and work for the elderly and
disabled, childcare and various other activities such as social, counselling, welfare, refugee, referral and similar
services which are delivered to individuals and families in their homes or elsewhere and carried out by govern-
ment offices or by private organisations, disaster relief organisations and national or local self-help organisations
and by specialists providing counselling services.
3 Source: 2016 EU Industrial R&D Investment Scoreboard, http://iri.jrc.ec.europa.eu/scoreboard16.html.

3 Policy Contribution | Issue n˚11 | August 2018
Figure 1: Current health expenditure by type of financing (% of total), 2014
Source: Bruegel based on OECD Health Statistics 2016; Eurostat database; WHO, Global Health Expenditure database. Note: * 1: includes
investment
2 The optimal level of health spending: the key factors
Decisions on the optimal level of public spending on health care first require a clarification of
the objectives of the health-care system. An abundant health-care literature discusses various
objectives and relevant performance indicators to measure progress towards these objectives.
However, in this literature it is rare to find objectives derived from first principles that can
guide policymaking discussions on this topic. The various objectives proposed by some works
overlap to a great extent, and some are not goals in themselves but are rather instrumental
goals. Some objectives are broad (eg ‘Progressiveness’), while others are very specific indica-
tors (eg ‘Reduction in prescriptions of long-acting benzodiazepines for elderly patients’). It is
therefore interesting to turn to Murray and Frenk (2000) for their discussion of instrumental
versus ultimate goals for health systems. They conclude that there are effectively three overall
objectives4:
• Improving health: a health system should aim to improve health, as otherwise society
would not invest in a health system in the first place.
4 Hsiao and Heller (2007) took an economic perspective and concluded with similar goals: improving health, avoid-
ing impoverishment due to healthcare and public satisfaction.
7
84
12
83
8 5 4
79
15
37
411
31
76
10
62
39
3
65 69 67
10 9
6560
28
9
44
74
52
21 19
5 4 6 9
78
0
72
0
7476 76
0
64
42
7566
45
0
66
13
73 6268
5 0 2
57 58
1
0
31
44
1
11
29
56
47
58 58 51 41
13 14 13 1611 12
1815 20
157
18 18 22 23 19 17 2213
2515
29 31 28 28 39 35 46
50
1417
18
2737 37 43
50
1 2 0 15 6
0 4 0 514
4 51 0
3 8 415
5
13
2 1 3 51 4 0
40 0
0 70 0 0 0
0%
10%
20%
30%
40%
50%
60%
70%
80%
90%
100%
Germ
any
Denm
ark
Czec
h Re
publ
icSw
eden
Luxe
mbo
urg
Neth
erla
nds
Slov
ak R
epub
licUn
ited
King
dom
Rom
ania
EU28
Fran
ceBe
lgiu
mAu
stria
Italy
Esto
nia
Fin l
and
Croa
tiaPo
land
Slov
enia
Spai
nIre
land
Mal
ta¹
Lith
uani
aHu
ngar
yPo
rtuga
lLa
tvia
Gree
ceBu
lgar
iaCy
prus
Norw
ayIc
elan
d¹Tu
rkey
Switz
erla
ndRe
pu. o
f Nor
th M
aced
onia
¹Se
rbia
¹M
onte
negr
o¹Al
bani
a¹
Government schemes Compulsory health insurance Out-of-pocket
Voluntary health insurance Other

4 Policy Contribution | Issue n˚11 | August 2018
• Community satisfaction: as for all community-wide services, it should be responsive to
the community’s preferences in terms of respect for patients, quality of facilities, privacy
and other non-health aspects.
• Accessibility: fair contributions by all to the health system should be ensured, similar to
other community-wide public goods.
The State of Health in the EU: Companion Report (European Commission, 2017) also
makes the distinction between the ultimate goals and instrumental goals of EU health sys-
tems. Ultimately, the aim is to improve population health. However, the report also highlights
effectiveness (quality, outcomes and experience), accessibility and resilience as the interme-
diary objectives to be fulfilled (European Commission, 2017). The prevalence of the resilience
goal in today’s European health-care policy discussion highlights policymakers’ concerns
about health system-related fiscal sustainability (see section 4.1).
Quantitative measurement of progress towards the objectives faces several difficulties,
though there have been many efforts to use comparable and informative indicators, as
illustrated by for example the health system performance assessment literature (Carinci et
al, 2015; Braithwaite et al, 2017; Simon et al, 2017). Arah et al (2006) identified 15 indicators
used in performance assessment frameworks used in various countries and international
institutions. These are derived from existing assessment methods in various countries and are
therefore closer to policymakers’ needs for information they can act on. More recently, Euro-
pean Commission (2017) highlighted key indicators of progress towards some of the health
systems’ instrumental objectives5.
Keeping the objectives in mind, we can identify the information needed to determine the
optimal level of health spending as:
• Population:
− Income;
− Preferences for health relative to other aspects of life;
− Age structure and epidemiological profile of the population.
• Health systems:
− Relative price of different health-enhancing activities and technologies;
− Relative price of health relative to other aspects of life;
− Market failures: 1. Asymmetric information between providers and patients; and 2.
Adverse selection in insurance markets;
− Effectiveness at improving health outcomes, ensuring accessibility and satisfying
current population’s desires;
− The extent of private healthcare spending and population preferences for the public/
private mix and the consent level of taxation.
• Macroeconomic implications of health;
• Policies affecting the aspects listed above.
We discuss these points in turn.
A country’s average income is a key determinant of health-care spending, but is far from
the only one. Per-capita annual health-care expenditure (in purchasing power parity terms)
5 The key indicators for effectiveness are amenable mortality (or deaths from potentially preventable diseases),
avoidable hospital admissions, presence of prevention measures and patient-reported outcomes. Accessibility
can be evaluated using share of the population declaring unmet needs for medical examination (for financial
reasons, because of waiting lists or distance), health inequalities across the income distribution, and out-of-pocket
expenditures. Resilience is indicated by the use of Health Technology Assessment, low rates of avoidable hospital
admissions, cost-effective use of medicines, use of budgetary and performance-based planning tools, and better
integrated health systems (European Commission, 2017).

5 Policy Contribution | Issue n˚11 | August 2018
ranges from as low as about $200 in sub-Saharan Africa and South Asia (two regions with
rather low GDP per capita), to more than $9,000 in North America (where GDP per capita is
the highest among the world regions) (Table 1). Average health-care spending in the EU is
$3,753, just over a third of the US value, while the gap between North America and the EU in
terms of GDP per capita is much narrower. Health-care spending correlates with outcomes
to a certain degree since higher spending is associated with lower child mortality and higher
life expectancy, but the correlation is not perfect (Table 1). Per-capita spending in the EU is
just over a third of North American spending, yet the EU outcomes are better in terms of both
basic health outcome indicators reported, suggesting differences in efficiency (section 3).
Table 1: GDP per capita, health-care expenditure, life expectancy and child mortality, latest year
GDP per capita (PPP US$,
2016)
Health expenditure per capita (PPP
US$, 2015)
Mortality rate under-5 (per 1000, 2016)
Life expectancy at birth (years, 2016)
North America*
56,345 9,040 6 79
European Union
39,611 3,753 4 81
Middle East and North Africa
19,515 1,057 24 73
East Asia and Pacific
17,025 960 16 75
Latin America and Caribbean
15,211 1,081 18 76
South Asia 6,063 212 48 69
Sub-Saharan Africa
3,724 199 78 60
World 16,217 1,300 41 72
Source: World Bank Health Nutrition and Population Statistics and World Development Indicators (June 2018). Note: * = Canada and the US. The correct comparison of health expenditures should be based on health-specific PPP factors, not on the overall-economy PPP factor, because the relative price of health care differs from the relative price of overall output across countries. Unfortunately, health-specific PPP factors are available only for advanced countries (and for a few emerging countries), so in this table we use the overall PPP factors. In the rest of this Policy Contribution we use health-specific PPP factors.
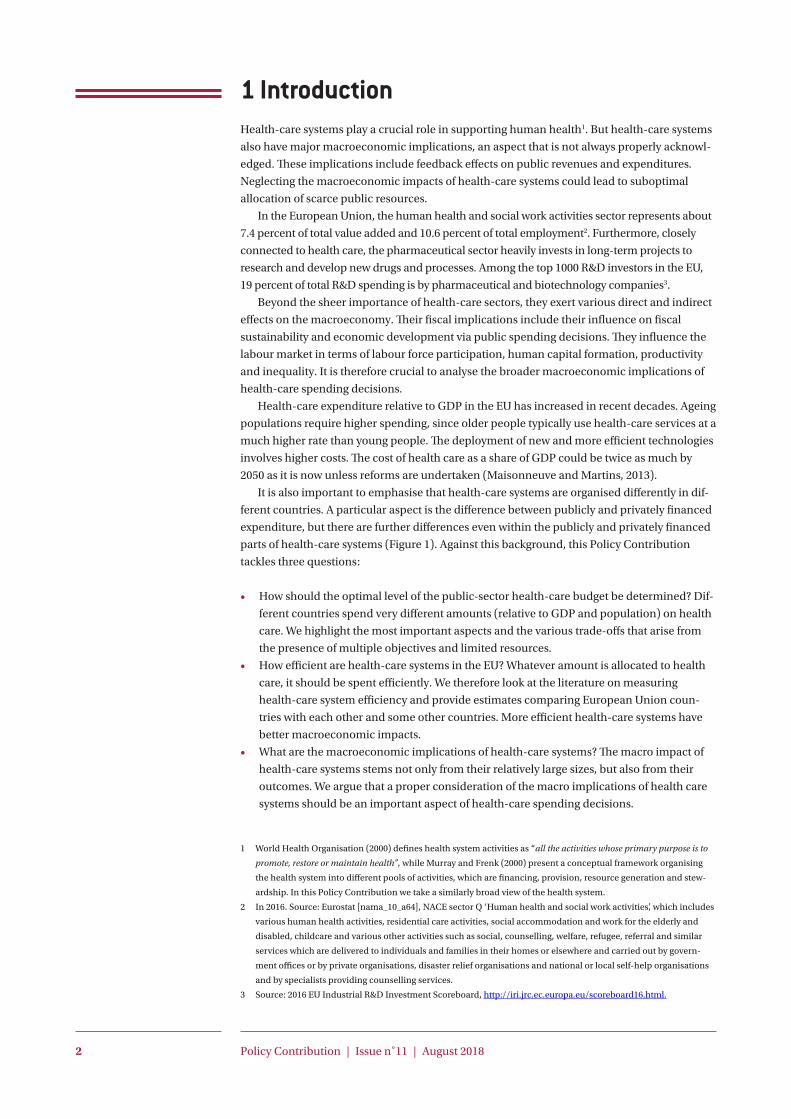
There are also major differences between European countries in terms of health-care spend-
ing (Figure 2). Spending ranges from about 500 purchasing power standards per capita per year
in Romania (a country with one of the lowest GDP per capita in the EU) to about 5,000 purchas-
ing power standards in Luxembourg (the country with highest GDP per capita in the EU). In
terms of GDP, the range is from 5 percent in Romania to 11 percent in Germany and France.
Again, a simple correlation analysis of data from EU countries shows that while richer EU
countries tend to spend more on health care, there are also many other important drivers.
Moreover, the actual amounts spent on health care might not be optimal and therefore we
recommend a fundamental reconsideration of spending levels, along with measures to
improve effectiveness and efficiency (section 3).
An extensive literature analyses the drivers of health-care spending. In the face of con-
cerns about the cost impact of ageing societies, several papers have focused on projecting
spending levels (Przywara, 2010; De La Maisonneuve and Oliveira Martins, 2013). The average
level of income within a particular country is generally accepted as a significant driver of
health spending, showing that individuals value personal health. A key unanswered question
6 Policy Contribution | Issue n˚11 | August 2018
in the literature is to what extent an increase in income leads to an increase in health spend-
ing. More accurate estimates of this for each country would help better assess the impact of
policies over the entire economic cycle. Demographic factors – especially the age structure
and related health status – are also crucial determinants of health spending nationally.
Figure 2: Total expenditure on health care by function in European countries in 2015, € per capita (health-PPP adjusted) and % of GDP
Source: Eurostat health care expenditure database. Note: Instead of the overall GDP PPP factor, we converted per-capita health spending with the health-specific PPP factors. * 2014 data for Switzerland.
The empirical evidence on the influence of other factors on health-care spending is more
difficult to gather, but we can mention that the price of health care relative to other services
plays a role, as does the relative price of different health technologies and health-care related
assets (Savedoff and WHO, 2003). Moreover, the institutional landscape and policies gov-
erning health systems explain spending levels because they determine the incentives of all
involved stakeholders, the transaction costs throughout the system, and the relative prices
of health technologies. These determinants are particularly difficult to study, although there
many qualitative discussions exist (White, 2013).
Savedoff and WHO (2003) discuss the importance of these determinants but ask a dif-
ferent question: what should determine health-care spending? They highlight an additional
trade-off: the value of the health system relative to other potential uses of the same resources
in society. Looking beyond the health system in this way is rare in the literature, but necessary
if one is to consider the full benefits and costs of health systems. Notably, such a perspective
enables policymakers to see health systems as a strategic investment with returns for aggre-
gate social welfare. One important element of such returns is the (positive) macroeconomic
implications of health systems (section 4). Keeping this broader picture in mind also empow-
ers policymakers to develop a strategic vision of health-care reform. It also enables them
to ground decisions in first principles, to more easily convince the numerous stakeholders
involved in health systems and to diffuse conflicts.
There are also market failures that require public-sector attention. Patients have a lack of
understanding of what treatment is necessary for them and there is an asymmetry of informa-
tion between patients and providers. Depending on the incentive scheme for the health-care
industry and providers, there might be pressure to leverage this asymmetry of information
0
2
4
6
8
10
12
0
1,000
2,000
3,000
4,000
5,000
6,000
Switz
erla
nd*
Norw
ayLu
xem
bour
gSw
eden
Irela
ndNe
ther
land
sAu
stria
Germ
any
Belg
ium
Denm
ark
Icel
and
Fran
ceFi
nlan
d UKIta
lySp
ain
Slov
enia
Cypr
usPo
rtuga
lGr
eece
Czec
h Re
p.Sl
ovak
iaEs
toni
aPo
land
Hung
ary
Croa
tiaLi
thua
nia
Latv
iaBu
lgar
iaRo
man
ia
% o
f GDP
€pe
r cap
ita (h
ealth
-PPP
adj
uste
d)
Curative and rehabilitative care Long-term care (health)
Ancillary services (non-specified by function) Medical goods (non-specified by function)
Preventive care Administration
Health expenditure as % of GDP (right axis)
7 Policy Contribution | Issue n˚11 | August 2018
for private interests. This can lead to overprescribing or overpricing of medical treatments,
driving up health expenditures beyond what is necessary.
Adverse selection in insurance markets occurs when competitive insurers must
provide standardised insurance contracts to risk-averse individuals, which is the typical
situation in health insurance. Most people can make a fairly good projection of their
probability of incurring medical expenses, so those who believe their probability is high
will be more likely to sign up for voluntary health insurance than those who believe
their probability is low. Therefore, the insurer attracts individuals who might incur costs
that are higher than the revenues they generate. Competitive pressures or regulation in
the insurance market might prevent insurers from raising their prices. Empirically, the
take-up of voluntary health insurance ranges from zero (nobody being insured) to broad
take-up (Einav and Finkelstein, 2011). Authorities have a decisive role in regulating
insurance markets to ensure widespread health insurance coverage, which also affects
aggregate health expenditures.
Finally, public health expenditure should take into account private health-care spending
and its underlying dynamics. While this is not the focus of this report, private health expend-
iture accounted for 22 percent of total EU health expenditure in 2015 and remains significant
(OECD/EU, 2016; European Commission, 2016). It can be leveraged to develop better-inte-
grated health systems (European Commission, 2017).
These relevant factors could serve as a checklist for policymakers and could be the basis
for further research. It is essential that discussions of health systems consider both the
opportunity costs and the economic value of investing in health. Such an approach can help
policymakers resist the temptation to default to the potentially inefficient status quo6.
3 Health-care spending efficiencyMany studies have estimated the relative efficiency of health-care systems in Europe. Most
find widespread inefficiency (Medeiros and Schwierz, 2015). Concerns about the high cost of
health-care systems have led in many countries to efforts to reduce the costs through greater
efficiency. Opinions on what causes health-care inefficiencies vary significantly. European
Commission (2015) highlights four main causes of the non-optimal use of resources, applica-
ble to most EU countries: inefficient delivery of health-care services, inefficient provision of
health care, corruption and inefficient distribution of preventative and curative care.
Bearing in mind the limitations of efficiency indicators (see Annex 1), Table 1 has already
shown that there could be differences in efficiency across countries. For example, in North
America, health-care spending per capita is more than twice that in Europe, yet life expec-
tancy is lower and child mortality higher in North America than in Europe. There are also
substantial differences between EU countries (Figure 3).
Life expectancy at birth is a summary indicator of health outcomes. It is the mean number
of years a new-born child can expect to live if subjected throughout his or her life to the cur-
rent mortality conditions, the probabilities of dying at each age. This indicator is recalculated
each year reflecting the mortality rates of the year in question. Therefore, it reflects the effects
of past health policies (for example, the effectiveness of prevention policies) and current
health policies (effectiveness of curative policies), but is also influenced by various other fac-
tors such as life style, environment, natural disasters and prevalence of violence.
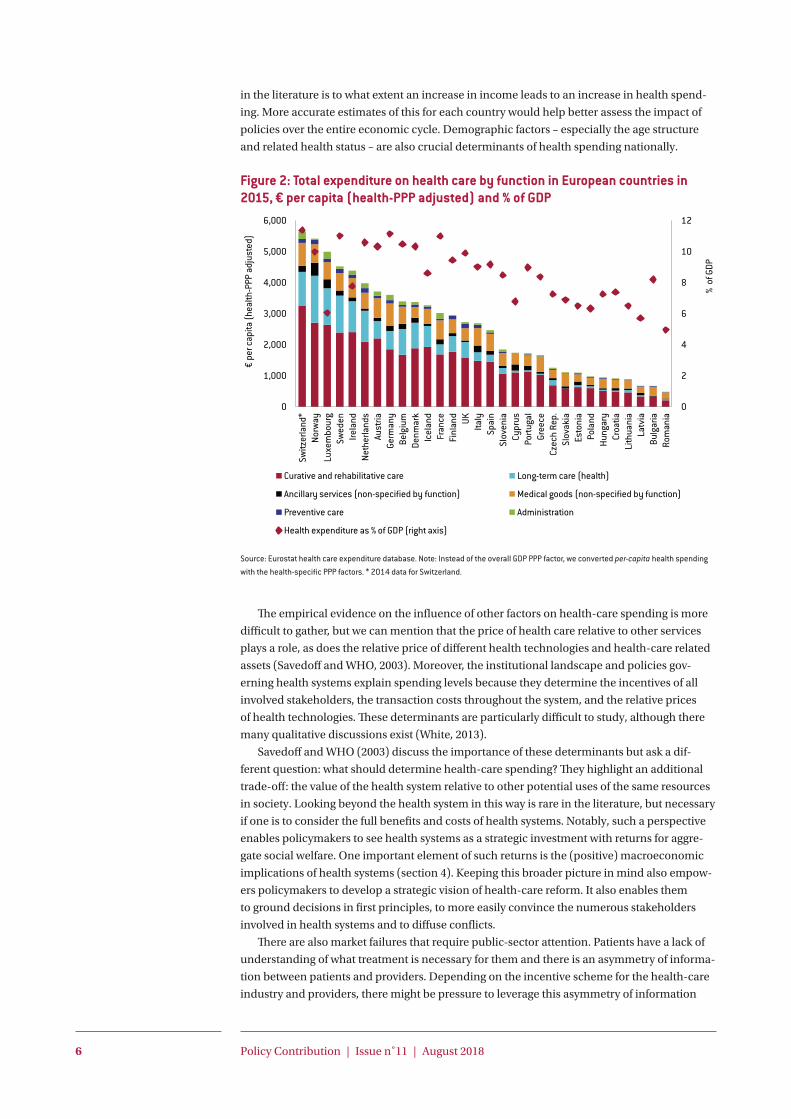
Figure 3 shows that the relationship between spending and health-care outcomes is
6 A particular approach to inform policy decisions and ensure proper allocation of resources is the so-called whole
disease approach (WDA), which has been rarely applied in practice (Shah and Proach, 2015; Tappenden et al,
2012). In contrast with the common practice of looking at the viability of particular healthcare investments sepa-
rately from upstream and downstream components, the WDA considers the entire disease path.
8 Policy Contribution | Issue n˚11 | August 2018
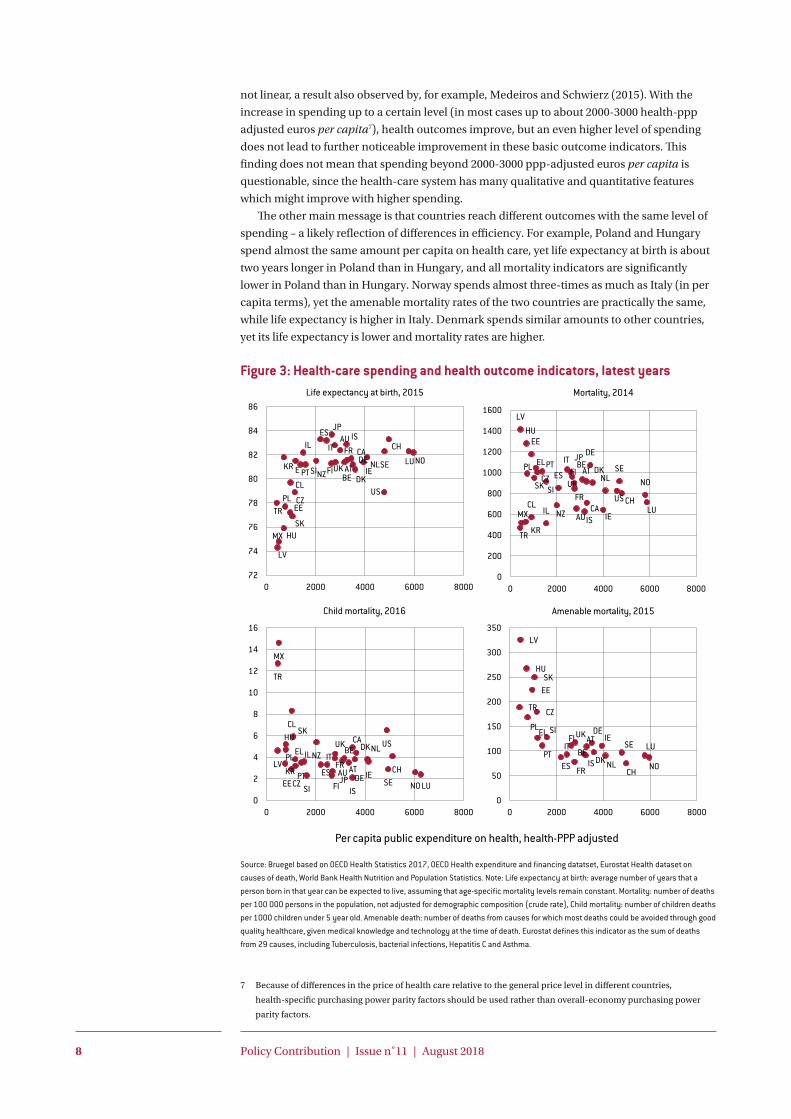
not linear, a result also observed by, for example, Medeiros and Schwierz (2015). With the
increase in spending up to a certain level (in most cases up to about 2000-3000 health-ppp
adjusted euros per capita7), health outcomes improve, but an even higher level of spending
does not lead to further noticeable improvement in these basic outcome indicators. This
finding does not mean that spending beyond 2000-3000 ppp-adjusted euros per capita is
questionable, since the health-care system has many qualitative and quantitative features
which might improve with higher spending.
The other main message is that countries reach different outcomes with the same level of
spending – a likely reflection of differences in efficiency. For example, Poland and Hungary
spend almost the same amount per capita on health care, yet life expectancy at birth is about
two years longer in Poland than in Hungary, and all mortality indicators are significantly
lower in Poland than in Hungary. Norway spends almost three-times as much as Italy (in per
capita terms), yet the amenable mortality rates of the two countries are practically the same,
while life expectancy is higher in Italy. Denmark spends similar amounts to other countries,
yet its life expectancy is lower and mortality rates are higher.
Figure 3: Health-care spending and health outcome indicators, latest years
Source: Bruegel based on OECD Health Statistics 2017, OECD Health expenditure and financing datatset, Eurostat Health dataset on causes of death, World Bank Health Nutrition and Population Statistics. Note: Life expectancy at birth: average number of years that a person born in that year can be expected to live, assuming that age-specific mortality levels remain constant. Mortality: number of deaths per 100 000 persons in the population, not adjusted for demographic composition (crude rate), Child mortality: number of children deaths per 1000 children under 5 year old. Amenable death: number of deaths from causes for which most deaths could be avoided through good quality healthcare, given medical knowledge and technology at the time of death. Eurostat defines this indicator as the sum of deaths from 29 causes, including Tuberculosis, bacterial infections, Hepatitis C and Asthma.
7 Because of differences in the price of health care relative to the general price level in different countries,
health-specific purchasing power parity factors should be used rather than overall-economy purchasing power
parity factors.
AU
ATBE
CA
CL
CZ
DK
EE
FI
FRDE
E
HU
IS
IE
IL IT
JP
KR
LV
LU
MX
NLNZ
NO
PL
PT
SK
SI
ES
SE
CH
TR
UK
US
72
74
76
78
80
82
84
86
0 2000 4000 6000 8000
AU
ATBE
CACL
CZDK
EE
FI
FR
DEEL
HU
IS IEIL
IT JP
KR
LV
LUMX
NL
NZ
NO
PL PT
SK SI
ESSE
CH
TR
UK
US
0
200
400
600
800
1000
1200
1400
1600
0 2000 4000 6000 8000
AU AT
BECA
CL
CZ
DK
EE FI
FRDE
EL
HU
IS
IE
IL IT
JPKR
LV
LU
MX
NLNZ
NO
PL
PT
SK
SI
ESSE
CH
TR
UK US
0
2
4
6
8
10
12
14
16
0 2000 4000 6000 8000
BE
CZ
DK
DE
EE
IEEL
ES FR
IT
LV
LU
HU
NL
ATPL
PT
SI
SK
FISE
UK
IS NOCH
TR
0
50
100
150
200
250
300
350
0 2000 4000 6000 8000
Life expectancy at birth, 2015 Mortality, 2014
Child mortality, 2016 Amenable mortality, 2015
Per capita public expenditure on health, health-PPP adjusted

9 Policy Contribution | Issue n˚11 | August 2018
Per-capita spending is not the only determinant of health outcomes. In order to compare
efficiency across countries, we use data envelopment analysis (DEA) similarly to Joumard et
al (2010) from the OECD8. DEA is a non-parametric method frequently used in operations
research and economics to estimate efficiency frontiers – the most efficient use of multiple
inputs leading to multiple outputs (see further details of this method in the Annex).
Our analysis focuses on life expectancy at birth as a broad indicator of past and current
health-care policies and other factors, and incorporates information from current mortal-
ity rates. Beyond per capita spending, we consider two additional indicators that capture
socio-economic and life-style characteristics (see the details in the note to Figure 4).
It should be emphasised that our calculations measure changes in relative efficiency
across countries, not absolute efficiency: it is quite likely that the health-care systems of most
if not all countries became more efficient between 2000 and 2014, but at different rates. There-
fore, our calculations measure the efficiency of countries compared to the estimated techno-
logical frontier in each year, that is compared to the estimated maximum possible efficiency
given what best-performing countries have achieved.
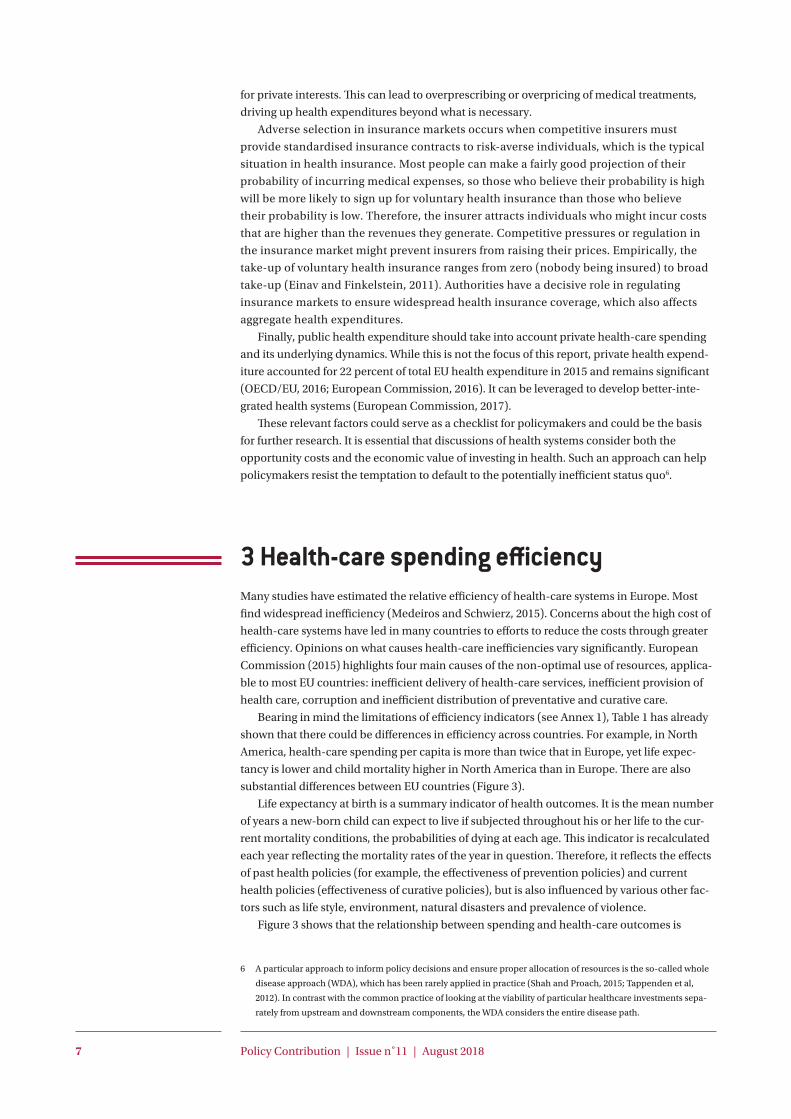
Our results (Figure 4) suggest that the most efficient EU country in our sample is Italy.
Other southern and some central European countries also rank well, while most of the coun-
tries in northern and western Europe use their health-care inputs least efficiently, with the
notable exceptions of high-ranking France and Austria9.
Figure 4: Efficiency scores based on data envelopment analysis (DEA) estimates
Source: Bruegel. Note: A higher scores indicates greater efficiency. Countries are ranked by their score in 2014. DEA performed based on three inputs: per capita health-care spending adjusted for health sector-specific PPP, a socio-economic indicator (based on GDP per capita and share of population with at least higher secondary education) and a life-style indicator (based on alcohol and tobacco consumption); data sources: OECD Health Statistics, OECD Purchasing Power Parities benchmark results. Output: life expectancy at birth (Source: OECD Health Statistics). Model specifications: output-orientated, variable returns to scale. DEA is implemented using bootstrap procedure to correct for potential small sample bias which would lead to greater efficiency scores (Joumard et al, 2010). The first year for which health-care PPP is available is 2005. For our 2000 calculations, we assumed that the ratio between health-specific and overall PPP in 2000 was the same as in 2005, and thereby multiply the 2000 overall PPP values with the 2005 ratio between the two indicators.
8 In our calculations we were able to replicate Joumard et al results for the year 2007 using the same data. Howev-
er, in our own calculations we use health-PPP adjusted expenditure, instead of overall-economy PPP adjusted
expenditure as in Joumardet al. Furthermore, the authors reported results for a particular year, while we make cal-
culations for three years, 2000, 2007 and 2014, in order to be able to study the changes in relative efficiency across
countries through time.
9 Given the sensitivity of DEA analysis, we made several DEA estimates using different input and output combina-
tions. These robustness checks confirm the general trends.
0.93
0.94
0.95
0.96
0.97
0.98
0.99
1
Switz
erla
ndIta
lyPo
land
Czec
h Re
p.Fr
ance
Hung
ary
Aust
riaAu
stra
liaPo
rtuga
lGr
eece
Spai
nSw
eden
Latv
iaLu
xem
bour
gKo
rea
Neth
erla
nds
Cana
daSl
oven
iaEs
toni
aIre
land
Belg
ium UK
Finl
and
Germ
any
Denm
ark
Slov
akia US
2000 2007 2014

10 Policy Contribution | Issue n˚11 | August 2018
Interestingly, some countries that were close to the efficiency frontier in 2000, such as
Sweden and France, experienced deterioration in relative efficiency compared to other coun-
tries. The most striking decline in relative efficiency is observed for Denmark, while Greece
and Estonia also suffered from noticeable declines. From our analysis it is not clear if countries
diverge from the efficiency frontier because of shifts in the frontier (eg because other countries
have implemented more efficient systems) or because of declines in efficiency in the countries
affected. EU countries that improved their ranks since 2000 include Poland, the Czech Republic,
Austria, Luxembourg, Slovenia and Ireland.
Our analysis tends to confirm simple observations that can be made on the basis of Figure
3 by comparing health-care spending and life expectancy in different countries. Countries with
the lowest efficiency scores in 2014 (Ireland, Belgium, United Kingdom, Finland, Germany,
Denmark and Slovakia) also, on average, have lower life expectancy compared to countries with
similar levels of spending.
Our analysis also underlines the importance of life-style and socio-economic indicators.
For example, based on Figure 3, we highlighted the much worse health outcomes in Hungary
compared to Poland, while per-capita spending is about the same in both countries. Neverthe-
less, Hungary ranks relatively high in terms of relative efficiently, just slightly below Poland. The
high Hungarian ranking is the result of very unfavourable tobacco and alcohol consumption,
while the educational level is also worse than in Poland. In the light of such an adverse lifestyle
and educational situation, the low Hungarian life expectancy is not that surprising, and conse-
quently Hungary’s rank in health-care system efficiency is relatively high.
Outside the EU, Switzerland is the highest-ranked country, with consistently high scores
from 2000 to 2014. The least-efficient country in our sample is the United States, where effi-
ciency has deteriorated since 2000. The low US score is consistent with the basic data we pre-
sented in Table 1, which showed that per-capita health spending in the US is more than twice
that in the EU, yet the US has worse health outcomes. Our calculations show that even after
controlling for socio-economic and life-style factors, the US health-care system suffers from
major efficiency problems.
While our methodology, like other methodologies used to estimate health-care system
efficiency, suffers from various drawbacks, our results are in line with a number of earlier works
pointing to the widespread inefficiency of health-care systems. This calls for policy measures,
not least because efficiency also matters for the macroeconomic impact of health-care systems.
4 Health care and macroeconomicsBeyond the sheer importance health-related sectors in output, employment and research,
health-care systems have macroeconomic implications through various channels. They have
fiscal implications for the long-term sustainability of public debt and short-term fiscal multipli-
ers, and labour market implications in terms of the number of sick days, labour supply effects,
productivity and human capital. Health-care systems could also dampen or reinforce the
consequences of income inequality and thereby affect growth. We deal with each of these issues
in turn.
4.1 Health care and long-term fiscal sustainabilityHealth-care systems can have an indirect impact on the macroeconomy via fiscal sustainability.
For example, an increase in public health-care spending might necessitate higher taxes or cuts
to other expenditure.
Demographic change and slowing growth pose significant threats to the long-term sustaina-
bility of European public welfare systems. In its 2018 Ageing Report, the European Commission
highlighted that in 2016 the biggest shares of public spending in EU member states directly

11 Policy Contribution | Issue n˚11 | August 2018
affected by ageing go to pensions (11.2 percent of GDP in 2016), health care (6.8 percent of
GDP) and long-term care (1.6 percent of GDP), as well as education (4.3 percent of GDP).
Long-term projections suggest that between 2016 and 2040 public health-care and long-term
care spending will likely increase by 9 percent and 38 percent, respectively, on average in EU
countries, reaching 7.4 percent of GDP for health care and 2.2 percent of GDP for long-term
care – 9.6 percent of GDP together. EU countries are differently exposed to such increases: the
total of health-care and long-term care spending is projected to increase by 2040 by between
0.3 percent and 2.4 percent of GDP, depending on the country (Figure 5). The main reason for
this increase is demographic change, though the calculations are uncertain and the actual
outcome will depend to a great extent on additional gains in life expectancy and the health
conditions of older age groups.
An alternative risk scenario is also calculated in the Commission’s 2018 Ageing Report.
This scenario assumes the partial continuation of two recently observed trends in health-
care expenditure. First, it assumes higher income and technological progress, and second, it
assumes an upward convergence of coverage and costs to the EU average. In this scenario, the
increase in health-care and long-term care spending could be even more significant, together
reaching 10.5 percent of GDP on average in the EU’s current countries by 2040.
Figure 5: Current and projected change in public expenditure 2016-40, % of GDP
Source: European Commission, 2018 Ageing Report. Note: HC and LTC refer to health care and long-term care respectively; projections relate to baseline scenario; risk scenario assumes an uptick in health care costs caused by non-demographic drivers reflecting recent trends; EU values based on weighted average.
Irrespective of the uncertainty around long-term predictions, growing health and long-
term care spending mean governments should consider introducing new or increasing
existing taxes, directing existing sources towards health and long-term care and/or reducing
public contributions to the health system.
4.2 Health care and short-term fiscal multipliersChanges in public health-care spending have an impact on the economy, which in turn has
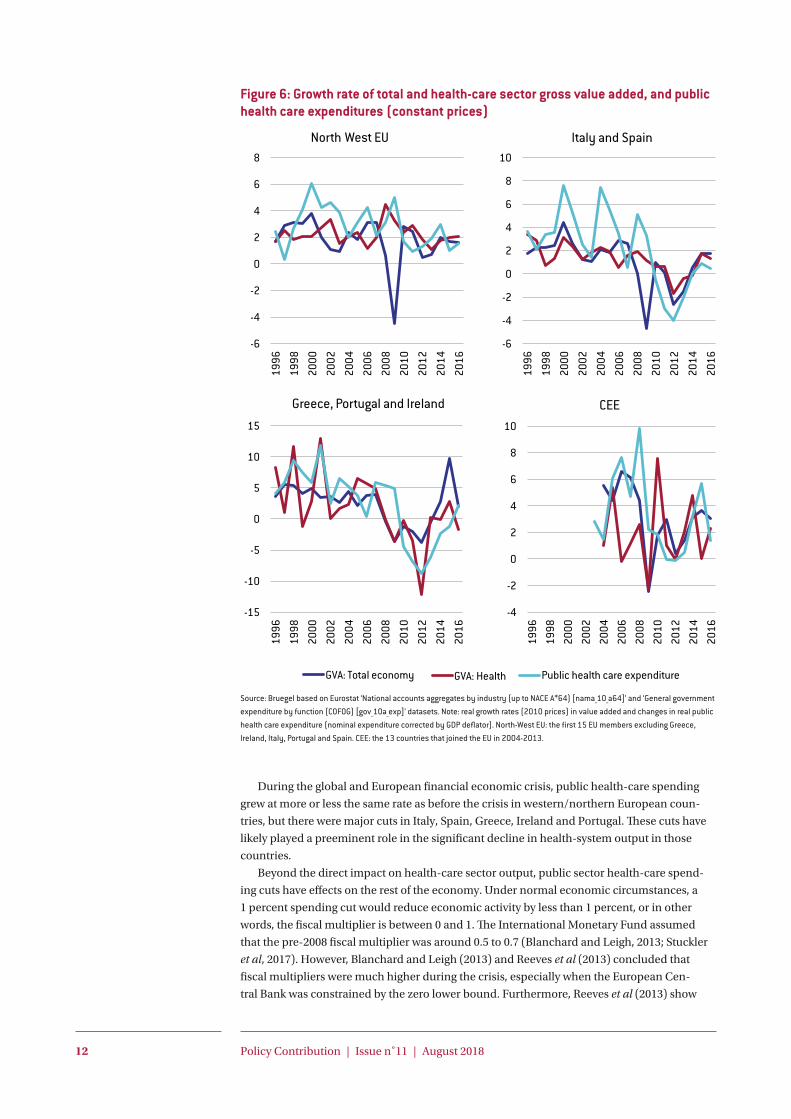
a feedback effect on public finances. From 1996 to 2008, total and health-care system output
(measured as gross value added) in EU countries grew at similar rates on average, though in
some years there were major differences (Figure 6). Public spending on health care generally
increased faster than output.
0
2
4
6
8
10
12
14
16
Cypr
usLa
tvia
Rom
ania
Pola
ndBu
lgar
iaGr
eece
Lith
uani
aEs
toni
aHu
ngar
yLu
xem
bour
gCr
oatia
Irela
ndSl
ovak
iaSl
oven
iaSp
ain
Czec
h Re
p.Po
rtuga
lM
alta
Italy
Belg
ium
EU28
Germ
any
Aust
riaFi
nlan
dFr
ance UK
Denm
ark
Swed
enNe
ther
land
sNo
rway
HC 2016 LTC 2016 HC change 2016-40
LTC change 2016-40 risk scenario: HC and LTC 2040
12 Policy Contribution | Issue n˚11 | August 2018
Figure 6: Growth rate of total and health-care sector gross value added, and public health care expenditures (constant prices)
Source: Bruegel based on Eurostat ‘National accounts aggregates by industry (up to NACE A*64) [nama_10_a64]’ and ‘General government expenditure by function (COFOG) [gov_10a_exp]’ datasets. Note: real growth rates (2010 prices) in value added and changes in real public health care expenditure (nominal expenditure corrected by GDP deflator). North-West EU: the first 15 EU members excluding Greece, Ireland, Italy, Portugal and Spain. CEE: the 13 countries that joined the EU in 2004-2013.
During the global and European financial economic crisis, public health-care spending
grew at more or less the same rate as before the crisis in western/northern European coun-
tries, but there were major cuts in Italy, Spain, Greece, Ireland and Portugal. These cuts have
likely played a preeminent role in the significant decline in health-system output in those
countries.
Beyond the direct impact on health-care sector output, public sector health-care spend-
ing cuts have effects on the rest of the economy. Under normal economic circumstances, a
1 percent spending cut would reduce economic activity by less than 1 percent, or in other
words, the fiscal multiplier is between 0 and 1. The International Monetary Fund assumed
that the pre-2008 fiscal multiplier was around 0.5 to 0.7 (Blanchard and Leigh, 2013; Stuckler
et al, 2017). However, Blanchard and Leigh (2013) and Reeves et al (2013) concluded that
fiscal multipliers were much higher during the crisis, especially when the European Cen-
tral Bank was constrained by the zero lower bound. Furthermore, Reeves et al (2013) show
-6
-4
-2
0
2
4
6
8
1996
1998
2000
2002
2004
2006
2008
2010
2012
2014
2016
North West EU
-6
-4
-2
0
2
4
6
8
10
1996
1998
2000
2002
2004
2006
2008
2010
2012
2014
2016
Italy and Spain
-15
-10
-5
0
5
10
15
1996
1998
2000
2002
2004
2006
2008
2010
2012
2014
2016
Greece, Portugal and Ireland
GVA: Total economy GVA: Health Public health care expenditure
-4
-2
0
2
4
6
8
10
1996
1998
2000
2002
2004
2006
2008
2010
2012
2014
2016
CEE

13 Policy Contribution | Issue n˚11 | August 2018
evidence that multipliers vary significantly according to the budget sector and concluded that
health-care spending has the second biggest effect after education. The reason for the rela-
tively high fiscal multiplier for the health-care sector is that health-care expenditures directly
affect wages in the sector and indirectly affect wages in other sectors, such as construction
and other sectors linked to the supply chain of health-care equipment and products. Some of
these wage earners are low-paid workers with a high propensity to consume and their income
contraction can have a significant negative impact on consumption and thereby on GDP and
employment. In turn, a decline in GDP and employment resulting from health-care spending
cuts has a feedback effect on public finances through lower tax revenues and higher unem-
ployment-benefit costs.
Health-care spending’s high fiscal multipliers allow us to conclude that preserving the
growth rate of public-sector health-care expenditure in North-West EU countries had a
stabilising impact on the economies of those countries, but the big health-care spending cuts
in Greece, Ireland, Italy, Portugal and Spain amplified the economic downturn and could
have even increased their budget deficits. Moreover, deeper recession might lead to hysteresis
effects, such as increased long-term unemployment and reduced productivity.
4.3 Health care and the labour marketHealth-care systems, by influencing health-care outcomes, can have direct macroeconomic
impacts though the labour market10. Suhrcke et al (2005) presented an overview of studies
that analysed the benefits of health-care improvements on the economy for developed coun-
tries, which generally have established social safety nets11. The main channels identified in the
literature are labour market participation, productivity and human capital.
ParticipationA decision to supply labour depends on an individual’s health status. Ill health might prevent
individuals from entering the labour force, lead to premature exit from the labour market or,
in the worst case, to death. Labour-force exclusion implies personal hardship and foregone
output, and means that public resources are required to support excluded individuals. The
share of EU citizens aged 20-64 who were inactive because sickness or disability increased
from 3.5 percent in 2000 to 4.5 percent in 201712. This trend is alarming and indicates that the
EU labour force is losing an increasingly large number of people for health reasons.
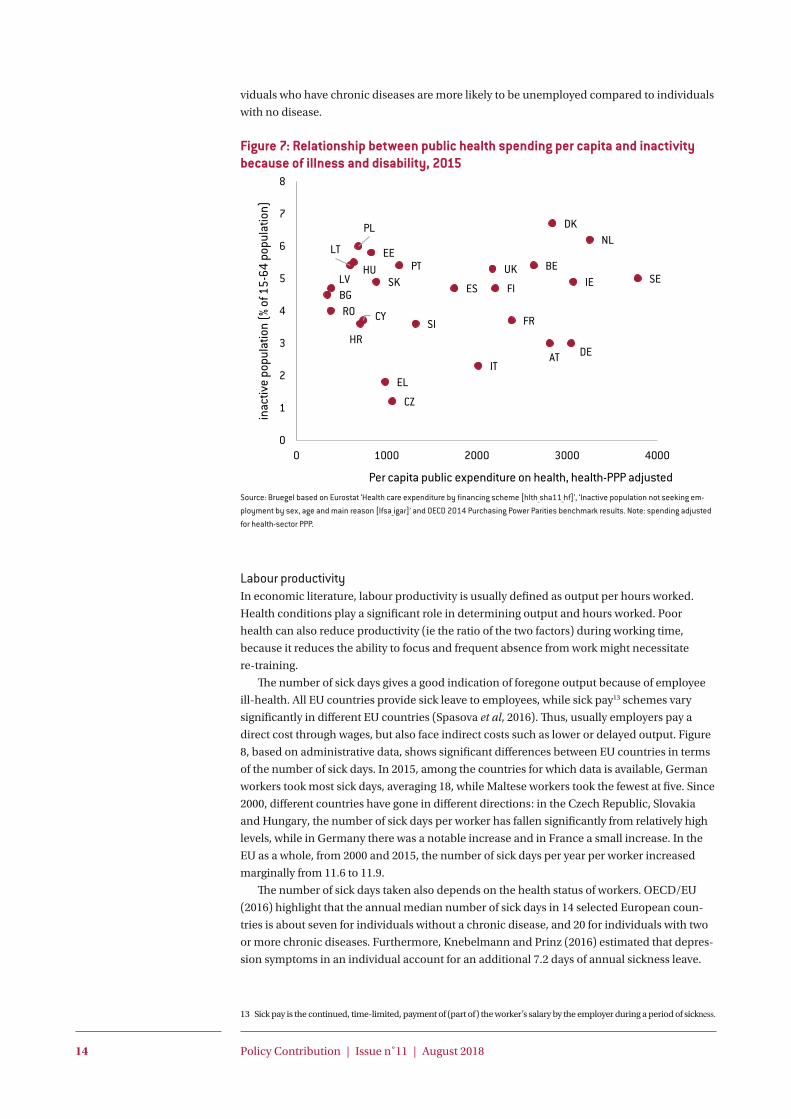
We do not find a statistically significant relationship between health-care expenditure and
inactivity because of sickness or disability (Figure 7). A possible explanation for this finding is
that the direction of causality could go two ways: higher health-care spending should reduce
such inactivity (thus the relationship should be negative), but higher inactivity because of
illness and disability would require higher health-care spending (ie a positve relationship).
Furthermore, incentives might also play a role: while higher expenditure might actually
improve the health conditions of citizens, a more-developed welfare state reduces the incen-
tives to work.
Sickness-induced inactivity and health-care spending are also related to raised retirement
ages. In the context of increased life expectancy, governments raise the age of retirement to
reduce the dependency ratio. However, older people are more likely to be affected by chronic
diseases, leading to a greater likelihood of premature exit from labour markets and hence
higher inactivity rates. According to an OECD/EU (2016) study, which examined 14 European
countries, the average early retirement rate for workers aged 50-59 who have two or more
chronic diseases is around 10 percent, while only 4 percent of workers in the same age group
without a chronic disease retire early. Furthermore, OECD (2016) presents evidence that indi-
10 For detailed analysis, see for example OECD and European Commission (2016), Chapter 1.
11 In developing economies with typically more limited social safety nets, the social and macroeconomic repercus-
sions of ill health can be more severe than in advanced countries.
12 Source: Eurostat ‘Inactive population not seeking employment by sex, age and main reason [lfsa_igar]’ dataset.
14 Policy Contribution | Issue n˚11 | August 2018
viduals who have chronic diseases are more likely to be unemployed compared to individuals
with no disease.
Figure 7: Relationship between public health spending per capita and inactivity because of illness and disability, 2015
Source: Bruegel based on Eurostat ‘Health care expenditure by financing scheme [hlth_sha11_hf]’, ‘Inactive population not seeking em-ployment by sex, age and main reason [lfsa_igar]’ and OECD 2014 Purchasing Power Parities benchmark results. Note: spending adjusted for health-sector PPP.
Labour productivityIn economic literature, labour productivity is usually defined as output per hours worked.
Health conditions play a significant role in determining output and hours worked. Poor
health can also reduce productivity (ie the ratio of the two factors) during working time,
because it reduces the ability to focus and frequent absence from work might necessitate
re-training.
The number of sick days gives a good indication of foregone output because of employee
ill-health. All EU countries provide sick leave to employees, while sick pay13 schemes vary
significantly in different EU countries (Spasova et al, 2016). Thus, usually employers pay a
direct cost through wages, but also face indirect costs such as lower or delayed output. Figure
8, based on administrative data, shows significant differences between EU countries in terms
of the number of sick days. In 2015, among the countries for which data is available, German
workers took most sick days, averaging 18, while Maltese workers took the fewest at five. Since
2000, different countries have gone in different directions: in the Czech Republic, Slovakia
and Hungary, the number of sick days per worker has fallen significantly from relatively high
levels, while in Germany there was a notable increase and in France a small increase. In the
EU as a whole, from 2000 and 2015, the number of sick days per year per worker increased
marginally from 11.6 to 11.9.
The number of sick days taken also depends on the health status of workers. OECD/EU
(2016) highlight that the annual median number of sick days in 14 selected European coun-
tries is about seven for individuals without a chronic disease, and 20 for individuals with two
or more chronic diseases. Furthermore, Knebelmann and Prinz (2016) estimated that depres-
sion symptoms in an individual account for an additional 7.2 days of annual sickness leave.
13 Sick pay is the continued, time-limited, payment of (part of) the worker’s salary by the employer during a period of sickness.
AT
BE
BG
CY
CZ
DE
DK
EE
EL
ES FI
FR
HR
HUIE
IT
LT
LV
NLPL
PT
RO
SE
SI
SKUK
0
1
2
3
4
5
6
7
8
0 1000 2000 3000 4000
inac
tive
popu
latio
n (%
of 1
5-64
pop
ulat
ion)
Per capita public expenditure on health, health-PPP adjusted

15 Policy Contribution | Issue n˚11 | August 2018
Figure 8: Absenteeism from work due to illness, days per employee per year, 2000 and 2015
Source: WHO Health for All Database. Note: Average number of working days lost per employee per year due to sickness or injury; mater-nity leave not included; data from existing sick-leave registration systems; if data for 2000 or 2015 is not available, closest available year is given.
Depression reduces the total hours worked and also significantly affects workplace perfor-
mance (Sobocki et al, 2006). Productivity during working time is also lower for workers who
smoke or are heavy drinkers (OECD/EU, 2016). Additionally, productivity could be influ-
enced by the extension of retirement ages. However, economic research does not support the
common belief that an ageing labour force reduces average productivity. Productivity might
decrease for tasks that require learning and speed, but might be greater with age when expe-
rience and verbal abilities matter (Skirbekk, 2004). Thereby, the health-care system can make
a positive contribution to productivity by keeping older workers able to work, but if older
workers are more frequently subject to chronic diseases, their productivity could decline.
Human capitalHuman capital plays a crucial role in economic growth and is high on the policy agenda as
continuous learning is perceived as an effective measure to respond to rapid technological
advances. Several studies show that a child’s health determines to a great extent the ability
to learn and retain knowledge (eg Victoria et al, 2008; Kramer et al, 1995). Therefore, early
intervention to support health fosters individual benefits and leads to a healthier society in
the future (WHO, 2005).
Ill health prevents individuals from working or leads to early retirement, makes them
less productive and more likely to be unemployed. Better health outcomes thus clearly have
positive macroeconomic implications. At the same time, there is an increasing ‘cost’ from
improved health, which arises from increasing the share of inactive elderly people relative to
the labour force.
4.4 Health care and inequalityA main objective of health-care systems is to provide equal access to health-care services
(section 2). If we assume that poor people are sick more often (because of lower education,
worse diet, etc) and everyone receives the same quality and quantity of services, health care
would reduce inequality. Unfortunately, this is not necessarily the case in every country. In
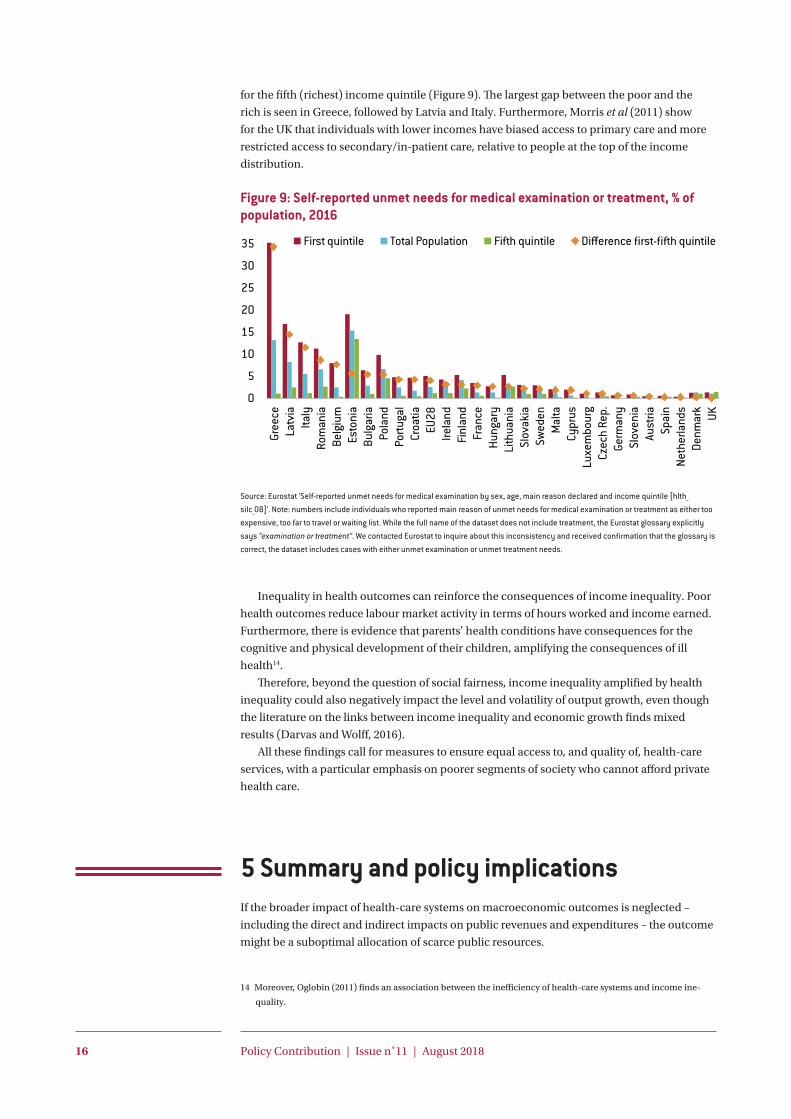
the EU as a whole, 5 percent of individuals in the first (poorest) income quintile reported that
they did not receive medical care when they felt they needed it, compared to only 1.1 percent
0
5
10
15
20
25
Swed
enGe
rman
yCz
ech
Rep.
Pola
ndSp
ain
Slov
akia
Slov
enia EU
Luxe
mbo
urg
Belg
ium
Neth
erla
nds
Aust
riaLi
thua
nia
Croa
tiaPo
rtuga
lFi
nlan
dFr
ance
Esto
nia
Denm
ark
Rom
ania
Hung
ary
Mal
ta
2000 2015
16 Policy Contribution | Issue n˚11 | August 2018
for the fifth (richest) income quintile (Figure 9). The largest gap between the poor and the
rich is seen in Greece, followed by Latvia and Italy. Furthermore, Morris et al (2011) show
for the UK that individuals with lower incomes have biased access to primary care and more
restricted access to secondary/in-patient care, relative to people at the top of the income
distribution.
Figure 9: Self-reported unmet needs for medical examination or treatment, % of population, 2016
Source: Eurostat ‘Self-reported unmet needs for medical examination by sex, age, main reason declared and income quintile [hlth_silc_08]’. Note: numbers include individuals who reported main reason of unmet needs for medical examination or treatment as either too expensive, too far to travel or waiting list. While the full name of the dataset does not include treatment, the Eurostat glossary explicitly says “examination or treatment”. We contacted Eurostat to inquire about this inconsistency and received confirmation that the glossary is correct, the dataset includes cases with either unmet examination or unmet treatment needs.
Inequality in health outcomes can reinforce the consequences of income inequality. Poor
health outcomes reduce labour market activity in terms of hours worked and income earned.
Furthermore, there is evidence that parents’ health conditions have consequences for the
cognitive and physical development of their children, amplifying the consequences of ill
health14.
Therefore, beyond the question of social fairness, income inequality amplified by health
inequality could also negatively impact the level and volatility of output growth, even though
the literature on the links between income inequality and economic growth finds mixed
results (Darvas and Wolff, 2016).
All these findings call for measures to ensure equal access to, and quality of, health-care
services, with a particular emphasis on poorer segments of society who cannot afford private
health care.
5 Summary and policy implicationsIf the broader impact of health-care systems on macroeconomic outcomes is neglected –
including the direct and indirect impacts on public revenues and expenditures – the outcome
might be a suboptimal allocation of scarce public resources.
14 Moreover, Oglobin (2011) finds an association between the inefficiency of health-care systems and income ine-
quality.
0
5
10
15
20
25
30
35
Gree
ceLa
tvia
Italy
Rom
ania
Belg
ium
Esto
nia
Bulg
aria
Pola
ndPo
rtuga
lCr
oatia
EU28
Irela
ndFi
nlan
dFr
ance
Hung
ary
Lith
uani
aSl
ovak
iaSw
eden
Mal
taCy
prus
Luxe
mbo
urg
Czec
h Re
p.Ge
rman
ySl
oven
iaAu
stria
Spai
nNe
ther
land
sDe
nmar
kUK
First quintile Total Population Fifth quintile Difference first-fifth quintile
17 Policy Contribution | Issue n˚11 | August 2018
European countries spend rather different amounts on health care (relative to their GDP
and populations). Key aspects of health-care spending decisions should include population
preferences, income, epidemiological and age structures and various aspects related to health
systems, such as the relative price of health-enhancing activities and technologies, and the
price of health relative to other aspects of life. The severity of market failures related to asym-
metric information and adverse selection in insurance markets, the effectiveness of health
policies, population preferences in terms of the private/public spending mix and the level of
taxation are also important aspects. In addition, we emphasise the crucial role of the macro-
economic implications of health-care systems in the determination of health-care spending
decisions.
Health outcomes do not always improve in line with more spending, suggesting effective-
ness and efficiency problems. We show that there seem to be threshold effects, with spending
up to a certain amount tending to improve health outcomes measured by, for example, life
expectancy and mortality, but no improvement in such indicators with additional spend-
ing. Following earlier work by the OECD and European Commission, we conducted a data
envelopment analysis, along with various robustness checks, to assess the relative efficiency
of European countries in comparison with some other advanced countries. We found that
a number of EU countries, which were close to the efficiency frontier in 2000, suffered from
deteriorations in their relative positions, though there were a few countries, such as Italy,
and France, which remained relatively close to the frontier up to 2014. Our finding that the
US health-care system is the least efficient among the countries we study offers little solace.
While this methodology, like other methodologies used to estimate health-care system effi-
ciency, suffers from various drawbacks, our results are in line with a number of earlier works
that point to the general inefficiency of health-care systems. This calls for policy measures,
not least because efficiency also matters for the macroeconomic impact of health-care sys-
tems. In line with European Commission (2018), we call for more performance evaluations
to assess health outcomes and returns to investment. Benchmarking, cross-country compar-
isons, reference networks, knowledge exchange and technical assistance provided by the EU
would help. As Wilson (2016) argues, greater accessibility and transparency of relevant data
would enable learning about the impact of health-care interventions. Systematic evaluations
should lead to efficiency-enhancing changes in health-care systems.
Health-care systems matter for the macroeconomy because of their weight in output,
employment and research. They have direct fiscal implications for the long-term sustainabil-
ity of public finances, while health-care spending decisions influence short-term economic
development through the fiscal multiplier effect. The literature finds a relatively high mul-
tiplier of health care spending. Where in some western and northern EU countries the rate
of growth of their public health-care expenditure was maintained, it helped to dampen the
impact of the recent global and European crises. But most southern EU countries cut health-
care spending more aggressively than other public spending categories, which is likely to have
amplified the depths of their recessions and might have caused hysteresis effects via long-
term unemployment and reduced productivity. A clear conclusion is that in the event of an
economic crisis necessitating fiscal adjustment, fiscal consolidation strategies should aim to
preserve spending items that have large fiscal multipliers, including health-care expenditures.
The macro impact of health care is much broader than the purely fiscal aspect related to
public spending sustainability and the immediate impact of changes in health-care spending
on the macroeconomy. Health-care systems influence labour-force participation, productivity
and human-capital formation through various channels, and thereby influence overall mac-
roeconomic outcomes. The worrisome European trend of increased inactivity resulting from
sickness and disability should be reversed, while the health conditions of workers should be
improved in order to reduce sick leave. More focus is needed on prevention to address health
proactively, not just to treat diseases reactively (Wilson, 2016). Improving health literacy, such

18 Policy Contribution | Issue n˚11 | August 2018
as training on healthy lifestyles and risk factors, is essential (European Commission, 2016).
OECD (2017) notes that while smoking rates decline, there has been little success in tackling
obesity and alcohol consumption, while efforts to improve air pollution are insufficient.
Furthermore, health-care systems play an important role in inequality: a well-functioning
system can help reduce some consequences of income inequality, but a less-equitable health
system can amplify inequality. The latter is of particular concern, since poor and less-edu-
cated people are less healthy and live shorter lives than rich and better-educated people. We
find that health inequality is particularly high in about one third of EU countries (Figure 9),
which calls for policy intervention. The joint report from the OECD and European Commis-
sion (2016) rightly calls for universal access to care and more effective prevention to reduce
health inequalities.
It is essential that discussions of health systems consider both the opportunity costs and
the economic value of investing in health. Such an approach can help policymakers resist the
temptation to default to the potentially inefficient status quo.
ReferencesArah, O. A., G. P. Westert, J. Hurst and N. S. Klazinga (2006) ‘A conceptual framework for the OECD health
care quality indicators project’, International Journal for Quality in Health Care 18(no. suppl. 1): 5-13
Blanchard O. J. and D. Leigh (2013) ‘Growth forecast errors and fiscal multipliers’, Working Paper 13/1, International Monetary Fund
Braithwaite, J., P. Hibbert, B. Blakely, J. Plumb, N. Hannaford, J. C. Long and D. Marks (2017) ‘Health system frameworks and performance indicators in eight countries: A comparative international analysis’, SAGE Open Medicine 5: 1-10
Brousselle, A., T. Benmarhnia and L. Benhadj (2016) ‘What are the benefits and risks of using return on investment to defend public health programs?’ Preventive Medicine Reports 3: 135-138
Carinci, F., K. Van Gool, J. Mainz, J. Veillard, E. C. Pichora, J. M. Januel, I. Arispe, S. M. Kim and N. Klazinga (2015) ‘Towards actionable international comparisons of health system performance: expert revision of the OECD framework and quality indicators’, International Journal for Quality in Health Care 27(2): 137-146
De la Maisonneuve, C. and J. Oliveira Martins (2013) ‘A projection method for public health and long-term care expenditures’. OECD Economics Department Working Papers, No. 1048, Organisation for Economic Co-operation and Development
Einav, L. and A., Finkelstein (2011) ‘Selection in Insurance Markets: Theory and Empirics in Pictures’, Journal of Economic Perspectives Vol. 25(1): 115-138
Eurohealth (2012) Efficiency and Health Care, Volume 8(3)
European Commission (2014) ‘On effective, accessible and resilient health systems’, COM(2014) 215 final
European Commission (2016) ‘Fiscal Sustainability Report 2015’, Institutional Paper 018
European Commission (2017) State of Health in the EU: Companion Report
European Commission (2018) ‘The 2018 Ageing Report: Economic and Budgetary Projections for the EU Member States (2016-2070)’ European Commission
European Commission and Economic Policy Committee (2016) Joint Report on Health Care and Long-Term Care Systems and Fiscal Sustainability, Volume 1
European Commission and Economic Policy Committee (2016) Joint Report on Health Care and Long-Term Care Systems and Fiscal Sustainability, Volume 2
European Observatory (2016) Health System Efficiency: How to make measurement matter for policy and management
Fetter, R. B. (1991) ‘Diagnosis related groups: understanding hospital performance’, Interfaces, 21(1): 6-26
Gerdtham, U. G., M. Löthgren, M. Tambour and C. Rehnberg (1999) ‘Internal markets and health care efficiency: a multiple‐output stochastic frontier analysis’, Health Economics, 8(2): 151-164
19 Policy Contribution | Issue n˚11 | August 2018
Hollingsworth, B. and A. Street (2006) ‘The market for efficiency analysis of health care organisations’, Health Economics, 15(10): 1055-1059
Hsiao, W. C. and P. S. Heller (2007) ‘What Macroeconomists Should Know about Health Care Policy’, Working Paper WP/07/13, International Monetary Fund
Joumard, I., C. André and C. Nicq (2010) ‘Health care systems: efficiency and institutions’, OECD Economics Department Working Papers 769, Organisation for Economic Co-operation and Development
Knebelmann, J. and C. Prinz (2016) ‘The Impact of Depression on Employment of Older Workers in Europe’ OECD Social, Employment and Migration Working Papers (170), Organisation for Economic Co-operation and Development
Kramer, R. A., A. LaRue and P. J. Gergen (1995) ‘Health and social characteristics and children’s cognitive functioning: results from a national cohort’, American Journal of Public Health 85(3): 312-318
Lunt, N., R. Smith, M. Exworthy, S. T. Green, D. Horsfall and R. Mannion (2011) Medical tourism: treatments, markets and health system implications: a scoping review, Organisation for Economic Co-operation and Development
Maisonneuve, C. and J. Martins (2013) ‘Public Spending on Health and Long Term Care: A New Set of Projections’, Economic Policy Paper No. 6, Organisation for Economic Co-operation and Development
Medeiros, J. and C. Schwierz (2015) ‘Efficiency estimates of health care systems’, Economic Papers No 549, Directorate General Economic and Financial Affairs (DG ECFIN), European Commission
Morris, S., M. Sutton and H. Gravelle (2005) ‘Inequity and inequality in the use of health care in England: an empirical investigation’, Social Science & Medicine 60(6): 1251-1266
Murray, C. and J. Frenk (2000) ‘A framework for assessing the performance of health systems’, Bulletin of the World Health Organisation 78(6): Theme Papers 717-731
OECD/EU (2016) Health at a Glance: Europe 2016: State of Health in the EU Cycle, Organisation for Economic Co-operation and Development
Oglobin, C. (2011) ‘Health care efficiency across countries: a stochastic frontier analysis’, Applied Econometrics and International Development, 11(1), 5-14
OECD (2011) A System of Health Accounts 2011, Organisation for Economic Co-operation and Development
Przywara, B. (2010) ‘Projecting future health care expenditure at European level: drivers, methodology and main results’, Economic Papers No 417, Directorate General Economic and Financial Affairs (DG ECFIN), European Commission
Reeves, A., S. Basu, M. McKee, C. Meissner and D. Stuckler (2013) ‘Does investment in the health sector promote or inhibit economic growth?’ Globalization and Health 9(1): 43
Rosko, M. D. and R. L. Mutter (2008) ‘Stochastic frontier analysis of hospital inefficiency: a review of empirical issues and an assessment of robustness’, Medical Care Research and Review, 65(2): 131-166
Savedoff, W. D. and World Health Organisation (2003) ‘How much should countries spend on health?’ Discussion Paper #2, Health System Financing, Expenditure and Resource Allocation Department, World Health Organisation
Shah, A. and J. Proach (2015) ‘Whole-Disease Model Approach: Methodologies And Challenges In Communicating The Economic Burden Of Rare Diseases’, Value in Health, 18(3): A21-A22
Simon, J., M. M. Hofmarcher-Holzhacker and N. Perić (2017) ‘Health system performance assessment landscape at the EU level: a structured synthesis of actors and actions’, Archives of Public Health 75(5)
Skirbekk, V. (2004) ‘Age and individual productivity: A literature survey’, Vienna Yearbook of Population Research: 133-153
Sobocki, P., B. Jonsson, J. Angst and C. Rehnberg (2006) ‘Cost of depression in Europe’, Journal of Mental Health Policy and Economics, 9(2): 87–98
Spasova, S., D. Bouget and B. Vanhercke (2016) Sick pay and sickness benefit schemes in the European Union, Background report for the Social Protection Committee’s In-depth Review on sickness benefits, European Social Policy Network (ESPN), European Commission
Stuckler, D., A. Reeves and M. Mckee (2017) ‘Social and economic multipliers: What they are and why they are important for health policy in Europe’, Scandinavian Journal of Public Health 45.18_suppl: 17-21
Suhrcke, M., M. McKee, J. Mortensen, R. S. Arce and S. Tsolova (2005) The contribution of health to the

20 Policy Contribution | Issue n˚11 | August 2018
economy in the European Union, Luxembourg: Office for Official Publications of the European Communities
Tappenden, P., J. Chilcott, A. Brennan, H. Squires and M. Stevenson (2012) ‘Whole disease modelling to inform resource allocation decisions in cancer: a methodological framework’, Value in Health, 15(8): 1127-1136.
Varabyova, Y. and J. Schreyögg (2013) ‘International comparisons of the technical efficiency of the hospital sector: panel data analysis of OECD countries using parametric and non-parametric approaches’, Health Policy, 112(1): 70-79
Victora, C. G., L. Adair, C. Fall, P. C. Hallal, R. Martorell, L. Richter, H. S. Sachdev and Maternal and Child Undernutrition Study Group (2008) ‘Maternal and child undernutrition: consequences for adult health and human capital’, The Lancet 371(9609): 340-357
White, J. (2013) ‘Budget-makers and health care systems’, Health Policy 112(3): 163-171
Wilson, K. (2016) ‘Innovation and sustainability of European healthcare systems’, Bruegel Blog, 28 January, available at: http://bruegel.org/2016/01/innovation-and-sustainability-of-european-healthcare-systems/
World Health Organisation (2000) The world health report 2000: health systems: improving performance
World Health Organisation (2005) European strategy for child and adolescent health and development
Annex: Health care efficiency: concepts and measurementsThe resources allocated to health care should be spent efficiently, that is, without wasting
money. There is no consensus method in the literature for estimating health-care system
efficiency. In this annex, we review the main concepts and methods for efficiency.
Efficiency conceptsTwo main concepts of efficiency are used in the literature: technical efficiency and allocative
efficiency.
• Technical efficiency is usually defined as the maximisation of outputs given an existing
level of inputs. A substantial group of technical efficiency indicators deals with the costs
of producing a certain amount of output, which serves as a basis for systems of diagno-
sis related groups (DRGs). Fetter (1991) pioneered research on DRGs. A key issue is the
choice of the inputs and outputs for the production of the efficiency measure. If one takes
into account the effect of a limited number of inputs on selected outputs, the measures
are partial and do not show the full picture of the health system in a specific country or re-
gion. Such information imperfections make the analysis of the outcomes very complicat-
ed and highlight the need to design uniform indicators for analysing and comparing the
efficiency of health-care systems in different countries. The Joint Report of the European
Commission (Directorate-General for Economic and Financial Affairs) and the Economic
Policy Committee (Ageing Working Group) on Health Care and Long-Term Care Systems
and Fiscal Sustainability, presented by the European Commission and Economic Policy
Committee (2016), uses some technical efficiency indicators.
• Allocative efficiency is commonly used to describe the optimum sharing of scarce resources
between multiple needs of society. For health care, limited inputs should be allocated to the
desired distribution of health-care outputs. Overall, the allocative efficiency indicator exam-
ines whether there is the right mix on the output and input sides. It is an instrument used by
health technology assessment (HTA) agencies, which make use of quality-adjusted life years
(QALY) for the estimation of benefits (European Observatory, 2016).

21 Policy Contribution | Issue n˚11 | August 2018
Efficiency measurementThere has been an intense debate over the proper measurement of efficiency. One faces
a myriad of obstacles including data collection, comparability of the data from different
countries and choice of the appropriate statistical analysis to can be applied to the study of ef-
ficiency. Methodological problems prevent proper assessment of health-care systems and the
use of a single method for the estimation of efficiency is widely regarded to be misleading. As
European Observatory on Health System and Policies (2016) points out, “some of the reasons
for the paucity of efficiency data include data differences and inconsistencies, lack of consensus
on appropriate methods and the scope of research, and difficulties directly attributing health
outcomes to health care inputs”. The authors call for more work to connect health outputs to
inputs, including factors outside the health-care system such as geography, genetics or cultur-
al lifestyle. However, this is not an easy task because “the effect of the health system as an input
to health is interrelated to and dependent on many country- or context specific characteristics
[and] it is difficult to accurately isolate the contribution of the health system itself in different
country contexts”.
Table 2 gives a classification of measurements used for efficiency estimates, comparing
advantages and disadvantages of the proposed approaches.
Table 2: Summary of health efficiency indicators
Source: The European Observatory on Health Systems and Policies (2016). Note: DEA=data envelopment analysis; DRG = diagnosis-relat-ed groups; LOS = length of stay; SFA = stochastic front analysis.
As well as the construction of the efficiency indicator being extremely challenging, there
is also a risk of producing erroneous health policy recommendations if efficiency indicators
have shortcomings (Eurohealth, 2012). Proper decision making should be based on data, col-
lected following the same procedures in all EU countries, in order to have the opportunity to
make proper distinctions. Thus, the European Commission’s and OECD’s attempt to produce
uniform data across countries is highly welcome (see for example the 2017 State of Health
report). Furthermore, big data might also play an important role in the analysis of health-care
systems, and digital technology could facilitate standardised data collection.
Notwithstanding the debate about the proper efficiency measures, academic researchers
as well as the OECD and the European Commission report some efficiency estimates. The
efficiency estimate is closely related to value for money and cost effectiveness indicators. The
European Commission State of Health report (2017), for example, suggested looking at indi-

22 Policy Contribution | Issue n˚11 | August 2018
cators of effectiveness, access and resilience when evaluating health-system performance and
making cross-country comparisons.
The two most popular methods of health-care system efficiency estimation are data envel-
opment analysis (DEA) and stochastic frontier analysis (SFA).
DEA is a non-parametric method, commonly used in operations research and economics
to estimate efficiency frontiers to study the relationship between inputs and outputs. A system
can be seen as efficient if the maximum possible output is derived from the given set of
inputs. This is closely aligned with the technical definition of efficiency, which is the number
of outputs over the number of inputs. For example, the OECD’s Joumard et al (2010) estimate
on the basis of DEA that if countries manage to allocate resources within the health-care
system more efficiently, overall life expectancy is expected to rise by approximately two years
for OECD countries. Another example is European Commission’s Medeiros and Schwierz
(2015), who present the results of 21 models. The number of DEA models used reflects the
need for an objective and uniform estimator of efficiency across the EU. Results indicate that
there is potential to improve efficiency in many EU countries.
The other main methodology for measuring health-care efficiency measures is SFA,
which is a fully parametrised model. The model encompasses a stochastic component that
describes random shocks affecting the production process. Similarly to DEA, SFA makes use
of a technical definition of efficiency and is extensively used for efficiency estimations. For
instance, Gerdhama et al (1999) address several methodological issues of this production
frontier model and provide an empirical assessment of the efficiency of a new reimbursement
scheme in 26 Swedish country council areas. They find that the new scheme might potentially
lead to a 10 percent cost reduction. Rosko et al (2008) assesses twenty SFA studies of hospi-
tal inefficiencies in the US. The major concern of the US health-care system is about costs
increasing non-commensurately to increases in quality of services. The authors highlight that
the SFA appears to be sensitive to the choice of cost function. Another example of use of SFA
is Oglobin (2011), which addressed an important issue of efficiency of national health-care
systems. Results indicated that there is an inverse relationship between the inefficiency of
health-care systems and per-capita income, and a direct relationship between the former and
income inequality.
Hollingsworth (2008) presented an analysis of 317 papers that evaluated health-care
systems. He argued that the number of papers analysing efficiency on the basis of SFA had
increased rapidly, though DEA is still used in the majority of studies, producing more than 90
percent of the total number of applications for the health-care sector (European Observatory,
2016). Some researchers consider the SFA method as more accurate because it accounts for
statistical noise, though Varabyova and Schreyögg (2013) suggest use of both methods and
a subsequent analysis of the direction of outcomes. It seems important to mention that SFA
as well as DEA has certain limitations, see for example the European Observatory study on
Health Systems and Policies (2016).