Embed Size (px)
Citation preview

Vieira et al. BMC Evolutionary Biology 2010, 10:200http://www.biomedcentral.com/1471-2148/10/200
Open AccessR E S E A R C H A R T I C L E
Research articleEvolutionary patterns at the RNase based gametophytic self - incompatibility system in two divergent Rosaceae groups (Maloideae and Prunus)Jorge Vieira1, Pedro G Ferreira1,2, Bruno Aguiar1, Nuno A Fonseca3 and Cristina P Vieira*1
AbstractBackground: Within Rosaceae, the RNase based gametophytic self-incompatibility (GSI) system has been studied at the molecular level in Maloideae and Prunus species that have been diverging for, at least, 32 million years. In order to understand RNase based GSI evolution within this family, comparative studies must be performed, using similar methodologies.
Result: It is here shown that many features are shared between the two species groups such as levels of recombination at the S-RNase (the S-pistil component) gene, and the rate at which new specificities arise. Nevertheless, important differences are found regarding the number of ancestral lineages and the degree of specificity sharing between closely related species. In Maloideae, about 17% of the amino acid positions at the S-RNase protein are found to be positively selected, and they occupy about 30% of the exposed protein surface. Positively selected amino acid sites are shown to be located on either side of the active site cleft, an observation that is compatible with current models of specificity determination. At positively selected amino acid sites, non-conservative changes are almost as frequent as conservative changes. There is no evidence that at these sites the most drastic amino acid changes may be more strongly selected.
Conclusions: Many similarities are found between the GSI system of Prunus and Maloideae that are compatible with the single origin hypothesis for RNase based GSI. The presence of common features such as the location of positively selected amino acid sites and lysine residues that may be important for ubiquitylation, raise a number of issues that, in principle, can be experimentally addressed in Maloideae. Nevertheless, there are also many important differences between the two Rosaceae GSI systems. How such features changed during evolution remains a puzzling issue.
BackgroundIn flowering plants, self-incompatibility systems can befound that prevent self-fertilization, thus contributing tothe avoidance of inbreeding depression. In the wide-spread gametophytic self-incompatibility (GSI) system,when the S-pollen specificity matches that of the S-pistilthe pollen is recognized as S-locus has been shown to bea S-RNase in Plantaginaceae, Rosaceae and Solanaceae[2]. Phylogenetic evidence, as well as the conserved genestructure (conserved and hypervariable regions, intronnumber and position), suggest that RNase based GSIevolved once before the separation of the Asterideae and
Rosideae [3-6]. In Prunus(Rosaceae) the S-pollen compo-nent is an F-box gene (SFB) [7-11]. In this species, synon-ymous and non-synonymous variability levels are similarat the pollen and pistil S-genes. Furthermore, positivelyselected amino acid sites have been detected at both S-genes that may account for the large number of specifici-ties known to be present in natural populations [11-13].In Maloideae (Rosaceae) species, two (in Malus, calledSFBB- alpha and SFBB-gamma) and three (in Pyrus,called SFBB- alpha, SFBB-gamma, and SFBB-beta) F-boxgenes have been identified as putative S- pollen genes[14]. These genes are located in the vicinity of the S-RNase gene, show pollen-specific expression, and linkagedisequilibrium with the S-RNase[14], but present lowdiversity levels [15].
* Correspondence: [email protected] Instituto de Biologia Molecular e Celular (IBMC); University of Porto, Rua do Campo Alegre 823, 4150-180 Porto, PortugalFull list of author information is available at the end of the article
© 2010 Vieira et al; licensee BioMed Central Ltd. This is an Open Access article distributed under the terms of the Creative CommonsAttribution License (http://creativecommons.org/licenses/by/2.0), which permits unrestricted use, distribution, and reproduction inany medium, provided the original work is properly cited.

Vieira et al. BMC Evolutionary Biology 2010, 10:200http://www.biomedcentral.com/1471-2148/10/200
Page 2 of 15
In Petunia (Solanaceae) one F-box gene, located in theS-locus region and that is responsible for competitiveinteraction (pollen carrying two different pollen S-allelesfails to function in SI) has been identified as the S-pollencomponent [16,17]. Furthermore, the swapping of the N-terminal and C-terminal SLF protein regions betweenSLFs from different specificity haplotypes leads to speci-ficity changes [18]. Nevertheless, in another Solanaceaespecies, namely Nicotiana, the S-pollen gene could not beidentified despite one attempt based on the assumptionthat it is also an SLF-like gene [19]. It should be notedthat it is difficult to establish the phylogenetic relation-ships of F-box S-pollen and S-like sequences [19,20].Although independent recruitments of the S-pollen genehave been suggested based on phylogenetic evidence [19],the hypothesis of a single recruitment cannot be dis-carded because inferred sequence relationships are highlydependent on the alignment and phylogenetic methodused [20].
In order to avoid GSI breakdown the S-pistil and S-pol-len loci must co-evolve. Low recombination levels arethus expected in the S-locus region. Evidence for recom-bination has been, however, found at the S-RNase gene ofSolanaceae and Rosaceae species, as well as in PetuniaSLF and Prunus SFB genes [6,12,13,20-24]. Nevertheless,recombination levels have been estimated at Prunus S-RNase and SFB genes only [13,25,26]. Therefore it isunclear whether the S-RNase gene experiences similarrecombination levels in distantly related species. Differ-ences in recombination levels could, in principle, accountfor some of the differences (for instance the very differentsynonymous variability levels observed at the Solanaceaeand Rosaceae S-RNase gene, or the different number andlocation of positively selected amino acid sites) observedwhen comparing divergent species groups.
Vieira et al. [12] inferred 13, 17 and 27 positivelyselected amino acid sites (those amino acid sites thatdetermine specificity differences) when analyzing 64, 88and 37 S-RNase sequences from Solanaceae, Prunus andMaloideae, respectively. The observed differences in thenumber of positively selected amino acid sites may reflecta true difference. Nevertheless, it is conceivable that afraction of the positively selected amino acid sites mayhave been missed when using PAML [27] and relativelysmall number of lineages [28]. It should be noted that inthat study the size and location of the region analyzed issimilar but that there is little overlap between the posi-tively selected amino acid sites identified in different spe-cies groups.
In Maloideae, the four regions (PS1 - PS4) identified byIshimizu et al. [29], for which the rate of non-synony-mous substitutions exceeds that of synonymous substitu-tions (a sign of positive selection) are accessible to
solvents, and located on either side of the Pyrus pyrifoliaS3-RNase active site cleft [30]. The first three PS regionsare hydrophilic and weakly basic, but PS4 is neutral andhydrophobic. Matsuura et al. [30] argue that it is unlikelythat a single protein could interact with all four PSregions. Therefore, these authors predict that multiple S-pollen proteins should interact with the S-RNase simulta-neously. It should be noted that the structure of the Pyruspyrifolia S3-RNase active site is similar to that observedin other T2-RNases. Indeed, the entire S-RNase main-chain frame works superimposes well with T2- RNases, inparticular the core structures composed of three α-heli-ces and four β-strands. Moreover, even the hypervariableregions present the same secondary elements- one loopand one α-helix.
Different pollen rejection mechanisms are observed inPrunus and Solanaceae. SFB deletion or truncation isobserved in Prunus pollen-part mutants that confer uni-lateral incompatibility by loss of pollen function (Table 1from [31]), suggesting that S-pollen expression is neces-sary for pollen rejection [32,33]. Furthermore in tetra-ploid Prunus species, heteroallelic pollen with twodifferent SFB genes is self-incompatible [34]. Therefore,there is no evidence for competitive interaction in Pru-nus. In this system, the S-pollen protein is assumed toprotect self S-RNases from being inhibited by a general S-RNase inhibitor [35]. Nevertheless, in Solanaceae, thepollen S determinant is assumed to inhibit all S-RNasesexcept that of the corresponding S-haplotype [36,37].This model would explain why heteroallelic pollen withtwo different S-pollen genes is self-compatible (competi-tive interaction) [16,17,38]. Both models imply the inhibi-tion of the S-RNase cytoxicity. A very different model hasbeen proposed in Nicotiana where S-RNases are com-partmentalized in pollen tubes and other proteins such asHT-B (a non-pollen protein) play a fundamental role in S-specific pollen rejection, although they are not involvedin determining S-pollen specificity [39]. In this model,however, it is not clear how S-RNase-SLF interaction con-trols HT-B degradation and membrane breakdown, butpollen specificity is only determined by the SLF gene.
There is no information on the role of conservative andnon-conservative amino acid changes on the creation ofnew specificities. Nevertheless, a model has been pro-posed where new specificities arise through a series ofintermediate mutational steps. The more divergent thenew protein is from the original one, less likely it is to bemisrecognized as the original one [40].
Despite the argument put forward by Raspé and Kohn[41] that few alleles have evolved since the most recentcommon ancestor of Maloideae species, estimates of therate at which new specificities arise, based on a largenumber of sequences, are only available for Prunus [26].
Vieira et al. BMC Evolutionary Biology 2010, 10:200http://www.biomedcentral.com/1471-2148/10/200
Page 3 of 15
Therefore, it is unknown whether specificities arise atsimilar rates in distantly related species groups showingRNase based GSI. It is also unclear whether similar speci-ficity numbers are to be found in distantly related speciesgroups, the degree of specificity sharing between closelyrelated species, or the effect of the history of the speciesgroup being considered.
In conclusion, although all these issues are clearlyimportant in order to understand GSI evolution, most ofthem have been addressed for the Prunus species grouponly [26]. Therefore, in this work we investigate them inthe Maloideae species group. The comparison of the twodivergent Rosaceae species groups that have been diverg-ing for a minimum of 32 million years [42] may shed lighton which issues are likely to be general.
MethodsDatasets and sequence alignmentSequences were retrieved from the NCBI database usingBLAST and GenBank accession AF016920 as a query.Identical sequences were discarded. For the phylogeneticanalyses, two Maloideae S-RNase datasets were used,namely a set of 69 complete sequences (D69) and a set of104 partial sequences (D104) covering the same region asthat analyzed by Vieira et al. [12]. Accession numbers canbe found in Additional file 1 Table S1. Translated aminoacid sequences were aligned using the accurate CLUST-ALW algorithm as implemented in DAMBE [43]. Thisamino acid alignment was used as a guide to obtain thecorresponding nucleotide alignment. The resulting align-ment is slightly different from that used in Vieira et al.[12]. It should be noted, however, that alignment gapsrepresent less than 4% of the number of aligned positions.The same sequence alignment was used for the set of 69and 104 sequences.
Divergence estimatesPer site non-synonymous (Ka) and synonymous (Ks) rateswere estimated using DNasp [44]. Values are Jukes-Can-tor corrected for multiple hits.
Sequence relationships determinationLinearized Minimum Evolution trees were obtainedusing amino acid sequences and the MEGA software [45]while Bayesian trees were obtained using MrBayes [46],and nucleotide sequences. The GTR model of sequenceevolution was used, thus allowing for among-site ratevariation and a proportion of invariable sites. For largedata sets containing very divergent sequences this isalmost always the best fit model of sequence evolution[47]. Third codon positions were also allowed to have agamma distribution shape parameter that is differentfrom that of first and second codon positions. Two simul-taneous and completely independent analyzes, startingfrom random trees, were run for 500,000 generations(each with one cold and three heated chains). Sampleswere taken every 100th generation. The first 1250 sam-ples were discarded (burn-in). Parsimony networks wereobtained using TCS1.21 [48] with the 90% connectivitylimit.
Evidence for recombinationIn order to gather evidence for recombination in theMaloideae datasets, phylogenetic methods were used (thesingle breakpoint analysis and GARD), as implemented indatamonkey server http://www.datamonkey.org/[49].
Estimating the relative importance of recombination and mutation at the Maloideae S-RNase geneWe use the same approach as in Vieira et al.[25,26].Briefly, in order to infer the number of independentrecombination events implied by a given data set, theRDP software [50] was used. The following methods
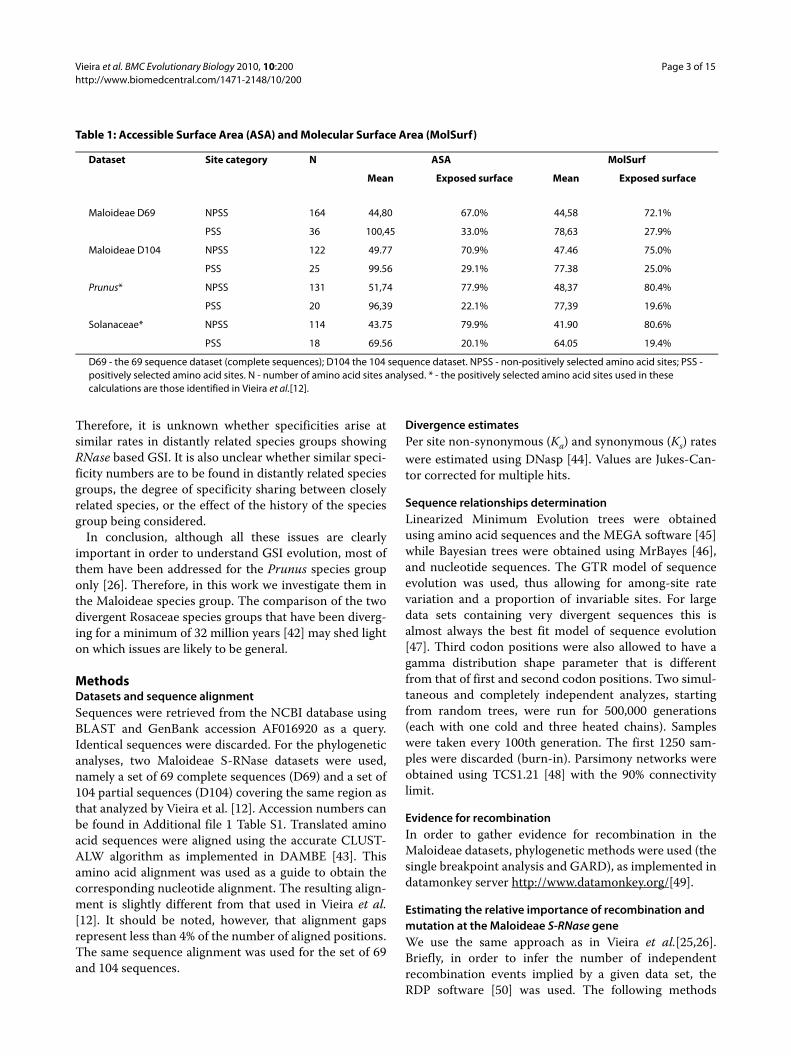
Table 1: Accessible Surface Area (ASA) and Molecular Surface Area (MolSurf)
Dataset Site category N ASA MolSurf
Mean Exposed surface Mean Exposed surface
Maloideae D69 NPSS 164 44,80 67.0% 44,58 72.1%
PSS 36 100,45 33.0% 78,63 27.9%
Maloideae D104 NPSS 122 49.77 70.9% 47.46 75.0%
PSS 25 99.56 29.1% 77.38 25.0%
Prunus* NPSS 131 51,74 77.9% 48,37 80.4%
PSS 20 96,39 22.1% 77,39 19.6%
Solanaceae* NPSS 114 43.75 79.9% 41.90 80.6%
PSS 18 69.56 20.1% 64.05 19.4%
D69 - the 69 sequence dataset (complete sequences); D104 the 104 sequence dataset. NPSS - non-positively selected amino acid sites; PSS - positively selected amino acid sites. N - number of amino acid sites analysed. * - the positively selected amino acid sites used in these calculations are those identified in Vieira et al.[12].

Vieira et al. BMC Evolutionary Biology 2010, 10:200http://www.biomedcentral.com/1471-2148/10/200
Page 4 of 15
(with default options) were used: RDP, Chimaera,BootScan, 3Seq, GeneConv, MaxChi, and SiScan. A givensequence was inferred to be recombinant if at least one ofthe methods identified a recombination tract in thatsequence with a probability < 0.05. For each data set, thetotal number of synonymous mutations implied by thedata was inferred using Yang's [27] methodology, underthe appropriate model (see below).
Identification of positively selected amino acid sitesBoth a phylogenetic (PAML 3.13) [27], and a populationgenetics approach (OmegaMap) [51] were used to iden-tify positively selected amino acid sites. Amino acid siteswithout alignment gaps were considered as positivelyselected if one of the two methods used identifies themwith a posterior probability higher than 95% and theother method identifies them with a posterior probabilityhigher than 50%. Amino acid sites with alignment gapsare not considered for analysis by the phylogeneticmethod. Therefore, amino acid sites with alignment gapsare considered as positively selected if they are identifiedby the population genetics approach with a posteriorprobability higher than 95%.
When using PAML 3.13 [27], the maximum-likelihoodtree that was specified was obtained with PAUP [52] afterusing Modeltest [53] to find the simplest model of nucle-otide sequence evolution that best fits the data, accordingto the Akaike information criterion.
When using OmegaMap, a total of 250000 iterationsand a burn-in of 25000 were used. Ten random sequenceorders were used and all codons were assumed to be atequal frequencies. The size of the codon block used is 30.One objective and one subjective approach were usedwhen specifying the priors. We used the same priors as inVieira et al. [25,26]. Therefore we are assuming lowrecombination rates.
Protein surface estimatesThe Surface Racer program [54] was used to calculate theAccessible Surface Area (ASA) and the Molecular SurfaceArea (MolSurf ) for the Solanaceae (1IOO; Nicotianaalata) and Rosaceae (1IQQ; Pyrus pyrifolia) S-RNasestructures available on the PDB database http://www.rcsb.org[55].
Locating positively selected amino acid sites on the S-RNase structureIn order to determine the location of positively selectedamino acid sites on the S-RNase 3 D structure, the avail-able structures on PDB http://www.rcsb.org[55] wereused, namely 1IOO (Nicotiana alata; Solanaceae), and1IQQ (Pyrus pyrifolia; Rosaceae). When using sequencesfrom Prunus (Rosaceae) or Maloideae species (Rosaceae),the 1IQQ structure was used. When using sequencesfrom Solanaceae species the 1IOO structure was used.
Positively selected amino acid sites were mapped on a ref-erence sequence that was aligned with the sequence cor-responding to the relevant crystal structure usingCLUSTALW with default parameters http://www.ebi.ac.uk/clustalw/. The VMD software http://www.ks.uiuc.edu/Research/vmd/[56] was used to obtaingraphical representations.
Locating lysine residues that might be important for ubiquitylation on the S-RNase structureFor Solanaceae, the Petunia inflata S3 RNase sequence(accession number: AAA33727) was used, since there isexperimental data for this protein regarding ubiquityla-tion [57]. For Maloideae and Prunus, there is no experi-mental data regarding ubiquitylation, and thus the degreeof conservation of lysine residues was used, under theassumption that functionally important lysine residuesare expected to be conserved. Thus, one sequence fromMaloideae (the M. domestica St sequence from the 69complete sequence dataset here used) and one from Pru-nus (the P. aviumS12 sequence from the 88 sequencedataset [12]), showing the highest number of lysine resi-dues were selected. Then, for each of the lysine residueson those sequences the degree of conservation in theentire dataset was determined. Lysine residues were thenlocated on the S-RNase structure, using different colorcodes, in order to reflect their degree of conservation, asdescribed in the previous Material and Methods section.
ResultsPhylogenetic analysesFigure 1 shows the inferred relationship of S-RNasesequences using a Bayesian approach. Alleles areexpected to be maintained for long periods of time whenunder frequency dependent selection [58-60]. Based ondivergence at molecular level as well as inter-fertility,meiotic pairing of chromosomes from different genera,and graft compatibility [see references in [61]], Malus,Pyrus, Sorbus and Crataegus could be closely related gen-era.
Moreover, the average terminal branch length of theMaloideae S-RNases is small, and similar to thoseobserved in species whose S-alleles underwent a burst ofrecent diversification, thus, suggesting a recent origin[62]. The common ancestor to these genera, under theassumption of 32 My for the split between thePrunoideae and Maloideae lineages [42] and a molecularclock for the trnL-trnF, RpoC1, rbcL, matk, 5.8 S ribo-somal RNA, ITS1 and ITS2 genes, is on average, 6.5 mil-lion years (ranging from 2.25 to 11.81 million years;Aguiar et al., unpublished). It should be noted that, underthe assumption of a mutation rate similar to other dicotplants, Sanzol et al. [63] dates the Maloideae origin tobetween 6-15 million years ago. In 2010, Dobeš and Paul

Vieira et al. BMC Evolutionary Biology 2010, 10:200http://www.biomedcentral.com/1471-2148/10/200
Page 5 of 15
Figure 1 Bayesian phylogenetic tree of 104 Maloideae S-RNase sequences. Numbers are posterior credibility values. Inferred recombinant lin-eages are shown in bold.

Vieira et al. BMC Evolutionary Biology 2010, 10:200http://www.biomedcentral.com/1471-2148/10/200
Page 6 of 15
[64] dated the split between Prunus and Spiraea to 26.9to 51.8 million years. Since Spiraea is more closely relatedto Malus/Pyrus than to Prunus [65] the Malus/Pyrus splitmust be younger than 26.9 - 51.8 million years. It shouldbe noted, however, that this interpretation is far frombeing consensual. Based on the fossil record theMaloideae lineage appears to extend back to the MiddleEocene at 37-48 My [42,61,63]. The observation that afossil shares similarities with living species of a givenfamily does not indicate, however, that the fossil taxa ispart of the crown group of living species [42]. DeVore andPigg [66] note that fossils with rosaceous affinities some-times demonstrate a mosaic of characters of severalextant taxa and are difficult to place systematically. Nev-ertheless, the young age here inferred for Maloideae,based on molecular data and the assumption of a molecu-lar clock, has dramatic biogeographic implications giventhe distribution of the genera and the history of plate tec-tonic movements [67]. Campbell et al. [61] suggest thatthe genera Malus, Pyrus and Sorbus, among others, arethe result of an ancient, rapid radiation associated with alow mutation rate. This hypothesis can be tested becausean estimate of the mutation rate can be obtained inde-pendently of the fossil record using the formula θ = 4Neμwhere θ is the average genetic diversity, Ne is the effectivepopulation size, and μ the mutation rate [68,69]. An esti-mate of the effective population size can be obtainedfrom the number of S-alleles present in natural popula-tions, that, as shown in the Specificity numbers section(see below), is smaller than 10000 individuals. The θ valuehas been estimated for Malus [70] and Pyrus [71]. ForPyrus, the average per site silent nucleotide diversityranges from 0.00466 to 0.11603. For Malus, where a largenumber of ESTs were analyzed, one SNP was found every149 bp. Under the assumption that most SNPs are likelyneutral and that third codon positions are nearly neutral,an estimate of 0.02 (1/149 × 3) is obtained. These valuesare similar to those estimated for Potentilla European,North American and Asian populations (ranging from0.0116 0.0219) [64]. When the diversity values are used inthe above mentioned equation, an estimate of 5 × 10⁻⁷ anda minimum estimate of 1.2 × 10⁻⁷ is obtained for themutation rate (per site per generation) for Malus andPyrus, respectively. These values are much higher thanthose obtained for Drosophila, for instance (on the orderof 10-9) [72,73].
It could be argued that overlapping generations andbetween species hybridization could inflate within spe-cies variability levels and thus inflate the mutation rateestimates. Nevertheless, Raspé and Kohn [41] found noevidence for hybridization when looking at the Sorbusaucuparia, Crataegus monogyna, Malus domestica andPyrus species S-RNase gene. It should be noted that
under the assumption that the average generation timefor a Pyrus or Malus tree is on the order of 25 to 50 years,when using the above calculated mutation rates, therange of estimated silent site divergence for two speciesthat have been evolving independently for 5 million yearsis in between 0.012 and 0.10, similar to the silent diver-gence values usually obtained for Pyrus and Malus genecomparisons. In order to fit the molecular data to thedates suggested by the fossil record for the Malus/Pyruslineage split (Middle Eocene, 37-48 My), an average gen-eration time on the order of 500 years must be argued.Given that, at present, the reasons for the observed dis-crepancy between the fossil record and the moleculardata are unknown, the dating of the Pyrus/Malus splitshould be regarded with caution. It should be noted that,in this work, the only place where this becomes an impor-tant issue is in this section. It should be noted that impor-tant discrepancies between the fossil record andmolecular dating are observed for other Rosaceae sub-tribes. For instance, Dobeš and Paul [64] find importantdiscrepancies between the fossil record and moleculardating for the old Fragariinae lineages but not for the dat-ing of the Fragariinae genera (see Table two of [64]).
Although few polytomies are shown in the tree shownin Figure 1, most of the sequence relationships seem to bewell resolved. The oldest Maloideae specificity lineagesseem to be about 23 million years old, a number thatcompares well with that observed for the Prunus speciesgroup (15-20 million years old) [26] using the same meth-odology (a linearized amino acid Minimum Evolutiontree and the assumption that 1% amino acid divergence atthe S-RNase gene corresponds to one million years [26];data not shown). Nevertheless, under the assumptionthat the Malus/Pyrus lineage split occurred in MiddleEocene at around 37-48 My), the oldest Maloideae speci-ficity lineages must be much older. As noted above, themaintenance of allele specificities for long periods of timeis a feature of self-incompatibility systems [58-60].
Evidence for recombination at the S-RNase geneThe S-locus is expected to be located in a region withsuppressed recombination levels. Furthermore, most ofthe rare recombination events are expected to be shortgene conversion events because they are less likely toresult in specificity changes. Thus, at the S-RNase, geneconversion is expected to be much less important thanmutation. When using the single breakpoint analysis, asimplemented in the datamonkey server [49] (see Materialand Methods), and the dataset of 69 complete sequences(the alignment is 708 positions long and there are 54gapped positions), a model that assumes a recombinationbreakpoint at site 433 fits significantly better the data(when using the cAIC (corrected Akaike information cri-teria) an improvement of 515.6 is obtained). When using

Vieira et al. BMC Evolutionary Biology 2010, 10:200http://www.biomedcentral.com/1471-2148/10/200
Page 7 of 15
GARD a similar result is obtained. The cAIC score of thebest fitting GARD model, the one that allows for differenttopologies between segments (22726.5), is preferred overthe model that assumes the same tree for all the parti-tions but allows different branch lengths between parti-tions (23358.9). Thus, at least one of the breakpointsreflects a true topological incongruence (the one inferredat position 414; P < 0.01; Kishino Hasegawa topologicalincongruence test). The dataset containing 104 partial S-RNase sequences is too large to be analyzed using thedatamonkey server.
Given the evidence for recombination, we estimatedthe relative importance of gene conversion and mutation,using the approach described in Vieira et al. [26]. Thenumber of inferred independent recombination events is17 and six when using the dataset containing 69 completeor 104 partial S-RNase sequences, respectively. The num-ber of inferred synonymous mutations is 571.1 and 484.9,respectively. Therefore, 0.030 and 0.012 recombinationevents per synonymous mutation are inferred, respec-tively. In Figure 1, the inferred recombinant lineages(when using the dataset containing 104 sequences) areshown in bold. At least 19.2% of all sequences used seemto show evidence for an ancestral recombination event.
Identification of positively selected amino acid sitesIn the only report concerning the identification of posi-tively selected amino acid sites in Maloideae S-RNases, 37partial N- and C-terminal sequences were used [12]. Inorder to make meaningful comparisons with the Prunusfindings, where large datasets have been used (N = 88;[12]) it is important to infer most positively selectedamino acid sites in the Maloideae S-RNase protein. Atpresent, in GenBank, there are 104 partial and 69 com-plete non-redundant Maloideae S-RNase sequences.Therefore we can also address if the first 39 and last 33amino acid positions of the Maloideae S-RNase protein,not analyzed before, harbor positively selected aminoacid sites. Using the same criteria as in Vieira et al.[12],there is evidence for positively selected amino acid sitesall over the protein but not in the first 67 amino acid posi-tions (Figure 2). Thus, an effort should be made in futureworks to include the complete C-terminal end of the pro-tein.
By performing simulations in EVOLVER, Castric andVekemans [28] revealed that the power for the maximumlikelihood analysis with CODEML is low when sequenceswere only slightly divergent or when sequence divergencereached saturation, and that it increases at intermediatelevels of divergence. Since it is difficult to determine howmany and what sequences should be used in order to beable to detect all positively selected amino acid sites, here,we use two different datasets (69 complete and 104 par-tial S-RNase sequences). In the ungapped region that
could be compared, four and one new positively selectedamino acid sites were identified when increasing the sam-ple size from 37 (the dataset used in [12]) to 69 and from69 to 104, respectively. Unexpectedly, five and six aminoacid positions were no longer recognized as positivelyselected when increasing the sample size from 37 to 69and from 69 to 104, respectively.
When the sample size is increased from 37 to 69, in twoout of the five cases the probability of the amino acid sitebeing positively selected drops from above 80% to below50% when using the phylogenetic method. In the otherthree cases the probability of the amino acid site beingpositively selected remains high when using the phyloge-netic method but drops below 50% when using the popu-lation genetics method. On the other hand, when thesample size is increased from 69 to 104, in four out of thesix cases where the amino acid site is no longer recog-nized as being positively selected, the probability of theamino acid site being positively selected drops fromabove 95% to below 60% when using the phylogeneticmethod. In the other two cases the probability of theamino acid site being positively selected remains highwhen using the phylogenetic method but, drops below50% when using the population genetics method.
There is evidence for recombination in the datasets andthus it could be argued that only OmegaMap [51] shouldbe used. When using only OmegaMap and amino acidsites that have more than 95% probability of being posi-tively selected, nine and four new positively selectedamino acid sites are detected when using the D69 andD104 datasets, respectively. Nevertheless, these arelocated within blocks of positively selected amino acids,and thus, since a block of size 30 was used, these could befalse positives. It should be noted that 12 and five posi-tively selected amino acid sites are no longer identifiedwhen using this criteria and the D69 and D104 datasets,respectively (Figure 2).
In order to be conservative and to be able to comparewith published results using the same criteria, we consid-ered as positively selected only those amino sites thatobey to the criteria used in Vieira et al. [12], and that arefound when using the 104 sequence data set. Moreover,we also considered as positively selected those amino acidsites that were identified as such, in the regions not cov-ered by the 104 sequence dataset, when using the datasetwith 69 sequences. In total, there are 33 non-gapped andseven gapped positively selected amino acid sites (Figure2).
Distribution of amino acid sites determining specificity differencesTable 1 shows the average exposed surface and percent-age of exposed surface for positively and non-positivelyselected amino acid sites. As expected, given that posi-

Vieira et al. BMC Evolutionary Biology 2010, 10:200http://www.biomedcentral.com/1471-2148/10/200
Page 8 of 15
tively selected amino acid sites should be located at thesurface of the protein, the average exposed surface ishigher for positively selected amino acid sites than fornon-positively selected amino acid sites (for theMaloideae D69, Maloideae D104 and Prunus datasetsand for both measures P <0.001; for Solanaceae and forboth measures P <0.01; non-parametric Mann-Whitneytest). For the Prunus and Solanaceae datasets, dependingon the method used, in between 19-22% of the S-RNaseexposed surface is occupied by positively selected aminoacid sites. In Maloideae, positively selected amino acidsites represent in between 27.9 and 33.0% of the proteinsurface. This difference is observed even when the sameregion is analysed (compare the Maloideae D104, thePrunus and Solanaceae datasets).
It could be argued that the exposed surface occupied bypositively selected amino acid sites is the same in thedatasets being compared, but that in some datasets not allpositively selected amino acid sites were identified. Nev-ertheless, the Prunus (88 sequences) and Solanaceae (64sequences) datasets analysed in Vieira et al. [12] are large.Thus, at least in the case of Prunus, it seems unlikely thatincreasing the dataset from 88 to 104 sequences (as in theMaloideae dataset) would lead to a substantial (about20%) increase in the number of identified positivelyselected amino acid sites.
Figure 3 shows the location of positively selected aminoacid sites on the 3 D structure. Positively selected aminoacid sites are found in clusters on the Pyrus crystal struc-ture, mostly around the active site pocket region. Thedata available for Solanaceae and Prunus is, so far, com-patible with this view.
Distribution of lysine residues that may be important for ubiquitylationIt has been suggested that, in Petunia inflata (Solan-aceae), the S-pollen component may target non-selfRNases for ubiquitin/26 S proteasome-mediated degra-dation [36,37,57]. The recognition signal for degradation
by the 26 S proteasome is a polyubiquitin chain that isusually attached to a lysine residue in the target protein[74]. Therefore, Hua and Kao [57] mutated to arginine allof the 20 lysine residues present at the Petunia inflata S3-RNase. This approach led to the identification of sixlysine residues near the C-terminus that, when mutated,significantly reduce ubiquitination and degradation of theS-RNase.
Although RNase based GSI seems to have evolved onlyonce [3-6] there are no conserved lysine residues in all S-RNases that could serve as common ubiquitylation sites[75]. However, it is conceivable that in different species,different lysine residues perform this function. Not alllysine residues need, however, to be involved in ubiquity-lation. Indeed, in Solanaceae S-RNases, the three mostwell conserved lysine residues, located in conservedregions C4 and C5, are not important for ubiquitylation[57,76]. In Figure 4, in both Maloideae and Prunus thereare lysine residues that are present in more than 75% fre-quency that are located in the same region as those iden-tified in Petunia inflata S3 RNase as being important forubiquitylation.
Amino acid changes observed at positively selected amino acid sitesLittle is known about the type of amino acid changesinvolved in the creation of new specificities. While itcould be argued that conservative amino acid changes arelikely more viable given the constraints imposed by the S-RNase 3 D structure, it could also be argued that non-conservative amino acid changes likely result in moredrastic changes and thus, could more easily be recog-nized as different specificities. This is an important issuesince, for instance, in the generator model not all aminoacid changes are supposed to be equally clearly distin-guished as a new specificity [40].
In order to determine the type of amino acid changesobserved at positively selected amino acid sites, closelyrelated sequences must be used since this approach
Figure 2 Maloideae positively selected amino acid sites. The Pyrus communis Sa sequence (PcSa) is the reference. D37 - the 37 sequence dataset of Vieira et al. [12]; D69 - the 69 sequence dataset (complete sequences); D104 - the 104 sequence dataset. The region that is not analysed when using the D37 and the D104 datasets is shown in bold and italics, respectively. * - non-gapped positively selected amino acid sites; # - gapped positively selected amino acid sites. In gray are shown the amino acids that are identified as positively selected when using OmegaMap only. It should be noted that, the alignment used in Vieira et al. [12] is not the same as that used for the D69 and D104 datasets.
-------- 10------ -20------- 30--------40--------50--------60--------70--------80--------90--------100 110 120 PcSa MGITGIIYMVTMVFLLIVLILPSPTVG-YDYFQFTQQYQLAVCHFNPTPCKDPPDKLFTVHGLWPSNSTGNDPMYCKNT----TLNSTKIANLTAQLEIIWPNVLDRTDHITFWNKQWNKHGSCG- D37 ** * ** ## *#**#### *#* * ** * * * D69 ** * ** a** ##* * a** * * * ** * * D104 ** * * a**######* *# ** * ** * * Trusted ** * * **######* *# ** * ** * * 130 140 150 160 170 180 190 200 210 220 230 PcSa RPAIQNDMHYLQTVIKMYITQKQNVSEILSKAKIEPVGRFWTQKEIEKAIRKGTNNKEPKLKCQRNTQG--TELVEVTICSDRNLKQFIDCPRPILNGSRYYCPTNNILY D37 * * * ** *** * *###* D69 * * ** * * * * *** * * *** * * * * D104 * ** *** * Trusted * ** *** *** * * *** * * * *

Vieira et al. BMC Evolutionary Biology 2010, 10:200http://www.biomedcentral.com/1471-2148/10/200
Page 9 of 15
Figure 3 Two views of the distribution of positively selected amino acid sites on the S-RNase crystal structure. The Pyrus pyrifolia (Rosaceae; 1IQQ) structure is shown when using the Maloideae (Rosaceae) (A1, and A2) and Prunus (Rosaceae) (B1, and B2) datasets, while the Nicotiana alata (Solanaceae; 1IOO) structure is shown when using the Solanaceae dataset (C1, and C2). Alpha helices are represented as tubes and beta-sheets as thin sheets. Positively selected sites are highlighted in yellow. Regions marked in blue correspond to those regions of the S-RNase protein that were not inspected for the presence of positively selected amino acid sites [12].

Vieira et al. BMC Evolutionary Biology 2010, 10:200http://www.biomedcentral.com/1471-2148/10/200
Page 10 of 15
reduces the risk of wrong inference, due to multiplemutations at the same codon. Thus, for this analysis, weused only those sets of sequences that could be connectedin a parsimony network with a connectivity limit of 90%.The parsimony networks imply a minimum of 48 inde-pendent replacement mutations at positively selectedamino acid sites.
When charge, volume and polarity are considered thefollowing groups of amino acids can be defined RHK, DE,NQ, C, AGPST, ILMV, and FWY. According to this classi-fication, at positively selected amino acid sites, conserva-tive amino acid changes represent 54% of all amino acidchanges. Based on a large number of proteins, about 35%of the changes are expected to be conservative (see Figurefour in [77]).
Rate of appearance of new specificitiesIn order to confirm if two different S-RNase sequencesrepresent different specificities, ideally crosses should bemade between individuals harboring these sequences.Although technically possible, these experiments are verytime consuming. Moreover, often, when studying individ-uals from natural populations this is not possible, sinceindividuals are not marked in the field, and/or because itimplies to cross different species [26]. In addition, whencrosses are performed between different species, factorsother than S-specificities may determine whether viableprogeny is obtained [1]. An estimate of the rate of appear-ance of new specificities can be, however, obtained underthe assumption that a single amino acid change at a posi-tively selected amino acid site is enough to create a newspecificity. The same assumption has also been used in
Figure 4 Lysine amino acid residues mapped onto the S-RNase crystal structure. The Pyrus pyrifolia (Rosaceae; 1IQQ) structure is shown when using the Maloideae (Rosaceae) (A) and Prunus (Rosaceae) (B) datasets, while the Nicotiana alata (Solanaceae; 1IOO) structure is shown when using the Solanaceae dataset (C). Alpha helices are represented as tubes and beta-sheets as thin sheets. In panels A and B, lysine residues that are present in less than 50%, in between 50% and 75%, or in more than 75% frequency are colored in green, yellow and red, respectively. In panel C, the lysine residues shown to be important for ubiquitylation in Petunia inflata S3 RNase are labeled in red, while all other lysine residues are colored green. Re-gions marked in blue correspond to those regions of the S-RNase protein that were not inspected for the presence of lysine amino acid residues (see Material and Methods).

Vieira et al. BMC Evolutionary Biology 2010, 10:200http://www.biomedcentral.com/1471-2148/10/200
Page 11 of 15
Prunus [12]. It should be noted that in Prunus spinosatwo S-RNase alleles that differ in only one amino acidposition identified as being under positive selection havebeen found in the same individual [11]. Since differentsets of positively selected amino acid sites are inferredwhen using different data sets, in an attempt to be con-servative we use only those sites inferred to be positivelyselected, when using the largest data set. Thus, since thisdata set does not cover the entire gene and positivelyselected amino acid sites were identified in the regionsnot included, this could be an underestimate. Theapproach here used is identical to that in Vieira et al.[26].Additional file 2 Table S2 shows the per site synonymous(Ks) and non-synonymous values (Ka), number of aminoacid differences, and number of amino acid differences atpositively selected amino acid sites between closelyrelated sequences (pairs of sequences with an estimatedamino acid divergence smaller than 5% when using a lin-earized Minimum Evolution tree). Using this data theestimated rate is one new specificity per 7.7% synony-mous divergence, or alternatively 1.92% nonsynonymousdivergence. For comparative purposes, it should be men-tioned that the estimated rate in Prunus is one new speci-ficity per 5.1% synonymous divergence [26]. InMaloideae, for pairs of closely related amino acidsequences, 26.5% of all amino acid changes are observedat positively selected amino acid sites. Nevertheless, atthe S-RNase, the fraction of positively selected aminoacid sites is only 14.6%.
Specificity numbersThe assumption that sequences with more than 5%amino acid divergence represent different specificities, asassumed in Vieira et al. [26], seems reasonable given: i)the above estimate of one amino acid change at a posi-tively selected amino acid site every 1.92% nonsynony-mous divergence units; ii) assuming a Poissondistribution, the probability that a sequence pair showingmore than 5.8% non-synonymous divergence does nothave a hit at a positively selected amino acid site is lessthan 5%. Table 2 shows the number of estimated specific-ities for different Maloideae genera under this assump-tion. Inferences made using natural population samplesled to estimates of 40 or less alleles [41]. Such numbersare compatible with effective population sizes smallerthan 10000 [26] and are close to our estimate of 35 speci-ficities for the ancestral Maloideae population. Table 3shows the percentage of ancestral specificities sharedbetween Maloideae genera. At least 15% of the ancestralspecificities are shared among genera. Nevertheless, thisnumber could be greatly underestimated due to the smallsample size for some genera. For instance, for the Malus/Pyrus and the Malus/Sorbus comparison this number is52% and 65%, respectively. This is not surprising given
that the number of specificities inferred to be present inthe ancestral Maloideae species (35 specificities) is notmuch higher than the number found in each genus (Table2).
DiscussionIn order to avoid GSI breakdown the S-pistil and S-pollengenes must co-evolve. Nevertheless, at the Maloideae S-RNase gene, as well as in Prunus S-RNase and SFB genes,and in Petunia S-RNase, there is evidence for recombina-tion [6,12,13,20-24]. Indeed, 19.2% of the availableMaloideae S-RNase sequences show evidence of a recom-bination event. Since the sequences that show evidence ofthe same recombination event are often from differentgenera, the inferred recombination events must be old(Figure 1). Most of the inferred recombination events areassumed to be short intragenic gene conversion eventsthat did not result in amino acid changes at the positivelyselected amino acid sites that determine specificity differ-ences. For the Maloideae group of species, in between0.012 and 0.030 recombination events are inferred persynonymous mutation. The first estimate (0.012) com-pares well with the estimate obtained for the Prunus S-RNase and SFB genes (0.013 and 0.011 respectively) [25]while the second estimate is closer to that obtained for agene in the S-locus region that is not involved in specific-ity determination (the Prunus SLF1 gene; for this gene theestimate is 0.022) [25]. Given the likely high varianceassociated with these estimates, we can conclude that thePrunus and Maloideae S-RNase genes experience similarrecombination levels. Given that Prunus and Maloideaespecies have been diverging for at least 32 million years[42,63,64], low levels of intragenic recombination (on theorder of one recombination event per 30 90 synonymoussubstitutions) are likely to be a general feature of S-RNasebased GSI systems.
The effect of the use of different datasets, when using aphylogenetic approach [27], on the identification of posi-tively selected amino acid sites is here addressed. For theungapped region that could be compared, increasing thesample size from 37 to 69 and from 69 to 104, leads to the
Table 2: Estimated specificity numbers for Maloideae genera, under the assumption that the genera are about 5 million years old
Genus/Subfamily Specificity number
Malus 17
Pyrus 27
Sorbus 16
Crataegus 7
Maloideae 35

Vieira et al. BMC Evolutionary Biology 2010, 10:200http://www.biomedcentral.com/1471-2148/10/200
Page 12 of 15
identification of five and one new positively selectedamino acid sites, respectively. Therefore, it seems that, atleast for Maloideae, a sample size on the order of 100sequences is needed in order to be able to detect the vastmajority of positively selected sites. Positively selectedamino acid sites were identified in the last 41 amino acidsof the S-RNase protein, when using the set of 69 S-RNasecomplete sequences. Thus, in the future an effort shouldbe made to include this region when characterizing S-RNase alleles. When using smaller sample sizes, posi-tively selected amino acid sites are identified that whenthe sample size is increased are no longer identified. Thisunexpected behavior is difficult to understand, sincethere is no clear pattern in the results obtained, butshould be seriously considered, since it is observed evenwhen 69 sequences are used.
Here, for the S-RNase Maloideae sequences, we inferthe presence of 33 ungapped positively selected aminoacid sites. For comparison, when the same S-RNaseregion is considered, 17 [12] and 24 ungapped positivelyselected amino acid sites are detected in the Prunus andMaloideae species groups, respectively. Taking intoaccount that about 100 sequences seem to be enough todetect the vast majority of positively selected amino acidsites, and that in the Prunus analyses 88 S-RNasesequences were used [12], it seems likely that there aremore positively selected amino acid sites at the S-RNaselocus in the Maloideae than in the Prunus species group.Ma and Oliveira [78] and Sassa et al. [14] suggested thatthe S-RNase alleles of Maloideae diverged more recentlythan those of Prunus. The higher Ka/Ks ratio in Maloideaethan in Prunus, observed by Ma and Oliveira [78] andVieira et al. [12], that is confirmed when using large sam-ple sizes for the same region (for Maloideae based on the104 sequence set here used: Ka = 0.219; Ks = 0.227; forPrunus based on the 88 sequence set used by Vieira et al.[12]: Ka = 0.143; Ks = 0.241), may be mainly due to thepresence of more positively selected amino acid sites inMaloideae than in Prunus.
Positively selected amino acids seem to be spread overthe entire protein, as remarked before [12,79], with theexception of the first 67 amino acids (Figure 2). Based on
these inferences, and the assumption that a single differ-ence at a positively selected amino acid is enough to cre-ate a new specificity, one new specificity is estimated toappear every 7.7% per site synonymous divergence oralternatively every 1.92% per site nonsynonymous diver-gence. For comparative purposes, it should be mentionedthat the estimated rate in Prunus is one new specificityevery 5.1% per site synonymous divergence [26].
When charge, volume and polarity are considered, atpositively selected amino acid sites, 46% of all changes arenon-conservative amino acid changes. It is conceivablethat nonconservative amino acid changes at positivelyselected amino acid sites are more strongly selected thanconservative amino acid changes at those same sites,since the new specificity could be more easily recogniz-able as being different from the original specificity. Nev-ertheless, there are more conservative changes thanexpected (54% rather than the expected frequency of 35%[77]). It should be pointed out that, in the generatormodel, new specificities are created through several stepswhere intermediate steps have some chance of not beingrecognized as a new specificity [40]. Very likely, old spec-ificities are replaced by the newly evolved specificities,due to the small effective population size of each specific-ity. Old specificities may, however, be brought back to thepopulation by migration from other populations [80].Although less than 22 sequences are deposited in Gen-Bank for the most studied Maloideae species (Additionalfile 1 Table S1), for S. aucuparia 40 different specificitieshave been inferred [41]. In the ancestral to the Malus,Pyrus and Sorbus genera, at least 35 different specificitiesare inferred to have been present. This observation iscompatible with no great changes in population size inthe recent history of the Maloideae species here studied,in contrast with what seems to have happened in therecent history of Prunus species [6,26].
Positively selected amino acid sites are found in clusterson the Pyrus crystal structure, mostly around the activesite pocket region. Thus, we find no support for Mat-suura et al. [30] conclusion that multiple S-pollen pro-teins must bind the S-RNase protein simultaneously. InMaloideae, about 30% of the exposed protein surface is
Table 3: Ancestral S-RNase lineages shared between Maloideae genera
Genus Lineages shared with
Malus Pyrus Sorbus Crataegus
Malus - 14/17 (82%) 11/17 (65%) 3/17 (18%)
Pyrus 14/27 (52%) - 14/27 (52%) 4/27 (15%)
Sorbus 11/16 (69%) 14/16 (88%) - 3/16 (19%)
Crataegus 3/7 (43%) 4/7 (57%) 3/7 (43%) -

Vieira et al. BMC Evolutionary Biology 2010, 10:200http://www.biomedcentral.com/1471-2148/10/200
Page 13 of 15
made of positively selected amino acid sites. For compari-son, in Prunus, where only one gene is responsible fordetermining S-pollen specificity, only 22% of the exposedprotein surface is made of positively selected amino acidsites. In Solanaceae, where a single S-pollen gene seemsto be involved [16,38,81,82] about 20% of the exposedprotein surface is made of positively selected amino acidsites. It should be noted that the S-RNase crystal struc-ture is very similar to the structure observed in other T2-RNases.
Different pollen rejection mechanisms have been pro-posed for Solanaceae [36,37] and Prunus[35], while forMaloideae, models involving one or several S-pollen pro-teins and multiple possible mechanisms have been pro-posed [14].
In Solanum/Petunia, the pollen S determinant isassumed to inhibit all S-RNases except that of the corre-sponding S-haplotype [36,37]. This may be achievedthrough the ubiquitylation of non-self S-RNases that aretargeted to the 26 S proteosome [57]. As shown in thiswork, the relative locations of positively selected aminoacid sites and lysine residues experimentally verified to beimportant for ubiquitylation [57] are compatible with theview that the S-pollen protein (an F-box protein) couldubiquitylate the S-RNase. It should be noted that underthis model, amino acid sites involved in specificity deter-mination are the ones impeding the binding of the self-compatible pollen protein. The compartmentalizationmodel inferred for Nicotiana (another Solanaceae genus)also predicts an interaction between the non-self pollenprotein and the S-RNase. In the absence of such an inter-action, the HT-B protein disrupts the vacuolar compart-ment where S-RNases are sequestered releasing theminto the cytoplasm of the growing pollen tube, thus lead-ing to pollen tube growth arrest. When a non-self pollenprotein interacts with the S-RNase the HT-B protein isdegraded and S-RNases remain sequestered in the vacuo-lar compartment [39]. The role of protein ubiquitylationis unclear in this model since there is no need to degradethe S-RNase if it remains on the vacuolar compartment.It should be noted, that Nicotiana S-RNase sequencesshow at high frequency two lysine residues in the sameregion where six lysine residues important for ubiquityla-tion have been identified in the P. inflata S3 RNase pro-tein (data not shown).
In Prunus, the S-pollen protein is assumed to protectself S-RNases from being inhibited by a general S-RNaseinhibitor [35]. It is conceivable that the general inhibitorbinds the S-RNase active site pocket, thus inhibitingRNase activity. If true, then it could be predicted that self-compatible S-pollen protein should bind the activepocket region, thus impeding the binding of the generalinhibitor. It should be noted that, in the inferred Prunus
S-RNase structure, there are lysine residues, that arehighly conserved, and that are located in the same regionwhere lysine residues important for S-RNase ubiquityla-tion have been described in Petunia. Given the relativelocations of positively selected amino acid sites and theselysine residues, it seems plausible that the same proteincould interact with both. The role of protein ubiquityla-tion (if any) is unclear in this model. It can be, however,hypothesized that the putative S-RNase inhibitor couldlabel the S-RNase protein for degradation by the protea-some through ubiquitylation of the above mentionedlysine residues. This would explain why in Prunus, dele-tion of the S pollen component (the SFB gene) leads toself-compatibility. Furthermore, by binding to the S-RNase, the self S-pollen component would protect the S-RNase from ubiquitylation and consequent degradationby the proteasome. This model makes two important pre-dictions, namely, that the so called general inhibitor isable to ubiquitylate the S-RNase, that deletion of the gen-eral inhibitor should result in generalized self-incompati-bility, and thus be lethal.
Maloideae species are more closely related to Prunusspecies than to Solanaceae species. Therefore, it could beargued that the model developed for Prunus should beconsidered the working hypothesis. Nevertheless, there isno evidence for competitive interaction in Prunus, incontrast to what is observed in Solanaceae and Maloideaespecies [1]. Thus, it seems more logical to consider themodels described in Solanaceae as working hypothesesfor Maloideae. It should, however, be noted that inMaloideae multiple genes have been proposed as the S-pollen [14]. So far, none of the models proposed for otherspecies include this possibility. There are highly con-served lysine residues in the region where six lysine resi-dues important for ubiquitylation have been identified inthe P. inflata S3 RNase protein. Thus, the workinghypothesis being considered for Maloideae should takeinto account the possible role of lysine ubiquitylation.
ConclusionThere are many similarities between the GSI system ofPrunus and Maloideae (variability levels at the S-RNase,low levels of intragenic recombination, age, the possiblerole of lysine ubiquitylation) as expected, since RNasebased GSI seems to have evolved only once before theseparation of the Asterideae and Rosideae [6]. Neverthe-less, there are also many important differences betweenthe two model systems (specificity numbers in the ances-tral populations, number of positively selected aminoacid sites, and competitive interaction, for instance). Howsuch features changed during evolution remains a puz-zling issue.

Vieira et al. BMC Evolutionary Biology 2010, 10:200http://www.biomedcentral.com/1471-2148/10/200
Page 14 of 15
Additional material
Authors' contributionsJV and CPV conceived the design of the study. All authors performed the anal-yses and participated in the results discussion and helped writing the final ver-sion of the manuscript. All authors read and approved the final manuscript.
AcknowledgementsThis work has been funded by Fundação para a Ciência e Tecnologia (POCI/BIA-BDE/59887/2004, and PTDC/BIA-BEC/100616/2008, funded by POCI 2010, co-funded by FEDER funds, and COMPETE (FCOMP-01-0124-FEDER-008923). Pedro G Ferreira is the recipient of the FCT grant SFRH/BPD/42003/2007
Author Details1Instituto de Biologia Molecular e Celular (IBMC); University of Porto, Rua do Campo Alegre 823, 4150-180 Porto, Portugal, 2Centre for Genomic Regulation; C/Dr. Aiguader, 88; 08003 Barcelona, Spain and 3CRACS-INESC Porto, Rua do Campo Alegre 1021/1055, 4169-007 Porto, Portugal
References1. de Nettancourt D: Incompatibility in Angiosperms. Springer-Verlag, Berlin
1977.2. Wang Y, Wang X, Skirpan AL, Kao TH: S-RNase-mediated self-
incompatibility. Journal of Experimental Botany 2003, 54:115-122.3. Igic B, Kohn JR: Evolutionary relationships among self-incompatibility
RNases. Proceedings of the National Academy of Sciences 2001, 98:13167-13171.
4. Steinbachs JE, Holsinger KE: S-RNase-mediated Gametophytic Self-Incompatibility is Ancestral in Eudicots. Molecular Biology and Evolution 2002, 19:825-829.
5. Roalson EH, McCubbin AG: S-RNases and sexual incompatibility: structure, function and evolutionary perspectives. Molecular Phylogenetics and Evolution 2003, 29:390-506.
6. Vieira J, Fonseca NA, Vieira CP: An S-RNase-based gametophytic self-incompatibility system evolved only once in Eudicots. Journal of Molecular Evolution 2008, 67:179-190.
7. Entani T, Iwano M, Shiba H, Che FS, Isogai A, Takayama S: Comparative analysis of the self-incompatibility (S-) locus region of Prunus mume: identification of a pollen-expressed F-box gene with allelic diversity. Genes Cells 2003, 8:203-213.
8. Ushijima K, Sassa H, Dandekar AM, Gradziel TM, Tao R, Hirano H: Structural and transcriptional analysis of the self-incompatibility locus of almond: identification of a pollen-expressed F -box gene with haplotype-specific polymorphism. Plant Cell 2003, 15:771-781.
9. Yamane H, Ikeda K, Ushijima K, Sassa H, Tao R: A Pollen-Expressed Gene for a Novel Protein with an F-box Motif that is Very Tightly Linked to a Gene for S-RNase in Two Species of Cherry, Prunus cerasus and P. avium. Plant Cell Physiology 2003, 44:764-769.
10. Romero C, Vilanova S, Burgos L, Martínez-Calvo J, Vicente M, Llácer G, Badenes ML: Analysis of the S-locus structure in Prunus armeniaca L. Identification of S-haplotype specific S-RNase and F-box genes. Plant Molecular Biology 2004, 56:145-157.
11. Nunes MDS, Santos RAM, Ferreira SM, Vieira J, Vieira CP: Variability patterns and positively selected sites at the gametophytic self-incompatibility pollen SFB gene in a wild self-incompatible Prunus spinosa (Rosaceae) population. New Phytologist 2006, 172:577-587.
12. Vieira J, Morales-Hojas R, Santos RAM, Vieira CP: Different positively selected sites at the gametophytic self-incompatibility pistil S-RNase gene in the Solanaceae and Rosaceae (Prunus, Pyrus and Malus). Journal of Molecular Evolution 2007, 65:175-185.
13. Vieira J, Santos RA, Ferreira SM, Vieira CP: Inferences on the number and frequency of S-pollen gene (SFB) specificities in the polyploid Prunus spinosa. Heredity 2008, 101:351-358.
14. Sassa H, Kakui H, Miyamoto M, Suzuki Y, Hanada T, Ushijima K, Kusaba M, Hirano H, Koba T: S Locus F-Box Brothers: Multiple and Pollen-Specific F-Box Genes With S Haplotype-Specific Polymorphisms in Apple and Japanese Pear. Genetics 2007, 175:1869-1881.
15. Kakui H, Tsuzuki T, Koba T, Sassa H: Polymorphism of SFBB-γ and its use for S genotyping in Japanese pear (Pyrus pyrifolia). Plant Cell Reproduction 2007, 26:1619-1625.
16. Sijacic P, Wang X, Skirpan AL, Wang Y, Dowd PE, McCubbin AG, Huang S, Kao TH: Identification of the pollen determinant of S-RNase-mediated self-incompatibility. Nature 2004, 429:302-305.
17. Tsukamoto T, Ando T, Watanabe H, Marchesi E, Kao TH: Duplication of the S-locus F-box gene is associated with breakdown of pollen function in an S-haplotype identified in a natural population of self-incompatible Petunia axillaris . Plant Molecular Biology 2005, 57:141-153.
18. Hua Z, Meng X, Kao TH: Comparison of Petunia inflata S -Locus F-box protein (Pi SLF) with Pi SLF like proteins reveals its unique function in S-RNase based self-incompatibility. Plant Cell 2007, 19:3593-3609.
19. Wheeler D, Newbigin E: Expression of 10 S -Class SLF-like genes in Nicotiana alata pollen and its implications for understanding the pollen factor of the S locus. Genetics 2007, 177:2171-2180.
20. Vieira J, Fonseca NA, Vieira CP: RNase -based gametophytic self-incompatibility evolution: questioning the hypothesis of multiple independent recruitments of the S-pollen gene. Journal of Molecular Evolution 2009, 69:32-41.
21. Schierup MH, Mikkelsen AM, Hein J: Recombination, Balancing Selection and Phylogenies in MHC and Self-Incompatibility Genes. Genetics 2001, 159:1833-1844.
22. Wang X, Hughes AL, Tsukamoto T, Ando T, Kao TH: Evidence that intragenic recombination contributes to allelic diversity of the S-RNase gene at the self incompatibility (S) locus in Petunia inflata. Plant Physiology 2001, 125:1012-1022.
23. Vieira CP, Charlesworth D, Vieira J: Evidence for rare recombination at the gametophytic self-incompatibility locus. Heredity 2003, 91:262-267.
24. Ortega E, Boskovic RI, Sargent DJ, Tobutt KR: Analysis of S-RNase alleles of almond (Prunus dulcis): characterization of new sequences, resolution of synonyms and evidence of intragenic recombination. Molecular Genetics and Genomics 2006, 276:413-426.
25. Vieira J, Teles E, Santos RAM, Vieira CP: Recombination at Prunus S-locus region SLFL1 gene. Genetics 2008, 180:483-491.
26. Vieira J, Fonseca NA, Santos RAM, Habu T, Tao R, Vieira CP: The number, age, sharing and relatedness of S-locus specificities in Prunus . Genetics Research 2008, 90:17-26.
27. Yang Z: PAML: a program package for phylogenetic analysis by maximum likelihood. CABIOS 1997, 13:555-556.
28. Castric V, Vekemans X: Evolution under strong balancing selection: how many codons determine specificity at the female self-incompatibility gene SRK in Brassicaceae? BMC Evolutionary Biology 2007, 7:132-146.
29. Ishimizu T, Shinkawa T, Sakiyama F, Norioka S: Primary structural features of rosaceous S-RNases associated with gametophytic self-incompatibility. Plant Mol Biol 1998, 37:931-941.
30. Matsuura T, Sakai H, Unno M, Ida K, Sato M, Sakiyama F, Norioka S: Crystal structure at 1.5-A resolution of Pyrus pyrifolia pistil ribonuclease responsible for gametophytic self-incompatibility. Journal of Biological Chemistry 2001, 276:45261-45269.
31. Tsukamoto T, Hauck NR, Tao R, Jiang N, Iezzoni AF: Molecular characterization of three non-functional S-haplotypes in sour cherry (Prunus cerasus). Plant Molecular Biology 2006, 62:371-383.
32. Sonneveld T, Tobutt KR, Vaughan SP, Robbins TP: Loss of Pollen-S Function in Two Self-Compatible Selections of Prunus avium Is Associated with Deletion/Mutation of an S Haplotype-Specific F-Box Gene. Plant Cell 2005, 17:37-51.
33. Ushijima K, Yamane H, Watari A, Kakehi E, Ikeda K, Hauck NR, Iezzoni AF, Tao R: The S haplotype-specific F-box protein gene, SFB, is defective in self-compatible haplotypes of Prunus avium and P. mume. The Plant Journal 2004, 39:573-586.
Additional file 1 S-RNase accession numbers. Species name, code, and accession numbers of the sequences used in this study.Additional file 2 Per site synonymous (Ks) and non-synonymous (Ka) rates, total number of amino acid differences and number of differing positively selected amino acid sites for sequence pairs estimated to show less than 5% amino acid divergence (see text for details). for the sequence pairs estimated to show less than 5% amino acid divergence, per site synonymous (Ks) and non-synonymous (Ka) rates, total number of amino acid differences, and number of differing positively selected amino acid are showed. Sequence codes are those used in Figure 1.
Received: 18 November 2009 Accepted: 28 June 2010 Published: 28 June 2010This article is available from: http://www.biomedcentral.com/1471-2148/10/200© 2010 Vieira et al; licensee BioMed Central Ltd. This is an Open Access article distributed under the terms of the Creative Commons Attribution License (http://creativecommons.org/licenses/by/2.0), which permits unrestricted use, distribution, and reproduction in any medium, provided the original work is properly cited.BMC Evolutionary Biology 2010, 10:200

Vieira et al. BMC Evolutionary Biology 2010, 10:200http://www.biomedcentral.com/1471-2148/10/200
Page 15 of 15
34. Hauck NR, Yamane H, Tao R, Iezzoni AF: Accumulation of non-functional S-haplotypes results in the breakdown of gametophytic self-incompatibility in tetraploid Prunus . Genetics 2006, 172:1191-1198.
35. Luu DT, Qin X, Laublin G, Yang Q, Morse D, Cappadocia M: Rejection of S-heteroallelic pollen by a dual-specific S-RNase in Solanum chacoense predicts a multimeric SI pollen component. Genetics 2001, 159:329-335.
36. Kao T-h, McCubbin AG: How flowering plants discriminate between self and non-self pollen to prevent inbreeding. Proceedings of the National Academy of Sciences 1996, 93:12059-12065.
37. Luu D, Qin K, Morse D, Cappadocia M: S-RNase uptake by compatible pollen tubes in gametophytic self-incompatibility. Nature 2000, 407:649-651.
38. Qiao H, Wang F, Zhao L, Zhou J, Lai Z, Zhang Y, Robbins TP, Xue Y: The F-Box Protein AhSLF-S2 Controls the Pollen Function of S-RNase-Based Self-Incompatibility. The Plant Cell 2004, 16:2307-2322.
39. Goldraij A, Kondo K, Lee CB, Hancock CN, Sivaguru M, Vazquez-Santana S, Kim S, Phillips TE, Cruz-Garcia F, McClure B: Compartmentalization of S-RNase and HT-B degradation in self-incompatible Nicotiana. Nature 2006, 439:805-810.
40. Newbigin E, Uyenoyama NK: The evolutionary dynamics of self-incompatibility systems. Trends in Genetics 2005, 21:500-505.
41. Raspé O, Kohn JR: Population structure at the S-locus of Sorbus aucuparia L. (Rosaceae: Maloideae). Molecular Ecology 2007, 16:1315-1325.
42. Wikström N, Savolainen V, Chase MW: Evolution of the angiosperms: Calibrating the family tree. Proceedings of the Royal Society of London 2001, 268:2211-2220.
43. Xia X, Xie Z: DAMBE: Data analysis in molecular biology and evoluiton. Journal of Heredity 2001, 92:371-373.
44. Rozas J, Sanchez-DelBarrio JC, Messeguer X, Rozas R: DnaSP, DNA polymorphism analyses by the coalescent and other methods. Bioinformatics 2003, 19:2496-2497.
45. Kumar S, Tamura K, Nei M: MEGA3: Integrated software for Molecular Evolutionary Genetics Analysis and sequence alignment. Briefings in Bioinformatics 2004, 5:150-163.
46. Huelsenbeck JP, Ronquist F: MRBAYES: Bayesian inference of phylogeny. Bioinformatics 2001, 17:754-755.
47. Zwickl DJ: Genetic algorithm approaches for the phylogenetic analysis of large biological sequence datasets under the maximum likelihood criterion. In Ph.D. dissertation The University of Texas at Austin, Austin.
48. Clement M, Posada D, Crandall KA: TCS: a computer program to estimate gene genealogies. Molecular Ecology 2000, 9:1657-1660.
49. Datamonkey - Rapid detection of positive selection [http://www.datamonkey.org]
50. Martin DP, Williamson C, Posada D: RDP2: recombination detection and analysis rom sequence alignments. Bioinformatics 2005, 21:260-262.
51. Wilson DJ, McVean G: Estimating diversifying selection and functional constraint in the presence of recombination. Genetics 2006, 172:1411-1425.
52. Swofford DL: PAUP*: Phylogenetic Analysis Using Parsimony (and Other Methods), ver. 4.0b10 Sinauer: Sunderland; 2002.
53. Posada D, Crandall KA: MODELTEST: testing the model of DNA substitution. Bioinformatics 1998, 14:817-818.
54. Tsodikov OV, Record MT, Sergeev YV: A novel computer program for fast exact calculation of accessible and molecular surface areas and average surface curvature. Journal of Computational Chemistry 2002, 23:600-609.
55. RCSB - Protein Databank [http://www.rcsb.org]56. Humphrey W, Dalke A, Schulten K: VMD: Visual molecular dynamics.
Journal of Molecular Graphics 1996, 14:33-38.57. Hua Z, Kao TH: Identification of major lysine residues of S(3)-RNase of
Petunia inflata involved in ubiquitin-26S proteasome-mediated degradation in vitro. Plant J 2008, 54:1094-1104.
58. Takahata N: A simple genealogical structure of strongly balanced allelic lines and trans-species evolution of polymorphism. Proceedings of the National Academy of Sciences 1990, 87:2419-2423.
59. Takahata N: Allelic genealogy and human evolution. Molecular Biology and Evolution 1993, 10:2-22.
60. Vekemans X, Slatkin M: Gene and allelic genealogies at a gametophytic self-incompatibility locus. Genetics 1994, 137:1157-1165.
61. Campbell CS, Evans RC, Morgan DR, Dickinson TA, Arsenault MP: Phylogeny of subtribe Pyrinae (formerly the Maloideae, Rosaceae):
limited resolution of a complex evolutionary history. Plant Systematics and Evolution 2007, 226:119-145.
62. Raspé O, Kohn JR: S -allele diversity in Sorbus aucuparia and Crataegus monogyna (Rosaceae: Maloideae). Heredity 2002, 88:458-465.
63. Sanzol J: Dating and functional characterization of duplicated genes in the apple (Malus domestica Borkh.) by analyzing EST data. BMC Plant Biology 2010:10-87.
64. Dobeš C, Paule J: A comprehensive chloroplast DNA-based phylogeny of the genus Potentilla (Rosaceae): implications for its geographic origin, phylogeography and generic circumscription. Mol Phylogenet Evol 2010, 56:156-75.
65. Potter D, Eriksson T, Evans RC, Oh S, Smedmark JEE, Morgan DR, Kerr M, Robertson KR, Arsenault M, Dickinson TA, Campbell CS: Phylogeny and classification of Rosaceae. Plant Systematics and Evolution 2007, 266:5-43.
66. DeVore ML, Pigg KB: A brief review of the fossil history of the family Rosaceae with a focus on the Eocene Okanogan Highlands of eastern Washington State, USA, and British Columbia, Canada. Plant Systematics and Evolution 2007, 266:45-57.
67. Scotese CR: Atlas of Earth History. PALEOMAP Project, Arlington, Texas; 2001:52.
68. Kimura M: The Neutral Theory of Molecular Evolution. Cambridge: Cambridge University Press; 1983.
69. Ohta T: The nearly neutral theory of molecular evolution. Annu Rev Ecol 1992, 23:263-286.
70. Chagné D, Gasic K, Crowhurst RN, Han Y, Bassett HC, Bowatte DR, Lawrence TJ, Rikkerink EH, Gardiner SE, Korban SS: Development of a set of SNP markers present in expressed genes of the apple. Genomics 2008, 92:353-358.
71. Zheng X, Cai D, Yao L, Teng Y: Non-concerted ITS evolution, early origin and phylogenetic utility of ITS pseudogenes in Pyrus. Mol Phylogenet Evol 2008, 48:892-903.
72. Aquadro CF, Begun DJ, Kindahl EC: Selection, recombination and DNA polymorphism in Drosophila. In Non-neutral evolution: theories and molecular data Edited by: Golding B. London: Chapman and Hall; 1994:46-56.
73. Vieira J, Charlesworth B: X chromosome DNA variation in Drosophila virilis. Proc Biol Sci 1999, 266:1905-12.
74. Batonnet S, Leibovitch MP, Tintignac L, Leibovitch SA: Critical role for lysine 133 in the nuclear ubiquitin-mediated degradation of MyoD. J Biol Chem 2004, 279:5413-5420.
75. McClure B: New views of S-RNase -based self-incompatibility. Curr Opin Plant Biol 2006, 9:639-646.
76. Qin X, Soulard J, Laublin G, Morse D, Cappadocia M: Molecular analysis of the conserved C4 region of the S11-RNase of Solanum chacoense. Planta 2005, 22:531-537.
77. Veerasaamy S, Smith A, Tillier ERM: A transition probability model for amino acid substitutions from blocks. Journal of Computational Biology 2003, 10:997-1010.
78. Ma RC, Oliveira MM: Evolutionary analysis of S-RNase genes from Rosaceae species. Mol Genet Genomics 2002, 267:71-78.
79. Takebayashi N, Newbigin E, Uyenoyama MK: Maximum-likelihood estimation of rates of recombination within mating-type regions. Genetics 2003, 167:2097-2109.
80. Uyenoyama MK, Zhang Y, Newbigin E: On the Origin of Self-Incompatibility Haplotypes: Transition Through Self-Compatible Intermediates. Genetics 2001, 157:1805-1817.
81. Lai Z, Ma W, Han B, Liang L, Zhang Y, Hong G, Xue Y: An F-box gene linked to the self-incompatibility (S) locus of Antirrhinum is expressed specifically in pollen and tapetum. Plant Mol Biology 2002, 50:29-42.
82. Kao TH, Tsukamoto T: The molecular and genetic bases of S-RNase -based self-incompatibility. Plant Cell 2004, 6(Suppl S):72-83.
doi: 10.1186/1471-2148-10-200Cite this article as: Vieira et al., Evolutionary patterns at the RNase based gametophytic self - incompatibility system in two divergent Rosaceae groups (Maloideae and Prunus) BMC Evolutionary Biology 2010, 10:200