Embed Size (px)
Citation preview

European International Journal of Science and Technology ISSN: 2304-9693 www.eijst.org.uk
100
Evaluation of Kenyan Bentonite Clay as Geothermal Well Drilling Mud
Peter M. Weramwanja, Jeremiah M. Musuva, John M. Kihiu, Joseph O. Borode, Peter A. Olubambi,
Geoffrey K. Mibei
Abstract The quest for the development of geothermal plants with capacities up to 10,000 MWe in Kenya has recently
placed greater demand on bentonite clay. Bentonite clay is at present largely imported into the country at
the great expense of foreign exchange. There is thus, need to source for bentonite clay locally. In this study,
the suitability of Kenyan bentonite, in its raw form for possible use in well drilling was evaluated. Selected
samples from Isinya, Amboseli and Lewa were characterized by scanning electron microscopy, energy-
dispersive x-ray, x-ray diffraction and x-ray fluorescent to determine the microstructural, elemental,
mineralogical and chemical composition respectively. Moreover, rheological analyses were performed on
raw samples to evaluate the bentonite clay's suitability in geothermal well drilling applications. Results
revealed that chemical, mineralogical and rheological properties of unmodified clays are not adequate for
use in drilling application. However, by modification of Isinya and Amboseli clays, the composition of
calcium may be reduced significantly leading to improved flow properties required in drilling mud.
Keywords—Montmorillonite, Bentonite, Rheological, Drilling mud
Peter M. Weramwanja is with the Mechanical and Manufacturing Eng. Dept. College of Architecture and
Engineering, University of Nairobi, Kenya, (E-mail: [email protected]). Jeremiah M. Musuva, is with the Mechanical and Manufacturing Eng. Dept. College of Architecture and
Engineering, University of Nairobi, Kenya, (e-mail: [email protected]). John M. Kihiu is with the Mechanical Eng. Dept. Jomo Kenyatta University of Agriculture and Technology, Kenya
(e-mail: [email protected]). Joseph O. Borode is with the Metallurgical and Materials Eng. Dept. Federal University of Technology, Akure,
Nigeria. (e-mail: [email protected]) Peter A. Olubambi is with the Chemical, Metallurgical and Materials Eng. Dept. Tshwane University of
Technology, Pretoria, South Africa. ([email protected]). Geoffrey K. Mibei is with the Geothermal Development Corporation, Nakuru, Kenya. ([email protected]).

European International Journal of Science and Technology Vol. 4 No. 3 March, 2015
101
I. INTRODUCTION
HE weathering process of volcanic ash leads to formation of Bentonite clays from the parent rocks that change their occurrence due to climatic change, topography, vegetation and exposure period (Abdou, Al-sabagh, & Dardir, 2013; Falode, Ehinola, & Nebeife, 2008). This clay exists either as sodium or calcium montmorillonite, primarily composed of smectite minerals (Amorima, Gomesa, Liraa, Françab, & Ferreiraa, 2004). Sodium based bentonite swells relatively more than calcium based bentonite since it has a high hydration of its ion as compared to the calcium ion, (Margaret, 1955) and its ions are more dominating than those of calcium (Hassan & Abdel-Khalek, 1998).
Bentonite is widely used in drilling applications because of its high viscosity, swelling capacity and low filtration loss. In most cases, the quality of sodium bentonite may not have the required physical and rheological properties to be used as a drilling mud in its natural occurrence. Therefore, the process of using additives and activating raw bentonite with alkali viscosifies and reduces the fluid loss to the formation leading to an improvement in viscosity. Hence creating the higher chances for the sodium-calcium and calcium bentonites to meet the drilling application (Karagüzel, Çetinel, Boylu, Çinku, & Çelik, 2010). Some of the additives used in the activation process of sodium-calcium and calcium bentonites include soda ash, caustic soda, bicarbonate of soda (calcium reducers, acidity or alkalinity change) sodium carboxymethylcellulose (filtrate reducers) (Baker, 1995), which gives adequate properties of drilling applications.
Kenya has a geothermal installed capacity of 249 MWe (1.92% of the World’s geothermal installed capacity) which is generated from less than 100 drilled wells. This capacity is projected to rise to 5,000 MWe (to be generated from 1,400 wells) by the year 2030 (Mugo, 2013). This will open up investment opportunities in development, supplies and service sectors. Therefore, there is a need to invest in local and relatively low cost drilling material which will lower the cost of geothermal power generation. In this study, Kenyan bentonite sampled from three different regions (Isinya, Amboseli and Lewa) was evaluated for its suitability in the geothermal well drilling application as a drilling mud.
Currently, very little work has been done in exploiting the existing Kenyan bentonite clays for geothermal and oil wells drilling applications (Mibei, 2010; Omenda, 2008; Williams, 1972). Therefore the oil and geothermal exploration in Kenya relies fully on imported bentonite from China and India to support the drilling activities. The success to be realized through this study will enable the country to cut on importation costs, create employment opportunities to the rising educated population, conserve foreign exchange and reduce power cost due to reduced cost of production.
II. MATERIALS AND METHODS
A. Geology
The local bentonite samples (greenish greyish in colour) for this study were collected from three different geological sites in Kenya which included Isinya, Namanga (Amboseli) and Timau (Lewa) as shown in Figure 1. Isinya area lies on Athi plains which are on the southern part of Athi River town. It is located on the latitude 258 379E and longitude 9 822 231N. This is a dry and hot area experiencing occasional heavy rainfall within the year. Bentonite clays in this area mainly occur on the upper Athi Tuff formation that was formed from the volcanic ash, into the paleolake basin and concentrating on the riverine channels (Mibei, 2010).
The geological report of Kajiado area indicates that bentonite deposit beds vary between 1-4 metres in association with gypsum, silicified lithic and limestone. Amboseli area borders the Kajiado County, hence share the climatic conditions with Isinya area. It lies on the latitude 310 537E and longitude 9 706 460N near
T

European International Journal of Science and Technology ISSN: 2304-9693 www.eijst.org.uk
102
the Tanzanian border, below the snow-capped Mt. Kilimanjaro (volcanic). In unpublished report of the Mines and Geological department, Nairobi Kenya, the occurrence of bentonite clay in Amboseli basin was observed citing its origin to volcanic origin. Consequent examination on the clay and surface limestone showed that montmorillonite appeared to be the most significant. Its expansion and contraction was attributed to the wet and dry seasons experienced in the area (Matheson, 1966).
The third and last set of samples was collected from Lewa Wildlife Conservancy in Isiolo which is located on the south of Isiolo town but north of Mount Kenya. It is located on the latitude 310 995 E and longitude 10 015 844 N. The traces of bentonite clay were found to occur as intercalations in the volcanic sequence on the northern side of Mount Kenya. It was identified as Parminter (lying approximately 2.6 km northern side of Matoni Hills) and Krieger (approximately 5 km west-south-west of the Matoni Hills). The physical description of the clay from the two localities was found to be similar (unstratified, homogenous, greenish grey and chocolate coloured clay on oloxine basalt or a brownish grey basaltic soil) (Hackman et al., 1989).
Fig. 1 Geographical representation of the sampled regions
B. Preparation of the clay samples
Nine samples (three samples from each region) of 3 kgs each were randomly collected from three different regions and packed separately in 5 kgs bags. The samples were dried in the hot sun and crushed using a Retsch RS-200 pulveriser at a speed of 150 rpm for 15 minutes and sieved through 90 µm mesh size laboratory sieve mounted on a sieve shaker machine to improve the surface area during analysis. Moisture content was determined to establish the level of samples dryness. Moisture content was determined by heating the samples at 110 0C and determining the mass loss gravimetrically. The samples were repackaged in zipped plastic bags of 1 kg weight that prevented any moisture entry, awaiting for different tests to be carried out. The samples were labelled as IS-1 (location 1), IS-2 (location 2), IS-3 (location 3), AM-1 (location 1), AM-2 (location 2), AM-3 (location 3), LW-1 (location 1), LW-2 (location 2), and LW-3 (location 3).

European International Journal of Science and Technology Vol. 4 No. 3 March, 2015
103
C. Clay Characterization
Microstructure formation and Chemical composition of the raw bentonite specimens were investigated using JOEL JSM 7600F Scanning Electron Microscope (SEM) and Energy Dispersive X-ray Spectroscopy (EDX). These methods were used in phase analysis (SEM) and determining major element composition of Isinya, Amboseli and Lewa samples at different spot spectrums within the structure (EDX). The specimen’s substrates were prepared from carbon rod and mounted onto the sample holder using conductive silver paint. It was allowed to dry for a few minutes, then a solution of the clay sample mixed with ethanol dropped onto the substrate. It was allowed to dry for 10 minutes then coated with 39.5 µm of carbon layer. Microstructural imaging, particle size and elemental composition analysis at different spots (selected grains) were made using SEM and INCO software linked to the SEM machine respectively.
The ground and sieved specimens were dried at 40 0C. Loss on Ignition (LOI) was carried out after 30 minutes by strongly heating the samples at 930 0C in air to determine the mass of volatile substances in the samples. The concentration of major elemental oxides was measured with a Wavelength Dispersive X-ray Fluorescence (WD-XRF) after fusing the specimens with borate. Detection limits were set at about 0.05 mass percent. Traces of the oxides below 0.05 mass percent were ignored (replaced with a dash).
The mineralogical composition was determined through X-ray diffraction (XRD) for most dominant minerals in the Isinya, Amboseli and Lewa bentonite samples. XRD patterns were obtained by Empyrean X-ray diffraction system from PANalytical with a ceramic X-ray tube (CoKα = 1.789) and X’ Celerator detector at 40 kV and 45 mA. The other measurement conditions considered includes: a scan in the 2θ range of 5.000 to 79.990 in steps of 0.0070; continuous scan mode; scan step time of 13.75 s; divergence slit of 10; receiving slit of 1 mm; temperature of 250C. X’ Pert High Score software was used identify the phases present in the samples by comparing the reference patterns in a database with the measured scan.
D. Rheological Properties
The mud samples were prepared by adding varying weights 2g (10%), 3g (15%), 4g (20%), 5g (25%) and 6g (30%) of sieved (90 µm) powders in 20 ml of distilled water in order to prepare different mud weights. Homogenization of the mixture was done using Heindolph MR 3001 K magnetic mixer at 400 rpm for 20 minutes, and allowed to stay for 16 hours before test. Shear stress and viscosity were determined using Rheolab QC equipment and Physical Rheoplus software at ambient temperature (19 0C), varying the rotor speed from 1 – 776 rpm (Mahto & Sharma, 2004).
III. RESULTS AND DISCUSSION
A. Characterization
From the moisture content analysis, it was established that Isinya, Amboseli and Lewa samples contained an average moisture content of 14.3 %, 15.6 % and 19.0 % respectively. Isinya and Amboseli moisture content levels were found to be matching well with the standard level of 15 % (Ahonen, Korkeakoski, Tiljander, Kivikoski, & Laaksonen, 2008). The higher level of moisture content in Lewa samples can cause a decrease in cohesion (Dafalla, 2013) that has an impact on rheological properties.
SEM (Scanning Electron Microscopy) micrographs shown in Figures 2 (a, d and g) and Figures 2 (b, c, e, f, h, and i) describes the microstructure of the analysed samples at the magnifications of x300 and x5000 respectively. The micrographs (Fig. a, d and g) observed at a lower magnification (scale of 200 µm) showed a varying average particle sizes and shapes in all the samples. Isinya sample (Fig. 2a) presented relatively a large number of almost equal size of particles (approximately 10 – 30 µm) than Amboseli (Fig. 2d) and Lewa (Fig. 2g), which may make Isinya sample to be more crystalline and homogeneous than Amboseli and Lewa samples when mixed with water. Amboseli (Fig. 2d) and Lewa (Fig. 2g) samples, large particles of

European International Journal of Science and Technology ISSN: 2304-9693 www.eijst.org.uk
104
more than 50 µm were observed, that could be attributed to presence of sand particles, hence proving the higher levels of Quartz in the XRD analysis of the two samples . It was observed that Isinya microstructure (Figs. 2b and c) formed an ordered structure with relatively light edges and less dark faces as compared to Amboseli (Figs. e and f), which were observed to have different elemental composition from EDX analysis. The Lewa micrographs (Figs. h and i) showed more dark phases than light phases. This is confirmed further by the presence of relatively higher levels of Si in EDX analysis, which may be attributed to high levels of Quartz (Fig. 8).
EDX (Energy-Dispersive X-ray Spectroscopy) graphs shown in Figures 3, 4 and 5 show some of the main elemental composition of Isinya, Amboseli and Lewa samples respectively except Oxygen. The EDX analysis revealed that the major component constituting the analysed samples were Si, Al and Fe. Ca, Na, Mg and K appeared to be in relatively smaller quantities in both block and spot analysis as represented in Figures 3, 4 and 5. The EDX analysis also showed some traces of Ti in all the samples, apart from traces of Cl that was detected in Amboseli and Lewa samples but not included in the graphing. EDX point analysis (Figs. 4 and 5) in Isinya, Amboseli and Lewa samples showed increased intensity levels of Si and Al, than in block analysis (Fig. 3) that associated the elements to Quartz and smectite structures. The level of Na in Isinya sample was found to be relatively higher than Amboseli and Lewa samples in all the spectrums considered (block, dark spot and light spot), giving it a higher affinity to swell more. It was observed that the level of C in EDX block analysis was too high as compared to the EDX spot analyses. This was as a result of the substrate material (graphite) onto which the samples were mounted for examination. It was also observed that the level of C in dark spot spectrum (Fig. 4) was much higher than the level of C in light spot spectrum (Fig. 5). Block (Fig. 3) and spot analysis (Figs. 4 and 5) revealed that the levels of magnesium in Amboseli and Lewa samples were higher than Isiolo sample. The presence of magnesium in relative high quantities would cause alkalinity and pH depletion of the mud due to reaction with hydroxyls (Olufemi, 2013).
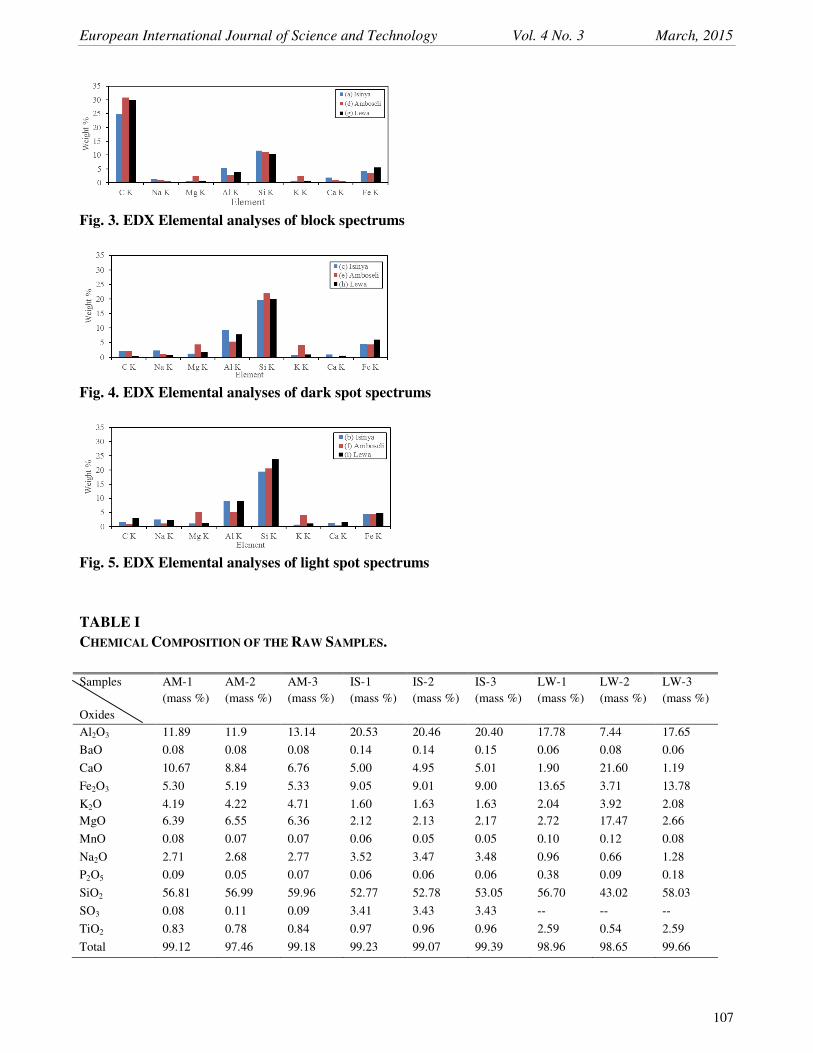
Table 1 shows the chemical composition analysis of all the samples from each region considered in the research. Silica and Alumina are the main components in almost all the samples except the sample from Lewa site 2, which had relatively higher percentage of MgO and CaO. The analysis indicated that, all Isinya and Amboseli samples had higher and slightly varying levels of Na2O than Lewa samples. This indicates that both regions are richer in smectite relative to Lewa samples. Isinya samples were also found to have relatively higher percentage of Na2O content than Amboseli and Lewa samples that is connected to lower percentage of SiO2. From the analyses, it was observed that Isinya and Amboseli samples contained higher levels of SiO2, CaO and K2O, lower levels of Fe2O3 and TiO2, but similar range of Na2O and MnO as Wyoming bentonite (Omenda, 2008). The SiO2/Al2O3 ratio of Isinya samples (2.5 - 2.6) varied slightly from the classical level of 2.7, than Amboseli (4.5 – 4.7) and Lewa (3.1 – 5.7). The observed slight variation among the classical level, Amboseli and Isinya samples can be attributed to the presence of free silica varying quantities (Besq, Malfoy, Pantet, Monnet, & Righi, 2003; Gourouza, Natatou, & Boos, 2011), while the extreme variation in Lewa samples can be linked to the presence of surite mineral. It was observed that LW-2 samples contained higher levels of CaO and MgO and lower levels of Al2O3 as compared to other samples, which can be due to presence of high concentration of dolomite.
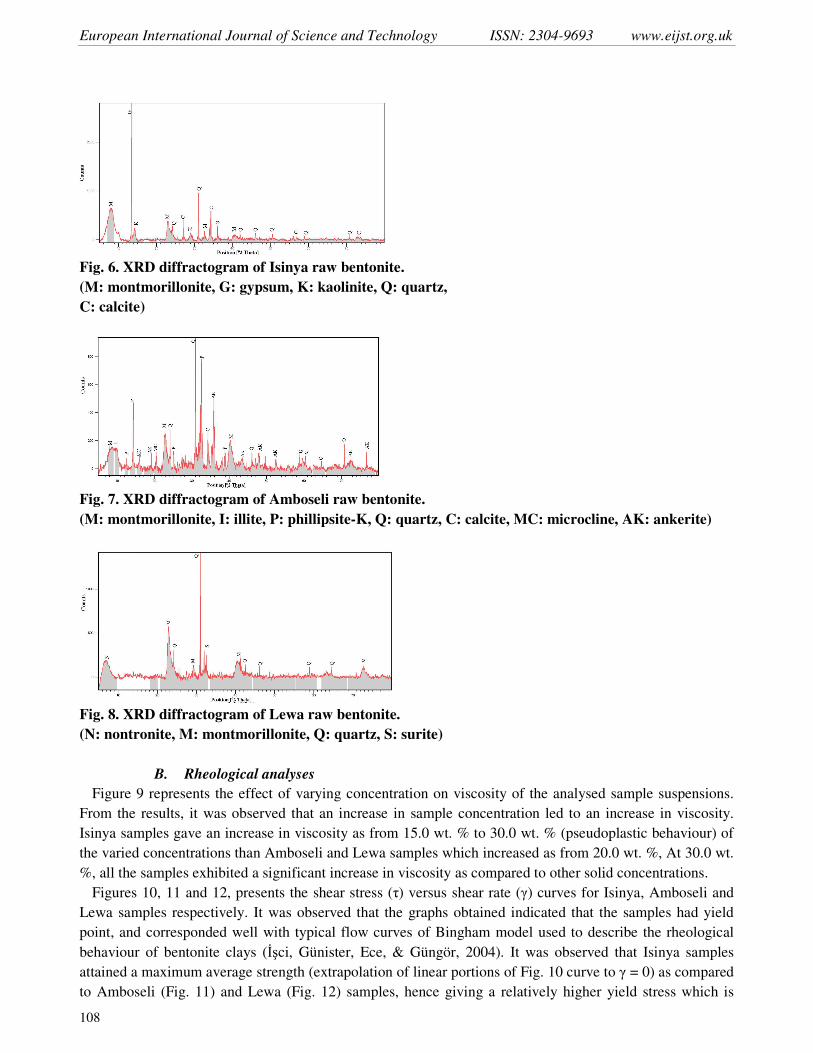
X-ray diffraction patterns of Isinya, Amboseli and Lewa samples shown in Figures 6, 7, and 8 respectively, show diffractograms of Kenyan local bentonite, originating from the smectite group of clay minerals. XRD analysis helped in distinguishing the mineralogical composition between Isinya (Quartz, Calcite, Montmorillonite, Gypsum, Kaolinite and Illite), Amboseli (Quartz, Phillipsite, Ankerite, Montmorillonite, and Microcline) and Lewa (Quartz, Nontronite, Surite and Montmorillonite). The diffraction lines of smectite were identified by clear peaks and intensities occurring in the samples between

European International Journal of Science and Technology Vol. 4 No. 3 March, 2015
105
the d-spacing of 2.5 Å – 13.5 Å, depending on the amount of smectite in the analysed samples. In Isinya samples, high level of gypsum was identified, confirming the high composition of CaO and SO2 as compared to other samples in the XRF analysis. Clear peaks and high diffraction line intensity of Quartz were observed in all the samples analysed, occurring at the d-spacing of 3.34 Å as established in the previous work (Dananaj, Frankovská, & Janotka, 2005; Thuc et al., 2010). This confirmed similar results of chemical analysis that showed all the samples with higher levels of SiO2.
From this, it was deduced that all the analysed samples contained Quartz (SiO2) as the main impurity.
b
c d
a

European International Journal of Science and Technology ISSN: 2304-9693 www.eijst.org.uk
106
Fig. 2 SEM micrographs of analysed bentonites at Magnification of x300 and x5000 (a) x300 Isinya,
(b) and (c) x5000 Isinya, (e) x300 Amboseli, (f) and (g) x5000 Amboseli, (g) x300 Lewa, (h) and (i)
x5000 Lewa.
e f
g
h
i
European International Journal of Science and Technology Vol. 4 No. 3 March, 2015
107
Fig. 3. EDX Elemental analyses of block spectrums
Fig. 4. EDX Elemental analyses of dark spot spectrums
Fig. 5. EDX Elemental analyses of light spot spectrums
TABLE I
CHEMICAL COMPOSITION OF THE RAW SAMPLES.
Samples Oxides
AM-1 (mass %)
AM-2 (mass %)
AM-3 (mass %)
IS-1 (mass %)
IS-2 (mass %)
IS-3 (mass %)
LW-1 (mass %)
LW-2 (mass %)
LW-3 (mass %)
Al2O3 11.89 11.9 13.14 20.53 20.46 20.40 17.78 7.44 17.65
BaO 0.08 0.08 0.08 0.14 0.14 0.15 0.06 0.08 0.06
CaO 10.67 8.84 6.76 5.00 4.95 5.01 1.90 21.60 1.19
Fe2O3 5.30 5.19 5.33 9.05 9.01 9.00 13.65 3.71 13.78
K2O 4.19 4.22 4.71 1.60 1.63 1.63 2.04 3.92 2.08 MgO 6.39 6.55 6.36 2.12 2.13 2.17 2.72 17.47 2.66
MnO 0.08 0.07 0.07 0.06 0.05 0.05 0.10 0.12 0.08
Na2O 2.71 2.68 2.77 3.52 3.47 3.48 0.96 0.66 1.28
P2O5 0.09 0.05 0.07 0.06 0.06 0.06 0.38 0.09 0.18
SiO2 56.81 56.99 59.96 52.77 52.78 53.05 56.70 43.02 58.03
SO3 0.08 0.11 0.09 3.41 3.43 3.43 -- -- --
TiO2 0.83 0.78 0.84 0.97 0.96 0.96 2.59 0.54 2.59
Total 99.12 97.46 99.18 99.23 99.07 99.39 98.96 98.65 99.66
European International Journal of Science and Technology ISSN: 2304-9693 www.eijst.org.uk
108
Fig. 6. XRD diffractogram of Isinya raw bentonite.
(M: montmorillonite, G: gypsum, K: kaolinite, Q: quartz,
C: calcite)
Fig. 7. XRD diffractogram of Amboseli raw bentonite.
(M: montmorillonite, I: illite, P: phillipsite-K, Q: quartz, C: calcite, MC: microcline, AK: ankerite)
Fig. 8. XRD diffractogram of Lewa raw bentonite.
(N: nontronite, M: montmorillonite, Q: quartz, S: surite)
B. Rheological analyses
Figure 9 represents the effect of varying concentration on viscosity of the analysed sample suspensions. From the results, it was observed that an increase in sample concentration led to an increase in viscosity. Isinya samples gave an increase in viscosity as from 15.0 wt. % to 30.0 wt. % (pseudoplastic behaviour) of the varied concentrations than Amboseli and Lewa samples which increased as from 20.0 wt. %, At 30.0 wt. %, all the samples exhibited a significant increase in viscosity as compared to other solid concentrations.
Figures 10, 11 and 12, presents the shear stress (τ) versus shear rate (γ) curves for Isinya, Amboseli and Lewa samples respectively. It was observed that the graphs obtained indicated that the samples had yield point, and corresponded well with typical flow curves of Bingham model used to describe the rheological behaviour of bentonite clays (İşci, Günister, Ece, & Güngör, 2004). It was observed that Isinya samples attained a maximum average strength (extrapolation of linear portions of Fig. 10 curve to γ = 0) as compared to Amboseli (Fig. 11) and Lewa (Fig. 12) samples, hence giving a relatively higher yield stress which is

European International Journal of Science and Technology Vol. 4 No. 3 March, 2015
109
suitable for drilling application. The significant yield stress developed in the high concentration suspensions was associated with the occurrence of the interconnecting three dimensional networks of flocs (Abu-Jdayil, 2011). This was confirmed from the previous work (Chemeda et al., 2014) that the number and the stren `gth of particle-particle linkages determined the yield point of the analysed suspensions. It was observed that the shear stress in Amboseli (Fig. 11) and Lewa (Fig. 12) samples changed at relatively high rate beyond the 710 S-1 shear rate as compared to Isinya samples, which may be attributed to varying homogeneity due to particle segregation in the concentrates. This was confirmed in SEM micrographs analysis (Fig. 2 a, d, and g), where Amboseli and Lewa particle sizes varied so much as compared to Isinya samples.
The change of viscosity of Isinya (Fig. 13), Amboseli (Fig. 14), and Lewa (Fig. 15) samples as a function of shear rate, shows a decrease of viscosity at lower levels of shear rate. All the analysed samples showed pseudoplastic behaviour at high solid concentration as represented in Figures 13, 14 and 15. In this flow curves, there was a progressive decline in viscosity at low shear rate (linked to continual destruction of networking structures), but as the shear rate increases further, there was a constant viscosity. Figure 16 was used to compare the shear stress of 6g of IS-3, AM-3 and LW-3 samples. It was observed that Isinya sample had the highest yield point compared to Amboseli and Lewa samples. This implies that Isinya sample requires relatively more applied stress to deform its resisting solid particles than Amboseli and Lewa samples. Figure 17 shows the comparison in progressive decline, further increase and constant viscosity of 6g of IS-3, AM-3 and LW-3. Isinya sample exhibited a significant increase in viscosity at the same solid concentration as Amboseli and Lewa samples, hence bringing about an increase in almost all the rheological properties (Abu-Jdayil, 2011).
Fig. 9. Viscosity vs. Shear Rate for Isinya 3 samples at varying solid concentrations.
Fig. 10. Shear Stress vs. Shear Rate for Isinya Samples.
Fig. 11. Shear Stress vs. Shear Rate of Amboseli Samples

European International Journal of Science and Technology ISSN: 2304-9693 www.eijst.org.uk
110
Fig. 12. Shear Stress vs. Shear Rate of Lewa Samples
Fig. 13. Viscosity vs. Shear Rate of Isinya Samples.
Fig. 14. Viscosity vs. Shear Rate of Amboseli Samples
Fig. 15. Viscosity vs. Shear Rate of Lewa Samples
Fig. 16. Shear Stress vs. Shear Rate of three Samples from Isinya, Amboseli and Lewa.

European International Journal of Science and Technology Vol. 4 No. 3 March, 2015
111
Fig. 17. Viscosity vs. Shear rate of three Samples from Isinya, Amboseli and Lewa.
IV. CONCLUSIONS
Based on the chemical and mineralogical analysis of Isinya, Amboseli and Lewa samples, it was confirmed that the samples contained montmorillonite. The results show that the analysed samples are bentonite with quartz and other minerals varying from region to region as shown in our discussion. The investigated clays were found to have better characteristic to fulfil the fundamental swelling conditions. Hence could be considered a suitable replacement of imported bentonite in drilling application. The swelling capacity to be achieved from the analysed mud formulation will now depend on the Na+ available, which has the ability to absorb enough water to form viscous suspension (Karakaya, Karakaya, & Bakır, 2011). Thus for excellent use in drilling application, Isinya sample was most preferred, followed by Amboseli.
From the rheological analysis, a pseudoplastic behaviour was experienced from 15.0 wt. % solid concentration of Isinya clay as compared to Amboseli and Lewa samples (as from 20.0 wt. %). It was established that Isinya samples gave the best and consistent rheological properties, since the earliest transition to non-Newtonian behaviour was experienced before Amboseli and Lewa samples.
This research has enabled us to have information on the different types of bentonites and their flow from different regions in Kenya. Hence making it easier to understand the level of modification and application in drilling application. ACKNOWLEDGMENT
This work was financially supported by African Material Science Engineering Network and Department of Mechanical and Manufacturing Engineering, University of Nairobi. We acknowledge the support of Dr. Peter Olubambi (Tshwane University of Technology) for characterization and other relevant tests. REFERENCES
Abdou, M. I., Al-sabagh, A. M., & Dardir, M. M. (2013). Evaluation of Egyptian bentonite and nano-bentonite as drilling mud. Egyptian Journal of Petroleum, 22(1), 53-59. Abu-Jdayil, B. (2011). Rheology of sodium and calcium bentonite–water dispersions: Effect of electrolytes and aging time. International Journal of Mineral Processing, 98(3-4), 208-213. Ahonen, L., Korkeakoski, P., Tiljander, M., Kivikoski, H., & Laaksonen, R. (2008). Quality assurance of the bentonite material (Vol. 33). Finland: Geological Survey of Finland. Amorima, V. L., Gomesa, M. C., Liraa, L. H., Françab, B. K., & Ferreiraa, C. H. (2004). Bentonites from Boa Vista, Brazil_Physical, Mineralogical and Rheological properties. Materials Research,
7(4), 5 8 3-5 9 3.

European International Journal of Science and Technology ISSN: 2304-9693 www.eijst.org.uk
112
Baker, H. (1995). Drilling Engineering Workbook; A distributed learning course: Baker Hughes INTEQ, Training and Development. Besq, A., Malfoy, C., Pantet, A., Monnet, P., & Righi, D. (2003). Physicochemical characterisation and flow properties of some bentonite muds. Applied Clay Science, 23(5-6), 275-286. Chemeda, Y. C., Christidis, G. E., Khan, N. M. T., Koutsopoulou, E., Hatzistamou, V., & Kelessidis, V. C. (2014). Rheological properties of palygorskite–bentonite and sepiolite–bentonite mixed clay suspensions. Applied Clay Science, 90, 165-174. Dafalla, M. A. (2013). Effects of clay and moisture content on direct shear tests for clay-sand mixtures. Advances in Materials Science and Engineering, 2013, 1-8. doi: 10.1155/2013/562726 Dananaj, I., Frankovská, J., & Janotka, I. (2005). The influence of smectite content on microstructure and geotechnical properties of calcium and sodium bentonites. Applied Clay Science, 28(1-4), 223-232. Falode, O. A., Ehinola, O. A., & Nebeife, P. C. (2008). Evaluation of local bentonitic clay as oil well drilling fluids in Nigeria. Applied Clay Science, 39(1-2), 19-27. Gourouza, M., Natatou, I., & Boos, A. (2011). Physico-chemical characterisation of Sabon-Karres clay. Journal of Material and Environmental Science, 2(4), 415-422. Hackman, B. D., Charsley, T. J., Kagasi, J., Key, R. M., Siambi, W. S., & Wilkinson, A. F. (1989). The geology of the Isiolo area. Geological Survey of Kenya. Mines and Geology, Kenya. Hassan, S. M., & Abdel-Khalek, A. N. (1998). Beneficiation and applications of an Egyptian bentonite. Applied Clay Science, 13, 99–115. İşci, S., Günister, E., Ece, Ö. I., & Güngör, N. (2004). The modification of rheologic properties of clays with PVA effect. Materials Letters, 58(12-13), 1975-1978. Karagüzel, C., Çetinel, T., Boylu, F., Çinku, K., & Çelik, M. S. (2010). Activation of (Na, Ca)-bentonites with soda and MgO and their utilization as drilling mud. Applied Clay Science, 48(3), 398-404. Karakaya, M. C., Karakaya, N., & Bakır, S. (2011). Some properties and potential applications of the Na- and Ca-bentonites of ordu (N.E. Turkey). Applied Clay Science, 54(2), 159-165. Mahto, V., & Sharma, V. P. (2004). Rheological study of a water based oil well drilling fluid. Journal of Petroleum Science and Engineering, 45(1-2), 123-128. Margaret, D. F. (1955). The relation between composition and swelling in clays_Comparing Na and
Ca based bentonites. United States of America. (1966). Geology of the Kajiado area. Government of Kenya.

European International Journal of Science and Technology Vol. 4 No. 3 March, 2015
113
Mibei, G. (2010). Bentonite Deposits in Kenya as Drilling mud. Geothermal Resource Conference. Mugo, A. (2013). Geothermal development in Kenya. Geothermal Resources Council.
2013). Experimental analysis of the effect of magnesium saltwater influx on the behaviour of drilling fluids. Journal of Exploration Production and Technology, 3, 61-67. Omenda, P. A. (2008). Assessment of bentonite deposits in Isinya and Amboseli areas of Kajiado
district for their potential use as drilling mud. The Kenya Electric Generating Company. Olkaria geothermal project, Naivasha. Thuc, C. H., Grillet, A., Reinert, L., Ohashi, F., Thuc, H. H., & Duclaux, L. (2010). Separation and purification of montmorillonite and polyethylene oxide modified montmorillonite from Vietnamese bentonites. Applied Clay Science, 49(3), 229-238. Williams, L. A. J. (1972). Geology of the Amboseli Area. Government of Kenya.