Embed Size (px)
Citation preview
Bentonite bonded moulding sands
New insights in the interplay of heat andmass transport and mechanical properties
KORBINIAN LEONHARD THOMAS SCHIEBEL
Dissertation zur Erlangung des Doktorgradesan der Fakultät für Geowissenschaften
der Ludwig-Maximilians-Universität München
München 06.03.2018

Erstgutachter: Prof. Dr. Guntram JordanZweitgutachter: Prof. Wolfgang W. Schmahl
Tag der mündlichen Prüfung: 02.07.2018

Abstract
Sand moulded casting is still one of the most efficient and cheapest methods to producemetal parts of complex shapes. Due to their cyclic reusability and low emission ofparticles and organic compounds during casting, bentonite bonded sands have anexcellent environmental performance. Moreover, sands discarded after a maximum ofcycles can be reused as raw material for in various applications.
Wet tensile strength testing is a common method to assess the quality of bentonitebonded moulding sands. For wet tensile strength testing, a specimen is first heatedfrom above in order to simulate heat-driven moisture transport induced by the castingprocess. Then, stress is applied until the specimen ruptures. In the first part of this study,neutron radiography imaging was applied to moulding sands in-situ during heating andwet tensile strength testing in order to investigate the effects of water kinematics on thetensile strength.
Neutron radiography allowed the localization of the rupture plane and the quantitativedetermination of the local water content with sub-mm resolution. Quantification ofthe temperature of the rupture plane and of the heat kinematics within the specimenwas accomplished by temperature measurements both in-situ and ex-situ. In this way,experimental data correlating the wet tensile strength with the specific conditions ofmoulding sands at the rupture plane were obtained for the first time.
Series of experiments with different initial sand moisture contents were conducted.The results show that the weakest location within a sand profile can be pinpointed atthe interface between evaporation and condensation zone (i.e., at the 100◦C isotherm),where water vaporisation starts and the water bridges connecting the sand grains col-lapse.
During casting, however, the moulding sand undergoes irreversible alterations, whichdeteriorate its properties. Aim of this work, therefore, was to gain accurate insightsinto the relation between sand alteration and property change. To this end, the wettensile strengths of heat pre-treated and cyclically reused sands were related to thekinematics of water within the sand as measured by in-situ neutron radiography andneutron diffraction.
Sands subjected to 22 cycles of drying (T = 120◦C) and remoistening (3 wt.%)revealed modifications in smectite lattice spacings and in water release behaviourfrom smectite interlayers. No significant change of tensile strength, however, wasassociated with these modifications. Contrarily, sands pre-treated with temperaturesas low as 225◦C revealed a reduction of tensile strength which was correlated withirreversible modifications of the structural and compositional integrity of the smectitesas manifested by substantially altered water kinematics. The results show that cyclic

use of moulding sand has little impact on the sand quality as long as the temperatureof the sand remains low. For the practice in foundry, the results imply that a rigorousseparation of heat-exposed sand is advantageous.
Sands bonded with sodium- and calcium-bentonite were studies in order to unravelthe influence of the exchangeable cation on the binding properties. Changes in tensilestrength as well as in heat and mass transport within the sand were investigated. Heatpre-treated Ca- and Na-bentonite bonded sand revealed differences in tensile strength.Although no major differences in the swelling behaviour could be detected, Na-bentonitebonded sands have a better mechanical performance than Ca-bentonite bonded sandsboth before and after the pre-treatment. The measured changes in tensile strength ofboth Ca- and Na-bentonite bonded sand correspond well with the irreversible alterationsof the smectites.

Contents
1 Introduction 11.1 Bentonite as binding agent in foundry industries . . . . . . . . . . . . 11.2 Crystal structure of smectites . . . . . . . . . . . . . . . . . . . . . . 21.3 Current state of research . . . . . . . . . . . . . . . . . . . . . . . . 3
1.3.1 Capillary force and tensile strength . . . . . . . . . . . . . . 31.3.2 Temperature and moisture kinematics during casting . . . . . 61.3.3 Smectite alteration and the influence on the properties of ben-
tonite bonded sands . . . . . . . . . . . . . . . . . . . . . . . 71.4 Aim of this thesis . . . . . . . . . . . . . . . . . . . . . . . . . . . . 81.5 Author contributions . . . . . . . . . . . . . . . . . . . . . . . . . . 9
2 Methods 112.1 Wet tensile testing . . . . . . . . . . . . . . . . . . . . . . . . . . . . 112.2 Neutron radiography . . . . . . . . . . . . . . . . . . . . . . . . . . 12
2.2.1 Basics and experimental set up . . . . . . . . . . . . . . . . . 122.2.2 Image analysis . . . . . . . . . . . . . . . . . . . . . . . . . 13
2.3 Neutron diffraction . . . . . . . . . . . . . . . . . . . . . . . . . . . 162.4 SEM . . . . . . . . . . . . . . . . . . . . . . . . . . . . . . . . . . . 182.5 TG & DSC . . . . . . . . . . . . . . . . . . . . . . . . . . . . . . . 18
3 Effect of water transport on tensile strength 193.1 Open questions . . . . . . . . . . . . . . . . . . . . . . . . . . . . . 193.2 Materials and methods . . . . . . . . . . . . . . . . . . . . . . . . . 193.3 Results . . . . . . . . . . . . . . . . . . . . . . . . . . . . . . . . . . 233.4 Discussion . . . . . . . . . . . . . . . . . . . . . . . . . . . . . . . . 27
3.4.1 Transport dependence on initial moisture . . . . . . . . . . . 273.4.2 Differences in tensile strength with changes in initial moisture 30
4 Effects of heat and cyclic reuse on the properties of bentonite-bonded sand 334.1 Introduction . . . . . . . . . . . . . . . . . . . . . . . . . . . . . . . 334.2 Materials and method . . . . . . . . . . . . . . . . . . . . . . . . . . 33
4.2.1 Materials . . . . . . . . . . . . . . . . . . . . . . . . . . . . 334.2.2 DSC and TG . . . . . . . . . . . . . . . . . . . . . . . . . . 344.2.3 Neutron radiography time series of heated tensile testing . . . 344.2.4 Neutron diffraction . . . . . . . . . . . . . . . . . . . . . . . 364.2.5 SEM . . . . . . . . . . . . . . . . . . . . . . . . . . . . . . 37
i

Contents
4.3 Results . . . . . . . . . . . . . . . . . . . . . . . . . . . . . . . . . . 374.3.1 Thermal analyses . . . . . . . . . . . . . . . . . . . . . . . . 374.3.2 Wet tensile strength of heat pre-treated and cyclically reused
sands . . . . . . . . . . . . . . . . . . . . . . . . . . . . . . 384.3.3 Dehydration behavior of the sand with different pre-treatments 394.3.4 Water kinematics in the sand column . . . . . . . . . . . . . 404.3.5 Water in smectite interlayers at temperatures up to 130◦C . . . 414.3.6 Sand structure . . . . . . . . . . . . . . . . . . . . . . . . . . 45
4.4 Discussion . . . . . . . . . . . . . . . . . . . . . . . . . . . . . . . . 45
5 Comparison of moulding sands bonded with sodium and calciumbentonites 515.1 Introduction . . . . . . . . . . . . . . . . . . . . . . . . . . . . . . . 515.2 Specific experimental details . . . . . . . . . . . . . . . . . . . . . . 52
5.2.1 Materials . . . . . . . . . . . . . . . . . . . . . . . . . . . . 525.2.2 Methods . . . . . . . . . . . . . . . . . . . . . . . . . . . . 525.2.3 Tensile testing . . . . . . . . . . . . . . . . . . . . . . . . . 545.2.4 Neutron radiography . . . . . . . . . . . . . . . . . . . . . . 54
5.3 Results and comparison to Na-bonded sands . . . . . . . . . . . . . . 555.3.1 Sands with different initial water contents . . . . . . . . . . . 555.3.2 Cyclically reused sands . . . . . . . . . . . . . . . . . . . . . 565.3.3 Heat pre-treated sands . . . . . . . . . . . . . . . . . . . . . 59
5.4 Discussion . . . . . . . . . . . . . . . . . . . . . . . . . . . . . . . . 655.4.1 Sands with different initial water contents . . . . . . . . . . . 655.4.2 Cyclically reused sands . . . . . . . . . . . . . . . . . . . . . 655.4.3 Heat pre-treated sands . . . . . . . . . . . . . . . . . . . . . 655.4.4 Higher tensile strength of Na-bentonite bonded sands . . . . . 67
6 Conclusions 696.1 Effect of moisture on the sand properties . . . . . . . . . . . . . . . . 696.2 Effect of heat pre-treatment and cyclic reuse on the properties of Na-
bentonite bonded sand . . . . . . . . . . . . . . . . . . . . . . . . . 696.3 Ca-bentonite bonded sands . . . . . . . . . . . . . . . . . . . . . . . 70
Appendix 73
ii
List of Figures
1.1 Scab development . . . . . . . . . . . . . . . . . . . . . . . . . . . . 21.2 Crystal structure of smectites . . . . . . . . . . . . . . . . . . . . . . 31.3 Moisture distribution versus distance to the heating plate . . . . . . . 41.4 Schematic distributions of temperature and moisture content in a sand
mold containing water . . . . . . . . . . . . . . . . . . . . . . . . . 61.5 Distribution of Al3+-ions in octahedral sheets with cis- or trans-vacant
sites. . . . . . . . . . . . . . . . . . . . . . . . . . . . . . . . . . . . 7
2.1 Wet tensile testing . . . . . . . . . . . . . . . . . . . . . . . . . . . . 112.2 Macroscopic cross section . . . . . . . . . . . . . . . . . . . . . . . 132.3 Calibration of correlation between neutron transmission and water
thickness . . . . . . . . . . . . . . . . . . . . . . . . . . . . . . . . 142.4 Two-part specimen tube . . . . . . . . . . . . . . . . . . . . . . . . . 152.5 Neutron diffraction pattern of the reference sand at room temperature.
The background-corrected fit according to Eqn. 2.15 is included. . . . 17
3.1 Tensile strength testing signal . . . . . . . . . . . . . . . . . . . . . . 203.2 Moisture distribution in different radiographs . . . . . . . . . . . . . 213.3 Temperature evolution with time . . . . . . . . . . . . . . . . . . . . 223.4 Evolution of the moisture and temperature during heating . . . . . . . 223.5 Moisture distribution versus distance to the heating plate . . . . . . . 233.6 Evolution of the water content at a thermo couple . . . . . . . . . . . 243.7 Negative natural logarithm of the horizontal transmission profiles of
moulding sands . . . . . . . . . . . . . . . . . . . . . . . . . . . . . 253.8 Green and wet tensile strength versus moisture . . . . . . . . . . . . 263.9 Saturation plotted versus initial moisture . . . . . . . . . . . . . . . . 263.10 Maximum water contents versus initial moisture . . . . . . . . . . . . 273.11 Evolution of the zone boundaries with the square root of time . . . . . 283.12 Propagation constants of zone boundaries with different initial moistures 293.13 Porosity versus initial moisture . . . . . . . . . . . . . . . . . . . . . 30
4.1 Neutron radiographs of wet tensile strength testing . . . . . . . . . . 364.2 DSC and TG curves . . . . . . . . . . . . . . . . . . . . . . . . . . . 384.3 Wet tensile strengths of moulding sands subjected to various numbers
of drying-remoistening cycles . . . . . . . . . . . . . . . . . . . . . 384.4 Wet tensile strengths of moulding sands pre-treated at different temper-
atures. . . . . . . . . . . . . . . . . . . . . . . . . . . . . . . . . . . 39
iii

List of Figures
4.6 Heat-driven movement of the water within the centre of the sample tube 414.7 Propagation constants of cyclically reused sands . . . . . . . . . . . 424.8 Propagation constants of the zone boundaries of heat pre-treated mould-
ing sands . . . . . . . . . . . . . . . . . . . . . . . . . . . . . . . . 424.9 Maximum water content at the boundary between evaporation zone and
condensation zone for heat pre-treated sands during wet tensile strengthtesting. Different degrees of weight loss during heat pre-treatment asdetected by thermal analyses (Fig. 4.3) were indicated by differentgreyscales. . . . . . . . . . . . . . . . . . . . . . . . . . . . . . . . . 43
4.10 Neutron diffractometer analyses conducted during thermal dehydration 444.11 SEM images of air-dried sand . . . . . . . . . . . . . . . . . . . . . 454.12 Median d001 value . . . . . . . . . . . . . . . . . . . . . . . . . . . . 48
5.1 Diffraction patterns of Ca-bentonite bonded moulding sand . . . . . . 535.2 Propagation constants of zone boundaries in Ca-bentonite bonded
moulding sands with different initial moisture contents . . . . . . . . 565.3 Measured maximum water contents of Na- and Ca-bentonite bonded sand 575.4 Wet tensile strengths of Ca-bentonite bonded sands subjected to various
numbers of drying-remoistening cycles . . . . . . . . . . . . . . . . . 575.5 Propagation constants of cyclically reused sands Ca-bentonite bonded
sand . . . . . . . . . . . . . . . . . . . . . . . . . . . . . . . . . . . 585.7 Initial and maximum transmission in neutron radiography of Ca-bentonite
bonded sand . . . . . . . . . . . . . . . . . . . . . . . . . . . . . . . 595.8 SEM images of air-dried Ca-sand . . . . . . . . . . . . . . . . . . . . 605.9 Neutron diffractometer analyses of Ca-bentonite bonded sand treated
with different temperatures . . . . . . . . . . . . . . . . . . . . . . . 615.10 Neutron diffractometer analyses conducted during thermal dehydration
of Ca-bentonite bondede sands . . . . . . . . . . . . . . . . . . . . . 625.11 Wet tensile strengths of Ca-bentonit bonded sands pre-treated at differ-
ent temperatures . . . . . . . . . . . . . . . . . . . . . . . . . . . . . 635.12 Propagation constants of the zone boundaries of heat pre-treated mould-
ing sands . . . . . . . . . . . . . . . . . . . . . . . . . . . . . . . . 64
6.1 Illustration of the different transport zones . . . . . . . . . . . . . . . 70
iv

Nomenclature
A Sectional area of the specimen (m2)
b(t) Correction factor for beam fluctua-tion
B1, B2 Background parameters
c Full half maximum of the d001 re-flection (◦)
Cs Specific heat of the moulding sand(kJ/(kgK))
Cw Specific heat of water (kJ/(kgK))
d001 d-spacing of the 100 lattice planes(Å)
Fg Weight of the upper sample part(kN/m2)
Fr Maximum measured tensile force(kg/m2)
Ft Tearing tension (kN)
g(y) Geometry normalization factor
I Transmitted intensity
I0 Initial intensity
Id Intensity of dark images
I001 Calculated amplitude of the d001-peak
Icalc Calculated intensity
Lw Latent heat of evaporation (kJ/(kg))
m Mass (kg)
q Propagation constant (mm/(√s))
S Saturation (vol.%)
V Volume (mm3)
w Water content
w0 Initial water content (wt.%)
wmax Maximal water content (wt.%)
Greek symbols:
∆zW Water thickness in beam direction(m)
∆zS Sand thickness in beam direction(m)
λ Wave length of the neutron beam(µm)
Φ Porosity (vol.%)
ρ Density (kg/m3)
Σ Macroscopic cross section (b)
σt Wet tensile strength (kN/m2)
τ Transmission
Θ Diffraction angle (◦)
ΘW Correlation factor between watercontent and transmission
Subscripts:
0 Time zero
Cor Corrected
i Phase
max Maximum
Nor Normalized
S Sand
t Time (s)
x, y, z Coordinates
v


1 Introduction
1.1 Bentonite as binding agent in foundryindustries
Clays, which consist of more than 50% smectite, are called bentonite (Odom 1984).Sodium-bentonites with a smectite composition of more than 70% montmorilloniteare the most commonly used binder for quartz sand utilised as mould material infoundry industries (Campbell 2011). Compared to other clay minerals, the plate-shapedmontmorillonite particles with an average diameter of 1 µm show a better bindingcapacity than larger clays, like illite or kaolinite (Patterson & Boenisch 1961a).
Typically, the bentonite content in so called "green moulding sands" varies between5 to 10 wt.% (Fiore & Zanetti 2007). Depending on the bentonite content and quality,bentonite bonded moulding sands contain 2-5 wt.% water (Paluszkiewicz et al. 2008).Sometimes optional additives such as carbon are added to improve the surface of thecasting product. Carbon forms a reducing atmosphere during casting at the mould-metalinterface (Melcher & Schaefer 1978, Loto & Adebayo 1990, Parappagoudar et al. 2008).
Sand moulded casting is still one of the most efficient and cheapest methods toproduce metal parts even of complex shapes. Besides simplicity and cost efficiency,bentonite bonded sands have an excellent environmental performance (Wang et al. 2007)compared to oil or resin bonded sands. Bentonite bonded sands have lower particulateand organic emission during casting and, moreover, they can be reused for mouldproduction many times (Zabat & Van Damme 2000). Sands discarded after a maximumof cycles can be reused as raw material for concrete (Siddique et al. 2009, Guney et al.2010) and ceramics production (Raupp-Pereira et al. 2006, Alonso-Santurde et al. 2012),or as hydraulic barrier for landfills (Zanetti & Godio 2006).
The mechanical properties of bentonite bonded sand moulds strongly depend ontemperature, the amount of water, and the mineralogical composition of the bentonite(Grim & Guven 1978). During casting, a temperature gradient is induced within thesand mould. Water near the mould cavity evaporates and migrates into the colder mouldinterior where it condenses. As the heat advances further into the mould, evaporationcontinuous and the steam migrates further into the mould interior. The resulting totalheat and moisture transport is composed of a number of different individual processeslike heat conduction and convection, water vaporisation and condensation (Kubo &Pehlke 1986) as well as water uptake and release within the interlayer space of thesmectites composing the bentonite.
1

1 Introduction
a)
condensation zone moulding sand melt
scab
scab
b)
Fig. 1.1: Scrap development at the top (a) and bottom (b). After the metal melt enters themould, sand layers next to the mould cavity flake off, causing casting defects like srabs or rattails. (Modified after Hasse (2007))
The spatial and temporal gradients of heat and water concentration within the mouldresult in mobile zones of different mechanical properties of the moulding sand, notablyof different tensile strength (Patterson & Boenisch 1964). In the condensation zonefacing away from the melt, increasing moisture causes a significant decrease of tensilestrength. In the hot sand layers facing towards the melt, i.e. the dry zone, quartz crystalsexpand and compressive stress arises. Together, the decrease of tensile strength and theincrease of compressive stress cause spalling of sand layers - especially at the top ofthe mould cavity (Patterson & Boenisch 1964). The casting flaws of metal parts castedin a defective mould are called scabs (Fig. 1.1). Scabs are among the most frequentlyoccurring casting defects associated with bentonite bonded sands (Campbell 2011).The quality of bentonite bonded sand in general and the tendency towards scabbingin particular can be determined by the ratio of compressive strength and wet tensilestrength (Patterson & Boenisch 1964). Therefore, wet tensile strength is one of the keyparameters to define the mechanical properties of bentonite bonded moulding sands.
1.2 Crystal structure of smectitesMontmorillonite, like all smectites, is a 2:1 phyllosilicate. Chemically, montmorilloniteis a hydrous sodium calcium aluminium magnesium silicate hydroxide (Anthony et al.2000) with a general formula of (Na,Ca)0.33(Al,Mg)2(Si4O10)(OH)2·nH2O. Potassium,iron, and other cations are common substitutes. The exact cation ratio varies with thesource. The crystal structure can be described by two tetrahedral sheets (T-sheets) ofsilica enclosing a central octahedral sheet (O-sheet) of aluminium oxy-hydroxide (Fig.1.2). Each SiO4−
4 tetrahedron is connected to three other SiO4−4 tetrahedrons by shared
oxygen atoms. Consequently, each tetrahedron has three binding oxygen atoms andone non-binding oxygen. In an individual T-sheet, all non-binding oxygen atoms arepointing towards the same direction. Substitution of ions in the TOT-layer (mainly in
2

Fig. 1.2: Crystal structure of a dehydrated smectite. In the interlayer space, i.e. between twoneighbouring TOT layers, exchangeable cations are positioned. In montmorillonite, the centreatoms of the octahedral sheets are typically Al3+ and Mg2+, the exchangeable cation mostly isCa2+ or Na+. Created with VESTA (Momma & Izumi 2008, 2011) after entry 1100106 of theCrystallography Open Database (Gražulis et al. 2009, 2012)
the octahedral sheet) results in a charge of up to -0.6 per formula unit. This chargeis balanced by monovalent cations such as K+ or Na+ or bivalent cations such asCa2+. These cations are located within the interlayer space and can be surrounded bywater molecules. Hydration causes an expansion of the smectite structure in c-direction.Therefore, the smectite volume can swell. The water molecules taken up by the cationsform layers (Hendricks & Jefferson 1938, Mering 1946). The number of water layersdepends on the stage of hydration. However, the exact value of d001 lattice spacingalso depends to the packing manner of the water molecules within the interlayer space(Barshad 1949). The arrangement and the swelling capacity and related properties of allsmectites, therefore, strongly depend on the type of the exchangeable cation (Bergaya& Lagaly 2006).
1.3 Current state of research
1.3.1 Capillary force and tensile strength
Tensile strength bears an important role in stress and strain behaviour of unsaturatedgranular materials, being important for many fields from ceramic production (e.g.Israelachvili 2011) to oil and gas exploration (e.g. Falode et al. 2008, Barry et al.
3
1 Introduction
2015). The basic physics behind wet granular materials such as moist quartz sandis qualitatively well understood (e.g. Haines 1925, Kohonen et al. 2004, Rabinovichet al. 2005, Zheng et al. 2010). In the past several decades, considerable advanceshave been made understanding the capillary attraction in unsaturated granular materialsquantitatively.
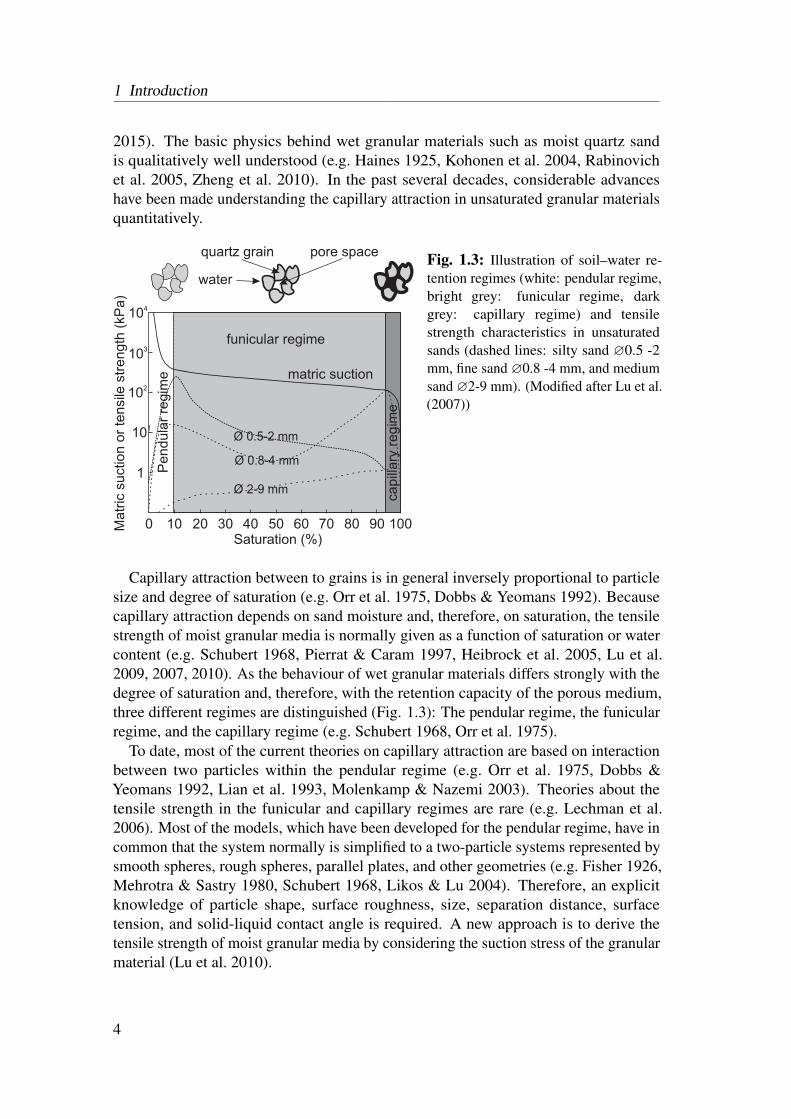
Fig. 1.3: Illustration of soil–water re-tention regimes (white: pendular regime,bright grey: funicular regime, darkgrey: capillary regime) and tensilestrength characteristics in unsaturatedsands (dashed lines: silty sand ∅0.5 -2mm, fine sand ∅0.8 -4 mm, and mediumsand ∅2-9 mm). (Modified after Lu et al.(2007))
Capillary attraction between to grains is in general inversely proportional to particlesize and degree of saturation (e.g. Orr et al. 1975, Dobbs & Yeomans 1992). Becausecapillary attraction depends on sand moisture and, therefore, on saturation, the tensilestrength of moist granular media is normally given as a function of saturation or watercontent (e.g. Schubert 1968, Pierrat & Caram 1997, Heibrock et al. 2005, Lu et al.2009, 2007, 2010). As the behaviour of wet granular materials differs strongly with thedegree of saturation and, therefore, with the retention capacity of the porous medium,three different regimes are distinguished (Fig. 1.3): The pendular regime, the funicularregime, and the capillary regime (e.g. Schubert 1968, Orr et al. 1975).
To date, most of the current theories on capillary attraction are based on interactionbetween two particles within the pendular regime (e.g. Orr et al. 1975, Dobbs &Yeomans 1992, Lian et al. 1993, Molenkamp & Nazemi 2003). Theories about thetensile strength in the funicular and capillary regimes are rare (e.g. Lechman et al.2006). Most of the models, which have been developed for the pendular regime, have incommon that the system normally is simplified to a two-particle systems represented bysmooth spheres, rough spheres, parallel plates, and other geometries (e.g. Fisher 1926,Mehrotra & Sastry 1980, Schubert 1968, Likos & Lu 2004). Therefore, an explicitknowledge of particle shape, surface roughness, size, separation distance, surfacetension, and solid-liquid contact angle is required. A new approach is to derive thetensile strength of moist granular media by considering the suction stress of the granularmaterial (Lu et al. 2010).
4

Despite these advances made so far, the relationship between the mechanical proper-ties and sand moisture is still insufficiently understood and predictions of the tensilestrength are imprecise. In general, however, it can be noted when the amount of waterexceeds the pendular regime, capillary bridges merge and tensile strength decreases.
For clayey sands like moulding sands, the exact prediction of the tensile strengthis even more challenging because the tensile strength in clayey sands is related todifferent forces and bonds (e.g. Wiebe et al. 1998, Lu et al. 2007, Tang et al. 2015). Ingeneral, four different forces and bonds can be distinguished: (1) van der Waals forces,(2) electrical double layer forces between clay mineral surfaces, (3) capillary forcesat water bridges, and (4) bonds between grains caused by mineral precipitates fromevaporating water.
The presence of clays makes precise predictions of the tensile strength very demand-ing. Due to the swelling behaviour of smectites, precise predictions of the amountof water within the pore space is difficult and no models exist to calculate the tensilestrength in smectite rich sands or soils. Furthermore, the changes in temperature causechanges of the tensile strength during casting. Bentonite bonded moulding sands duringcasting, therefore, are among the most challenging wet granular media for the predictionof tensile strength. This is the reason why up to date only experimental work on the ten-sile strength of bentonite bonded moulding exists Patterson & Boenisch (e.g. 1961a,b,1964, 1966). To obtain experimental access to the lowest tensile strength during casting,Wilhelm & Dietmar (1964) invented a new tensile testing method, in which the sampleis heated from above before testing the tensile strength (i.e., wet tensile testing).
From such experiments (Patterson & Boenisch 1961a), it is well known that thestrength of the moulding sand containing the same amount of water is considerablyreduced with increasing temperature from room temperature up to the boiling point ofwater. Reaching temperatures above 90◦C, capillary forces are considered to be of noeffect on the strength of the moulding sand any longer Khanna & Swarup (1961) andthe residual tensile strength is only related to the hydration state of the adsorbed cations.Therefore, the exact behaviour of a capillary bridges during evaporation is still vague(Maeda et al. 2003). With an increasing hydration of the cations, the tensile strengthfurther decreases Khanna & Swarup (1961).
Due to condensation of water that evaporates in the mould region next to the metalmelt, sand moisture exceeds the ideal amount and the tensile strength decreases. There-fore, the preferred location of rupture is somewhere in the condensation zone where thewater amount is high and the temperature is near to the boiling point of water Patterson& Boenisch (1961a). If the moulding sand contains a large amount of Na-smectite, theexcess water is absorbed on the clay surface in an organised structure. If Ca-smectite isthe predominant clay, the water remains in liquid form (Odom 1984). Consequently,Na-bentonite bonded sands have a much higher wet tensile strength than Ca-bentonitebonded sands Patterson & Boenisch (1961a).
5

1 Introduction
Fig. 1.4: Schematic distributions of tem-perature (dashed line) and moisture con-tent (straight line) in a sand mould con-taining water (modified after Kubo &Pehlke (1986)). The different zones areillustrated by different grey scales.
1.3.2 Temperature and moisture kinematics during casting
Because tensile strength is strongly related to the sand moisture and temperature, themoisture and temperature profile within the sand during casting is of major importance.A model for the heat-driven mass transport in bentonite bonded moulding sands wasstated by Patterson & Boenisch (1964) and improved by Kubo & Pehlke (1986). Furthergeneral models for heat-driven mass transport in porous media comparable to bentonitebonded moulding sand were described e.g. by Schröder & Macherauch (1977), Udell(1983), Starobin et al. (2011). Among these models, the model of Kubo & Pehlke(1986) is the most detailed one for coupled heat and mass transfer occurring duringcasting. Heat conduction, heat convection, condensation and evaporation were takeninto account. At a given distance from the melt, equality of temperatures of water,quartz, and bentonite was assumed. Furthermore, heat transport by vapour transferand by heat conduction between sand particles and vapour were taken into account.With respect to temperature, Kubo & Pehlke (1986) and Udell (1983) distinguishedfour zones with different transport characteristics (Fig. 1.4). These four zones can bedescribed in the non-steady state system of this work in the following way:
1. The dry zone where the water has been vaporized completely. Here, the moisturecontent is zero and the temperature is above 100◦C.
2. The evaporation zone where the temperature is 100◦C and moisture is decreasingat a certain position over time.
3. The condensation zone where the temperatures are between 100◦C and roomtemperature and the moisture content is increasing at a certain position over time.
4. The external zone where temperature and moisture are unaffected by the castingprocess.
6
In the dry zone, heat is mainly transported by conduction in the solid phases. In theevaporation and condensation zone, heat transport additionally takes place by watervapour flow within the open pore space. This moisture transport is driven by pressuredifference, diffusion, vaporisation, and condensation.
1.3.3 Smectite alteration and the influence on the propertiesof bentonite bonded sands
Caused by the high temperatures during casting and the generated steam, the smectiteswithin the moulding sand alter. These structural alterations, which are partly reversibleand partly irreversible, lead to changes of the properties of the smectites.
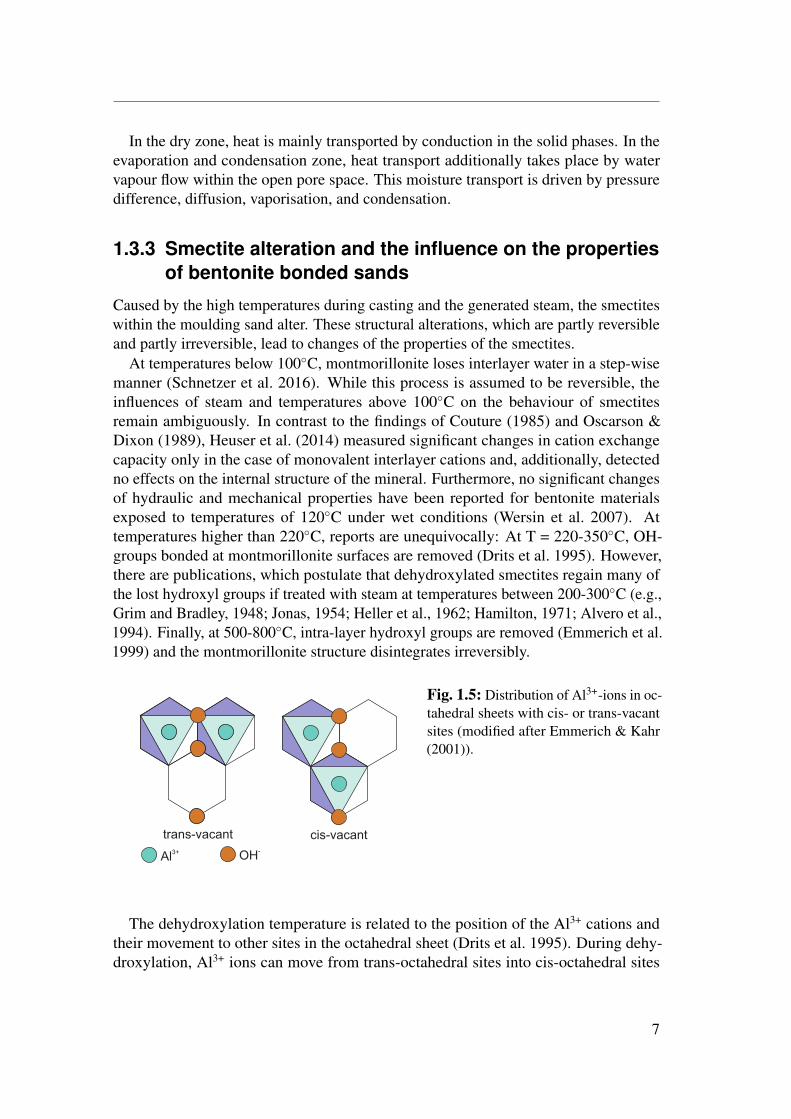
At temperatures below 100◦C, montmorillonite loses interlayer water in a step-wisemanner (Schnetzer et al. 2016). While this process is assumed to be reversible, theinfluences of steam and temperatures above 100◦C on the behaviour of smectitesremain ambiguously. In contrast to the findings of Couture (1985) and Oscarson &Dixon (1989), Heuser et al. (2014) measured significant changes in cation exchangecapacity only in the case of monovalent interlayer cations and, additionally, detectedno effects on the internal structure of the mineral. Furthermore, no significant changesof hydraulic and mechanical properties have been reported for bentonite materialsexposed to temperatures of 120◦C under wet conditions (Wersin et al. 2007). Attemperatures higher than 220◦C, reports are unequivocally: At T = 220-350◦C, OH-groups bonded at montmorillonite surfaces are removed (Drits et al. 1995). However,there are publications, which postulate that dehydroxylated smectites regain many ofthe lost hydroxyl groups if treated with steam at temperatures between 200-300◦C (e.g.,Grim and Bradley, 1948; Jonas, 1954; Heller et al., 1962; Hamilton, 1971; Alvero et al.,1994). Finally, at 500-800◦C, intra-layer hydroxyl groups are removed (Emmerich et al.1999) and the montmorillonite structure disintegrates irreversibly.
Fig. 1.5: Distribution of Al3+-ions in oc-tahedral sheets with cis- or trans-vacantsites (modified after Emmerich & Kahr(2001)).
The dehydroxylation temperature is related to the position of the Al3+ cations andtheir movement to other sites in the octahedral sheet (Drits et al. 1995). During dehy-droxylation, Al3+ ions can move from trans-octahedral sites into cis-octahedral sites
7

1 Introduction
(Fig. 1.5). For the movement additional thermal energy is required, being the reason forhigher dehydroxylation temperature of smectites with Al3+ in trans-octahedral sites. Byobserving two dehydroxylation peaks after rehydroxylation of preheated montmoril-lonites, Drits et al. (1995) assumed that the transformation from trans-octahedral sitesinto cis-octahedral sites occurs partially. Furthermore, Drits et al. (1995) noted thatstructural changes and Al3+ movement during dehydroxylation are not restricted by theinterlayer cations.
While Al3+ can move between different sites, Fe3+ does not migrate (Heller-Kallai& Rozenson 1980). The movement of small Li+, Cu2+, or Zn2+ cations from theinterlayer to the hexagonal cavities of the tetrahedral sheet and then to the vacantoctahedral positions of dioctahedral clays upon heating is a well-known phenomenon(e.g. Hofmann & Klemen 1950, Greene-Kelly 1955, Calvet & Prost 1971, Emmerichet al. 1999).
1.4 Aim of this thesisAlthough, bentonite is widely used as binder for quartz sand in foundry industries,its binding mechanisms are poorly understood. The motivation of the present study,therefore, was not only to contribute to the improvement of the most sustainable mouldmaterial, but also to acquire fundamental scientific knowledge about the effects ofheat-driven moisture transport on the mechanical properties of bentonite bonded sands.
Even though scabs are by far the most common casting defect in green sand casting,neither the exact location of rupture nor the reasons for the strong decrease in tensilestrength were determined precisely, until today. Therefore, the aim of the first partof this study was to locate the exact fracture position and to determine the exacttemperature and moisture at this location of lowest strength. An exact localisationprovides an understanding of the massive decrease in tensile strength and, therefore, abetter understanding of the binding mechanisms of smectites.
The second part of this work focuses on the reusability of bentonite bonded sand asmould material. Exposed to temperatures above 100◦C, montmorillonite loses interlayerwater in a stepwise manner and dehydrates. Whereas this process is reversible, the lossof OH-groups (dehydroxylation) at higher temperatures (beginning at 300◦C) likelyis irreversible (see above) (Schultz 1969, Wolters & Emmerich 2007) and influencesthe smectites properties as binding agent permanently (Zymankowska-Kumon et al.2012, Bobrowski & Grabowska 2012). While the structural changes of smectites withtemperature are well understood, the changes in binding and transport properties causedby the alteration of bentonite bonded sand with temperature are still insufficientlyexamined. Therefore, aim of the second part of this thesis is to qualify the transport andmechanical properties of cyclically reused moulding sands (i.e., sands exposed to dryingand remoistening cycles) and of sands, which were exposed to temperatures abovethe dehydroxylation temperature of smectite. Understanding the interplay betweensmectite alteration and sand properties is an important step forward in improving therecycling and reuse of moulding sands. Furthermore, better knowledge about the
8

influence of smectite alteration on the properties of bentonite bonded sand enhances theunderstanding of the binding mechanism within bentonite bonded sands, which also isof tremendous importance for related processes like transport properties in bentonitebased disposal sites for radionuclides (Emmerich 2000).
In the third part of this study, the differences between Ca-montmorillonites andNa-montmorillonites were investigated. For this, the changes of mechanical propertiesand transport properties of cyclically reused and heat pre-treated Ca-bentonite bondedsands were investigated and compared with the results of the second part of this study.Elaborating the differences between Ca-bentonite and Na-bentonite bonded sands isexplicitly apt to provide a better understanding of the specific changes induced by heatpre-treatment and cyclic reuse in Na-bentonite bonded sands, which are by far thepreferentially used ones in foundry industry.
1.5 Author contributionsThis thesis is the detailed report of the author’s Ph.D. research work on bentonite bondedmoulding sands. Three chapter of thesis are based on scientific research manuscripts,which were published as a journal article (chapter 3), accepted for publication (chapter4), and in preparation for submission (chapter 5). The author of this thesis, KorbinianLeonhard Thomas Schiebel, is the principal author of all three of these manuscripts.The remaining chapters of the thesis comprise a general introduction, methodologicalaspects, and conclusions.
Chapter 3 was published with the title “Neutron Radiographic Study of the Effect ofHeat-Driven Water Transport on the Tensile Strength of Bentonite-Bonded MouldingSand” by Korbinian Schiebel, Guntram Jordan, Anders Kaestner, Burkhard Schillinger,Sandra Boehnke, and Wolfgang W. Schmahl in TRANSPORT OF POROUS MEDIA.Supervised by GJ, the principal author was designing the neutron-compatible tensilestrength testing device, applying for beam time at FRMII and PSI, planning and con-ducting the experiments, analysing and interpreting the data, and writing the manuscript.The remaining authors contributed to the experiments as beam line scientists and/orhelped to improve the manuscript.
Chapter 4 is accepted for publication in EUROPEAN JOURNAL OF MINERALOGYwith the title “Effects of heat and cyclic reuse on the properties of bentonite-bondedsand” by Korbinian Schiebel, Guntram Jordan, Anders Kaestner, Burkhard Schillinger,Robert Georgii, Kai-Uwe Hess, Sandra Boehnke, and Wolfgang W Schmahl. Supervisedby GJ, the principal author was designing the neutron-compatible tensile strength testingdevice, applying for beam time at FRMII and PSI, planning and conducting the neutronexperiments, analysing and interpreting the data, and writing the manuscript. AK, BS,RG contributed to the experiments as beam line scientists and helped to improve themanuscript. KUH conducted the gravimetric and calorimetric experiments and, togetherwith SB and WWS, helped to improve the manuscript.
Chapter 5 is in preparation for submission as journal article. Together with GJ, theprinciple author was supervising the master student Sophie Wunderlich, who contributed
9

1 Introduction
to this chapter. The master student used the experimental setup, which was providedby the author and the thesis supervisor, and conducted the Ca-bentonite experiments,which were designed by the author and the thesis supervisor. Analysis of the datawas performed with Matlab scripts written by the author. Interpretation of the datawas performed by SW together with the author and thesis supervisor. The neutronexperiments were made possible by the beam line scientists AK, BS, and RG.
10
2 Methods
2.1 Wet tensile testing
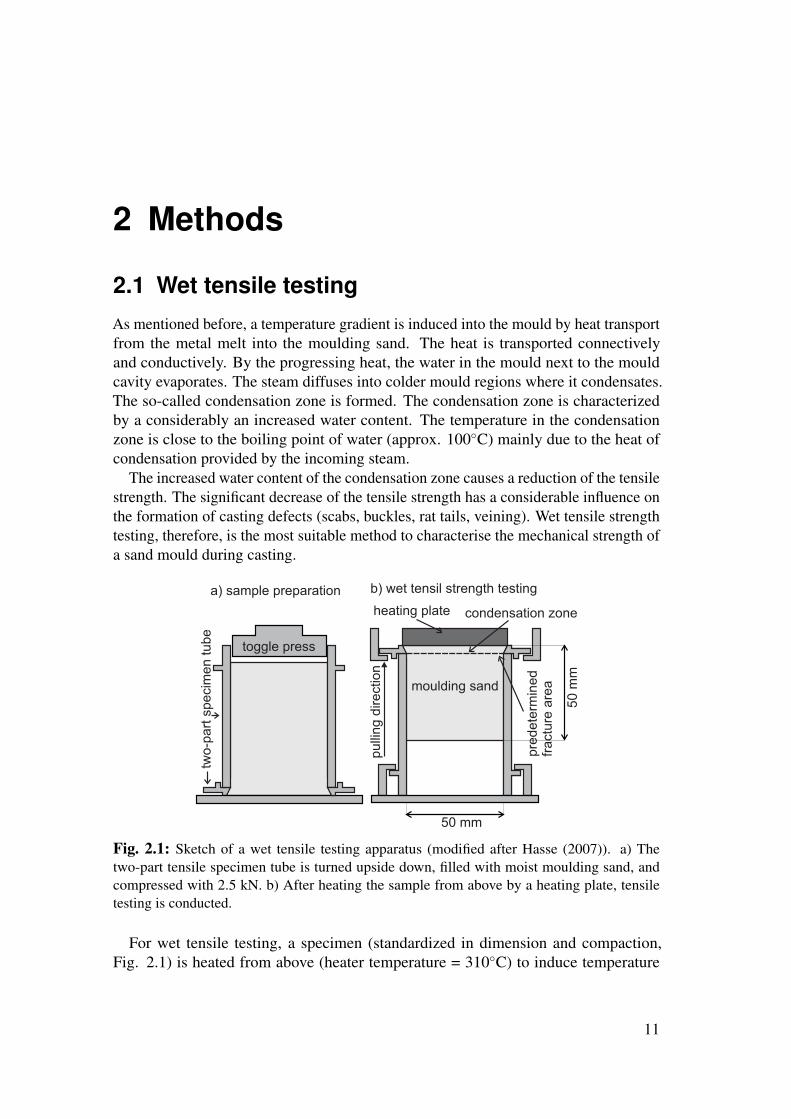
As mentioned before, a temperature gradient is induced into the mould by heat transportfrom the metal melt into the moulding sand. The heat is transported connectivelyand conductively. By the progressing heat, the water in the mould next to the mouldcavity evaporates. The steam diffuses into colder mould regions where it condensates.The so-called condensation zone is formed. The condensation zone is characterizedby a considerably an increased water content. The temperature in the condensationzone is close to the boiling point of water (approx. 100◦C) mainly due to the heat ofcondensation provided by the incoming steam.
The increased water content of the condensation zone causes a reduction of the tensilestrength. The significant decrease of the tensile strength has a considerable influence onthe formation of casting defects (scabs, buckles, rat tails, veining). Wet tensile strengthtesting, therefore, is the most suitable method to characterise the mechanical strength ofa sand mould during casting.
Fig. 2.1: Sketch of a wet tensile testing apparatus (modified after Hasse (2007)). a) Thetwo-part tensile specimen tube is turned upside down, filled with moist moulding sand, andcompressed with 2.5 kN. b) After heating the sample from above by a heating plate, tensiletesting is conducted.
For wet tensile testing, a specimen (standardized in dimension and compaction,Fig. 2.1) is heated from above (heater temperature = 310◦C) to induce temperature
11
2 Methods
and moisture gradients within the sample (BDG 1997). Once the condensation zoneapproximately reaches an intended rupture position within the sand specimen, the tensileforce (Fr) is measured. Subtraction of the weight of the upper sample part (Fg) fromthe tensile force, then, provides the net tensile force (Ft). The ratio of the measured nettensile force and the sectional area of the specimen (A) yields the wet tensile strength(σt):
σt =Ft
A(2.1)
2.2 Neutron radiography
2.2.1 Basics and experimental set up
In the past, high precision in-situ measurements of heat-driven moisture transfer withinporous media were extremely challenging. Due to recent advances, neutron radiographybecame a powerful method to determine the water kinematics within porous mediaquantitatively (Schillinger et al. 2006, Kaestner et al. 2008).
Neutron radiography is a non-destructive imaging method that works analogouslyto X-ray radiography. Unlike X-ray, however, neutrons interact exclusively with theatomic nuclei. Possible reactions of neutrons with atomic nuclei are neutron absorptionor coherent and incoherent scattering. The attenuation of a neutron by matter, therefore,is different to X-ray attenuation. While the attenuation of X-ray continuously increaseswith the electron density (Hubbell & Seltzer 1995), there is no significant correlationbetween attenuation of neutrons and the atomic number (Lindner et al. 1976). A neutronradiography system consists of a nearly parallel neutron beam and a detector system.The neutron source can be a reactor like the Neutronenquelle Heinz Maier-Leibnitz(FRM II) or a spallation source like the Swiss Spallation Neutron Source (SINQ)(Fischer 1997).
The sample to be investigated is placed in the beam, the neutrons transmitted throughthe sample are measured by a detector. Because different materials have differentattenuation coefficients, information about sample composition and structure can beobtained by the transmitted beam by the Beer-Lambert law (Lambert 1760, Beer 1852):
τ =I
I0
= e−Σi∆zi (2.2)
where τ is the local transmission of a parallel neutron beam in beam direction. Iand I0 are the transmitted and the initial intensity. Σi is the macroscopic cross sectionof phase i and ∆zi is the thickness of phase i in beam direction (note: the Einsteinsummation convention is used (Einstein 1916), therefore Σ is not used as summationoperator).
The macroscopic cross (Fig. 2.2) section and, thus, the attenuation of neutrons bymost elements forming silicate minerals (Si, Al, Ca, Fe, Mg, Na, O ...) is at least one or-der of magnitude smaller than attenuation by hydrogen. Neutron radiography, therefore,
12

0 10 20 30
Atomic number
100
101
102
Macro
scopic
cro
ss s
ection (
10
cm
)2
−2
4 H
CO
Na
Mg
Al
SiCa
Fe
Fig. 2.2: Macroscopic cross sectionsof smectite forming elements in theirnatural isotopic composition after Sears(1992).
can quantify water transfer within porous media such as quartz sands, concretes, plants,rocks and soils in-situ (Hassanein et al. 2006, Shokri et al. 2008, Schillinger et al. 2011,Sedighi-Gilani et al. 2013, Shokri & Or 2013, Hall 2013, Jordan et al. 2013, Villmanet al. 2014, Boon et al. 2015) and is the most suitable method to determine the watertransport during wet tensile with a high spatial and temporal resolution. Therefore, itis the ideal tool to measure the water kinematics in bentonite bonded moulding sandsin-situ during the complete wet tensile testing procedure.
For the neutron radiography experiments, a wet tensile testing apparatus was con-structed, which is compatible with simultaneous exposure to neutron radiation. Thespecimen tube (Fig 2.4) was constructed with a square cross section to avoid compli-cated geometric aftermaths of a round sample. Heating and tensile testing was imagedby taking neutron radiography time series. Evaluating the radiographs, the water contentin beam direction could be calculated for each pixel.
2.2.2 Image analysis
As mentioned above, the local transmission τ(x, y) of a parallel neutron beam througha specimen in beam direction z is given by Beer-Lambert law:
τ(x, y, t) =I(x, y, t)
I0(x, y)= e−Σi∆zi(x,y,t) (2.3)
where I(x, y, t) and I0(x, y) are the transmitted and the initial intensity, respectively,at the pixel-position x, y and time t. Σi is the macroscopic cross section of phase iand ∆zi(x, y, t) is the thickness of phase i in beam direction z. The initial intensityat each pixel I0(x, y) is determined by the median intensity of ten open beam images.To eliminate the influence of camera offset and dark current, all images were black
13

2 Methods
0 1 2 3 4 5 6
Initial water (wt.%)
0
0.5
1
1.5
2
2.5
-ln(
Tra
nsm
issi
on)
PSI
FRM2
Fig. 2.3: Calibration of correlation be-tween neutron transmission and waterthickness: Negative natural logarithmof the corrected and normalized neu-tron transmissions −ln(τ cor,nor) is plot-ted versus the known sand moisture fora sample thickness of 50 mm (44 mmsand, 2x3 mm aluminium). Linear re-gressions of the transmissions measuredat the two neutron beam lines are in-serted (PSI solid line, empty symbols;FRM II dashed line, filled symbols).The correlation factor ΘW can be deter-mined by the slope of the linear regres-sions. The negative natural logarithm ofthe transmission through the dry sand−ln(τ cor,norS ) is equivalent to the inter-ception of the ordinate.
field corrected. At each pixel (x, y), therefore, the median intensity of ten dark imagesId(x, y) was subtracted from each experimental radiograph as well as from the openbeam images:
τ(x, y, t)Cor =I(x, y, t)− Id(x, y)
I0(x, y)− Id(x, y)(2.4)
Intensity fluctuations of the neutron beam while taking the radiography image se-quence were corrected by an individual image correction factor b(t) according toHassanein (2006). The factor equals the ratio of the average brightness of an openbeam area I(xo, yo, t) within a radiograph and the average brightness of the same areain the open beam images I0(xo, yo). Additionally, the factor has to include a blackfield correction for the selected area Id(xo, yo) which needs to be subtracted from bothvalues:
b(t) =I(xo, yo, t)− Id(xo, yo)I0(xo, yo)− Id(xo, yo)
(2.5)
The transmission then is:
τCor(x, y, t) =I(x, y, t)− Id(x, y)
I0(x, y)− Id(x, y)/b(t) (2.6)
Using the above corrections, the measured neutron transmission can be correlatedwith the water thickness ∆zW (x, y, t) in a porous medium like quartz sand:
ln(τCor(x, y, t)
)= −∆zSΣS −∆zW (x, y, t)ΣW (2.7)
where the index S stands for the dehydrated moulding sand and the tube walls.
14

For an exact value of ΣS a precise chemical analysis of the moulding sand is required.For a constant sand thickness ∆zS , this can be avoided by measuring the neutrontransmission of the dry sand τS . Accordingly, ∆zSΣS can be replaced by −ln(τS):
ln(τCor(x, y, t)
)= ln(τCor
S )−∆zW (x, y, t)ΣW (2.8)
Fig. 2.4: Sketch of the two-part speci-men tube and the heating plate used forthe wet tensile testing.
In this work, the specimen thickness in beam direction is not constant but well defined(Fig. 2.4). The sand and water transmission of the pyramidal part of the sample tube,therefore, can be normalized to the prismatic part of the sample tube by inserting anormalization factor g(y):
g(y) =
1.227 for y ≤ 0.5
1.341− 0.227y for 0.5 < y < 1.5
1 for y ≥ 1.5
(2.9)
The relation for the corrected and normalized transmission then is:
ln(τCor,Nor(x, y, t)
)=ln(τCor(x, y, t)
)g(y)
= ln(τCor,NorS
)− ∆zW (x, y, t)ΣW
g(y)(2.10)
With increasing water thickness, the relevance of multi scattering effects on themeasured intensities increases. For a constant thickness of the porous medium, multiscattering can be taken into account by reference calibration measurements (Kang et al.2013). Exchanging the product of the water thickness (∆zW (x, y, t)) and the macro-scopic cross section of water (ΣW ) by the water content (w(x, y, t)) and a correlationfactor (ΘW ), the corrected and normalized transmission data (−ln(τCor,Nor(x, y))) ofthe reference measurements can be plotted versus the moisture content of the referencesample (Fig. 2.3).
15

2 Methods
ln(τCor,NorRef (x, y)
)= ln
(τCor,NorS
)−ΘWw(x, y, t) (2.11)
The slope and the intercept of the ordinate of the linear regression of referencetransmission data yield the correlation factor (ΘW ) and the transmission of the dry sand(ln(τCor,Nor
S )) respectively. Therefore, the total moisture amount can be calculated by:
w(x, y, t) =(ln(τCor,NorS
)− ln
(τCor,Nor(x, y, t)
))/ΘW (2.12)
For the calculation of the error of both the initial water content and the measuredtransmission, the equations from York et al. (2004) where applied using the matlabscript from Thirumalai et al. (2011). In accordance with the law of error propagation,the maximum uncertainty in calculating the absolute water content can be assumed tobe ±0.65wt.%
δw =
√δΘ2
W + δ(ln(τCor,Nor
S )ΘW−1)2
= 0.65wt.% (2.13)
The high thermal conductivity of aluminium causes condensation of water at the tubewalls. This condensation leads to water gradients in beam direction z. However, thewater distribution in beam direction cannot be imaged in radiographs. Only the totaltransmission in z-direction can be measured. In order to assess the water inhomogeneityin beam direction, profiles were measured along the y-axes. In these y-profiles, thedeviations between the average intensity and the intensity measured in the centre ofthe profile were never bigger than 1%. Assuming the y-profiles being representativefor the beam direction z, water condensation at the tube walls contributes to the totaluncertainty of the calculation of the water amounts by approximately less than 1%.
In combination with temperature measurements and mechanical testing, neutronradiography is not only a suitable method to investigate the coupling of heat and moisturetransport but also to assess the relation between transport and material property (Schiebelet al. 2017). Furthermore, if water is the only mobile phase, plots of local moisturecontent vs. temperature can be taken as local thermo-gravimetric measurements withina large scale sample (Jordan et al. 2013).
2.3 Neutron diffraction
Neutron diffraction is the application of neutron scattering to determine the crystalstructure of solid matter. For this, a sample is placed in a neutron beam and the measureddiffraction pattern provides the structural information of the sample. The technique isanalogously to X-ray diffraction but due to the different scattering properties, neutronsand X-rays provide complementary information. Neutron diffraction is the perfect toolto determine the amount of water within the interlayers of the smectites. Because of thesmall smectite content in the moulding sand (8 wt.% or less), the smectite interlayerspacing cannot be measured by X-ray diffraction. The hydration state of the interlayer
16

can directly be assessed by the d001-values of the smectite minerals. The 001-values canbe calculated from the peak position of the diffraction pattern by Bragg’s law (Bragg &Bragg 1913):
d001 =λ
2sin(Θ001)(2.14)
where d001 is the d-spacing, λ is the wave length of the neutron beam and Θ001 is thediffraction angle of the 001-reflection.
Fig. 2.5: Neutron diffraction pattern of the reference sand at room temperature. The background-corrected fit according to Eqn. 2.15 is included.
After subtracting the background, the diffraction angle (Θ001) can be determined byfitting the 001-peak in the powder pattern with a Gaussian function (Fig. 2.5).
Icalc(2Θ) = I001e−2(Θ−Θ001)
c2 +B12ΘB2 (2.15)
Icalc(2Θ) is the calculated intensity as function of the diffraction angle Θ. I001 is thecalculated amplitude (peak intensity) of the 001-peak, Θ001 is the calculated centre peakposition of the 001-peak, c is the full half maximum of the 001-peak. The backgroundof each diffraction pattern was fitted by a Matlab algorithm with an exponential function,therefore, B1 and B2 are the background fitting parameters.
Following the diffraction angle is:
Θ001 =
(2Θ + c2ln
(Icalc(2Θ)−B12ΘB2
I001
))/2 (2.16)
The d001-spacing varies between approx. 10 and 20 Å depending on the amount ofinterlayer water (Holmboe & Bourg 2013, Villar et al. 2012, Ferrage et al. 2010, Zheng
17

2 Methods
et al. 2010, Collins et al. 1992, Bird 1984)). Particular details, like the used wave length,of the performed diffraction analyses are given in the specific methodological sectionsof the following chapters.
2.4 SEMScanning electron microscopy (SEM) is a non-destructive imaging technique, whichimages the surface of a sample by scanning it with a focused electron beam. Varioussignals are generated such as secondary electrons (SE), reflected or back-scatteredelectrons (BSE) or characteristic X-rays. The spatial resolution of SEM images is highenough to resolve the microstructure within the moulding sand. This microstructuredepicts the specific arrangement of clay particles and quartz grains within the compactedmoulding sand. The energy-dispersive X-ray spectroscopy (EDX) thereby helps todistinguish between clay and quartz grains. Particular details of the performed electronmicroscopy analyses are given in the specific methodological sections of the followingchapters.
2.5 TG & DSCThermogravimetry (TG) or thermal gravimetric analysis (TGA) is a method, whichdetermines the mass of a sample over time as the temperature changes. The sensitivityof modern devices is high enough to measure not only the dehydration process withinthe sand during heating, it also makes it possible to determine the dehydroxylationtemperatures of the smectites within the moulding during heating. The data, thus, enableinferring on structural changes of the smectites. Also differential scanning calorimetry(DSC) is a thermoanalytical technique. It measures the difference in heat, which isrequired to increase the temperature of a sample and a reference. The heat differenceallows the determination of the dehydration and dehydroxylation temperature precisely.Particular details of the conducted thermal analyses are explained in detail in the specificmethodological sections of the following chapters.
18

3 Neutron radiographic study ofthe effect of heat-driven watertransport on the tensile strengthof bentonite bonded mouldingsand
3.1 Open questions
In spite of the common use of wet tensile testing in industries (Campbell 2011), waterand heat kinematics within the specimen were never quantitatively measured in-situduring wet tensile testing. Thus, the dependencies of fracture plane position and tensilestrength on moisture and temperature were never determined precisely. Aim of the firstpart of this study was, therefore, to follow the location of the weakest point within themoulding sand quantitatively during time and to determine the effects of heat and waterkinematics on fracture location and tensile strength.
3.2 Materials and methods
Neutron radiography time series were performed both at the cold neutron imaging facil-ity ICON (SINQ, Paul Scherrer Institute, Villigen, Switzerland, (Kaestner et al. 2011))and at the imaging beamline ANTARES (FRM II, Heinz-Maier-Leibnitz-Zentrum,Garching, Germany, (Schulz & Schillinger 2015)). At ICON wet tensile strength testing(from the begin of heating to the moment of rupture) was followed using a CMOScamera (image frequency: 4 frames per second, field of view: 105 mm x 72 mm, spatialresolution 0.047 mm/pixel, sample detector distance 4 cm). At ANTARES, heating andtensile testing was imaged with a CMOS camera (image frequency: 0.55 frames persecond, field of view: 100 mm x 80 mm, spatial resolution 0.047 mm/pixel, sampledetector distance 12 cm).
From the evaluation of the radioraphs the water kinematics was quantified. Accordingto Hassanein et al. (2006) the radiographs were corrected for white and dark spots,background noise, and beam fluctuation. The local water content was calculated fromthe corrected radiographs by:
19

3 Effect of water transport on tensile strength
w(x, y, t) =
(ln
(τ cors
g(y)
)− ln
(τ(x, y, t)cor
g(y)
))/ΘW (3.1)
Green sand consisting of quartz (average grain size approx. 0.3 mm) and 8 wt.%of natural sodium bentonite (Wyoming) was obtained from S&B Minerals (Imerys,Marl, Germany). The sand has been dried at 120◦C for at least 24 hours before it wasremoistened with defined water quantities (2, 3, 4, and 5 wt.% H2O) and aged forat least 24 hours in air-tight bags. The aged sand, then, was sieved into a two-partaluminium specimen tube Fig. (2.4). The lower prismatic part of the specimen tubehas a quadratic 44 mm x 44 mm cross section and a height of 100 mm. The quadraticcross section of the upper pyramidal part (height 20 mm) increased from 44 mm x44 mm to 54 mm x 54 mm. The aluminium walls of the tube (thickness 3 mm) werealmost transparent in the neutron radiographs. The two-part specimen tube was turnedupside down and filled with sieved sand. Subsequently, the sand within the tube wascompressed with 1 MPa. Compaction depth ∆yC was measured to determine the samplevolume and to calculate porosity Φ and saturation S. For this, porosity and saturationare defined by:
Φ =VSt −∆yCA−mS/ρS
VSt −∆yCA(3.2)
(VSt is the volume of the complete sample tube, mSis the mass of the dry sand, ρS isthe density of the dry sand, A is the cross section area of the lower sample tube), and
S =mW/ρW
VSt −∆yCA−mS/ρS(3.3)
(ρW is the density of water, mW is the mass of water) respectively.
Fig. 3.1: Tensile strength testing signal.
20
To induce moisture and temperature gradients within the sample, the sand wascontacted from above with a heater which had been preheated to 310◦C accordingto VDG norm P38 (BDG 1997). After a defined heating period, tensile force wasincreased by 50 N/s and continuously measured by a stress gauge with a frequency of200 data points per second. After rupture, the tensile strength σt was determined bysubtracting the weight of the upper sample part Fg (specimen and specimen tube) fromthe maximum measured tensile force Fr and normalizing this net tensile force to thecross sectional area A at the specimen neck (Fig. 3.1).
σt =Fr − Fg
A(3.4)
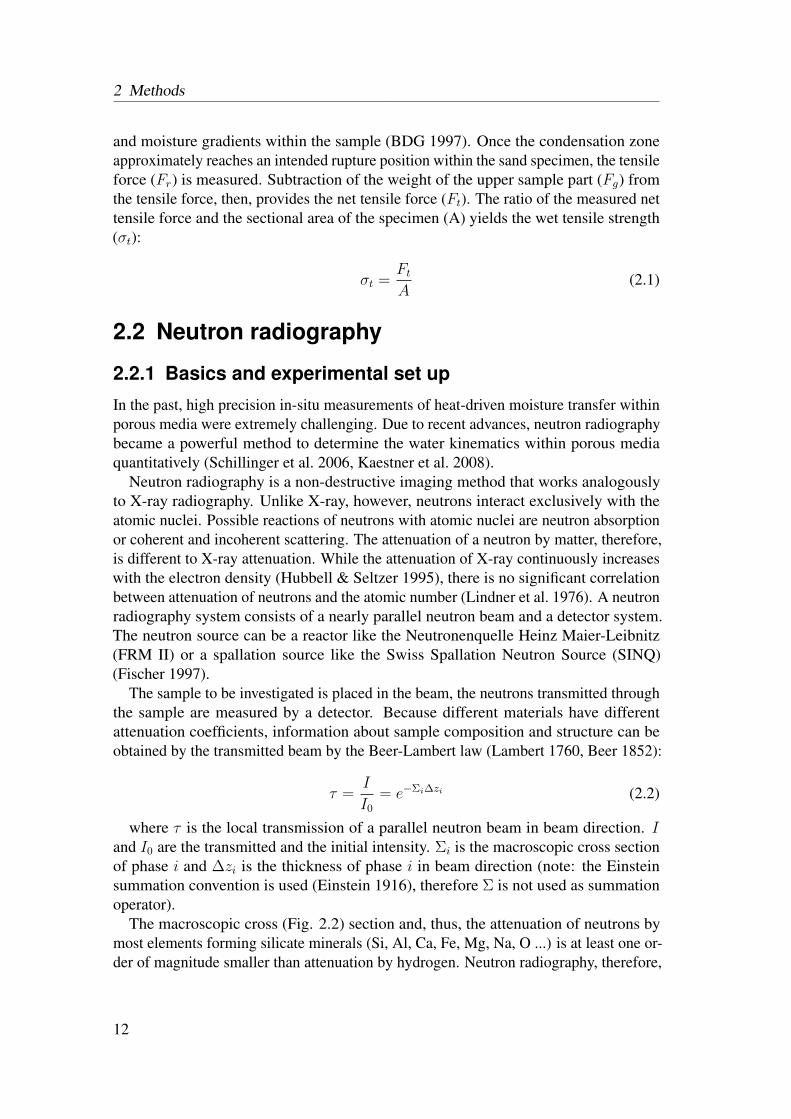
Thermocouples provided temperature data integrated over a sample volume of severalcubic millimetres. Temperature gradients on the scale of individual sand grains and pores(filled or unfilled) were not accessible. The comparison of temperature measurementsat a given position in different experiments performed under same conditions (moisture,porosity) showed that a temperature can be assigned to a certain position with anaccuracy of approximately±2.5 mm. This limited spatial resolution mainly results fromthe low accuracy of the determination of the thermocouple position in the radiographs.
The evolution of the local temperature was continuously measured during the exper-iments at four different positions below the specimen neck with a frequency of twomeasurements per second. In order to determine the temperature distribution in theupper pyramidal part, additional reference experiments without tensile testing wereconducted. The local temperature, thereby, was measured in steps of 5 mm from theheating plate with a frequency of two measurements per second for at least 330 seconds.
Fig. 3.2: Moisture distribution (colour coded) calculated by equation 2.12 from the radiographstaken 0.5 seconds before (a) and 0.5 seconds after (b) rupture. The temperature profile beforerupture is given by isotherms (black lines in radiography a).
21
3 Effect of water transport on tensile strength
0 50 100 150
Time (s)
0
50
100
150
200
250
Tem
pera
ture
(°C
)
0 mm
15 mm
30 mm
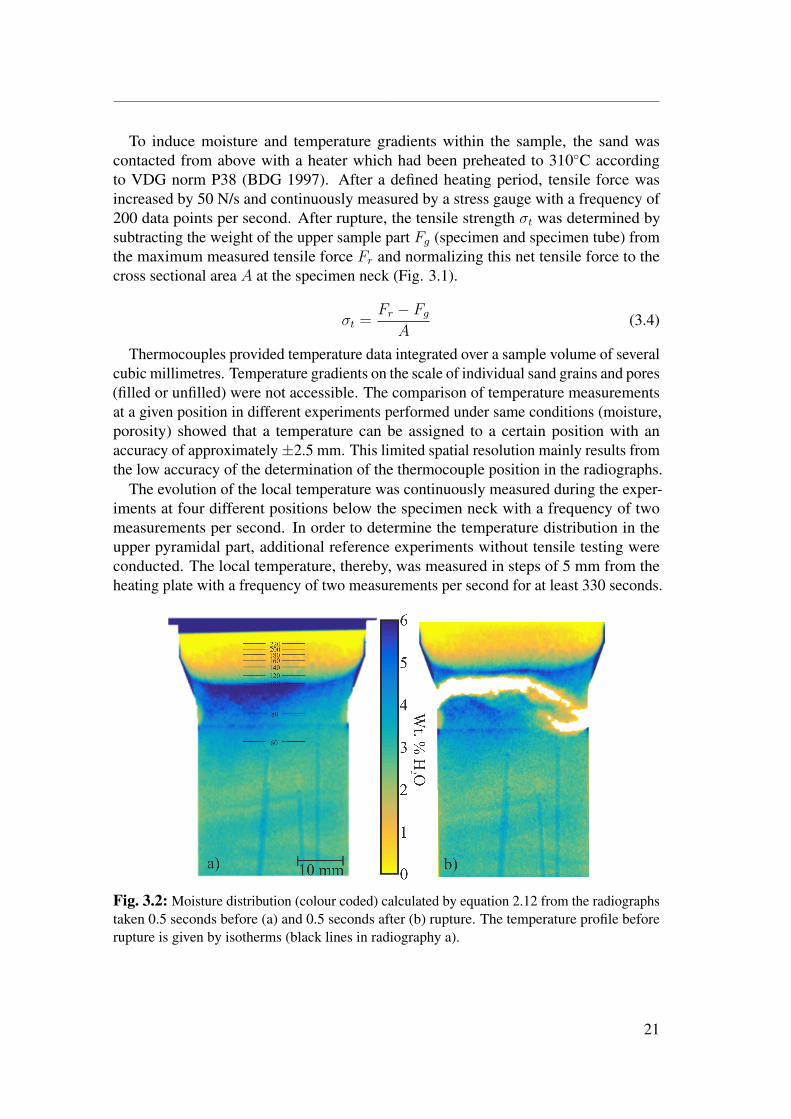
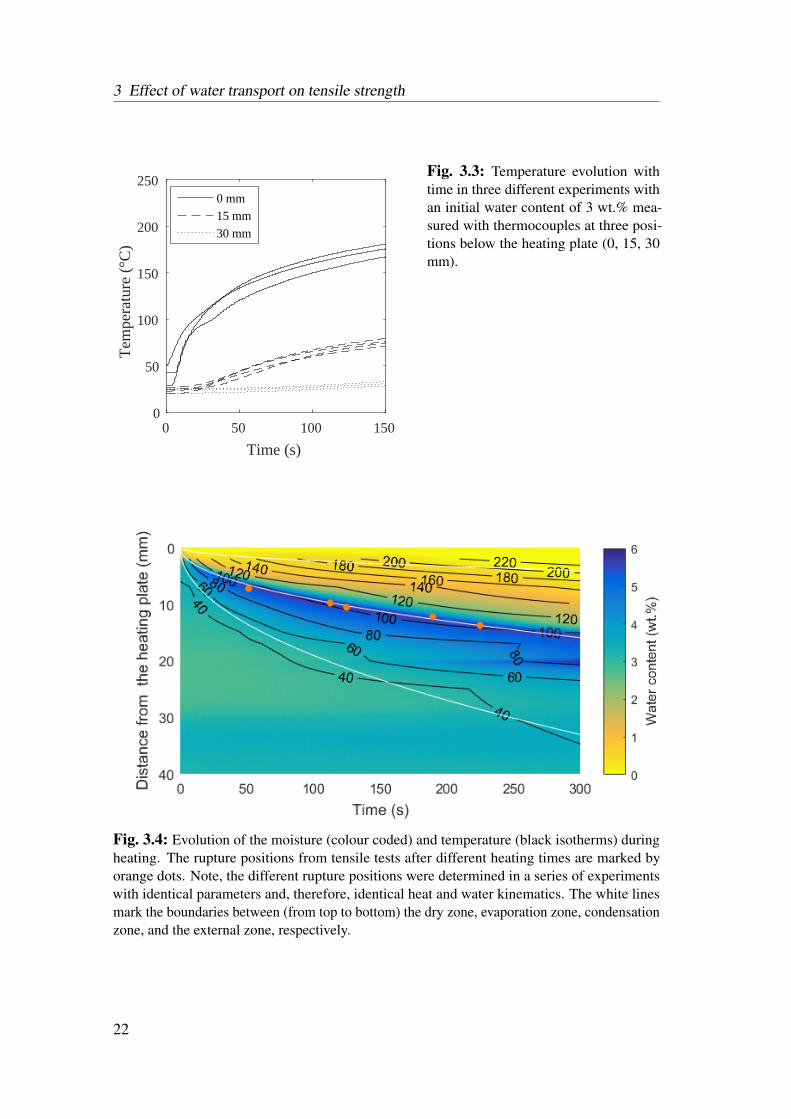
Fig. 3.3: Temperature evolution withtime in three different experiments withan initial water content of 3 wt.% mea-sured with thermocouples at three posi-tions below the heating plate (0, 15, 30mm).
Fig. 3.4: Evolution of the moisture (colour coded) and temperature (black isotherms) duringheating. The rupture positions from tensile tests after different heating times are marked byorange dots. Note, the different rupture positions were determined in a series of experimentswith identical parameters and, therefore, identical heat and water kinematics. The white linesmark the boundaries between (from top to bottom) the dry zone, evaporation zone, condensationzone, and the external zone, respectively.
22
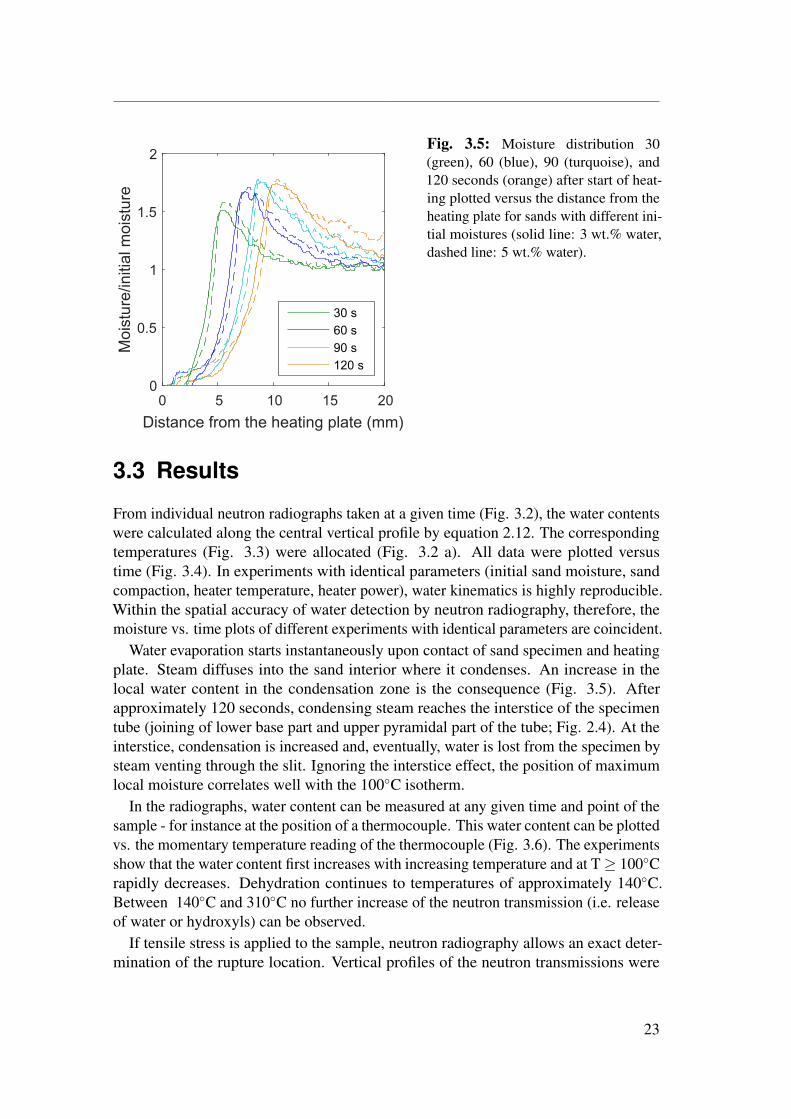
Fig. 3.5: Moisture distribution 30(green), 60 (blue), 90 (turquoise), and120 seconds (orange) after start of heat-ing plotted versus the distance from theheating plate for sands with different ini-tial moistures (solid line: 3 wt.% water,dashed line: 5 wt.% water).
3.3 Results
From individual neutron radiographs taken at a given time (Fig. 3.2), the water contentswere calculated along the central vertical profile by equation 2.12. The correspondingtemperatures (Fig. 3.3) were allocated (Fig. 3.2 a). All data were plotted versustime (Fig. 3.4). In experiments with identical parameters (initial sand moisture, sandcompaction, heater temperature, heater power), water kinematics is highly reproducible.Within the spatial accuracy of water detection by neutron radiography, therefore, themoisture vs. time plots of different experiments with identical parameters are coincident.
Water evaporation starts instantaneously upon contact of sand specimen and heatingplate. Steam diffuses into the sand interior where it condenses. An increase in thelocal water content in the condensation zone is the consequence (Fig. 3.5). Afterapproximately 120 seconds, condensing steam reaches the interstice of the specimentube (joining of lower base part and upper pyramidal part of the tube; Fig. 2.4). At theinterstice, condensation is increased and, eventually, water is lost from the specimen bysteam venting through the slit. Ignoring the interstice effect, the position of maximumlocal moisture correlates well with the 100◦C isotherm.
In the radiographs, water content can be measured at any given time and point of thesample - for instance at the position of a thermocouple. This water content can be plottedvs. the momentary temperature reading of the thermocouple (Fig. 3.6). The experimentsshow that the water content first increases with increasing temperature and at T≥ 100◦Crapidly decreases. Dehydration continues to temperatures of approximately 140◦C.Between 140◦C and 310◦C no further increase of the neutron transmission (i.e. releaseof water or hydroxyls) can be observed.
If tensile stress is applied to the sample, neutron radiography allows an exact deter-mination of the rupture location. Vertical profiles of the neutron transmissions were
23

3 Effect of water transport on tensile strength
.
Fig. 3.6: Evolution of the water contentmeasured at a thermocouple 5 mm be-neath the heating plate versus the localtemperature.
taken from the last radiograph recorded before rupture and from the directly subsequentradiograph (image acquisition frequency: 4 Hz). The negative natural logarithms of thetransmissions were plotted together with the difference of the two profiles. The ruptureposition was allocated to the maximum difference (Fig. 3.7). The rupture positionswere then inserted into the plots with the local water contents and temperatures (Fig.3.4).
The rupture positions (within the tube interior) obtained by tensile testing at 51, 112,125, 189, 225, and 315 seconds after contact with the heating plate (but otherwiseidentical parameters) were inserted in Figure 3.4. The positions of the rupture planewithin the tube interior closely follow the positions of the highest moisture content.
From the measured tensile forces, wet tensile strengths (i.e. heated samples) andgreen tensile strengths (i.e. unheated samples) were calculated by equation 3.4. Bothwet and green tensile strength depend on the initial moisture of the sand (Fig. 3.8).Green tensile strength initially increases for sands with increasing moisture, then showsa maximum of 12 kN/m2 at approximately 3 wt.% water, which corresponds to asaturation S of 0.09 (Fig. 3.9). Finally, the green tensile strength decreases to 7.8kN/m2 at 5 wt.% initial water content with a saturation of 0.13. At all moisture contents,green tensile strength is higher than the related wet tensile strength. The wet tensilestrength increases from 18 to 5.8 kN/m2 for sands with 2 wt.% and 3 wt.% initial water,respectively. A further increase of the initial moisture to 5 wt.% only causes a weakincrease of wet tensile strength to 6 kN/m2.
24

0 10 20 30 40
Distance from the heating plate (mm)
-0.5
0
0.5
1
1.5
2
2.5
3
-Log
(Tra
nsm
issi
on)
Last radiograph before ruptureSubsequent radiographDifference of both curves
0 10 20 30 40
Distance from the heating plate (mm)
-0.5
0
0.5
1
1.5
2
2.5
3
-Log
(Tra
nsm
issi
on)
Last radiograph before ruptureSubsequent radiographDifference of both curves
Fig. 3.7: Negative natural logarithmof the horizontal transmission pro-files of moulding sands (3 wt.% initialmoisture) before rupture (solid line),0.25 s later (dash-dot line), and theirdifference (dash line). Upper imageand lower image taken after a heatingperiod of 125 and 189 s, respectively.The maximum change indicates therupture position exactly.
25

3 Effect of water transport on tensile strength
0 2 4 6 8 10
Water content (wt.%)
0
5
10
15
Ten
sile
str
engt
h (k
N/m
²)
Fig. 3.8: Green (empty triangles) andwet (filled triangles) tensile strength ver-sus moisture at the location of fracture.Triangles pointing in the same directionlink experiments performed with identi-cal moulding sand parameters i.e., linkgreen tensile strength of a given mould-ing sand with the respective wet tensilestrength of this sand.
Fig. 3.9: Initial (filled dots) and maxi-mum saturation (empty dots) plotted ver-sus initial moisture. Saturation was cal-culated according to Eqn. 3.3.
26

0 1 2 3 4 5 6
Initial water (wt.%)
0
2
4
6
8
10
12
Max
imum
wat
er (
wt.%
)
Measured
Calculated
Fig. 3.10: Measured and calculatedmaximum water contents versus initialmoisture. The calculations were per-formed with eq. 3.5 using a specific heatCs of moulding sand of 0.84 and 1.26kJ/(kgK) as a lower and upper limit,respectively.
3.4 Discussion
3.4.1 Transport dependence on initial moisture
Like mentioned in the introduction, the model for water and heat transport withinbentonite bonded moulding sands during casting of Kubo & Pehlke (1986) is the mostdetailed model, today. However, Kubo & Pehlke (1986) defined the zone boundariesby isotherms assuming that the complete pore water evaporates at 100◦C. Exchangebetween pore water and water within the interlayers of the clay minerals was not takeninto account. However, Figure 3.6 shows that water does not completely evaporatefrom the moulding sand at 100◦C. This finding is in agreement with literature datawhich show that due to diffusion controlled dehydration of water within the interlayersof smectites, some water can remain within the interlayers well above 100◦C (Odom1984, Ferrage et al. 2010, Bray & Redfern 1999, Zabat & Van Damme 2000). As waterremains in the moulding sand at temperatures up to 140◦C, the boundary between dryzone and evaporation zone has to be moved from the 100◦C isotherm to much highertemperatures.
The boundary between evaporation zone and condensation zone is marked by thelocation where the temperature of the sand is just reaching the boiling point of bulkwater (i.e., pore water). The boundary, therefore, simultaneously represents the locationof maximum water content (max). This maximum value of moisture is predominantlycontrolled by the heat capacity of the moulding sand environment (Kubo & Pehlke 1986,Patterson & Boenisch 1961a). Once the heat of condensation raises the temperatureup to the boiling point, maximum moisture is reached and the boundary between theevaporation and the condensation zone passes this location. According to Carslaw &Jaeger (1959), maximum moisture wmax can be approximated by:
27
3 Effect of water transport on tensile strength
0 2 4 6 8 10 12
Time 1/2 (s 1/2 )
30
25
20
15
10
5
0
Dis
tanc
e fr
om th
e he
atin
g pl
ate
(mm
)
Dry/evaporation
Evaporation/condensation
Condensation/external
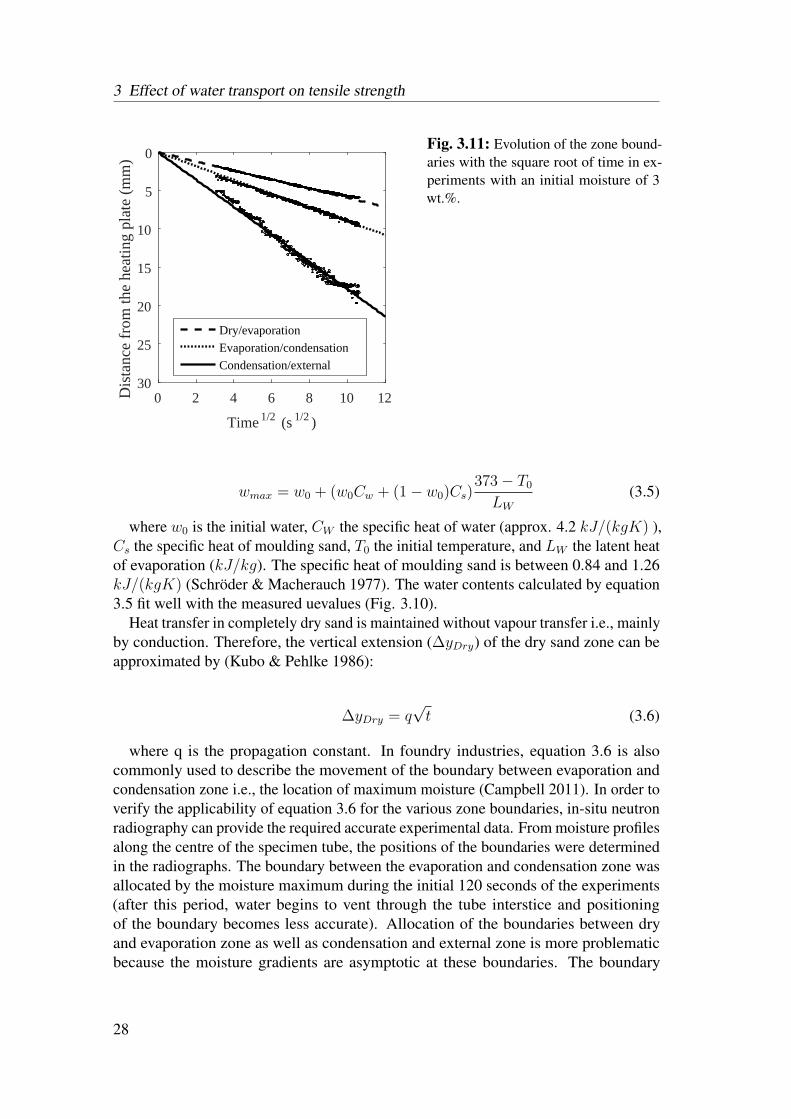
Fig. 3.11: Evolution of the zone bound-aries with the square root of time in ex-periments with an initial moisture of 3wt.%.
wmax = w0 + (w0Cw + (1− w0)Cs)373− T0
LW
(3.5)
where w0 is the initial water, CW the specific heat of water (approx. 4.2 kJ/(kgK) ),Cs the specific heat of moulding sand, T0 the initial temperature, and LW the latent heatof evaporation (kJ/kg). The specific heat of moulding sand is between 0.84 and 1.26kJ/(kgK) (Schröder & Macherauch 1977). The water contents calculated by equation3.5 fit well with the measured uevalues (Fig. 3.10).
Heat transfer in completely dry sand is maintained without vapour transfer i.e., mainlyby conduction. Therefore, the vertical extension (∆yDry) of the dry sand zone can beapproximated by (Kubo & Pehlke 1986):
∆yDry = q√t (3.6)
where q is the propagation constant. In foundry industries, equation 3.6 is alsocommonly used to describe the movement of the boundary between evaporation andcondensation zone i.e., the location of maximum moisture (Campbell 2011). In order toverify the applicability of equation 3.6 for the various zone boundaries, in-situ neutronradiography can provide the required accurate experimental data. From moisture profilesalong the centre of the specimen tube, the positions of the boundaries were determinedin the radiographs. The boundary between the evaporation and condensation zone wasallocated by the moisture maximum during the initial 120 seconds of the experiments(after this period, water begins to vent through the tube interstice and positioningof the boundary becomes less accurate). Allocation of the boundaries between dryand evaporation zone as well as condensation and external zone is more problematicbecause the moisture gradients are asymptotic at these boundaries. The boundary
28

Fig. 3.12: Propagation constants ofzone boundaries in moulding sands withdifferent initial moisture contents.
between condensation and external zone, therefore, was defined by the position wherethe local moisture exceeds the initial water by more than 1%. The extent of the dryzone was defined by the range in which the local moisture content is less than 1% largerthan at the end of the experimental run. The obtained positions of the zone boundariescan then be plotted versus the square root of time (Fig. 3.11). The data show that thepropagation of all zone boundaries can be approximated by equation 3.6.
From the data in Fig. 3.11, the propagation constants q of the boundaries werecalculated by least square fits. Boundary propagation constants were calculated fromexperiments with different initial moisture contents (2, 3, 4, and 5 wt.%; Fig. 3.12).The propagation constants of the boundary between dry and evaporation zone, whichis primarily driven by heat conduction (Udell 1983, Kubo & Pehlke 1986), are nearlyindependent of the initial water content.
The propagation constants of the boundary between evaporation and condensationzone (Fig. 3.12) are in good agreement with Udell (1983). This author showed that themovement of the boundary is dominated by the vapour pressure gradient between dryand condensation zone, which is largely independent from initial moisture contents ofthe sand.
The propagation of the boundary between condensation and external zone (Fig. 3.12)is driven by water and steam diffusion (Udell 1983). The temperature at the hot endof the condensation zone is always 100◦C. Consequently, the gas pressure differencebetween both ends of the condensation zone is constant. With increasing initial moistureboth the porosity (Fig. 3.13) and the saturation of the pore space (Fig. 3.9) increase.Although the saturation of the pore space (Fig. 3.9) increases with increasing initialmoisture, a significant effect of initial water content on gas permeability is not likely inthe range of initial water contents of this experiment. However, the heat capacity of themould increases with increasing initial moisture and causes an increase of the heat flux
29

3 Effect of water transport on tensile strength
0 1 2 3 4 5 6
Initial water (wt.%)
40
45
50
55
Poro
sity
(vo
l.%)
Fig. 3.13: Porosity calculated by equa-tion 3.2 versus initial moisture.
(Fan & Wen 2002). Consequently, the propagation constant of the boundary betweencondensation and external zone increases (Popielarski & Ignaszak 2016).
3.4.2 Differences in tensile strength with changes in initialmoisture
The dependence of green tensile strength (i.e., the tensile strength of the unheated sand)on sand moisture agrees well with the data of Patterson and Patterson & Boenisch(1961a), who also observed a positive correlation of tensile strength with water contentfollowed by a negative correlation at water contents larger than approx. 3 wt.%. Theobserved initial increase of green tensile strength with water content is in accordance tothe numerical model derived by Lu et al. (2009) for the tensile strength of moist sands.For clay, the numerical model of Lu et al. (2010) yields a negative correlation of tensilestrength with increasing moisture. The observed decrease of the green tensile strengthat water contents higher than 3 wt.% (which corresponds to a saturation of less than 10vol.%), therefore, may indicate that the mechanical behaviour of the moulding sand isincreasingly dominated by the clay minerals. In this context, it has to be noted that theclay minerals in moulding sands are rolled onto the quartz grains by a milling processrather than loosely mixed with quartz grains. The porosity and texture of mouldingsands, therefore, is strongly influenced by the quartz grains while the clay minerals mayaffect the surface properties strongly.
The tensile strength of the unheated sand corresponds with the data of Patterson &Boenisch (1961a) which also observed a strong increase of tensile strength with anincreasing water content from 2 to 3 wt.% and a strong decrease when the water contentincreases further. The increase in tensile strength is in accordance to the theoretical
30

model of Lu et al. (2009) for sands. The decrease at higher water contents indeedindicate a clay like behaviour (Lu et al. 2010).
The quantitative transport data as obtained from neutron radiographs coupled withthe quantitative mechanical data obtained from tensile strength testing allow for aninvestigation of the effect of heat and mass transfer on the tensile strength as one ofthe most important properties of bentonite bonded moulding sands. The data showthat the tensile strength of moulding sands, which contain heat driven evaporation andcondensation zones, is significantly lower than the tensile strength of the same sands atroom temperature (Fig. 3.8). Furthermore, the data show that this decrease in strengthis taking place not homogeneously over the entire specimen. Consequently, a point oflowest tensile strength can be located which moves away from the heat source. Theposition of this weakest point depends on temperature and moisture content, both thepresent and in the past. In neutron radiographs, the weakest position can clearly beidentified by the rupture plane. This plane coincides with the location of maximumwater content and the position where the sand temperature reaches the boiling point ofbulk water. The rupture plane, therefore, corresponds to the boundary of condensationand evaporation zone.
These findings partially contradict Patterson & Boenisch (1961a) who assumed thatthe supersaturation in the condensation zone (i.e, in the zone of temperatures belowthe boiling point of water) is the main reason for spalling. Even though water contentsexceeding approx. 3 wt.% cause decreasing tensile strengths within the condensationzone, the rupture positions observed in the present experiments clearly correlate with thedistinct temperature and moisture conditions marked by the boundary of condensationand evaporation zone. As the position of this boundary depends on heat and moisturetransfer, the location of minimum tensile strength is transient and moves into the mouldinterior continuously with time.
Following the reasoning of Munkholm & Kay (2002), Heibrock et al. (2005), Forsmoet al. (2006), Zeh & Witt (2007), Vanicek (2013), capillary force is the major forcebinding sand grains in moist sand. With increasing water content, the saturationincreases. At first, more water bridges are formed and the number of capillary contactsbetween water and solid surfaces increases. With a further increase of the water content,however, the pore space becomes more saturated and the water bridges merge (Lu et al.2007, Tang et al. 2015, Song et al. 2012). The surfaces of more and more grains becomecompletely wetted and the cohesion between the particles decreases. Above a criticalwater content, therefore, tensile strength decreases again.
Water content is not the only factor affecting tensile strength. The experiments show(Fig. 3.8) that the tensile strength of moulding sands with a water content for instanceof 5% varies significantly with temperature. This is in accordance with Patterson &Boenisch (1961a) who reported that moist sand has the highest tensile strength at roomtemperature. The decrease of tensile strength can be explained by the temperaturedependence of capillary forces. Higher temperatures lead to a decrease of the surfacetension of water (Young & Harkins 1928) and lower the capillary forces. At the boiling
31

3 Effect of water transport on tensile strength
point, surface tension of water and capillary forces become zero. The majority of waterbridges therefore do not collapse within the condensation zone but at the boiling point.
Within the evaporation zone (i.e., the zone of temperatures at and above the boilingpoint of water), the residual tensile strength is related to both the binding capacity ofbentonite, which is largely facilitated by the remaining water molecules still adsorbedat the clay surfaces, and the cementation caused by precipitation of solutes between thesand grains from evaporating water. While the binding capability of the first decreaseswith increasing temperature due to increasing water desorption from the surfaces, thebinding capability of the latter increases with increasing temperature. Above 140◦C,finally, cementation within the virtually dry sand leads to a tensile strength which ismuch higher than that of moist sand (Patterson & Boenisch 1961a). By image analysesand consideration of earlier works, the minimum tensile strength can be preciselylocated at the front of the evaporation zone.
32

4 Effects of heat and cyclic reuseon the properties ofbentonite-bonded sand
4.1 Introduction
Although the general heat-induced effects on the montmorillonite structure have beenexamined intensively, the effects of heat on moisture transport and, therefore, on thebinding properties of bentonite-bonded moulding sands were subject to only very fewstudies (Holtzer et al. 2011, Bobrowski & Grabowska 2012, Zymankowska-Kumonet al. 2012). Likewise, effects of cyclic reuse on the properties of moulding sand are farfrom being known satisfactorily. Altered water transport within the sand during castingoften is correlated with decreased wet tensile strength, which substantially degrades thequality of moulding sand. In order to study both mechanical strength and water transportproperties, wet tensile testing (Schiebel et al. 2018), neutron radiography (Schillingeret al. 2011, Hall 2013, Sedighi-Gilani et al. 2013), and neutron diffraction was appliedhere. The simultaneous application of wet tensile testing and neutron radiography, inparticular, allowed for a correlation of tensile strength with both the position of therupture plane and the local water content of the sand with a spatial resolution in thesub-mm range and a sub-second temporal resolution (Schiebel et al. 2018). Neutrondiffraction gave information about water residing within the smectite interlayers atgiven time and temperature. Altogether, the experiments allowed a detailed evaluationof the sand properties induced by heat and cyclic reuse. The aim of this work, therefore,was to gain deeper insights into the changes of the properties of moulding sand inducedby heat or its continuous reuse.
4.2 Materials and method
4.2.1 Materials
Bentonite-bonded sand consisting of 92 wt.% quartz (average grain size approx. 0.3 mm)and 8 wt.% natural bentonite (Wyoming) was obtained from S&B Minerals (Imerys,Marl, Germany). Analysis of comparable bentonite from the same source yieldedapprox. 87 wt.% smectite and 13 wt.% of other minerals (mainly feldspar, quartz, andcalcite; Jordan et al. (2013)).
33

4 Effects of heat and cyclic reuse on the properties of bentonite-bonded sand
Two suites of experiments were performed. For the first suite of experiments, aliquotsof approx. 1 kg of the sand were dried at 120◦C for 24 h in a drying chamber. Whilecontinuously mingling with an electric blender, the aliquots were remoistened to 3wt.% H2O by slowly adding approx. 30 ml water. After a further mixing for 10 min,the remoistened sand was finally aged for 24 h in an airtight bag. In total, this drying,remoistening, blending and ageing procedure was cyclically repeated 13, 22 or 25 times(the latter was used for propagation constant measurements only). The exact amountof water added in each cycle was referred to the dry weight measured directly beforeremoistening. For the second suite of experiments, aliquots of approx. 1 kg of mouldingsand containing 3 wt.% H2O were heat-treated for 24 h in a muffle furnace at T = 225,330, 390, 435, 540, 645, or 750◦C, remoistened (3 wt.% H2O), blended for 10 min andaged in airtight bags for at least 24 h. As reference in both experimental suites, freshand unused sand was dried once at 120◦C for 24 h in a drying chamber, remoistened to3 wt.% H2O, blended for 10 min and aged in airtight bags for at least 24 h. This singledrying-remoistening procedure was essential in order to obtain sand with a definedamount of water.
4.2.2 DSC and TG
The dried and un-remoistened reference moulding sand was simultaneously examinedby differential scanning calorimetry (DSC) and thermogravimetry (TG) in order todetermine dehydroxylation temperatures of the smectite within the moulding sandprecisely. These DSC and TG data could be correlated with the temperatures of thedehydration and dehydroxylation of the moulding sand observed by neutron radiographyand neutron diffraction. For the thermal analysis (Thermo Microbalance STA 449 F1;Netzsch), 63.05 mg of the sand was heated in a static argon atmosphere in a Pt-crucible(256.74 mg), which was closed with a lid with a small hole. As reference, an emptycrucible of the same shape and weight was used. The heating rate was 10 K/min. Thefinal temperature was 1000◦C. A temperature calibration has been performed by usingthe extrapolated onset of the melting points of indium and zinc. The uncertainty of thetemperature measurement is smaller than 1 K.
4.2.3 Neutron radiography time series of heated tensiletesting
For the tensile tests, a two part aluminium tube was used (Fig. 2.4). The lower prismaticpart had a quadratic cross section (44 mm x 44 mm) and a height of 100 mm. Thequadratic cross section of the upper pyramidal part (height 20 mm) increased from 44mm x 44 mm to 54 mm x 54 mm. The two-part specimen tube was turned upside downand filled with sieved sand. Subsequently, the sand within the tube was compressedwith 1 MPa, yielding a porosity of 48 ± 3 vol.%. To simulate the casting conditions, atemperature and moisture gradient was induced by heating the sample from above witha heating plate (T = 310◦C). The temperature within the sand sample was monitored
34
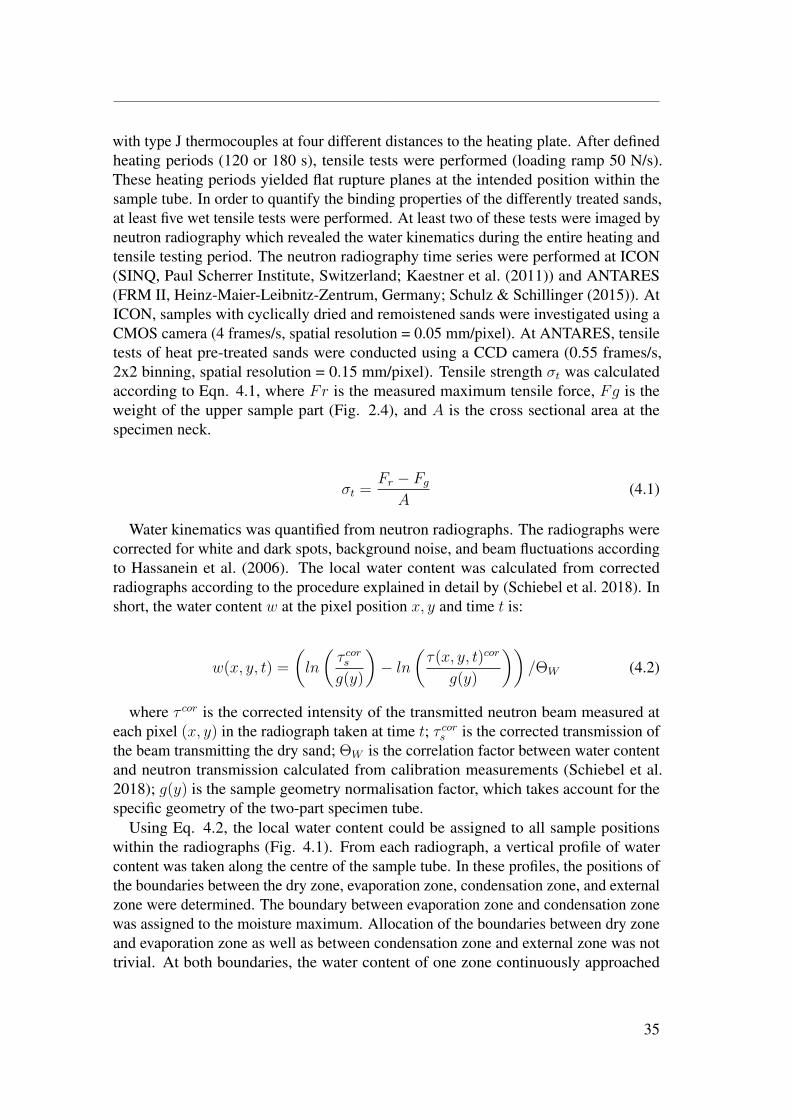
with type J thermocouples at four different distances to the heating plate. After definedheating periods (120 or 180 s), tensile tests were performed (loading ramp 50 N/s).These heating periods yielded flat rupture planes at the intended position within thesample tube. In order to quantify the binding properties of the differently treated sands,at least five wet tensile tests were performed. At least two of these tests were imaged byneutron radiography which revealed the water kinematics during the entire heating andtensile testing period. The neutron radiography time series were performed at ICON(SINQ, Paul Scherrer Institute, Switzerland; Kaestner et al. (2011)) and ANTARES(FRM II, Heinz-Maier-Leibnitz-Zentrum, Germany; Schulz & Schillinger (2015)). AtICON, samples with cyclically dried and remoistened sands were investigated using aCMOS camera (4 frames/s, spatial resolution = 0.05 mm/pixel). At ANTARES, tensiletests of heat pre-treated sands were conducted using a CCD camera (0.55 frames/s,2x2 binning, spatial resolution = 0.15 mm/pixel). Tensile strength σt was calculatedaccording to Eqn. 4.1, where Fr is the measured maximum tensile force, Fg is theweight of the upper sample part (Fig. 2.4), and A is the cross sectional area at thespecimen neck.
σt =Fr − Fg
A(4.1)
Water kinematics was quantified from neutron radiographs. The radiographs werecorrected for white and dark spots, background noise, and beam fluctuations accordingto Hassanein et al. (2006). The local water content was calculated from correctedradiographs according to the procedure explained in detail by (Schiebel et al. 2018). Inshort, the water content w at the pixel position x, y and time t is:
w(x, y, t) =
(ln
(τ cors
g(y)
)− ln
(τ(x, y, t)cor
g(y)
))/ΘW (4.2)
where τ cor is the corrected intensity of the transmitted neutron beam measured ateach pixel (x, y) in the radiograph taken at time t; τ cors is the corrected transmission ofthe beam transmitting the dry sand; ΘW is the correlation factor between water contentand neutron transmission calculated from calibration measurements (Schiebel et al.2018); g(y) is the sample geometry normalisation factor, which takes account for thespecific geometry of the two-part specimen tube.
Using Eq. 4.2, the local water content could be assigned to all sample positionswithin the radiographs (Fig. 4.1). From each radiograph, a vertical profile of watercontent was taken along the centre of the sample tube. In these profiles, the positions ofthe boundaries between the dry zone, evaporation zone, condensation zone, and externalzone were determined. The boundary between evaporation zone and condensation zonewas assigned to the moisture maximum. Allocation of the boundaries between dry zoneand evaporation zone as well as between condensation zone and external zone was nottrivial. At both boundaries, the water content of one zone continuously approached
35

4 Effects of heat and cyclic reuse on the properties of bentonite-bonded sand
1cm
1
2
3
4
5
6
0
wt.%
HO
2
sa
mp
le t
ub
e
pu
llin
g d
evic
e
up
pe
r sa
mp
letu
be
mouldingsand
dry zone
condensation zone
evaporation zone
external zone
he
atin
g p
late
firs
t im
ag
e a
fte
r co
nta
ct
with
th
e h
ea
tin
g p
late
b)
last
ima
ge
be
fore
ru
ptu
re
c)
firs
t im
ad
ge
aft
er
rup
ture
thermocouple
Fig. 4.1: Neutron radiographs of wet tensile testing of the reference sand. a) First radiographtaken after contact of the heater. The moisture of the sand is colour coded. b) Last radiographtaken before rupture. Dry zone, evaporation zone, condensation zone, and external zone arelabelled. c) First radiograph taken after rupture.
the water content of the neighbouring zone. The boundary between condensation zoneand external zone, therefore, was allocated to the position where the local moistureexceeded the initial water by more than 1%. The position of the boundary betweenthe dry zone and the evaporation zone was assigned to the location where the moisturecontent is less than 0.03 wt.% H2O.
Heat driven water kinematics within the sample tube could be characterized by thepropagation constants q of the zone boundaries. According to Kubo & Pehlke (1986),these propagation constants could be approximated by:
q =∆y√t
(4.3)
where ∆y are the positions of the respective zone boundaries in the radiographstaken at time t. The propagation constants presented here were computed by linearregressions of data in plots of ∆y versus
√t.
4.2.4 Neutron diffraction
At the neutron diffraction beam line MIRA (FRM II, Heinz-Maier-Leibnitz-Zentrum,Germany; Georgii & Seemann (2015), Georgii et al. (2018)), both heat pre-treated andcyclically reused sands were investigated at defined conditions in order to estimate theamount of water located within the smectite interlayers. Compared to X-ray, neutronsstrongly interact with water, leading to higher intensities of the smectite reflections inmoist condition. With decreasing water content, the intensities also decrease.
For the experiments, the moist sand (3 wt.% H2O) was filled into an aluminium vial(Ø 18 mm, height 50 mm) and compressed with 1 MPa. Immediately after compaction, alid was screwed on the vial. The lid had a hole (Ø 3 mm) for pressure release by ventingair and water vapour. Through the hole, a thermocouple (Ø 2 mm) was fed into the vial.The thermocouple tip was positioned in the centre of the sample. The semi-open vial
36

design closely matched the conditions within the moulding sand during casting, whereambient pressure was fairly maintained in the open pore system by transport of air andwater vapour away from the hot mould cavity towards the neighbouring colder areas.
The vial with the moist sand was heated with a furnace mounted on the instrumentthus allowing for in-situ neutron diffraction from room temperature to 135 ◦C in stepsof 5 or 10 K. At each step, the temperature was held for 40 or 60 min to evaluatethe swelling state of smectites. During both heating and holding, diffraction patternswere continuously taken at 5-35◦ 2Θ with a step width of 0.4◦ 2Θ and an exposuretime of 2 s. Before heating and at the end of each experiment, diffraction patternswere taken from 5◦ to 120◦ 2Θ. By the positions of the quartz peaks (determined bybasic Gaussian fitting after background subtraction), the wavelength (4.502 ± 0.009 Å)was continuously monitored. The quartz reflection data used for the calculation weretaken from Ogata et al. (1987) (d100 = 4.2277 Å, d101 = d011 = 3.3230 Å). From eachdiffraction pattern, the average d001 value of the smectite was calculated by fitting thepeak with a single Gaussian function after a background subtraction and an integrationof the previous and subsequent scan.
4.2.5 SEM
Scanning electron microscopy images were taken from sand flakes coated with a carbonlayer (≈ 10 nm). The sand flakes were made from moist sand (3 wt.% H2O) bycompression with 1 MPa and vacuum drying of the pressed flakes at room temperature.Images were taken with a Hitachi SU5000 microscope equipped with a field emissiongun. Semi-quantitative chemical analyses by energy-dispersive spectroscopy (EDX,AzTec, Oxford Instruments) were performed using an accelerating voltage of 20 kVand a working distance of 10 mm.
4.3 Results
4.3.1 Thermal analyses
Between room temperature and 200◦C, TG showed a weight loss of only 0.06 wt.%,which can be regarded as meaningless. From 200◦C to 670◦C, a continuous mass lossof 0.043 wt.% occurred (Fig. 4.2). At 500◦C, a significant change of the mass lossrate took place. At 725◦C, the mass loss rate decreased to almost zero. Therefore, theweight loss from 725-1000◦C was smaller than 0.05 wt.%.
DSC (Fig. 4.2) showed an endothermic peak beginning at 400◦C with a maximum at500◦C, correlating with the observed change in mass loss rate by TG. The peak at 500◦Coverlapped with a large endothermic peak at 576◦C. A third peak with a maximum at670◦C (ending at 720◦C) correlated with a strong mass loss in TG. Further extensivelyoverlapping endothermic peaks could be observed at temperatures above 800◦C.
37

4 Effects of heat and cyclic reuse on the properties of bentonite-bonded sand
200 400 600 800 1000Temperature (°C)
99.4
99.6
99.8
100
100.2
TG
(w
t.%)
0
0.02
0.04
0.06
0.08
DS
C (
V)
TGDSC
576°C
Fig. 4.2: DSC and TG curve (heatingrate 10 K/min) of a bentonite mouldingsand with a bentonite content of 8 wt.%.For the analysis, the reference sand wasused, which previously was subject toa single drying (120◦C), remoistening(3 wt.%), blending and ageing proce-dure. The α-quartz transformation startsat 573◦C and reaches maximum transfor-mation rate at 576◦C.
4.3.2 Wet tensile strength of heat pre-treated and cyclicallyreused sands
0 5 10 15 20 25Cycles
0
1
2
3
4
5
6
7
Wet
tens
ile s
tren
gth
(kN
/m2 )
Fig. 4.3: Wet tensile strengths of mould-ing sands subjected to various numbersof drying-remoistening cycles.
In the reference sand, rupture occurred at the boundary between evaporation andcondensation zone (Fig. 4.1c). This boundary coincided with the 100◦C isotherm(Schiebel et al. 2018). The experiments with cyclically reused sands showed that thecoincidence of the rupture position with this boundary was not significantly affected bythe number of cycles. Likewise, the tensile strengths of cyclically reused sands revealed
38

Fig. 4.4: Wet tensile strengths of mould-ing sands pre-treated at different temper-atures. Different degrees of smectite de-hydroxylation (Fig.4.2) are indicated bydifferent greyscales.
no significant dependence on the number of cycles (Fig. 4.3) and remained close to thevalue of 5.2 ± 0.5 kN/m2 which had been obtained for the reference sand.
The tensile strengths of heat pre-treated sands, however, were generally lower thanthe strength of the reference sand (Fig. 4.4). Sand pre-treated at 225◦C revealed atensile strength of 3.8 ± 0.4 kN/m2. Pre-treatment at 540◦C yielded a value of 3.1 ±0.4 kN/m2. For sands pre-treated at temperatures of 645◦C and higher, tensile strengthswere below detection limit. The sand in the dry zone of these samples just fell apart anddisintegrated into grains upon pulling the upper part of the sample tube. This behaviourwas different to all other sands examined here, which had significant tensile strengths inthe dry zone.
4.3.3 Dehydration behavior of the sand with differentpre-treatments
The drying rate increases continuously until it reaches a maximum. The maximum ofthe dehydration rate is for the reference sand between 115◦C and 105◦C for sandaspre-treated with 540◦C. The dehydration of the reference sand is completed at 130◦C.For sands pre-treated with 540◦C the dehydration is finished at approx. 120◦C.
The TG datas of the reference sand and the cyclic treated sand are identical (Fig. 4.5).Sands pre-treated with 225◦C show in the TG measurements a faster dehydration. TheTG curves and, therefore, the dehydration behaviour of sand treated with 330◦C and225◦C are identical. A temperature pre-treatment of 540◦C causes a further decrease ofthe dehydration temperature measured by TG.
39
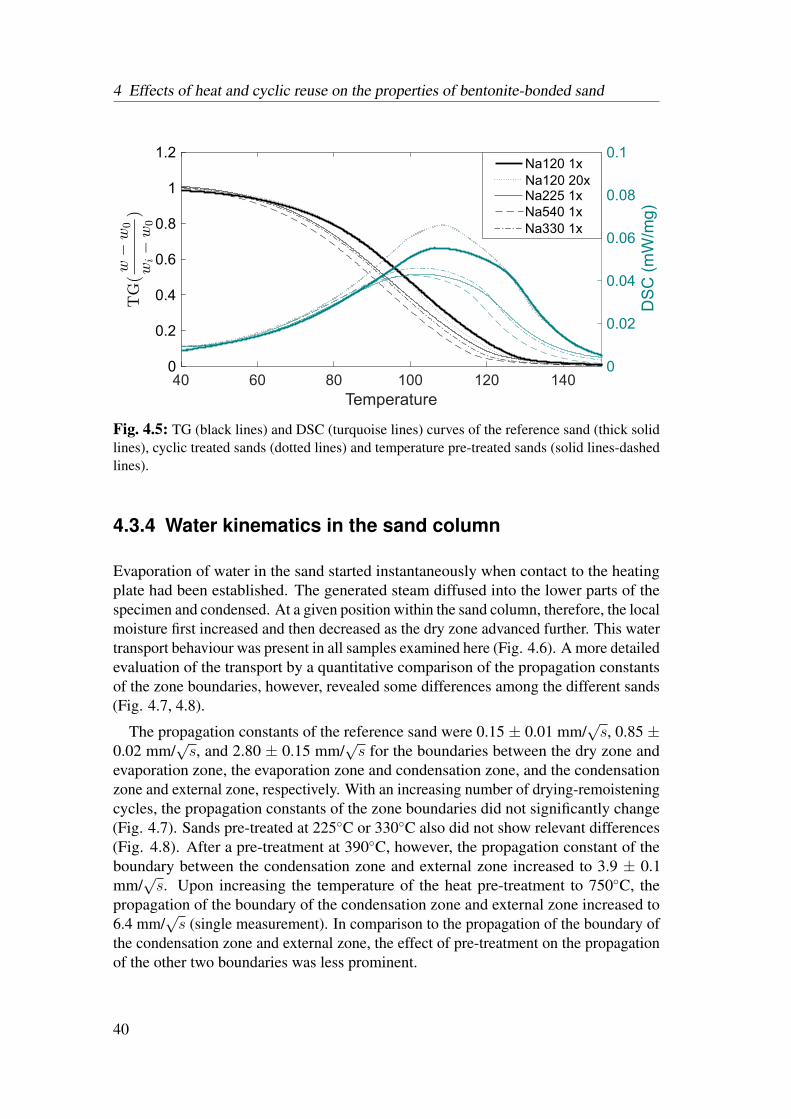
4 Effects of heat and cyclic reuse on the properties of bentonite-bonded sand
40 60 80 100 120 140
Temperature
0
0.2
0.4
0.6
0.8
1
1.2
0
0.02
0.04
0.06
0.08
0.1
DS
C (
mW
/mg)
Na225 1xNa120 20x
Na540 1x
Na330 1x
Na120 1x
Fig. 4.5: TG (black lines) and DSC (turquoise lines) curves of the reference sand (thick solidlines), cyclic treated sands (dotted lines) and temperature pre-treated sands (solid lines-dashedlines).
4.3.4 Water kinematics in the sand column
Evaporation of water in the sand started instantaneously when contact to the heatingplate had been established. The generated steam diffused into the lower parts of thespecimen and condensed. At a given position within the sand column, therefore, the localmoisture first increased and then decreased as the dry zone advanced further. This watertransport behaviour was present in all samples examined here (Fig. 4.6). A more detailedevaluation of the transport by a quantitative comparison of the propagation constantsof the zone boundaries, however, revealed some differences among the different sands(Fig. 4.7, 4.8).
The propagation constants of the reference sand were 0.15 ± 0.01 mm/√s, 0.85 ±
0.02 mm/√s, and 2.80 ± 0.15 mm/
√s for the boundaries between the dry zone and
evaporation zone, the evaporation zone and condensation zone, and the condensationzone and external zone, respectively. With an increasing number of drying-remoisteningcycles, the propagation constants of the zone boundaries did not significantly change(Fig. 4.7). Sands pre-treated at 225◦C or 330◦C also did not show relevant differences(Fig. 4.8). After a pre-treatment at 390◦C, however, the propagation constant of theboundary between the condensation zone and external zone increased to 3.9 ± 0.1mm/√s. Upon increasing the temperature of the heat pre-treatment to 750◦C, the
propagation of the boundary of the condensation zone and external zone increased to6.4 mm/
√s (single measurement). In comparison to the propagation of the boundary of
the condensation zone and external zone, the effect of pre-treatment on the propagationof the other two boundaries was less prominent.
40

Fig. 4.6: Heat-driven movement of the water within the centre of the sample tube (same colourcode as in Fig. 4.1) depicted by plotting a square root of time sequence of vertical profilesof neutron radiographs. a) Reference sand; b) Sand pre-treated at 330◦C; c) Sand pre-treatedat 645◦C. The red dots mark the measured boundaries between (from top to bottom) the dryzone, evaporation zone, condensation zone, and the external zone. The white lines are the linearregressions of the measured data points.
The maximum water contents measured at the boundary between evaporation zoneand condensation zone remained at 5 ± 0.5 wt.%, independent of cyclic reuse or of heatpre-treatment (Fig. 4.9) .
4.3.5 Water in smectite interlayers at temperatures up to130◦C
Reference sand
The 001-reflection of smectite was measured in all sands while applying a definedheating protocol. Before heating, the d001 value of the smectite in the reference samplewas 17.1 Å (Fig. 4.10a). With increasing temperature, the d value decreased reflectinga release of interlayer water. The water release rate, however, was not constant. Heatingto 100◦C and keeping the temperature for about one hour caused only a slight decreaseof the d001 value to 15.9 Å. Heating and keeping the sand at 110◦C for almost one hourled to an almost continuous decrease of the d value to 13.1 Å. Heating to 120◦C andkeeping the temperature for another hour caused a further decrease of the d value. Uponreaching 130◦C, the 001-refection disappeared in the background with a final d value ofapproximately 9.7 Å.
41
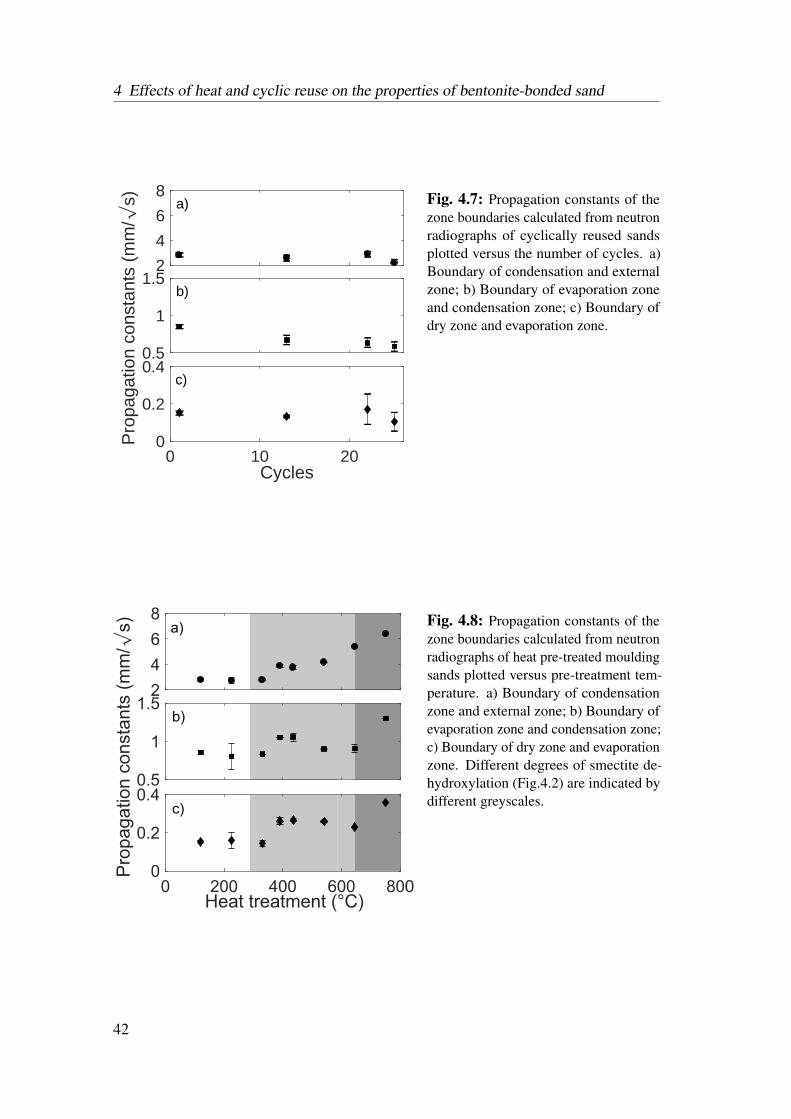
4 Effects of heat and cyclic reuse on the properties of bentonite-bonded sand
0 10 20Cycles
0
0.2
0.40.5
1
1.5
Pro
paga
tion
cons
tant
s (m
m/
s)
2
4
6
8a)
c)
b)
Fig. 4.7: Propagation constants of thezone boundaries calculated from neutronradiographs of cyclically reused sandsplotted versus the number of cycles. a)Boundary of condensation and externalzone; b) Boundary of evaporation zoneand condensation zone; c) Boundary ofdry zone and evaporation zone.
0
Fig. 4.8: Propagation constants of thezone boundaries calculated from neutronradiographs of heat pre-treated mouldingsands plotted versus pre-treatment tem-perature. a) Boundary of condensationzone and external zone; b) Boundary ofevaporation zone and condensation zone;c) Boundary of dry zone and evaporationzone. Different degrees of smectite de-hydroxylation (Fig.4.2) are indicated bydifferent greyscales.
42

Fig. 4.9: Maximum water content at theboundary between evaporation zone andcondensation zone for heat pre-treatedsands during wet tensile strength testing.Different degrees of weight loss duringheat pre-treatment as detected by thermalanalyses (Fig. 4.3) were indicated bydifferent greyscales.
Cyclically reused sands
The temperature dependence of d001 values of cyclically reused sands revealed somedifferences (Fig. 4.10b). During heating to 100◦C, the d001 value was approx. 19.6Å. Upon heating to 110◦C, the d value decreased to approx. 14.9 Å, stayed for someperiod, then decreased to approx. 13.7 Å. Even after heating to 120◦C, the d valueremained at approx. 13.7 Å for some time before it dropped and stayed at 12.5 Å. Uponheating to 130◦C, the 001-reflection disappeared in the background with a final d valueof approx. 10.5 Å. In summary, cyclically reused sands showed significantly higherinitial and final d value (19.6 and 10.5 Å).
Heat pre-treated sands
Sands pre-treated at T ≤ 435◦C (Fig. 4.10c) showed a very large initial d value ofapprox. 20 Å. The spacing then decreased to approx. 15.7 Å where it remained until thetemperature reached 115◦C. At 115◦C, the d value then dropped to 13 Å. Upon heatingto 120◦C, a further plateau was obtained at 12 Å. The reflection finally disappearedin the background with a d value of approx. 9.6 Å. In summary, a pre-treatment at T≤ 435◦C led to an initial d value, which was significantly higher than the one of thereference smectite. The final d value was similar to the one of the reference.
Amount of interlayer water
The d value of the smectites allowed a rough estimation of the amount of water, whichis present within the smectite interlayers. Taking the results of Teich-McGoldrick et al.(2015), a d001 value of 16 Å (18 Å) corresponded to approximately 5 (6.5) moleculesof water per O10(OH)2. Approximating the molar weight of the dry smectite with 370
43

4 Effects of heat and cyclic reuse on the properties of bentonite-bonded sand
Fig. 4.10: Neutron diffractometer anal-yses conducted during thermal dehydra-tion of the reference sand (a), cyclicallyreused sand (b), and sand pre-treated at435◦C (c). The d001 value of smectite(empty circles) and sample temperature(black line) are plotted versus time. Thered lines mark the 100◦C levels and illus-trate the periods of the sample tempera-ture exceeding 100◦C.
44
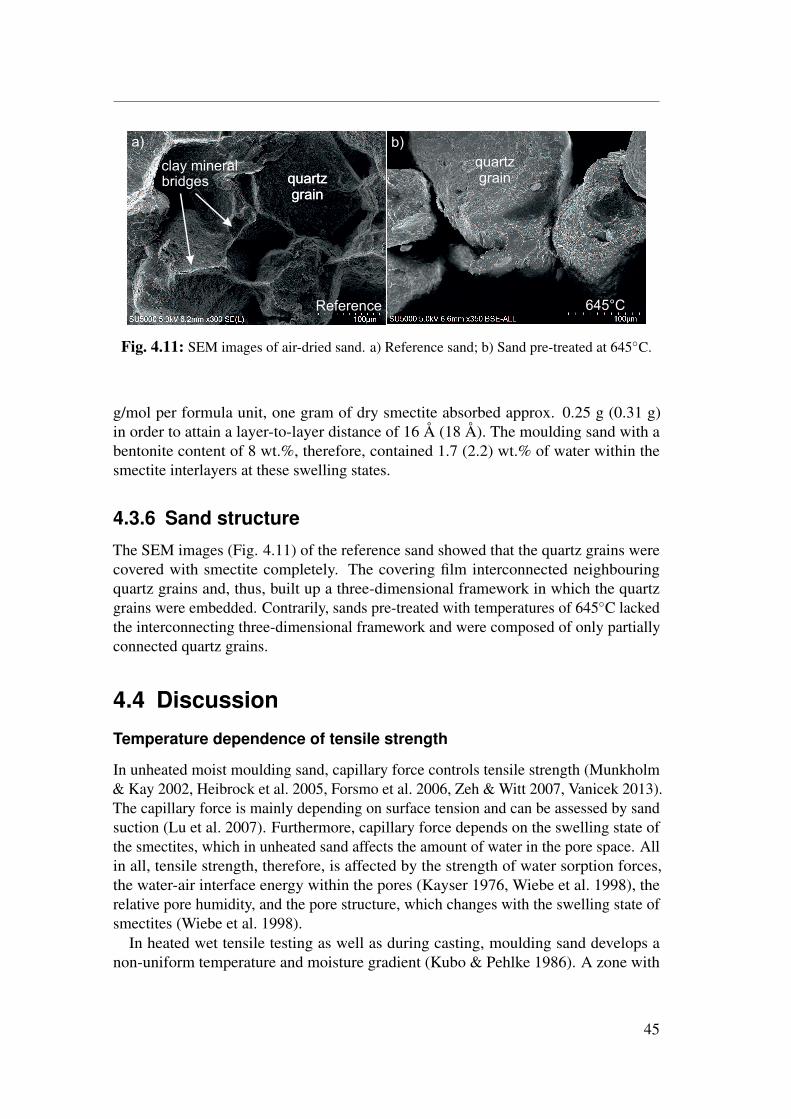
Fig. 4.11: SEM images of air-dried sand. a) Reference sand; b) Sand pre-treated at 645◦C.
g/mol per formula unit, one gram of dry smectite absorbed approx. 0.25 g (0.31 g)in order to attain a layer-to-layer distance of 16 Å (18 Å). The moulding sand with abentonite content of 8 wt.%, therefore, contained 1.7 (2.2) wt.% of water within thesmectite interlayers at these swelling states.
4.3.6 Sand structure
The SEM images (Fig. 4.11) of the reference sand showed that the quartz grains werecovered with smectite completely. The covering film interconnected neighbouringquartz grains and, thus, built up a three-dimensional framework in which the quartzgrains were embedded. Contrarily, sands pre-treated with temperatures of 645◦C lackedthe interconnecting three-dimensional framework and were composed of only partiallyconnected quartz grains.
4.4 Discussion
Temperature dependence of tensile strength
In unheated moist moulding sand, capillary force controls tensile strength (Munkholm& Kay 2002, Heibrock et al. 2005, Forsmo et al. 2006, Zeh & Witt 2007, Vanicek 2013).The capillary force is mainly depending on surface tension and can be assessed by sandsuction (Lu et al. 2007). Furthermore, capillary force depends on the swelling state ofthe smectites, which in unheated sand affects the amount of water in the pore space. Allin all, tensile strength, therefore, is affected by the strength of water sorption forces,the water-air interface energy within the pores (Kayser 1976, Wiebe et al. 1998), therelative pore humidity, and the pore structure, which changes with the swelling state ofsmectites (Wiebe et al. 1998).
In heated wet tensile testing as well as during casting, moulding sand develops anon-uniform temperature and moisture gradient (Kubo & Pehlke 1986). A zone with
45
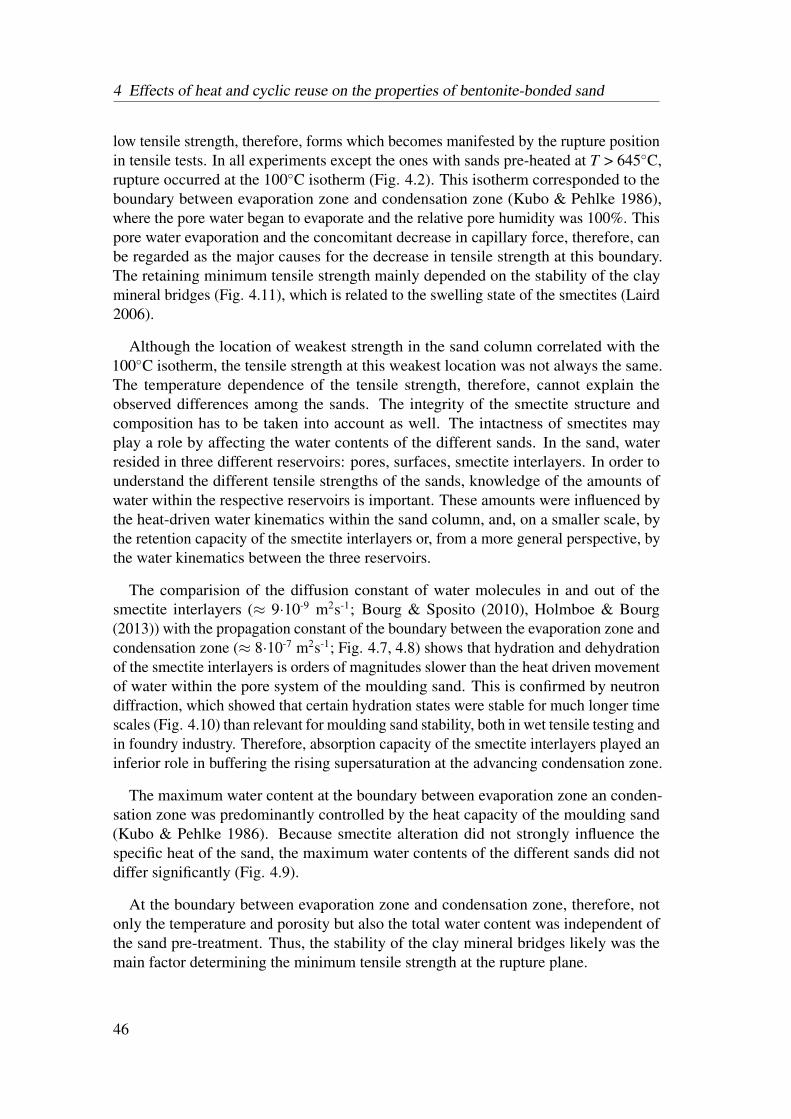
4 Effects of heat and cyclic reuse on the properties of bentonite-bonded sand
low tensile strength, therefore, forms which becomes manifested by the rupture positionin tensile tests. In all experiments except the ones with sands pre-heated at T > 645◦C,rupture occurred at the 100◦C isotherm (Fig. 4.2). This isotherm corresponded to theboundary between evaporation zone and condensation zone (Kubo & Pehlke 1986),where the pore water began to evaporate and the relative pore humidity was 100%. Thispore water evaporation and the concomitant decrease in capillary force, therefore, canbe regarded as the major causes for the decrease in tensile strength at this boundary.The retaining minimum tensile strength mainly depended on the stability of the claymineral bridges (Fig. 4.11), which is related to the swelling state of the smectites (Laird2006).
Although the location of weakest strength in the sand column correlated with the100◦C isotherm, the tensile strength at this weakest location was not always the same.The temperature dependence of the tensile strength, therefore, cannot explain theobserved differences among the sands. The integrity of the smectite structure andcomposition has to be taken into account as well. The intactness of smectites mayplay a role by affecting the water contents of the different sands. In the sand, waterresided in three different reservoirs: pores, surfaces, smectite interlayers. In order tounderstand the different tensile strengths of the sands, knowledge of the amounts ofwater within the respective reservoirs is important. These amounts were influenced bythe heat-driven water kinematics within the sand column, and, on a smaller scale, bythe retention capacity of the smectite interlayers or, from a more general perspective, bythe water kinematics between the three reservoirs.
The comparision of the diffusion constant of water molecules in and out of thesmectite interlayers (≈ 9·10-9 m2s-1; Bourg & Sposito (2010), Holmboe & Bourg(2013)) with the propagation constant of the boundary between the evaporation zone andcondensation zone (≈ 8·10-7 m2s-1; Fig. 4.7, 4.8) shows that hydration and dehydrationof the smectite interlayers is orders of magnitudes slower than the heat driven movementof water within the pore system of the moulding sand. This is confirmed by neutrondiffraction, which showed that certain hydration states were stable for much longer timescales (Fig. 4.10) than relevant for moulding sand stability, both in wet tensile testing andin foundry industry. Therefore, absorption capacity of the smectite interlayers played aninferior role in buffering the rising supersaturation at the advancing condensation zone.
The maximum water content at the boundary between evaporation zone an conden-sation zone was predominantly controlled by the heat capacity of the moulding sand(Kubo & Pehlke 1986). Because smectite alteration did not strongly influence thespecific heat of the sand, the maximum water contents of the different sands did notdiffer significantly (Fig. 4.9).
At the boundary between evaporation zone and condensation zone, therefore, notonly the temperature and porosity but also the total water content was independent ofthe sand pre-treatment. Thus, the stability of the clay mineral bridges likely was themain factor determining the minimum tensile strength at the rupture plane.
46

Effects of temperature and water kinematics on tensile strength
In unheated moist moulding sand, capillary force controls tensile strength (Munkholm& Kay 2002, Heibrock et al. 2005, Forsmo et al. 2006, Zeh & Witt 2007, Vanicek 2013).The capillary force is mainly depending on surface tension and can be assessed by sandsuction (Lu et al. 2007). Furthermore, capillary force depends on the swelling state ofthe smectites, which in unheated sand affects the amount of water in the pore space. Allin all, tensile strength, therefore, is affected by the strength of water sorption forces,the water-air interface energy within the pores (Kayser 1976, Wiebe et al. 1998), therelative pore humidity, and the pore structure, which changes with the swelling state ofsmectites (Wiebe et al. 1998).
In heated wet tensile testing as well as during casting, moulding sand develops anon-uniform temperature and moisture gradient (Kubo & Pehlke 1986). A zone withlow tensile strength, therefore, forms which becomes manifested by the rupture positionin tensile tests. In all experiments except the ones with sands pre-heated at T > 645◦C,rupture occurred at the 100◦C isotherm (Fig. 4.2). This isotherm corresponded to theboundary between evaporation zone and condensation zone (Kubo & Pehlke 1986),where the pore water began to evaporate and the relative pore humidity was 100%. Thispore water evaporation and the concomitant decrease in capillary force, therefore, canbe regarded as the major causes for the decrease in tensile strength at this boundary.The retaining minimum tensile strength mainly depended on the stability of the claymineral bridges (Fig. 4.11), which is related to the swelling state of the smectites (Laird2006).
Although the location of weakest strength in the sand column correlated with the100◦C isotherm, the tensile strength at this weakest location was not always the same.The temperature dependence of the tensile strength, therefore, cannot explain theobserved differences among the sands. The integrity of the smectite structure andcomposition has to be taken into account as well. The intactness of smectites mayplay a role by affecting the water contents of the different sands. In the sand, waterresided in three different reservoirs: pores, surfaces, smectite interlayers. In order tounderstand the different tensile strengths of the sands, knowledge of the amounts ofwater within the respective reservoirs is important. These amounts were influenced bythe heat-driven water kinematics within the sand column, and, on a smaller scale, bythe retention capacity of the smectite interlayers or, from a more general perspective, bythe water kinematics between the three reservoirs.
The comparision of the diffusion constant of water molecules in and out of thesmectite interlayers (≈ 9·10-9 m2s-1; Bourg & Sposito (2010), Holmboe & Bourg(2013)) with the propagation constant of the boundary between the evaporation zone andcondensation zone (≈ 8·10-7 m2s-1; Fig. 4.7, 4.8) shows that hydration and dehydrationof the smectite interlayers is orders of magnitudes slower than the heat driven movementof water within the pore system of the moulding sand. This is confirmed by neutrondiffraction, which showed that certain hydration states were stable for much longer timescales (Fig. 4.10) than relevant for moulding sand stability, both in wet tensile testing and
47

4 Effects of heat and cyclic reuse on the properties of bentonite-bonded sand
20x ref. 225°C 330°C 435°CSample
15
16
17
18
19
20
21
22
d(10
0) s
paci
ng (
Å)
at 1
00°C
Fig. 4.12: Median d001 value at 100◦Cof the reference sand and temperaturetreated sand.
in foundry industry. Therefore, absorption capacity of the smectite interlayers played aninferior role in buffering the rising supersaturation at the advancing condensation zone.
The maximum water content at the boundary between evaporation zone an conden-sation zone was predominantly controlled by the heat capacity of the moulding sand(Kubo & Pehlke 1986). Because smectite alteration did not strongly influence thespecific heat of the sand, the maximum water contents of the different sands did notdiffer significantly (Fig. 4.9).
At the boundary between evaporation zone and condensation zone, therefore, notonly the temperature and porosity but also the total water content was independent ofthe sand pre-treatment. Thus, the stability of the clay mineral bridges likely was themain factor determining the minimum tensile strength at the rupture plane.
Tensile strength of cyclically reused sands
Comparing the propagation constants and the tensile strengths of the reference sand andthe cyclically reused sands, no significant changes with an increasing number of dryingand remoistening cycle could be observed (Fig. 4.7).
The neutron diffraction data at 100◦C showed that the d001 value of smectites inthe reference sand as well as in the cyclically reused sands roughly corresponded tothree water layers (Zheng et al. 2010, Villar et al. 2012, Holmboe & Bourg 2013). Theamount of water within these smectite interlayer was approximately between 1.7 and2.2 wt.%. Thus, about the half of the total water at the boundary between evaporationzone and condensation zone (approx. 5 wt.% (Fig. 4.9)) was located within the smectiteinterlayers.
Note, the d values of the smectites in the cyclically reused sands were approx. 1.5 Ålarger than in the reference sand (Fig. 4.10). In agreement with Heuser et al. (2014),we suggest that these higher initial d values were likely caused by mechanical effects
48

originating from repeated mixing (Oscarson et al. 1990, Alonso-Santurde et al. 2012)rather than by steam (Couture 1985, Oscarson & Dixon 1989). If steam were the cause,smectite in the reference sand would show a high d value, too, because a single steamtreatment would likely be effective enough to expand the layers.
Tensile strength of sands pre-treated at T = 225-330◦C
The effect of heat pre-treatment was investigated by a separate suite of experiments.Neutron radiography experiments with sand pre-treated at temperatures up to 330◦Crevealed no significant alteration of the propagation constants (Fig. 4.8). However,neutron diffraction analyses during dehydration of these pre-treated sands showed (Fig.4.10) that the initial smectite d001 values at temperatures up to 100◦C were significantlylarger than in the reference sand. A mechanical cause for these increased initial d values(as in the case of cyclically reused sands) can be dismissed because the mechanicaltreatment was as long and strong as in the reference sand. Thus, the heat pre-treatmentat T = 225-330◦C has to be the reason for these increased d values. In agreementwith the results obtained by thermal analysis, the pre-treatment may only have led tominor changes of the smectite structure if any. In the case of small interlayer cationssuch as Li, Cu, Zn, migration into tetrahedral sheets (McBride & Mortland 1974) oroctahedral sites (Madejová et al. 1996) might be considered as an adequate structuralmodification. Larger cations (Na, Ca) migrate into these sites less likely (Calvet &Prost 1971). However, also for smectites with larger cations like Na+, K+, Ca2+ smallchanges in properties upon heating temperature were reported in literature (Chorom &Rengasamy 1996, Komadel et al. 2005). We propose that irreversible minor structuralchanges induced by the heat pre-treatment were apt to reduce the forces between thesmectites bridging two quartz grains (Laird 2006) and, therefore, were responsiblefor the decrease in wet tensile strength, which was obtained for sands pre-treated attemperatures of 225-330◦C.
Tensile strength of sands pre-treated at T > 330◦C
Pre-treatments of sands at T > 330◦C led to changes in water kinematics that weremore substantial. All three propagation constants were increased in sands pre-treated attemperatures between 390 and 540◦C (Fig. 4.8; range marked in pale greyscale). Theincrease of propagation constants correlated with the observed mass loss by TG and theendothermic DSC-peak reaching maximum at 500◦C (Fig. 4.3). These thermal analysisresults very likely reflect a loss of tightly bound water (Kuligiewicz & Derkowski 2017)or of an early loss of hydroxyl-groups (Emmerich et al. 1999), although for cis-vacantmontmorillonites dehydroxylation was found to take place not below 600◦C (Wolters &Emmerich 2007). Irrespective of the removal of tightly bound water or hydroxyl-groups,the changes of smectites by the heat pre-treatment were the likely cause of the observedtensile strength reduction.
It needs to be noted, however, that the smectites located at the rupture plane (i.e.,at 100◦C isotherm of the sample column) still contained three layers of water. This
49

4 Effects of heat and cyclic reuse on the properties of bentonite-bonded sand
high amount of interlayer water was likely facilitated by the high partial pressure ofwater in the pore space of the sand (c.f., Emmerich et al. 2015). This interlayer water isindicative of the existence of some layer charge and is a clear indication for only minoror moderate changes of the smectites at temperatures below 645◦C.
Pre-treatments at T ≥ 645◦C caused a strong increase of the propagation constantof the boundary between the condensation zone and external zone (Fig. 4.8; rangemarked in dark greyscale). Pre-treatments at 750◦C, led to significantly higher valuesof all propagation constants. The increased water transport rates and decreased tensilestrengths correlated with the observed DSC-peak at 670◦C (Fig. 4.3), which is typicallyfor a dehydroxylation of cis-vacant montmorillonite (Emmerich et al. 2009).
SEM of these samples showed quartz grains being located individually rather thaninterconnected by smectite coatings (Fig. 4.11b). The most prominent property change,however, was that sand pre-treated at T ≥ 645◦C did not harden in dry state but trans-formed into loose grains. The tensile strengths of these sands, therefore, decreased tozero in all areas where the water bridges between the grains were evaporated completely.Consequently, the position of the rupture plane of these sands shifted into the dry zone.
50

5 Comparison of moulding sandsbonded with sodium andcalcium bentonites
5.1 Introduction
In smectites, the charge of the tetrahedral and octahedral layer is compensated by theinterlayer cation. Depending on the kind of cation, the properties of montmorillonitestrongly differ. Rheological properties such as viscosity, gel strength, yield stress, andthixotropic behaviour are affected by the layer charge (Christidis et al. 2006) as wellas the cation exchange capacity and the ion exchange selectivity (Maes & Cremers1977). The swelling behaviour and, therefore, the water uptake and release from theinterlayer space of smectites are strongly affected by the charge of the exchangeablecations (MacEwan & Wilson 1980, Laird et al. 1995). Compared to montmorilloniteswithout Ca2+, montmorillonites containing Ca2+ have a considerable different swellingbehaviour (Zheng et al. 2010). Thereby, it is of particular importance whether Ca2+ isincorporated into the montmorillonite structure or not.
The differences in swelling behaviour and rheological properties of smectites arereflected in the heat and water transport within moulding sands and the mechanicalproperties of the sands. Both green as well as wet tensile strength differ stronglydepending on the chemical composition of the bentonite. In comparison to calciumbentonite bonded sand, sodium bentonite bonded sands have a significantly higher wettensile strength (Odom 1984, Patterson & Boenisch 1961a). Consequently, Na-bentoniteis the preferably used bonding agent in sand casting.
The study of the mechanical and transport properties of Ca-bentonite bonded quartzsands, however, can provide useful information about the interplay between the chemicalcomposition of the bentonites on the one hand and the moulding sand properties on theother hand. Furthermore, the investigation of the property change of Ca-bonded sandsby cyclic reuse or temperature pre-treatments provides also valuable insights into thebinding mechanism of the more significant Na-bonded sand.
51
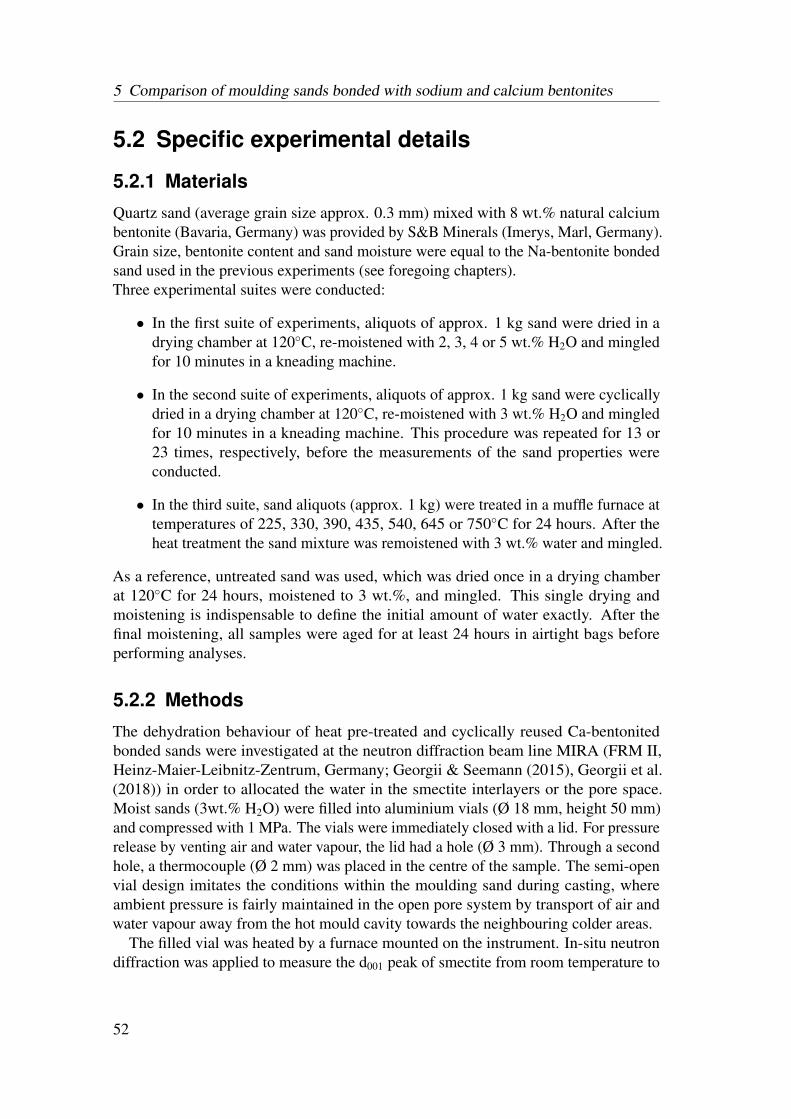
5 Comparison of moulding sands bonded with sodium and calcium bentonites
5.2 Specific experimental details
5.2.1 Materials
Quartz sand (average grain size approx. 0.3 mm) mixed with 8 wt.% natural calciumbentonite (Bavaria, Germany) was provided by S&B Minerals (Imerys, Marl, Germany).Grain size, bentonite content and sand moisture were equal to the Na-bentonite bondedsand used in the previous experiments (see foregoing chapters).Three experimental suites were conducted:
• In the first suite of experiments, aliquots of approx. 1 kg sand were dried in adrying chamber at 120◦C, re-moistened with 2, 3, 4 or 5 wt.% H2O and mingledfor 10 minutes in a kneading machine.
• In the second suite of experiments, aliquots of approx. 1 kg sand were cyclicallydried in a drying chamber at 120◦C, re-moistened with 3 wt.% H2O and mingledfor 10 minutes in a kneading machine. This procedure was repeated for 13 or23 times, respectively, before the measurements of the sand properties wereconducted.
• In the third suite, sand aliquots (approx. 1 kg) were treated in a muffle furnace attemperatures of 225, 330, 390, 435, 540, 645 or 750◦C for 24 hours. After theheat treatment the sand mixture was remoistened with 3 wt.% water and mingled.
As a reference, untreated sand was used, which was dried once in a drying chamberat 120◦C for 24 hours, moistened to 3 wt.%, and mingled. This single drying andmoistening is indispensable to define the initial amount of water exactly. After thefinal moistening, all samples were aged for at least 24 hours in airtight bags beforeperforming analyses.
5.2.2 Methods
The dehydration behaviour of heat pre-treated and cyclically reused Ca-bentonitedbonded sands were investigated at the neutron diffraction beam line MIRA (FRM II,Heinz-Maier-Leibnitz-Zentrum, Germany; Georgii & Seemann (2015), Georgii et al.(2018)) in order to allocated the water in the smectite interlayers or the pore space.Moist sands (3wt.% H2O) were filled into aluminium vials (Ø 18 mm, height 50 mm)and compressed with 1 MPa. The vials were immediately closed with a lid. For pressurerelease by venting air and water vapour, the lid had a hole (Ø 3 mm). Through a secondhole, a thermocouple (Ø 2 mm) was placed in the centre of the sample. The semi-openvial design imitates the conditions within the moulding sand during casting, whereambient pressure is fairly maintained in the open pore system by transport of air andwater vapour away from the hot mould cavity towards the neighbouring colder areas.
The filled vial was heated by a furnace mounted on the instrument. In-situ neutrondiffraction was applied to measure the d001 peak of smectite from room temperature to
52

0
0.005
0.01
0.015
0.02
Inte
nsity
110 1.05°C
12 14 16 18 20-1
0
1
2
310-3
0
0.005
0.01
0.015
0.02
0.025
Inte
nsity
105 1.31°C
10 12 14 16 18-1
0
1
2
310-3
5 10 15 20 25 30 35
2Theta [°]
0
0.005
0.01
0.015
0.02
Inte
nsity
115 0.06°C
16 18 20 22 24-1
0
1
210-3
Fig. 5.1: Diffraction patterns of the reference Ca-bentonite bonded moulding sand taken at105◦C, 110◦C and 115◦C. The background fit is indicated by a turquoise line. The fit of the d001peak of smectite is shown by a red line.
53

5 Comparison of moulding sands bonded with sodium and calcium bentonites
135◦C. After each distinct heating step, the temperature was held constant to evaluate theswelling state of smectites. During both heating and holding, diffraction patterns werecontinuously taken at 5-35◦ two theta with a step width of 0.4◦ two theta and an exposuretime of 2 s. Before heating and at the end of each experiment, diffraction patterns weretaken from 5◦ to 120◦ two theta. From the quartz peaks positions (determined by basicGaussian fitting after background subtraction), the wavelength (4.502 ± 0.009 Å) wascalculated. The quartz reflexion data used for the calculation were taken from Ogataet al. (1987)(d100 = 4.2277 Å, d101 = d011 = 3.3230 Å). From each diffraction patterntaken during heating, the average d001 value of the smectite was calculated by fittingthe diffraction peak with a single Gaussian function (5.1). Before fitting the peak, thebackground was fitted by an exponential function and subtracted from the diffractionpattern.
5.2.3 Tensile testing
For the determination of the mechanical properties of the calcium bentonite bondedsand both green and wet tensile testing were conducted. The sand specimens were filledinto a two-part aluminium square tube. The lower prismatic part has a height of 100mm and a cross section of 44 mm x 44 mm. The cross section of the upper pyramidalpart (height 20 mm) increased from 44 mm x 44 mm to 54 mm x 54 mm (Fig.2.1). Thetwo-part tube was filled from the bottom by turning the tube (Fig.2.1) upside down. Thesand was sieved into the turned tube and compressed with 1 MPa.
Before wet tensile testing was conducted, a temperature and moisture gradient wasinduced in the tensile specimens by heating them from above with a heating plate (T =310◦C). After a defined heating period (120 or 180 s), tensile load was applied (loadingramp 50 N/s) and the tearing force was measured. The tensile strength σt was calculatedby the quotient of tearing tension to the sectional area of the specimen neck accordingto Eqn.1.
5.2.4 Neutron radiography
Experiments were conducted at ICON (SINQ, Paul Scherrer Institute, Switzerland;Kaestner et al. (2011)) and ANTARES (FRM II, Heinz-Maier-Leibnitz-Zentrum, Ger-many; Schulz & Schillinger (2015)). The entire heating and tensile testing experimentswere imaged successively in order to follow the water kinematics and to determinelocation and moisture of the rupture plane within the sand column. At ICON, sampleswith cyclically dried and remoistened sands were investigated using a CMOS camera(4 frames/s, spatial resolution = 0.05 mm/pixel). At ANTARES, tensile tests of heatpre-treated sands and different initial moistures were conducted using a CCD camera(0.55 frames/s, 2x2 binning, spatial resolution = 0.15 mm/pixel).
The radiographs were corrected for white and dark spots, background noise, and beamfluctuation according to the work of Hassanein et al. (2006). Within each radiography,
54

the local water content was calculated for each pixel according to Schiebel et al. (2017)by:
w(x, y, t) =
(ln
(τ cors
g(y)
)− ln
(τ(x, y, t)cor
g(y)
))/ΘW (5.1)
where w(x, y, t) is the water content w at pixel position x, y and time t. τ cor is thecorrected intensity of the transmitted neutron beam; τ cors is the corrected transmission ofthe beam transmitting the dry sand; ΘW is the correlation factor between water contentand neutron transmission calculated from calibration measurements (Schiebel et al.2017); g(y) is the sample geometry normalisation factor, which takes account for thespecific geometry of the two-part specimen tube.
In each radiograph, the local amount of water was measured a long a vertical profilein the centre of the sample tube. In each profile, the boundary between evaporationand condensation zone was assigned to the moisture maximum. The boundary betweencondensation and external zone was assigned to the first position with a constantwater content following the maximum. The position of the boundary between dry andevaporation zone was assigned to the location of a water content of zero, which wasmost distant from the heating plate.
From the determined zone boundaries the propagation constants q of the zone bound-aries were calculated according to Equation 3.6.
5.3 Results and comparison to Na-bonded sands
5.3.1 Sands with different initial water contents
Rupture position
Independent of the water content and the bentonite composition, the location of rupturecan be pinpointed at the boundary between evaporation and condensation zone, wherethe temperature is exactly 100◦C.
Water kinematics
The dependence of the water kinematics on initial moisture content within Ca-bentonitebonded sands was largely similar compared to Na-bentonite bonded sands (Fig. 5.2).The propagation constant of the boundary between dry zone and evaporation zoneas well as the propagation constant of the boundary between evaporation zone andcondensation zone stayed almost unchanged with an increasing initial water content. Incontrast, the propagation of the boundary between condensation zone and external zoneincreased independent of the bentonite type. However, the degree of the increase of thepropagation constant differed. While for Ca-bentonite bonded sand the propagationconstant increased from approx. 1.9 mm/
√t at 2 wt.% water to 3.4 mm/
√t at 8 wt.%
55

5 Comparison of moulding sands bonded with sodium and calcium bentonites
0 2 4 6 8 10Initial water (wt.%)
0
2
4
6
8
Pro
paga
tion
cons
tant
s (m
m/√
t)
Dry/evaporationEvapotarion/condensationCondensation/external
Fig. 5.2: Propagation constants of zoneboundaries in moulding sands with dif-ferent initial moisture contents. Filleddots denote Na-bentonite bonded sands,empty dots Ca-bentonite bonded sands.
water, the propagation constant of the sand containing Na-bentonite increased muchfaster from 2.7 mm/
√t at 2 wt.% water to 4.5029 mm/
√t at 5 wt.% water.
The maximum water content increased from 4.4 wt% (initial water 2 wt.%) to 11wt.% (initial water 8 wt.%) (Fig. 5.3) in Ca-bentonite bonded sands. The linear increasein maximum water content was similar to the behaviour of Na-bentonite bonded sand.
5.3.2 Cyclically reused sands
Tensile strength
The wet tensile strengths of the reference Ca-bentonite bonded sand as well as ofcyclic reused Ca-bentonite bonded sand were approximately 4.5 kN/m2 and, therefore,1 kN/m2 lower than of Na-bonded sands of the same bentonite content and moisture(Fig.5.4). Like in the Na-bentonite bonded sand no substantial changes in the wet tensilestrength could be observed with an increasing number of drying-remoistening cycles.The wet tensile strength stayed constant at around 4.5 kN/m2.
Water kinematics
With an increased number of drying and remoistening cycles, no significant changesin the water kinematics could be observed. Both, the movement of the zone bound-aries 5.5 (0.1 mm/
√s boundary dry/evaporation zone; 0.75 mm/
√s boundary evap-
oration/condensation zone; 3 mm/√
s boundary condensation/external zone) and themaximum water content in the condensation zone (Fig. 5.6) stayed unchanged with anincreasing number of drying and remoistening cycles. Thereby, the behaviour of thepropagation constants and the maximum water contents of Ca-bentonite bonded sandand Na-bentonite bonded sand was identical.
56
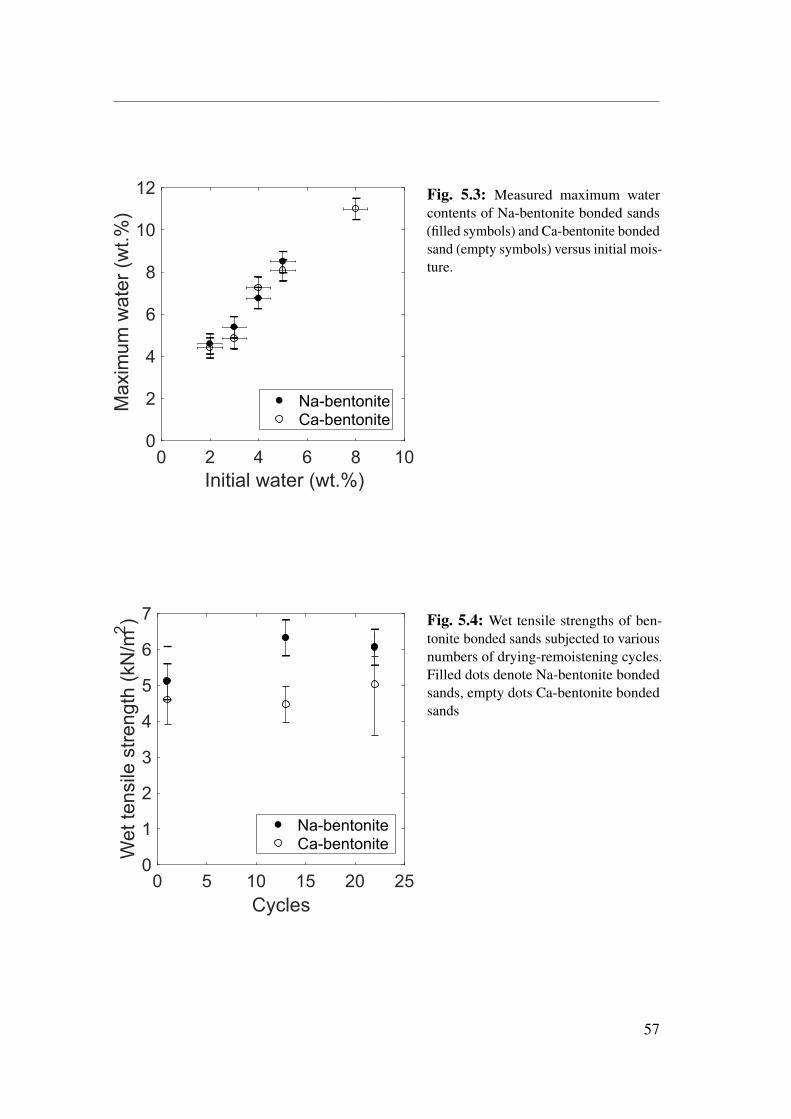
0 2 4 6 8 10
Initial water (wt.%)
0
2
4
6
8
10
12
Ma
xim
um
wa
ter
(wt.
%)
Na-bentoniteCa-bentonite
Fig. 5.3: Measured maximum watercontents of Na-bentonite bonded sands(filled symbols) and Ca-bentonite bondedsand (empty symbols) versus initial mois-ture.
Fig. 5.4: Wet tensile strengths of ben-tonite bonded sands subjected to variousnumbers of drying-remoistening cycles.Filled dots denote Na-bentonite bondedsands, empty dots Ca-bentonite bondedsands
57

5 Comparison of moulding sands bonded with sodium and calcium bentonites
0 10 20Cycles
0
0.2
0.40.5
1
1.5
Pro
paga
tion
cons
tant
s (m
m/
s)
2
4
6
8 Fig. 5.5: Propagation constants of thezone boundaries calculated from neutronradiographs of cyclically reused sandsplotted versus the number of cycles. a)Boundary of condensation zone and ex-ternal zone; b) Boundary of evaporationzone and condensation zone; c) Bound-ary of dry zone and evaporation zone.Filled dots denote Na-bentonite bondedsands, empty dots Ca-bentonite bondedsands.
0 10 20
Cycles
0
2
4
6
8
Maxim
um
wate
r (w
t.%
) Fig. 5.6: Maximum water content ver-sus number of drying-moistening cyclesof Ca-bentonite bonded sands.
58

Fig. 5.7: Initial (squares) and maxi-mum (dots) neutron transmission of Ca-bentonite bonded sand (empty symbols)and Na-bentonite bonded sand (filledsymbols) depending on the temperatureof the pre-treatment. The maximumtransmission corresponds to the transmis-sion of the dry sand next to the heatingplate in the uppermost region of the sandcolumn.
5.3.3 Heat pre-treated sands
Dehydroxylation
In the radiographs, the maximum neutron transmission corresponds to the transmissionof the dehydrated sand in the upper part of the sand column next to the heating plate.The maximum transmission as well as the initial transmission increase with the releaseof any hydrogen by the smectites. Therefore, the initial and maximal transmissionallow assumptions about the dehydroxylation state of the smectites of the heat pre-treated sands. The initial and the maximum transmission stayed unchanged up to apre-treatment temperature of 435◦C (Fig. 5.7). However, from 435◦C to 750◦C both,an increase of the initial as well as of the maximum neutron transmission could beobserved, indicating a loss of OH-groups by the smectites. While for Ca-bonded sands,an increase of the initial and maximal transmission could be observed beginning at435◦C, the first increase in Na-bentonite bonded sands could be detected at 540◦Cportending on a release of the OH-groups at higher temperature.
Sand structure
In the SEM images of the reference Ca-bentonite bonded sand, it can be seen clearly thatthe quartz grains are completely covered with smectite. The covering film interconnectsneighbouring quartz grains, which build a three-dimensional framework embeddingthe quartz grains. Compared to the Na-smectites of the moulding sand investigated inchapter 4, the Ca-smectites are bigger in size and adhere on the quartz grains worse.The framework formed by the Ca-smectites looks more fragmentary than the frameworkformed by Na-smectites (Fig. 5.8). Ca-bentonite bonded sands pre-treated with atemperature of 540◦C still have a three dimensional smectite framework but the quartz
59

5 Comparison of moulding sands bonded with sodium and calcium bentonites
a) Ca-bentonite bonded, reference
c) Na-bentonite bonded, reference
b) Ca-bentonite bonded, 540°C
d) Na-bentonite bonded, 640°C
Fig. 5.8: SEM images of air-dried sand. a) Reference Ca-bentonite bonded sand; b) Ca-bentonite bonded sand pre-treated at 645◦C. c) Reference Na-bentonite bonded sand; d) Na-bentonite bonded sand pre-treated at 645◦C.
60
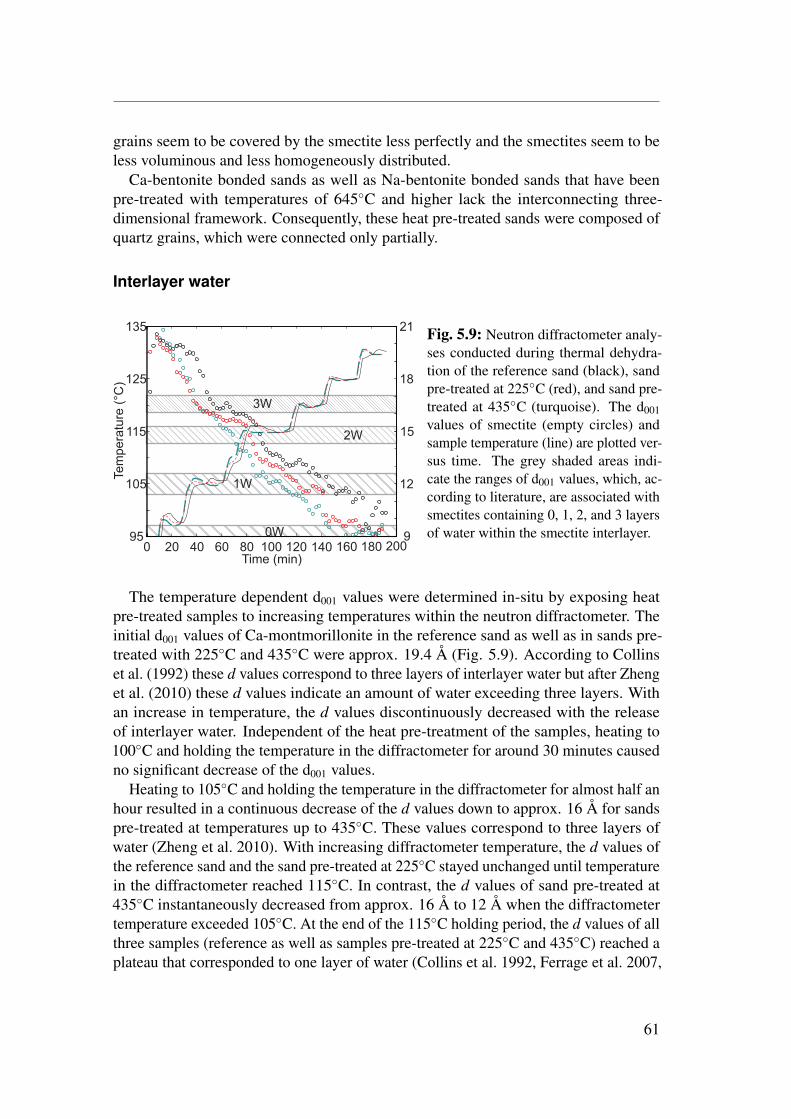
grains seem to be covered by the smectite less perfectly and the smectites seem to beless voluminous and less homogeneously distributed.
Ca-bentonite bonded sands as well as Na-bentonite bonded sands that have beenpre-treated with temperatures of 645◦C and higher lack the interconnecting three-dimensional framework. Consequently, these heat pre-treated sands were composed ofquartz grains, which were connected only partially.
Interlayer water
1W
2W
0W
3W
Te
mp
era
ture
(°C
)
105
115
125
135
12
15
18
21
Time (min)0 20 40 60 80 100 120 140 160 180 200
95 9
Fig. 5.9: Neutron diffractometer analy-ses conducted during thermal dehydra-tion of the reference sand (black), sandpre-treated at 225◦C (red), and sand pre-treated at 435◦C (turquoise). The d001values of smectite (empty circles) andsample temperature (line) are plotted ver-sus time. The grey shaded areas indi-cate the ranges of d001 values, which, ac-cording to literature, are associated withsmectites containing 0, 1, 2, and 3 layersof water within the smectite interlayer.
The temperature dependent d001 values were determined in-situ by exposing heatpre-treated samples to increasing temperatures within the neutron diffractometer. Theinitial d001 values of Ca-montmorillonite in the reference sand as well as in sands pre-treated with 225◦C and 435◦C were approx. 19.4 Å (Fig. 5.9). According to Collinset al. (1992) these d values correspond to three layers of interlayer water but after Zhenget al. (2010) these d values indicate an amount of water exceeding three layers. Withan increase in temperature, the d values discontinuously decreased with the releaseof interlayer water. Independent of the heat pre-treatment of the samples, heating to100◦C and holding the temperature in the diffractometer for around 30 minutes causedno significant decrease of the d001 values.
Heating to 105◦C and holding the temperature in the diffractometer for almost half anhour resulted in a continuous decrease of the d values down to approx. 16 Å for sandspre-treated at temperatures up to 435◦C. These values correspond to three layers ofwater (Zheng et al. 2010). With increasing diffractometer temperature, the d values ofthe reference sand and the sand pre-treated at 225◦C stayed unchanged until temperaturein the diffractometer reached 115◦C. In contrast, the d values of sand pre-treated at435◦C instantaneously decreased from approx. 16 Å to 12 Å when the diffractometertemperature exceeded 105◦C. At the end of the 115◦C holding period, the d values of allthree samples (reference as well as samples pre-treated at 225◦C and 435◦C) reached aplateau that corresponded to one layer of water (Collins et al. 1992, Ferrage et al. 2007,
61

5 Comparison of moulding sands bonded with sodium and calcium bentonites
1W
2W
0W
3W
b) 435°C
Time (min)
d-v
alu
e (
Å)
0 20 40 60 80 100 120 140 160 180 2009
12
15
18
21
1W
2W
3W
a) Reference
0W
Time (min)20 40 60 80 100 120 140 160 180 200
Tem
pe
ratu
re (
°C)
105
115
125
135
0
Fig. 5.10: Neutron diffractometer analyses conducted during thermal dehydration of thereference sand (a) and sand pre-treated at 435◦C (b). The d001 values of smectite (filledcircles for Na-bentonite bonded sand, empty circles for Ca-bentonite bonded sand) and sampletemperature (solid lines Na-bentonite bonded sand, dashed lines for Ca-bentonite bonded sand)are plotted versus time. The red lines mark the 100◦C levels and illustrate the periods of thesample temperature exceeding 100◦C. The grey areas indicate the ranges of d001 values, which,according to literature, are associated with smectites containing 0, 1, 2, and 3 layers of water(from bright to dark greyscales) within the smectite interlayer for Na-bentonite bonded sand.The grey shaded areas indicate the ranges of d001 values, which, according to literature, areassociated with smectites containing 0, 1, 2, and 3 layers of water (from slightly to heavilyshaded) within the smectite interlayer for Na-bentonite bonded sand.
Zheng et al. 2010).For higher pre-treatment temperatures, the d values measured underthe same conditions were significantly smaller.
Finally, heating the sand specimens within the diffractometer to 130◦C, the 001-reflections disappeared in the background with final d values of approximately 10 Åfor the reference sand and 9.5 Å for the pre-treated sands, indicating the completedehydration of the smectites (Collins et al. 1992, Ferrage et al. 2007, Zheng et al. 2010).
Compared to not pre-treated Na-bentonite bonded sands, the initial d values of allCa-bentonite bonded sands were bigger (Fig. 5.10 a). At diffractometer temperatures of100◦C, the different d values were still evident. Heating the samples in the diffractometerup to 105◦C, different d values between Na- and Ca-bonded could not be detected anylonger. If a heat pre-treatment was performed, the behaviour of the d values withincreasing temperature was quite similar for both Ca- and Na-bentonite bonded sands(Fig. 5.10 b), and even the initial d values were of the same magnitude.
Tensile strength
For sand heat pre-treated at 330◦C, the wet tensile strength decreased from of 4.7 kN/m2
to 2.4±0.4 kN/m2. The wet tensile strength stayed unchanged at 2.8±0.4 kN/m2 withan increasing pre-treatment temperature up to 435◦C. Pre-treating the sand at 540◦C, a
62
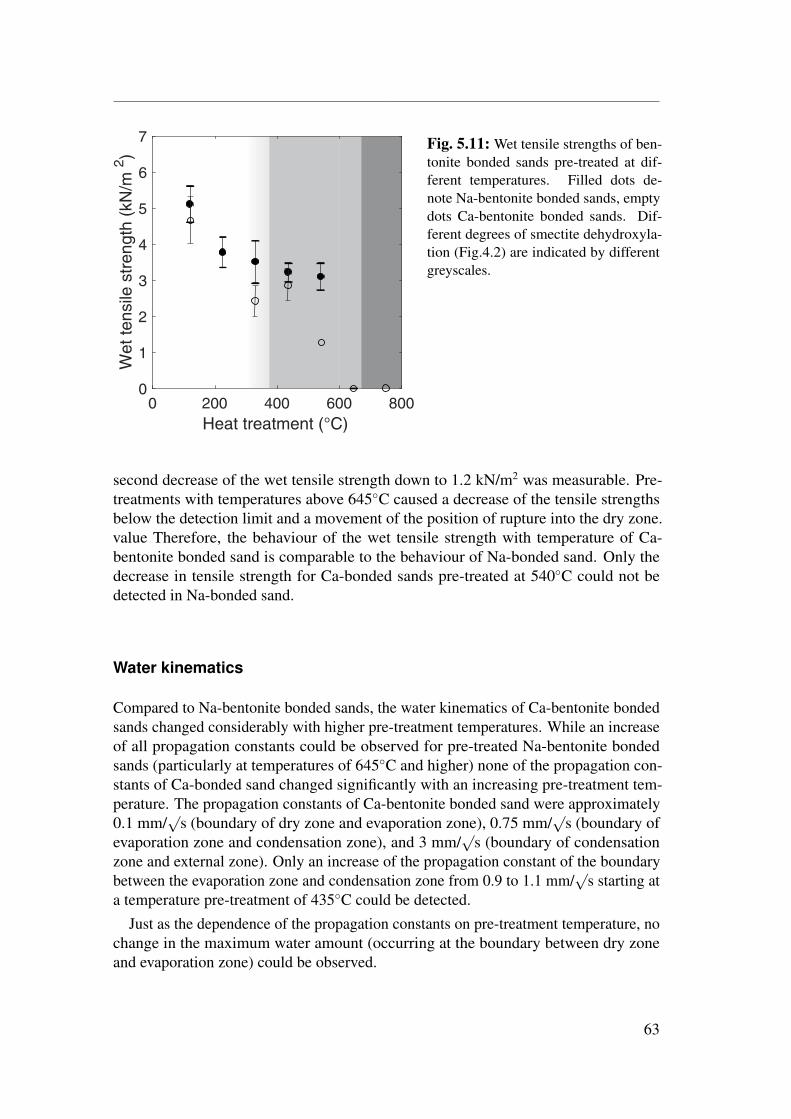
Fig. 5.11: Wet tensile strengths of ben-tonite bonded sands pre-treated at dif-ferent temperatures. Filled dots de-note Na-bentonite bonded sands, emptydots Ca-bentonite bonded sands. Dif-ferent degrees of smectite dehydroxyla-tion (Fig.4.2) are indicated by differentgreyscales.
second decrease of the wet tensile strength down to 1.2 kN/m2 was measurable. Pre-treatments with temperatures above 645◦C caused a decrease of the tensile strengthsbelow the detection limit and a movement of the position of rupture into the dry zone.value Therefore, the behaviour of the wet tensile strength with temperature of Ca-bentonite bonded sand is comparable to the behaviour of Na-bonded sand. Only thedecrease in tensile strength for Ca-bonded sands pre-treated at 540◦C could not bedetected in Na-bonded sand.
Water kinematics
Compared to Na-bentonite bonded sands, the water kinematics of Ca-bentonite bondedsands changed considerably with higher pre-treatment temperatures. While an increaseof all propagation constants could be observed for pre-treated Na-bentonite bondedsands (particularly at temperatures of 645◦C and higher) none of the propagation con-stants of Ca-bonded sand changed significantly with an increasing pre-treatment tem-perature. The propagation constants of Ca-bentonite bonded sand were approximately0.1 mm/
√s (boundary of dry zone and evaporation zone), 0.75 mm/
√s (boundary of
evaporation zone and condensation zone), and 3 mm/√
s (boundary of condensationzone and external zone). Only an increase of the propagation constant of the boundarybetween the evaporation zone and condensation zone from 0.9 to 1.1 mm/
√s starting at
a temperature pre-treatment of 435◦C could be detected.Just as the dependence of the propagation constants on pre-treatment temperature, no
change in the maximum water amount (occurring at the boundary between dry zoneand evaporation zone) could be observed.
63
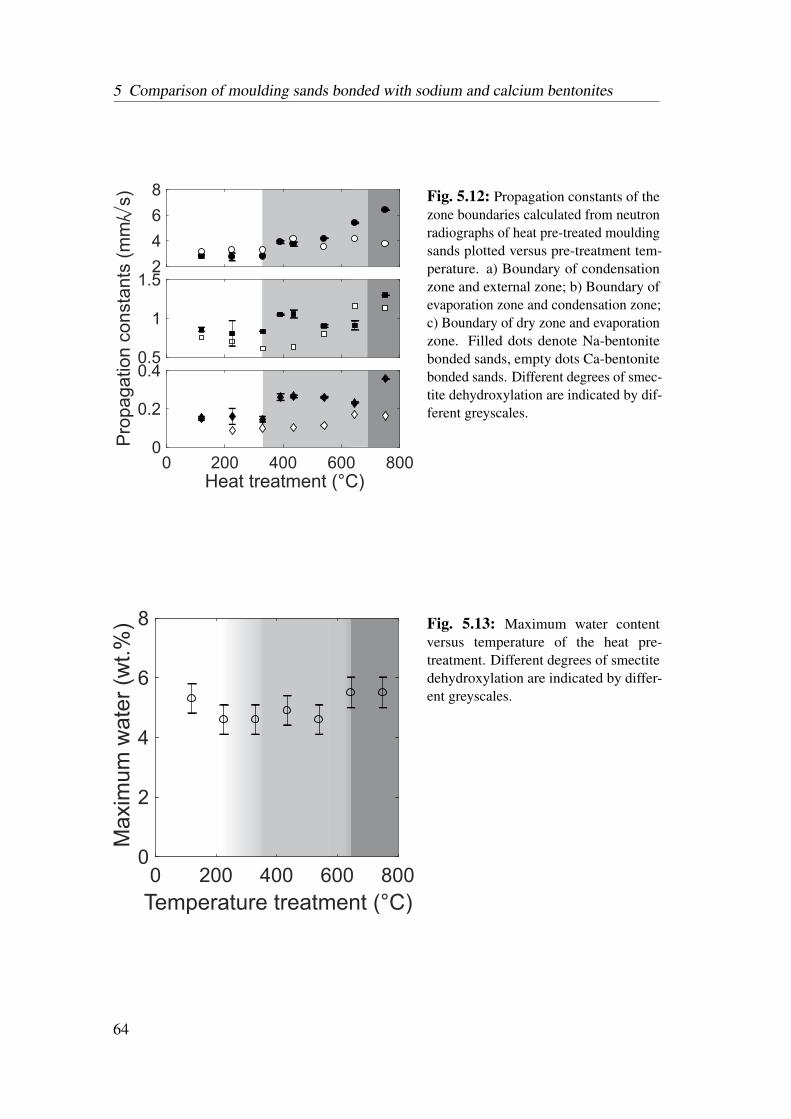
5 Comparison of moulding sands bonded with sodium and calcium bentonites
0 200 400 600 800Heat treatment (°C)
0
0.2
0.40.5
1
1.5
Pro
pa
gation c
onsta
nts
(m
m/
s)
2
4
6
8 Fig. 5.12: Propagation constants of thezone boundaries calculated from neutronradiographs of heat pre-treated mouldingsands plotted versus pre-treatment tem-perature. a) Boundary of condensationzone and external zone; b) Boundary ofevaporation zone and condensation zone;c) Boundary of dry zone and evaporationzone. Filled dots denote Na-bentonitebonded sands, empty dots Ca-bentonitebonded sands. Different degrees of smec-tite dehydroxylation are indicated by dif-ferent greyscales.
0 200 400 600 800
Temperature treatment (°C)
0
2
4
6
8
Maxim
um
wate
r (w
t.%
) Fig. 5.13: Maximum water contentversus temperature of the heat pre-treatment. Different degrees of smectitedehydroxylation are indicated by differ-ent greyscales.
64

5.4 Discussion
5.4.1 Sands with different initial water contents
At the boundary between the evaporation zone and condensation zone, the water contentreaches a maximum (wmax). This maximum water content is predominantly controlledby the heat capacity of the moulding sand (Kubo & Pehlke 1986, Patterson & Boenisch1961a).
wmax = w0 + (w0Cw + (1− w0)Cs)373− T0
LW
(5.2)
where w0 is the initial water, CW the specific heat of water (approx. 4.2 kJ/(kg K)),Cs the specific heat of moulding sand, T0 the initial temperature, and LW the latentevaporation heat (kJ/kg). Since the changes in the bentonite composition did barelyinfluence the specific heat of the sand, the maximum water contents of (not pre-treatedand not reused) Ca-bentonite bonded and Na-bentonite bonded sands do not differ fromeach other significantly.
However, the heat capacity of the moulding sand increases with increasing initialmoisture and causes an increase of the heat flux (Fan & Wen 2002). This relation canbe regarded as the reason for the increased movement of the condensation zone front(Popielarski & Ignaszak 2016).
5.4.2 Cyclically reused sands
Neither significant changes of the propagation constants (Fig. 5.5) nor changes intensile strength (Fig. 5.6) could be observed with an increasing number of drying andremoistening cycles. This observation for Ca-bentonite corresponds well to the resultsof Na-bentonite bonded sand. A strong impact of steam on the montmorillonite structureand on its swelling behaviour such as postulated by Couture (1985) and Oscarson &Dixon (1989), therefore, could not be confirmed by this experiments.
5.4.3 Heat pre-treated sands
Differences in the interlayer water
At a temperature of 100◦C within the diffractometer the d001 values of the smectites ofthe reverence sand and of sands pre-treated with 225◦C or 435◦C were of the same size.This indicates that the d001 value and, consequently, the swelling capacity are not themain factors being responsible for the decrease in tensile strength, which was observedfor the pre-treated sands.
In contrast to the initial swelling state, sands heat pre-treated at temperatures of up to225◦C revealed a significantly increased rate of water release (Fig. 5.9). This increasedwater release rate may be caused by a decrease of the layer charge (Juhász 1989). Sucha reduction in layer charge has been suggested to be caused by an irreversible migration
65
5 Comparison of moulding sands bonded with sodium and calcium bentonites
of small interlayer cations (such as Li, Cu, Zn) into the tetrahedral layers (McBride &Mortland 1974) or the octahedral sites (Madejová et al. 1996). Although larger cations(Na, Ca) are less likely migrating into these sites (Calvet & Prost 1971), a minor amountof migration maybe sufficient for the changes of water release rates as observed here.The increased rate of water release of sands heat pre-treated at temperatures of 435◦C(Fig. 5.9) is likely a consequence of dehydroxylation, which has been reported to takeplace ar temperatures of approx. 300-750◦C (Földvári 2013).
The comparison of heat pre-treated Ca-bentonite and Na-bentonite bonded sands at435◦C revealed a slightly faster dehydration for the Ca-bentonite bonded sands above105◦C (Fig. 5.10b). This slightly faster release rate may reflect a slightly differentdiffusivity of water molecules within the smectite interlayers above 105 ◦C (c.f. Zabat& Van Damme 2000).
Water kinematics
The fact that the water kinematics of Ca-bentonite bonded sands did not change withincreasing pre-treatment temperatures is remarkable. The neutron diffraction datashowed that the water release of the smectites changed with higher pre-treatmenttemperatures. However, the increased release rate was not reflected by a change ofthe propagation constants. The boundary movement neither between the dry zone andevaporation zone nor between the evaporation zone and condensation zone changed.In addition, no major changes in the propagation constant of the boundary betweencondensation zone and external zone could be observed. Thus, the steam absorptionand adsorption rates seemed to remain unchanged. A reason for this might be the higherspecific surface area of the altered Ca-smectites as observed in the SEM analyses (Fig.5.8. This larger specific surface area may provide more adsorption sites compared toNa-smectites. This higher site-density may allow the steam to condensate on the pre-treated Ca-smectite surfaces more rapidly than on the respective Na-smectites surfaces.It has to be noted, however, that the heat pre-treatment exerted no influence on theamount of maximum water at the boundary between evaporation and condensation zone.This is not remarkable, as the smectite alteration caused by the heat pre-treatment hasno strong influence on the specific heat of the entire moulding sand.
Differences in tensile strength
Even if the general behaviour of the tensile strength on increasing pre-treatment temper-atures was similar for both Na- and Ca-bentonite bonded sands, the strong decrease oftensile strength at 540◦C in Ca-bentonite bonded sand stands out. This decrease corre-sponds well with the observed increase in initial neutron transmission of Ca-bentonitebonded sand at 540◦C (Fig. 5.7), caused by a loss of hydrogen of the smectites whichcannot be observed in Na-bentonite bonded sands. The observed loss of hydrogen isconcomitant to a decreased layer charge of the smectites, which leads to a decrease ofthe water sorption energy (Juhász 1989) and, consequently, to a decrease of the wettensile strength. Because dehydroxylation of Ca-smectites, differently to Na-smectites,
66
is a pronounced two-step reaction (Földvári 2013), wet tensile strength of Ca-bentonitebonded sand decreased in a stepwise manner (Fig. 5.11), too.
5.4.4 Higher tensile strength of Na-bentonite bonded sands
In general, the wet tensile strength of Ca-bentonite bonded sand is lower than ofNa-bentonite bonded sand (Fig. 5.11), (Patterson & Boenisch 1961a). Patterson &Boenisch (1961a) and Odom (1984) mentioned that the reason for this different tensilestrength lies in the different arrangement of water. In Na-rich montmorillonites, water isarranged in a more ordered and rigid way than in in Ca-rich montmorillonites. However,the higher order of water molecules in Na-montmorillonites could not be confirmedby (Sposito & Prost 1982). Furthermore, the observation of Pons et al. (1980) that thestructure of water within Na-montmorillonite and Ca-montmorillonite is predominantlyliquid-like contradicts the postulations of Odom (1984) and Patterson & Boenisch(1961a).
At the temperature of the rupture plane (100◦C) in tensile strength testing, both Ca-and Na-bentonite bonded sands did show similar smectite d-001 values and, therefore,similar water release behaviour of the smectites. The observed differences in wet tensilestrength (Fig. 5.11), thus, cannot be related to different dehydration behaviour of thesedifferent smectites. The maximum water content at the boundary between evaporationand condensation zone remained unchanged with both pre-treatment temperature (Fig.5.13) and bentonite composition (Fig. 5.3). Therefore, changes in the capillary strengthdue to major changes in the saturation can also be excluded as causes for the differenttensile strengths.
Anyhow, the diffusion of water molecules in and out of the smectite interlayers(≈9·10-9 m2s-1 Bourg & Sposito (eg 2010), Holmboe & Bourg (eg 2013)) is orders ofmagnitudes smaller than the propagation of the boundary of the evaporation zone andcondensation zone (≈8·10-7 m2s-1; Fig. 5.5). Therefore, absorption capacity of thesmectite plays an inferior role in buffering the rising supersaturation at the boundarybetween evaporation and condensation zone.
Besides hydration of interlayer cations, water can adsorb on the external surfacesof the smectites and can condense in moulding sand micropores. Prost (1975) showedthat the fraction of smectite surface covered by water molecules at a given watercontent depends strongly on the nature of the interlayer cation. The larger the solvationenergy of the cation, the larger is the hydration of the surfaces. The wettability ofNa-montmorillonites, therefore, is smaller than for Ca-montmorillonites. This lowerwettability causes an increased in the strength of the clay bridges and, consequently,leads to a higher green and wet tensile strength of Na-bentonite bonded sands.
At water content within the smectite interlayers corresponding to less than threelayers, the arrangement of the water molecules surrounding the exchangeable cationsdepends mainly on the type of cations. Studies on water structure Hertz & Franks(1973) and Enderby & Neilson (1981) show that the mean residence time of a watermolecule in the first solvation layer around a monovalent cation like Na+ is about 10-11
67

5 Comparison of moulding sands bonded with sodium and calcium bentonites
s. Around bivalent cations like Ca2+, the residence time is about 10-8 s. In bulk waterthe residence time in the first layer is about 10-12 s. Therefore, a further reason for thebetter performance of Na-bentonite bonded sands might be that higher release rate ofwater from the interlayer space of Na-montmorillonites at 100◦C can contribute to aslight delay of the evaporation the capillary bridges.
68

6 Conclusions
6.1 Effect of moisture on the sand properties
Neutron radiography imaging was successfully applied to follow wet tensile strengthtesting in-situ during heat application. Radiography enabled for both quantificationof the water kinematics and determination of the location of lowest strength in themoisture profile. The preferred fracture position was pinpointed at the boundary betweenevaporation and condensation zone. This location of minimum tensile strength could beexplained by the negative correlation of the surface tension of water and temperature(Kayser 1976), which reaches minimum value at 100◦C. Additionally, the onset ofthe boiling of the water within the water bridges lowers the capillary force furtherand leads to the observed minimum of tensile strength (Fig. 6.1). The results refutecommon postulations (Odom 1984, Campbell 2011, Patterson & Boenisch 1961a) thatthe fracture is located within the condensation zone and is exclusively caused by thesupersaturation of the sand.
6.2 Effect of heat pre-treatment and cyclic reuseon the properties of Na-bentonite bondedsand
Although there were small differences in the d001 values of smectites between thereference sand and sands subjected to 22 drying and remoistening cycles, significantchanges in water kinematics and tensile strength could not be detected. Thus, theobserved effects caused by the cyclic reuse were not yet strong enough to affect theattractive forces in a magnitude leading to a substantial reduction of the quality of themoulding sand. This finding agrees with empiric practice in foundry industry, wheremoulding sand is replaced after approx. 20 cycles. The fact that slight alterations weredetected, however, may indicate that a higher number of cycles eventually will lead to adecrease of sand quality. In this context, it needs to be noted that in our experiments themaximum temperature during cyclic reuse was 120◦C. A high-temperature impact, as ittypically occurs during casting, was not part of these cycles.
The influences of heat pre-treatment on the water transport and binding properties ofmoulding sands were investigated for the first time. Alterations were detected already atT = 225◦C, i.e. at a temperature, which supposedly is well below the dehydroxylationthreshold of smectites. The alterations mainly comprised of an increased water transport
69

6 Conclusions
Fig. 6.1: Illustration of the differ-ent transport zones. The Quartzgrains in the dry zone were con-nected by a solid precipitate whichhad been formed after the water wasevaporated. In the evaporation zone,the quartz grains were hold togetherby clay mineral bridges. In thecondensation zone and the externalzone, capillary bridges were mainlyresponsible for the cohesion of thequartz grains. With increasing satu-ration, the bridges merged and thecapillary forces decreased
rate in the moulding sand column. We suggest that this modified water kinematicsis a consequence of minor changes of the compositional and structural integrity ofthe smectites and is causally related to the observed degradation of the mechanicalproperties of the moulding sands. Upon an early dehydroxylation of the the smectites ora progressive release of tightly bound water at T > 330◦C, further irreversible decreaseof the binding quality of moulding sands occurred. With completing dehydroxylation ofthe smectites above 670◦C, the total loss of wet tensile strength of the pre-heated sandstook place.
6.3 Ca-bentonite bonded sandsDifferent behaviour of Ca- and Na-bentonite bonded moulding sands was detected afterheat pre-treatment. The detected differences in tensile strength correspond well withthe different dehydroxylation behaviour of the smectites. In contrast, the maximumwater content and the smectite swelling capacity seem not to be among the majorcauses responsible for the change in tensile strength. Ca- and Na-bentonite bondedmoulding sands did not show significant differences in the maximum water contentat high pre-treatment temperatures. Differences in swelling capacity at pre-treatmenttemperatures below 545◦C likely are too low for a significant impact on the tensilestrength. Close to the heat source, moreover, the propagation rate of the water in thecondensation zone is likely too fast for the smectites to absorb significant amounts ofthe incoming water and steam.
70

Acknowledgements
The work is based upon experiments performed at ANTARES and MIRA operated byHeinz Maier-Leibnitz Zentrum (MLZ, Garching Germany) as well as at ICON (Paul-Scherrer-Institute, Villigen, Switzerland). Funding from DFG (JO301/5-1) is gratefullyacknowledged. Furthermore, the I would like to kindly thank Erika Grießhaber (LMUMünchen) for SEM analyses. Gratefully acknowledged are the mineralogical andchemical analyses of the bentonite performed by Helge Stanjek (RWTH Aachen).I thank Sandra Böhmke providing the moulding sand on behalf of S&B minerals.Furthermore, I appreciate the DSC and TG measurements performed by Kai-Uwe Hess,and thank him and W.W. Schmahl for there great suggestions helping to improve themanuscript and this work. My warm thanks go to Sophie Wunderlich and especially toGuntram Jordan, working together with you was a pleasure.
71


Appendix
73

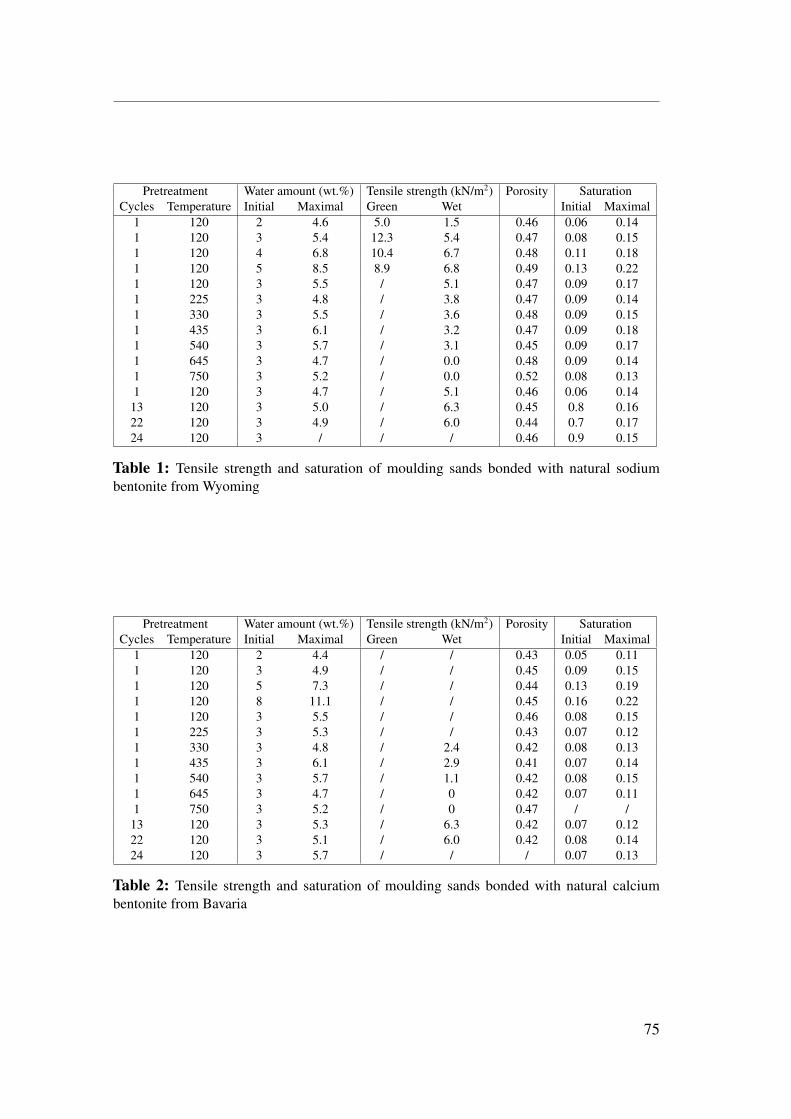
Pretreatment Water amount (wt.%) Tensile strength (kN/m2) Porosity SaturationCycles Temperature Initial Maximal Green Wet Initial Maximal
1 120 2 4.6 5.0 1.5 0.46 0.06 0.141 120 3 5.4 12.3 5.4 0.47 0.08 0.151 120 4 6.8 10.4 6.7 0.48 0.11 0.181 120 5 8.5 8.9 6.8 0.49 0.13 0.221 120 3 5.5 / 5.1 0.47 0.09 0.171 225 3 4.8 / 3.8 0.47 0.09 0.141 330 3 5.5 / 3.6 0.48 0.09 0.151 435 3 6.1 / 3.2 0.47 0.09 0.181 540 3 5.7 / 3.1 0.45 0.09 0.171 645 3 4.7 / 0.0 0.48 0.09 0.141 750 3 5.2 / 0.0 0.52 0.08 0.131 120 3 4.7 / 5.1 0.46 0.06 0.14
13 120 3 5.0 / 6.3 0.45 0.8 0.1622 120 3 4.9 / 6.0 0.44 0.7 0.1724 120 3 / / / 0.46 0.9 0.15
Table 1: Tensile strength and saturation of moulding sands bonded with natural sodiumbentonite from Wyoming
Pretreatment Water amount (wt.%) Tensile strength (kN/m2) Porosity SaturationCycles Temperature Initial Maximal Green Wet Initial Maximal
1 120 2 4.4 / / 0.43 0.05 0.111 120 3 4.9 / / 0.45 0.09 0.151 120 5 7.3 / / 0.44 0.13 0.191 120 8 11.1 / / 0.45 0.16 0.221 120 3 5.5 / / 0.46 0.08 0.151 225 3 5.3 / / 0.43 0.07 0.121 330 3 4.8 / 2.4 0.42 0.08 0.131 435 3 6.1 / 2.9 0.41 0.07 0.141 540 3 5.7 / 1.1 0.42 0.08 0.151 645 3 4.7 / 0 0.42 0.07 0.111 750 3 5.2 / 0 0.47 / /
13 120 3 5.3 / 6.3 0.42 0.07 0.1222 120 3 5.1 / 6.0 0.42 0.08 0.1424 120 3 5.7 / / / 0.07 0.13
Table 2: Tensile strength and saturation of moulding sands bonded with natural calciumbentonite from Bavaria
75

Appendix
Pretreatment Water amount (wt.%) Propagation constants (mm/√s)
Cycles Temperature (◦C) Initial Maximal Dry/Evaporation Evaporation/Condensation Condensation External1 120 2 4.5 0.10 0.79 2.771 120 3 5.3 0.11 0.84 3.321 120 4 6.9 0.03 0.92 4.151 120 5 8.4 0.01 0.85 4.501 120 3 5.5 0.15 0.85 2.801 225 3 5.3 0.16 0.80 2.731 330 3 4.8 0.15 0.83 2.781 390 3 5.9 0.26 1.05 3.901 435 3 6.1 0.27 1.06 3.771 540 3 5.7 0.26 0.9 4.171 645 3 4.7 0.23 0.9 5.401 750 3 5.2 0.36 1.3 6.40
13 120 3 / 0.17 0.59 2.5822 120 3 / 0.13 0.67 2.8924 120 3 / 0.15 0.85 2.18
Table 3: Propagation constants of moulding sands bonded with natural sodium bentonite fromWyoming
Pretreatment Water amount (wt.%) Propagation constants (mm/√s)
Cycles Temperature (◦C) Initial Maximal Dry/Evaporation Evaporation/Condensation Condensation External1 120 2 4.4 0.28 0.78 1.951 120 3 4.9 0.11 0.53 2,81 120 4 7.9 0.17 0.51 2.891 120 5 7.3 0.19 0.53 2.831 120 6 8.1 0.15 0.56 4.401 120 8 11 0.06 0.82 3.431 120 3 5.5 0.15 0.76 3.101 225 3 5.3 0.09 0.61 3.311 330 3 4.8 0.09 0.70 3.251 435 3 6.1 0.10 0.63 4.131 540 3 5.7 0.11 0.80 3.531 645 3 4.7 0.17 1.156 4.171 750 3 5.2 0.16 1.13 3.78
13 120 3 5.3 0.09 0.61 2.8422 120 3 5.1 0.08 0.62 2.8924 120 3 5.7 0.08 0.63 2.18
Table 4: Propagation constants of quartz sands bonded with natural calcium bentonite fromBavaria
76

BibliographyAlonso-Santurde, R., Coz, A., Viguri, J. & Andrés, A. (2012), ‘Recycling of foundry by-
products in the ceramic industry: Green and core sand in clay bricks’, Constructionand Building Materials 27(1), 97–106.
Anthony, J. W., Bideaux, R. A., Bladh, K. W. & Nichols, M. C. (2000), ‘Handbookof mineralogy, volume IV, arsenates, phosphates, vanadates’, 1-680, MineralogicalSociety of America, Chantilly, Virginia .
Barry, M. M., Jung, Y., Lee, J.-K., Phuoc, T. X. & Chyu, M. K. (2015), ‘Fluid filtrationand rheological properties of nanoparticle additive and intercalated clay hybridbentonite drilling fluids’, Journal of Petroleum Science and Engineering 127, 338–346.
Barshad, I. (1949), ‘The nature of lattice expansion and its relation to hydration inmontmorillonite and vermiculite’, The American Mineralogist 34(9-10), 675–684.
BDG (1997), VDG - Merkblatt p38: Prüfung von tongebundenen Formstoffen Bes-timmung der Festigkeit, Technical report, Bundesverband der Deutschen Gießerei-Industrie BDG.
Beer, A. (1852), ‘Bestimmung der Absorption des rothen Lichts in farbigen Flüs-sigkeiten’, Ann. Physik 162, 78–88.
Bergaya, F. & Lagaly, G. (2006), ‘General introduction: clays, clay minerals, and clayscience’, Developments in clay science 1, 1–18.
Bird, P. (1984), ‘Hydration-phase diagrams and friction of montmorillonite underlaboratory and geologic conditions, with implications for shale compaction, slopestability, and strength of fault gouge’, Tectonophysics 107(3-4), 235–260.
Bobrowski, A. & Grabowska, B. (2012), ‘The impact of temperature on furan resin andbinders structure’, Metallurgy and Foundry Engineering 38, 73–80.
Boon, J. J., Hendrickx, R., Eijkel, G., Cerjak, I., Kaestner, A. & Ferreira, E. S. B.(2015), ‘Neutron radiography for the study of water uptake in painting canvases andpreparation layers’, Applied Physics A 121(3), 837–847.
Bourg, I. C. & Sposito, G. (2010), ‘Connecting the molecular scale to the continuumscale for diffusion processes in smectite-rich porous media’, Environmental Science& Technology 44(6), 2085–2091.
77
Bibliography
Bragg, W. H. & Bragg, W. L. (1913), ‘The reflection of X-rays by crystals’, Proceedingsof the Royal Society of London. Series A, Containing Papers of a Mathematical andPhysical Character 88(605), 428–438.
Bray, H. & Redfern, S. (1999), ‘Kinetics of dehydration of Ca-montmorillonite’, Physicsand Chemistry of Minerals 26(7), 591–600.
Calvet, R. & Prost, R. (1971), ‘Cation migration into empty octahedral sites and surfaceproperties of clays’, Clays and Clay Minerals 3, 175–186.
Campbell, J. (2011), Complete Casting Handbook, 1st Edition, Elsevier.
Carslaw, H. S. & Jaeger, J. C. (1959), ‘Conduction of heat in solids’, Oxford: ClarendonPress, 1959, 2nd ed. .
Chorom, M. & Rengasamy, P. (1996), ‘Effect of heating on swelling and dispersion ofdifferent cationic forms of a smectite’, Clays and Clay Minerals 44(6), 783–790.
Christidis, G. E., Blum, A. E. & Eberl, D. (2006), ‘Influence of layer charge and chargedistribution of smectites on the flow behaviour and swelling of bentonites’, AppliedClay Science 34(1), 125–138.
Collins, D. R., Fitch, A. N. & Catlow, C. R. A. (1992), ‘Dehydration of vermiculitesand montmorillonites: a time-resolved powder neutron diffraction study’, Journal ofMaterials Chemistry 2(8), 865–873.
Couture, R. A. (1985), ‘Steam rapidly reduces the swelling capacity of bentonite’,Nature 318(6041), 50–52.
Dobbs, H. & Yeomans, J. (1992), ‘Capillary condensation and prewetting betweenspheres’, Journal of Physics: Condensed Matter 4(50), 10133.
Drits, V., Besson, G. & Muller, F. (1995), ‘An improved model for structural transfor-mation of heat-treated aluminous dioctahedral 2: 1 layer silicates’, Clays and ClayMinerals 43(6), 718–731.
Einstein, A. (1916), ‘Die Grundlage der Allgemeinen Relativitätstheorie’, Annalen derPhysik 354(7), 769–822.
Emmerich, K. (2000), Die geotechnische Bedeutung des Dehydroxylierungsverhaltensquellfähiger Tonminerale, Vol. 13508, vdf Hochschulverlag AG.
Emmerich, K. & Kahr, G. (2001), ‘The cis-and trans-vacant variety of a montmorillonite:an attempt to create a model smectite’, Applied Clay Science 20(3), 119–127.
Emmerich, K., Koeniger, F., Kaden, H. & Thissen, P. (2015), ‘Microscopic structureand properties of discrete water layer in Na-exchanged montmorillonite’, Journal ofColloid and Interface Science 448, 24 – 31.
78
Bibliography
Emmerich, K., Madsen, F. T. & Kahr, G. (1999), ‘Dehydroxylation behavior of heat-treated and steam-treated homoionic cis-vacant montmorillonites’, Clays and ClayMinerals 47(5), 591–604.
Emmerich, K., Wolters, F., Kahr, G. & Lagaly, G. (2009), ‘Clay profiling: the classifica-tion of montmorillonites’, Clays and Clay Minerals 57(1), 104–114.
Enderby, J. & Neilson, G. (1981), ‘The structure of electrolyte solutions’, Reports onProgress in Physics 44(6), 593.
Falode, O., Ehinola, O. & Nebeife, P. (2008), ‘Evaluation of local bentonitic clay as oilwell drilling fluids in Nigeria’, Applied Clay Science 39(1-2), 19–27.
Fan, J. & Wen, X. (2002), ‘Modeling heat and moisture transfer through fibrous insula-tion with phase change and mobile condensates’, International Journal of Heat andMass Transfer 45(19), 4045–4055.
Ferrage, E., Kirk, C. A., Cressey, G. & Cuadros, J. (2007), ‘Dehydration of Ca-montmorillonite at the crystal scale. Part I: Structure evolution’, American Min-eralogist 92(7), 994–1006.
Ferrage, E., Lanson, B., Michot, L. J. & Robert, J.-L. (2010), ‘Hydration properties andinterlayer organization of water and ions in synthetic Na-smectite with tetrahedrallayer charge. Part 1. Results from X-ray diffraction profile modeling’, The Journal ofPhysical Chemistry C 114(10), 4515–4526.
Fiore, S. & Zanetti, M. C. (2007), ‘Foundry wastes reuse and recycling in concreteproduction’, American Journal of Environmental Sciences 3(3), 135–142.
Fischer, W. (1997), ‘Sinq—the spallation neutron source, a new research facility at PSI’,Physica B: Condensed Matter 234, 1202–1208.
Fisher, R. (1926), ‘On the capillary forces in an ideal soil; correction of formulae givenby wb haines’, The Journal of Agricultural Science 16(3), 492–505.
Földvári, M. (2013), ‘Handbook of the thermogravimetric system of minerals and itsuse in geological practice: Occasional papers of the Geological Institute of Hungary,vol. 213, Budapest, 2011, 180 p.’.
Forsmo, S., Apelqvist, A., Björkman, B. & Samskog, P.-O. (2006), ‘Binding mech-anisms in wet iron ore green pellets with a bentonite binder’, Powder Technology169(3), 147–158.
Georgii, R. & Seemann, K. (2015), ‘Mira: Dual wavelength band instrument’, Journalof Large-Scale Research Facilities JLSRF 1, 3.
79

Bibliography
Georgii, R., Weber, T., Brandl, G., Skoulatos, M., Janoschek, M., Mühlbauer, S.,Pfleiderer, C. & Böni, P. (2018), ‘The multi-purpose three-axis spectrometer (TAS)MIRA at FRM II’, Nuclear Instruments and Methods in Physics Research Section A:Accelerators, Spectrometers, Detectors and Associated Equipment 881, 60–64.
Gražulis, S., Chateigner, D., Downs, R. T., Yokochi, A. F. T., Quirós, M., Lutterotti,L., Manakova, E., Butkus, J., Moeck, P. & Le Bail, A. (2009), ‘CrystallographyOpen Database – an open-access collection of crystal structures’, Journal of AppliedCrystallography 42(4), 726–729.
Gražulis, S., Daskevic, A., Merkys, A., Chateigner, D., Lutterotti, L., Quirós, M.,Serebryanaya, N. R., Moeck, P., Downs, R. T. & Le Bail, A. (2012), ‘Crystallographyopen database (cod): an open-access collection of crystal structures and platform forworld-wide collaboration’, Nucleic Acids Research 40(D1), D420–D427.
Greene-Kelly, R. (1955), ‘Dehydration of montmorillonite minerals’, MineralogicalMagazine 30(228), 604–615.
Grim, R. E. & Guven, N. (1978), Bentonites - Geology, mineralogy, properties and uses,Elsevier, Amsterdam.
Guney, Y., Sari, Y. D., Yalcin, M., Tuncan, A. & Donmez, S. (2010), ‘Re-usage of wastefoundry sand in high-strength concrete’, Waste Management 30(8), 1705–1713.
Haines, W. B. (1925), ‘Studies in the physical properties of soils: Ii. a note on thecohesion developed by capillary forces in an ideal soil’, The Journal of AgriculturalScience 15(4), 529–535.
Hall, S. A. (2013), ‘Characterization of fluid flow in a shear band in porous rock usingneutron radiography’, Geophysical Research Letters 40(11), 2613–2618.
Hassanein, R. (2006), Correction methods for the quantitative evaluation of thermalneutron tomography, PhD thesis, Swiss Federal Institute of Technology Zürich.
Hassanein, R., Meyer, H. O., Carminati, A., Estermann, M., Lehmann, E. & Vontobel,P. (2006), ‘Investigation of water inbibition in porous stone by thermal neutronradiography’, Journal of Physics D: Applied Physics 39, 4284–4291.
Hasse, S. (2007), Giesserei-Lexikon 2008, Fachverlag Schiele & Schoen.
Heibrock, G., Zeh, R. M. & Witt, K. J. (2005), Tensile strength of compacted clays, inT. Schanz, ed., ‘Unsaturated Soils: Experimental Studies’, Springer, Berlin, pp. 395–412.
Heller-Kallai, L. & Rozenson, I. (1980), ‘Dehydroxylation of dioctahedral phyllosili-cates’, Clays Clay Minerals 28(5), 355.
80

Bibliography
Hendricks, S. B. & Jefferson, M. E. (1938), ‘Structures of kaolin and talc-pyrophyllitehydrates and their bearing on water sorption of the clays’, American Mineralogist23, 863–875.
Hertz, H. & Franks, F. (1973), ‘Water: A comprehensive treatise’, by F. Franks, PlenumPress, New York 3.
Heuser, M., Weber, C., Stanjek, H., Chen, H., Jordan, G., Schmahl, W. W. & Natzeck,C. (2014), ‘The interaction between bentonite and water vapor. I: Examination ofphysical and chemical properties’, Clays and Clay Minerals 62(3), 188–202.
Hofmann, U. & Klemen, R. (1950), ‘Verlust der Austauschfähigkeit von Lithiumionenan Bentonit durch Erhitzung’, Zeitschrift für anorganische und allgemeine Chemie262(1-5), 95–99.
Holmboe, M. & Bourg, I. C. (2013), ‘Molecular dynamics simulations of water andsodium diffusion in smectite interlayer nanopores as a function of pore size andtemperature’, The Journal of Physical Chemistry C 118(2), 1001–1013.
Holtzer, M., Bobrowski, A. & Zymankowska-Kumon, S. (2011), ‘Temperature influ-ence on structural changes of foundry bentonites’, Journal of Molecular Structure1004(1), 102–108.
Hubbell, J. H. & Seltzer, S. M. (1995), Tables of X-ray mass attenuation coefficientsand mass energy-absorption coefficients 1 keV to 20 MeV for elements z= 1 to 92and 48 additional substances of dosimetric interest, Technical report, National Inst. ofStandards and Technology-PL, Gaithersburg, MD (United States). Ionizing RadiationDiv.
Israelachvili, J. N. (2011), Intermolecular and surface forces, Academic press.
Jordan, G., Eulenkamp, C., Calzada, E., Schillinger, B., Hoelzel, M., Gigler, A.,Stanjek, H. & Schmahl, W. W. (2013), ‘Quantitative in-situ study of the dehydrationof bentonite-bounded moulding sands’, Clays and Clay Minerals 61(2), 133–144.
Juhász, A. (1989), ‘Water vapor adsorption and capillary reactions of silicates’, Colloid& Polymer Science 267(11), 1036–1054.
Kaestner, A., Hartmann, S., Kühne, G., Frei, G., Grünzweig, C., Josic, L., Schmid,F. & Lehmann, E. (2011), ‘The ICON beamline – a facility for cold neutron imag-ing at SINQ’, Nuclear Instruments and Methods in Physics Research Section A:Accelerators, Spectrometers, Detectors and Associated Equipment 659(11), 387–393.
Kaestner, A., Lehmann, E. & Stampanoni, M. (2008), ‘Imaging and image processingin porous media research’, Advances in Water Recources 31 pp. 1174–1187.
81

Bibliography
Kang, M., Bilheux, H., Voisin, S., Cheng, C., Perfect, E., Horita, J. & Warren, J.(2013), ‘Water calibration measurements for neutron radiography: Application towater content quantification in porous media’, Nuclear Instruments and Methods inPhysics Research Section A: Accelerators, Spectrometers, Detectors and AssociatedEquipment 708, 24–31.
Kayser, W. V. (1976), ‘Temperature dependence of the surface tension of water incontact with its saturated vapor’, Journal of Colloid and Interface Science 56(3), 622–627.
Khanna, S. & Swarup, D. (1961), ‘The role of wet-tensile strength of foundry sands inthe surface finish of aluminium sand casting’.
Kohonen, M. M., Geromichalos, D., Scheel, M., Schier, C. & Herminghaus, S. (2004),‘On capillary bridges in wet granular materials’, Physica A: Statistical Mechanicsand its Applications 339(1-2), 7–15.
Komadel, P., Madejová, J. & Bujdák, J. (2005), ‘Preparation and properties of reduced-charge smectites–a review’, Clays and Clay Minerals 53(4), 313–334.
Kubo, K. & Pehlke, R. D. (1986), ‘Heat and moisture transfer in sand molds containingwater’, Metallurgical Transactions B 17(4), 903–911.
Kuligiewicz, A. & Derkowski, A. (2017), ‘Tightly bound water in smectites’, AmericanMineralogist 102(5), 1073–1090.
Laird, D. A. (2006), ‘Influence of layer charge on swelling of smectites’, Applied ClayScience 34(1-4), 74–87.
Laird, D. A., Shang, C. & Thompson, M. L. (1995), ‘Hysteresis in crystalline swellingof smectites’, Journal of Colloid and Interface Science 171(1), 240–245.
Lambert, J. H. (1760), Photometria sive de mensura et gradibus luminis, colorum etumbrae, Klett.
Lechman, J., Lu, N. & Wu, D. (2006), ‘Hysteresis of matric suction and capillarystress in monodisperse disk-shaped particles’, Journal of Engineering Mechanics132(5), 565–577.
Lian, G., Thornton, C. & Adams, M. J. (1993), ‘A theoretical study of the liquid bridgeforces between two rigid spherical bodies’, Journal of Colloid and Interface Science161(1), 138–147.
Likos, W. J. & Lu, N. (2004), ‘Hysteresis of capillary stress in unsaturated granularsoil’, Journal of Engineering Mechanics 130(6), 646–655.
82
Bibliography
Lindner, M., Nagle, R. & Landrum, J. (1976), ‘Neutron capture cross sections from 0.1to 3 MeV by activation measurements’, Nuclear Science and Engineering 59(4), 381–394.
Loto, C. & Adebayo, H. (1990), ‘Effects of variation in water content, clay fraction andsodium carbonate additions on the synthetic moulding properties of igbokoda clayand silica sand’, Applied Clay Science 5(2), 165–181.
Lu, N., Godt, J. W. & Wu, D. T. (2010), ‘A closed-form equation for effective stress inunsaturated soil’, Water Resources Research 46(5).
Lu, N., Kim, T.-H., Sture, S. & Likos, W. J. (2009), ‘Tensile strength of unsaturatedsand’, Journal of engineering mechanics 135(12), 1410–1419.
Lu, N., Wu, B. & Tan, C. P. (2007), ‘Tensile strength characteristics of unsaturatedsands’, Journal of Geotechnical and Geoenvironmental Engineering 133(2), 144–154.
MacEwan, D. M. & Wilson, M. (1980), ‘Interlayer and intercalation complexes ofclay minerals’, Crystal structures of clay minerals and their X-ray identification5, 197–248.
Madejová, J., Bujdák, J., Komadel, P. & Gates, W. (1996), ‘Preparation and infraredspectroscopic characterization of reduced-charge montmorillonite with various Licontents’, Clay Minerals 31(2), 233–241.
Maeda, N., Israelachvili, J. N. & Kohonen, M. M. (2003), ‘Evaporation and instabilitiesof microscopic capillary bridges’, Proceedings of the National Academy of Sciences100(3), 803–808.
Maes, A. & Cremers, A. (1977), ‘Charge density effects in ion exchange. part 1.—het-erovalent exchange equilibria’, Journal of the Chemical Society, Faraday Transac-tions 1: Physical Chemistry in Condensed Phases 73, 1807–1814.
McBride, M. & Mortland, M. (1974), ‘Copper (II) interactions with montmorillonite:Evidence from physical methods’, Soil Science Society of America Journal 38(3), 408–415.
Mehrotra, V. & Sastry, K. (1980), ‘Pendular bond strength between unequal-sizedspherical particles’, Powder Technology 25(2), 203–214.
Melcher, R. E. & Schaefer, F. W. (1978), ‘Additive for green molding sand’. US Patent4,131,476.
Mering, J. (1946), ‘On the hydration of montmorillonite’, Transactions of the FaradaySociety 42, B205–B219.
Molenkamp, F. & Nazemi, A. (2003), ‘Interactions between two rough spheres, waterbridge and water vapour’, Geotechnique 53(2), 255–264.
83

Bibliography
Momma, K. & Izumi, F. (2008), ‘Vesta: a three-dimensional visualization system forelectronic and structural analysis’, Journal of Applied Crystallography 41(3), 653–658.
Momma, K. & Izumi, F. (2011), ‘Vesta 3 for three-dimensional visualization of crystal,volumetric and morphology data’, Journal of Applied Crystallography 44(6), 1272–1276.
Munkholm, L. J. & Kay, B. D. (2002), ‘Effect of water regime on aggregate-tensilestrength, rupture energy, and friability’, Soil Science Society of America Journal66, 702–709.
Odom, I. E. (1984), ‘Smectite clay minerals: Properties and uses’, Philosophical Trans-actions of the Royal Society of London A: Mathematical, Physical and EngineeringSciences 311(1517), 391–409.
Ogata, K., Takeuchi, Y. & Kudoh, Y. (1987), ‘Structure of α-quartz as a function oftemperature and pressure’, Zeitschrift für Kristallographie-Crystalline Materials179(1-4), 403–414.
Orr, F., Scriven, L. & Rivas, A. P. (1975), ‘Pendular rings between solids: meniscusproperties and capillary force’, Journal of Fluid Mechanics 67(4), 723–742.
Oscarson, D. & Dixon, D. (1989), ‘The effect of steam on montmorillonite’, AppliedClay Science 4(3), 279–292.
Oscarson, D., Dixon, D. & Gray, M. (1990), ‘Swelling capacity and permeability ofan unprocessed and a processed bentonitic clay’, Engineering Geology 28(3-4), 281–289.
Paluszkiewicz, C., Holtzer, M. & Bobrowski, A. (2008), ‘FTIR analysis of bentonite inmoulding sands’, Journal of Molecular Structure 880(1-3), 109–114.
Parappagoudar, M., Pratihar, D. & Datta, G. (2008), ‘Neural network-based approachesfor forward and reverse mappings of sodium silicate-bonded, carbon dioxide gashardened moulding sand system’, Materials and Manufacturing Processes 24(1), 59–67.
Patterson, W. & Boenisch, D. (1961a), ‘Die Bedeutung der Festigkeit feuchter, tonge-bundener Formsande insbesondere der Naßfestigkeit’, Giesserei 3, 157–193.
Patterson, W. & Boenisch, D. (1961b), ‘Eigenschaften und Eigenschaftsänderungen derTonmineralien in Formsanden’, Forschungsberichte des Landes Nordrhein-Westfalen961.
Patterson, W. & Boenisch, D. (1964), ‘Das Schülpendiagramm für Naßzugsande’,Giesserei 51(21), 634–641.
84

Bibliography
Patterson, W. & Boenisch, D. (1966), ‘Die Wasserbindung an Tonen und ihre Bedeu-tung für die Festigkeit des Gießereiformsandes’, Forschungsberichte des LandesNordrhein-Westfalen 1659.
Pierrat, P. & Caram, H. S. (1997), ‘Tensile strength of wet granula materials’, PowderTechnology 91(2), 83–93.
Pons, C., Brahim, J. B., Yucel, A., Tchoubar, D. & Tchoubar, C. (1980), ‘Déterminationà l’échelle absolue de l’intensité diffractée aux rayons x par les argiles’, Clay Minerals15(2), 111–120.
Popielarski, P. & Ignaszak, Z. (2016), Drying and Energy Technologies, SpringerInternational Publishing, Cham, chapter Effective Modelling of Phenomena in Over-Moisture Zone Existing in Porous Sand Mould Subjected to Thermal Shock, pp. 181–206.
Prost, R. (1975), Interactions between adsorbed water molecules and the structure ofclay minerals: Hydration mechanism of smectites, in ‘Proc. 5th Int. Clay Conf.,Mexico City’, p. 353.
Rabinovich, Y. I., Esayanur, M. S. & Moudgil, B. M. (2005), ‘Capillary forces betweentwo spheres with a fixed volume liquid bridge: theory and experiment’, Langmuir21(24), 10992–10997.
Raupp-Pereira, F., Hotza, D., Segadães, A. & Labrincha, J. (2006), ‘Ceramic formula-tions prepared with industrial wastes and natural sub-products’, Ceramics Interna-tional 32(2), 173–179.
Schiebel, K., Jordan, G., Kaestner, A., Schillinger, B., Boehnke, S. & Schmahl, W. W.(2017), ‘Neutron radiographic study of the effect of heat-driven water transport onthe tensile strength of bentonite-bonded moulding sand’, Transport in Porous Media .URL: https://doi.org/10.1007/s11242-017-0968-z
Schiebel, K., Jordan, G., Kaestner, A., Schillinger, B., Boehnke, S. & Schmahl, W. W.(2018), ‘Neutron radiographic study of the effect of heat-driven water transport onthe tensile strength of bentonite-bonded moulding sand’, Transport in Porous Media121(2), 369–387.
Schillinger, B., Calzada, E., Eulenkamp, C., Jordan, G. & Schmahl, W. W. (2011),‘Dehydration of moulding sand in simulated casting process examined with neutronradiography’, Nuclear Instruments and Methods in Physics Research Section A:Accelerators, Spectrometers, Detectors and Associated Equipment 651(1), 312–314.
Schillinger, B., Calzada, E. & Lorenz, K. (2006), ‘Modern neutron imaging: Radiog-raphy, tomography dynamic and phase contrast imaging with neutrons’, Solid StatePhenomena 112, 66–72.
85

Bibliography
Schnetzer, F., Thissen, P., Giraudo, N. & Emmerich, K. (2016), ‘Unraveling the coupledprocesses of (de) hydration and structural changes in Na+-saturated montmorillonite’,The Journal of Physical Chemistry C 120(28), 15282–15287.
Schröder, A. & Macherauch, E. (1977), ‘Zur Temperaturverteilung in strahlungsbe-heizten ebenen Formdecken aus tongebundenem Quartzsand’, Giessereiforschung29(1), 41–46.
Schubert, H. (1968), ‘Experimentelle Bestimmung von Haftkraft und Randwinkel amSystem einer Flüssigkeitsbrücke zwischen zwei Kugeln’, Chemie Ingenieur Technik40(15), 745–747.
Schultz, L. G. (1969), ‘Lithium and potassium absorption, dehydroxylation temperature,and structural water content of aluminous smectites’, Clays and Clay Minerals17(3), 115–149.
Schulz, M. & Schillinger, B. (2015), ‘Antares: Cold neutron radiography and tomogra-phy facility’, Journal of Large-Scale Research Facilities 1(A17), 1–4.
Sears, V. F. (1992), ‘Neutron scattering lengths and cross sections’, Neutron News3(3), 26–37.URL: https://doi.org/10.1080/10448639208218770
Sedighi-Gilani, M., Wakili, K. G., Koebel, M., Hugi, E., Carl, S. & Lehmann, E. (2013),‘Visualizing moisture realese and migration in gypsum plaster board during andbeyond dehydration by neutron radiography’, International Journal of Heat andMass Transfer 60, 248–290.
Shokri, N., Lehmann, P., Vontobel, P. & Or, D. (2008), ‘Drying front and water con-tent dynamics during evaporation from delineated by neutron radiography’, Waterresources research 44, W06418.
Shokri, N. & Or, D. (2013), ‘Drying patterns of porous media containing wettabillitycontrasts’, Journal of Colloid and Interface Science 391, 135–141.
Siddique, R., De Schutter, G. & Noumowe, A. (2009), ‘Effect of used-foundry sandon the mechanical properties of concrete’, Construction and Building Materials23(2), 976–980.
Song, Y.-S., Hwang, W.-K., Jung, S.-J. & Kim, T.-H. (2012), ‘A comparative studyof suction stress between sand and silt under unsaturated conditions’, EngineeringGeology 124, 90–97.
Sposito, G. & Prost, R. (1982), ‘Structure of water adsorbed on smectites’, ChemicalReviews 82(6), 553–573.
Starobin, A., Hirt, T., Lang, H. & Todte, M. (2011), ‘Core drying simulation andvalidation’, American Foundry Society Proceedings 11-28, 1–5.
86

Bibliography
Tang, C.-S., Pei, X.-J., Wang, D.-Y., Shi, B. & Li, J. (2015), ‘Tensile strength ofcompacted clayey soil’, Journal of Geotechnical and Geoenvironmental Engineering141(4), 04014122.
Teich-McGoldrick, S. L., Greathouse, J. A., Jove-Colon, C. F. & Cygan, R. T. (2015),‘Swelling properties of montmorillonite and beidellite clay minerals from molecularsimulation: comparison of temperature, interlayer cation, and charge location effects’,The Journal of Physical Chemistry C 119(36), 20880–20891.
Thirumalai, K., Singh, A. & Ramesh, R. (2011), ‘A matlabTM code to perform weightedlinear regression with (correlated or uncorrelated) errors in bivariate data’, Journal ofthe Geological Society of India 77(4), 377–380.
Udell, K. S. (1983), ‘Heat transfer in porous media heated from above with evaporation,condensation, and capillary effects’, Journal of Heat Transfer 105(3), 485–492.
Vanicek, I. (2013), ‘The importance of tensile strength in geotechnical engineering’,Acta Geotechnica Slovenica 1, 5–9.
Villar, M., Gómez-Espina, R. & Gutiérrez-Nebot, L. (2012), ‘Basal spacings of smectitein compacted bentonite’, Applied Clay Science 65, 95–105.
Villman, B., Slowik, V., Wittmann, F. H., Vontobel, P. & Hovinid, J. (2014), ‘Time-dependent moisture distribution in drying cement mortars - results of neutron radiog-raphy and inverse analysis of drying tests’, Restoration of Buildings and Monuments20(1), 49–62.
Wang, Y., Huang, H., Cannon, F. S., Voigt, R. C., Komarneni, S. & Furness, J. C. (2007),‘Evaluation of volatile hydrocarbon emission characteristics of carbonaceous additivesin green sand foundries’, Environmental Science & Technology 41(8), 2957–2963.
Wersin, P., Johnson, L. & McKinley, I. (2007), ‘Performance of the bentonite barrier attemperatures beyond 100 C: A critical review’, Physics and Chemistry of the Earth,Parts A/B/C 32(8), 780–788.
Wiebe, B., Graham, J., Tang, G. X. & Dixon, D. (1998), ‘Influence of pressure, satu-ration, and temperature on the behaviour of unsaturated sand-bentonite’, CanadianGeotechnical Journal 35(2), 194–205.
Wilhelm, P. & Dietmar, B. (1964), ‘Device for ascertaining the operational behavior ofmolding substances’. US Patent 3,159,018.
Wolters, F. & Emmerich, K. (2007), ‘Thermal reactions of smectites—relation ofdehydroxylation temperature to octahedral structure’, Thermochimica Acta 462(1-2), 80–88.
87

Bibliography
York, D., Evensen, N. M., Martinez, M. L. & De Basabe Delgado, J. (2004), ‘Unifiedequations for the slope, intercept, and standard errors of the best straight line’,American Journal of Physics 72(3), 367–375.
Young, F. & Harkins, W. D. (1928), International Critical Tables of Numerical Data,Physics, Chemistry and Technology, Vol. 4, McGraw-Hill, New York.
Zabat, M. & Van Damme, H. (2000), ‘Evaluation of the energy barrier for dehydrationof homoionic (Li, Na, Cs, Mg, Ca, Ba, Alx (OH)y
z+ and La)-montmorillonite by adifferentiation method’, Clay Minerals 35(2), 357–363.
Zanetti, M. & Godio, A. (2006), ‘Recovery of foundry sands and iron fractions from anindustrial waste landfill’, Resources, Conservation and Recycling 48(4), 396–411.
Zeh, R. M. & Witt, K. J. (2007), ‘The tensile strength of compacted clays as affected bysuction and soil structure’, Experimental Unsaturated Soil Mechanics pp. 219–226.
Zheng, Y., Zaoui, A. & Shahrour, I. (2010), ‘Evolution of the interlayer space ofhydrated montmorillonite as a function of temperature’, American Mineralogist95(10), 1493–1499.
Zymankowska-Kumon, S., Holtzer, M., Olejnik, E. & Bobrowski, A. (2012), ‘Influenceof the changes of the structure of foundry bentonites on their binding properties’,Materials Science 18(1), 57–61.
88