Embed Size (px)
Citation preview

1
Evaluation of Integrated Demand Management looking into
Strategic & Tactical Flow Management
Presented by Christoph Moehlenbrink
12th ATM-Seminar, Seattle, WA June 29, 2017

Integrated Demand Management Motivation and Objective
Improving Demand Management & looking into the challenges of demand/capacity matching
– Work on more integrated operations and tools – Leveraging existing systems – Exploring existing NextGen capabilities – if indicated… suggesting new automation tools … exemplified on Newark Liberty Airport (EWR)
2/29

Integrated Demand Management Strategic and Tactical Flow Management
Traffic Flow Mang. System (TFMS) • Command Center • Traffic Man. Initiative • CTOP • Flow Constraint Area
Time-Based Flow Mang. (TBFM) • en/ar scheduling • Speed/vectoring • Meterfix • Extended Metering
Harmonize Overlay control
structures for procedural integration
3/29

CTOP Departure
Depart SFO on CTOP-assigned EDCT time.
CTOP RTA to an FEA
Manage speeds to meet crossing time at a waypoint near FEA W.
Transition Pass RTA waypoint & FEA W, then
cross TBFM freeze horizon.
Integrated Demand Management
FEA S
FEA W
FEA N
TBFM to meter fix
Follow ATC clearances for STA compliance.
Trajectory-Based Flight Operations
San Francisco (SFO) to Newark (EWR) Flight
! ! *
4/29

1. Traffic Flow Management System (TFMS) with CTOP *CTOP : Collaborative Trajectory Option Program
2. Time-Based Flow Management (TBFM)
3. IDM Concept and IDM Operations Types
Integrated Demand Management Motivation and Objective
5/29

To explore whether IDM is beneficial to deliver traffic more efficiently Testing IDM types in a real time quasi simulation setup
1 IDM type: “EDCT only” 2 IDM type: “EDCT and RTAs 3 compared to a Baseline
Integrated Demand Management Objective of the study
6/29

Integrated Demand Management Conditions
• Baseline ‘miles-in-trail’ to regulate traffic into TBFM • IDM type: “EDCT only” CTOP with EDCTs to replace MIT • IDM type: “EDCT and RTAs CTOP with EDCTs and RTA assignment when airborne to improve ‘pre-conditioning’ accuracy
7/29

• traffic scenario: 5 hour runtime • runs: n=10 • this presentation: 4*1 factor (CONDITION, SCENARIO=‘distributed’)
Experimental Design Baseline Integrated Demand Management
CONDITION BL Off BL ON EDCT EDCT+RTA
SCEN
ARIO
Distributed Check Box OFF Check Box ON Check Box ON Check Box ON
Gaggle Check Box OFF Check Box ON Check Box ON Check Box ON
! * !
Integrated Demand Management Method
8/29

• Independent variables: - Baseline Checkbox off/on - EDCT only - EDCT + RTA
• Dependent variables: - throughput - airborne delay - ground delay - total delay
The simulation environment (MACS ERAM Planning Station & nCTOP)
MACS FMS simulation (B757/HW BL emulation)
Traffic Scenario
North Flow West Flow
South Flow
Integrated Demand Management Method
9/29

Integrated Demand Management Method
Airborne delay regions meterfix versus extended metering Ground delay assignment CTOP assigned (strategic) versus TBFM (tactical) hours prior to take Off last-minute (right before take Off)
10/29
‘Short-haul flights’ or
‘Internal Departures’

What is the target throughput rate of the IDM conditions in comparison to the Baseline condition?
What effect on airborne delay in the TBFM region, is caused by forcing short-haul aircraft into the arrival stream
What is the distribution of strategic (CTOP assigned) versus tactical (TBFM assigned) ground delay in the IDM conditions (versus Baseline)
What is the ratio of airborne and ground delay, as well as the total delay under different conditions?
Integrated Demand Management Research Questions
11/29

Integrated Demand Management Results: Throughput
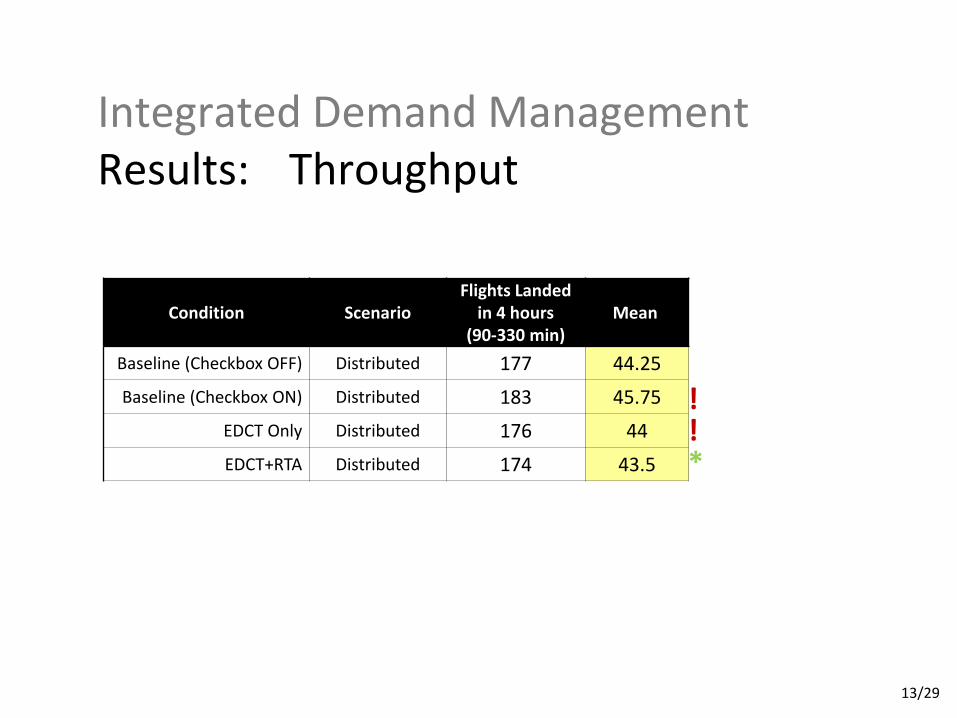
Condition Scenario Flights Landed
in 4 hours (90-330 min)
Mean
Baseline (Checkbox OFF) Distributed 177 44.25 Baseline (Checkbox ON) Distributed 183 45.75
EDCT Only Distributed 176 44 EDCT+RTA Distributed 174 43.5
! *
!
Integrated Demand Management Results: Throughput
13/29

Throughput ‘Comparable’
Integrated Demand Management Results: Throughput
14/29

Integrated Demand Management Results: Airborne Delay

0% 0% 0% 1%10%
23% 23%19%
11% 8%4% 2%
0
20
40
60
80
100
120
< -20 -20 -15 -10 -5 0 5 10 15 20 25 30+
coun
t
minutes
Total Airborne Delay DistributionR7 Distributed Baseline Ckbx ON
0% 0% 0% 0%
31%
54%
12%
3% 0% 0% 0% 0%0
20
40
60
80
100
120
< -20 -20 -15 -10 -5 0 5 10 15 20 25 30+
coun
t
minutes
Total Airborne Delay DistributionR8 Distributed, EDCT+RTA
0% 0% 0% 1%
18%
61%
20%
1% 0% 0% 0% 0%0
20
40
60
80
100
120
< -20 -20 -15 -10 -5 0 5 10 15 20 25 30+
coun
t
minutes
Total Airborne Delay DistributionR2 Distributed, EDCT Only
0% 0% 0% 0%
19%
38%
23%15%
4% 1% 0% 0%0
20
40
60
80
100
120
<-20 -20 -15 -10 -5 0 5 10 15 20 25 30+
coun
t
minutes
Total Airborne Delay DistributionR1 Distributed, Baseline, Ckbx OFF
! *
!
29.23 15.22
7.89 6.44
-10
10
30
50
Base On Base Off EDCT Only EDCT+RTA
hour
s
Delay Totals by Condition
Total Airborne Delay
Integrated Demand Management Results: Airborne Delay
16/29

! ! *
! ! *
Integrated Demand Management Results: Airborne Delay
17/29

Throughput ‘Comparable’
Airborne Delay & Prioritizing Short-Haul Flights ‘IDM conditions: less unacceptable airborne delays’
Integrated Demand Management Results: Airborne Delay
18/29

Integrated Demand Management Results: Ground Delay Distribution

TFMS and TBFM Ground Delay (All flights)
-200
20406080
100
1 11 21 31 41 51 61 71 81 91 101 111 121 131 141 151 161 171 181 191
Min
utes
Distributed Baseline CkBx OFF: CTOP and TBFM Ground Delay
TBFM Ground Delay TFMS Ground Delay
-200
20406080
100
1 11 21 31 41 51 61 71 81 91 101 111 121 131 141 151 161 171 181 191
Min
utes
Distributed EDCT Only: CTOP and TBFM Ground Delay
TBFM Ground Delay TFMS Ground Delay
-200
20406080
100
1 11 21 31 41 51 61 71 81 91 101 111 121 131 141 151 161 171 181 191
Min
utes
Distributed Baseline Checkbox ON: MIT and TBFM Ground Delay
TBFM Ground Delay MIT Ground Delay
-200
20406080
100
1 11 21 31 41 51 61 71 81 91 101 111 121 131 141 151 161 171 181 191
Min
utes
Runway Crossing Sequence
Distributed EDCT+RTA: CTOP and TBFM Ground Delay
TBFM Ground Delay CTOP Ground Delay
!
!
*
20/29

-200
20406080
100
1 11 21 31 41 51 61
min
Baseline, Checkbox ON
TBFM and TFMS (Miles-in-trail or CTOP) Ground Delay "INTERNAL" DEPARTURES ONLY
-200
20406080
100
1 11 21 31 41 51 61
min
Baseline, Checkbox OFF
-200
20406080
100
1 11 21 31 41 51 61
EDCT Only TBFM Ground DelayTFMS Ground Delay
-200
20406080
100
1 11 21 31 41 51 61
EDCT+RTA
DIS
TR
IBU
TE
D S
CE
NA
RIO
Runway Crossing Sequence
! !
*
21/29

Throughput ‘Comparable’
Airborne Delay & Prioritizing Short-Haul Flights ‘IDM conditions: less unacceptable airborne Delays’
Ground Delay and Minimizing Tactical Delay
‘IDM conditions: minimizing tactical delay works’
Integrated Demand Management Results: Ground Delay
22/29

Integrated Demand Management Results: Total Delay

-200
20406080
100
1 11 21 31 41 51 61 71 81 91 101 111 121 131 141 151 161 171 181 191
min
Baseline, Checkbox OFF
Total Air DelayTotal Ground Delay
Threshold crossing sequence
Results: Total Airborne and Total Ground Delay per flight
-200
20406080
100
1 11 21 31 41 51 61 71 81 91 101 111 121 131 141 151 161 171 181 191
min
EDCT Only
-200
20406080
100
1 11 21 31 41 51 61 71 81 91 101 111 121 131 141 151 161 171 181 191
min
Threshold crossing sequence
EDCT+RTA
-200
20406080
100
1 11 21 31 41 51 61 71 81 91 101 111 121 131 141 151 161 171 181 191
min
Baseline, Checkbox ON
!
!
*
24/29

Results: Total Delay
11
1.92
1.00
0.52
0.42
0.39
1.27
1.24
0.78
1.08
1.04
Base On
Base Off
EDCT Only
EDCT+RTA
Sum Ratios, log10
Airborne Sum ratios Ground Sum ratios Total sum ratio
1.92
1.00 0.52
0.42
Base On
Base Off
EDCT Only
EDCT+RTA
Airborne Sum ratios
!
!
*
!
!
*
!
!
*
25/29
0.39
1.27
1.24
Base On
Base Off
EDCT Only
EDCT+RTA
Ground Sum ratios
0.78
1.08
1.04
Base On
Base Off
EDCT Only
EDCT+RTA
Total sum ratio

Throughput ‘Comparable’
Airborne Delay & Prioritizing Short-Haul Flights ‘IDM conditions: less unacceptable airborne Delays’
Ground Delay and Minimizing Tactical Delay
‘IDM conditions: minimizing tactical delay works’ Shift of Airborne to Ground Delay under the Umbrella of Total Delay ‘IDM conditions: less airborne delay + more ground delay’
Integrated Demand Management Results: Total Delay
26/29
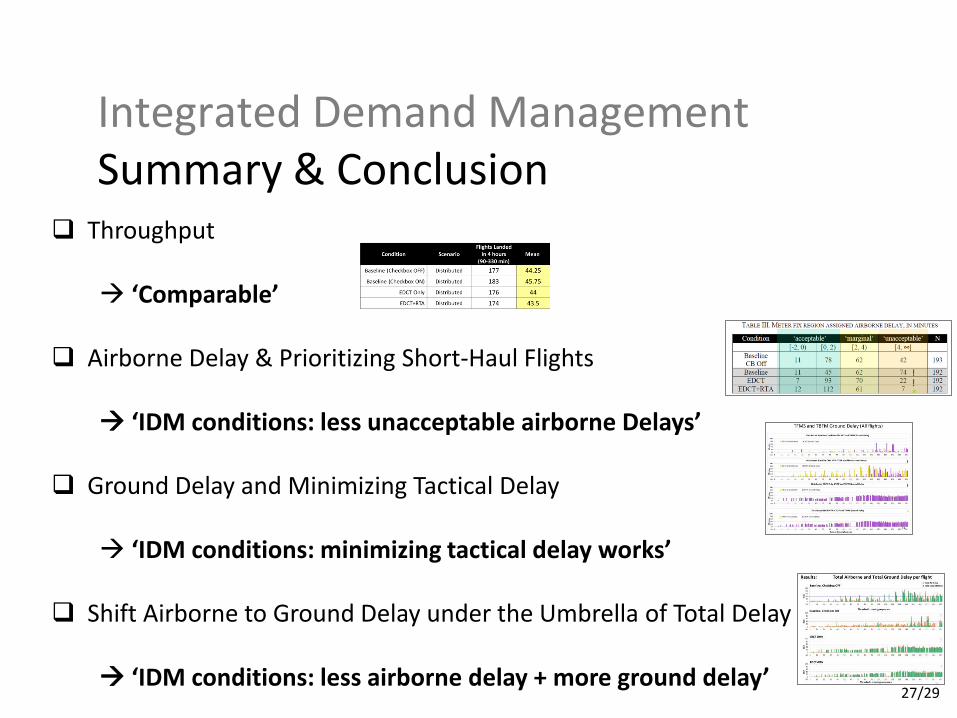
Throughput
‘Comparable’
Airborne Delay & Prioritizing Short-Haul Flights
‘IDM conditions: less unacceptable airborne Delays’
Ground Delay and Minimizing Tactical Delay ‘IDM conditions: minimizing tactical delay works’
Shift Airborne to Ground Delay under the Umbrella of Total Delay
‘IDM conditions: less airborne delay + more ground delay’
Integrated Demand Management Summary & Conclusion
27/29
Discussion Additional interests: Uncertainties (Dep Error and Wind Forecast Error)
EDCT vs. EDCT+RTA
Quasi Real Time Simulation Approach
28/29

Conclusion & Outlook
Study demonstrated that IDM is beneficial: with respect to delivering traffic more efficiently
Delays can be shifted from airborne to ground delay for RTA and non-RTA conditions
while a target throughput rate can be satisfied Under good predictability of airport capacity last minute tactical TBFM
delay can be minimized
Future Work IDM benefits looking into demand/capacity imbalances e.g. to weather
29/29

Acknowledgments The authors would like to thank the lab personnel at Airspace Operations Lab (AOL) at NASA Ames Research Center and all of our airspace Subject Matter Experts for the invaluable contributions to the IDM concept.
Thank you!
Email: [email protected]

Extra Slides


![An Integrated Approach for ATM Location Strategy Using ......An Integrated Approach for ATM Location Strategy Using Analytic ... hybrid genetic algorithm to generate low cost [16]](https://img.dokumen.tips/doc/110x75/5f33fe9ea96b9328845e3c88/an-integrated-approach-for-atm-location-strategy-using-an-integrated-approach.jpg)