Embed Size (px)
Citation preview

This paper has been reviewed in accordance with the US. Environmental Protection Agency's pcer and administrative review policies and approved for presentation and publication.
Evaluation of Innovative Low-Volatile Organic Compound Industrial Maintenance Coatings
w, Research Triangle Institute, P.O. Box 12194, Research Triangle Park, North Carolina 27709; and Michael Kosusko, US. Environmental Protection Agency, Air and Energy Engineering Research Laboratory, Research Triangle Park, North C a r o l i ~ 2771 1.
INTRODUCTION
End users of industrial maintenance coatings in today's marketplace are becoming more critical of the coatings they select. Coatings must meet not only their performance expectations but also implemented State and most recently, proposed Federal regulations for volatile organic compounds (VOCs) . Users are concerned whether innovative coating technologies that are designed to meet VOC regulations will retain the quality and longevity performance characteristics of current, noncompliant coatings that are well respected in the field. Thus, end users, particularly small businesses, are looking for information from independent research studies such as this one that test and evaluate new industrial maintenance coating technologies.
To address these concerns, this research project identified and evaluated emerging low-VOC industrial maintenance coating technologies as pollution prevention alternatives to high-VOC solvent-borne coatings. In addition, this project provides end users with an independent evaluation of some new low-VOC coatings. Industrial maintenance coatings are defined aS heavy-duty coatings, including primers, sealers, undercoats, and intermediate and top coats that are formulated to protect metal substrates from degradation when exposed to aggressive environments. Metal'substrates include bridges, military equipment, ships, septic tanks, and all exterior steel stxuctures. Aggressive environments to which these protected substrates are exposed include coastal, industrial, commercial, and institutional sites. Exposure includes fnquent scrubbing or abrading, immersion in water or wastewater, and exposure to steam.
This paper presents the results of an evaluation of five industrial maintenance coating system alternatives compared to a standard high-VOC coating. Procedures used in this research study included detennining each coating's physical properties, having three operators apply each coating system to a set of test panels consisting of two different substrates, and conducting four durability tests and a 3-month outdoor exposure test on the coated test panels. The results of this evaluation are intended to promote the use of low- VOC coatings in the marketplace, thereby reducing VOC emissions.
BACKGROUND
Research Triangle Institute @TI), in collaboration with'the U.S. Environmental proteaion Agency's WAS) Air and Energy Engineering Research Laboratory (AERL), contacted coating formulators, resin manufacturers, indusmal users, and trade organizations to help identify and target research needs and opportunities within a specific category of the architectural and industrial maintenance (AJM) coatings industry. The emphasis in these contacts was to identify low hazardous air pollutant (HAP) and low-VOC coatings. Representatives from AIM coating manufactums, resin manufacturers, users, representative associations, and other associations affected by AIM coating regulations were contacted. The majority of these contacts were AIM regulatory negotiation committee members. Industrial maintenance coatings were identified as the highest priority for evaluating new low-VOC coatings.
8
, 8-33
L

a
A swey conducted by SRI International in 1990 for the National Paint and Coatings Association (NPCA) indicated that approximately 90.8 million liters (24 million gallons) of industd maintenance coatings werc sold in the United States in that year.' VOC content ranges for these coatings were 351 to 500 g/P (2.9 to 4.2 lWgal), with au average of 425 g/@ (3.5 1Wgal). Based on this average, the estimated national VOC emissions in the year 1990 were 38,590 Mg (42,538 tons). For every 50-g/@ (0.4-1Wgal) reduction in VOC content, the estimated national VOC emissions from mauufacturcrs converting to low-VOC coating formulations would be reduced by 4,540 Mg (5,004 tons). Thus, this project was initiated to evaluate the technical feasibility of innovative low-VOC industrial maintenance coatings.
EXPERIMENTAL METHODS
Evaluation testing was designed on the basis of six discrete arcas: coating systems, substrates, physical property testing, VOC emissions determinatidn, and performance and outdoor exposure testing. Each section is discussed below.
Coating Systems
Coating systems evaluated a described generically in Table 1.
Table 1. Coating Systems Tested
Coating system System coatings Generic description
1 primtr solvent-borne, moisture-cured polyurethane
2
3
4
5
6 (standard)
solvent-borne, zinc-rich, moisture-cured polyurethane
solvent-borne polyurethane
waterborne epoxy estei
waterbonrelatex
SOlVent-bOme alkyd resin
waterborneacrylic
solvent-borne, twocomponent polysiloxane epoxy
Water-nducible alkyd
waterbarneacryiic
SOlVCat-barm alkyd resin solvent-borne alkyd enamel
\
8-34

I Selection of these coatings was based on communications with coating suppliers who had new low-
VOC products that were either just entering the market or had been on the market less than one year. The standard was randomly s e l e c t e d based on its high VOC content with respect to the EPA-proposed regulation and its applicability to most industrial maintenance settings.
substrates
The use of test panels is common practice for evaluating paints and related coatings (sa American Society for Testing and Materials [ASTM] Standard D and ASTM Standard D 2201).2 The most widely used subsuatcs in industrial maintenance applications ari ASTM A36 and ASTM A588 steels. ASTM A36 steel is an all-purpose carboo-grade steel used in building and bridge construction. ASTM A588 steel is a corrosion-resistant, high-strength, low-alloy steel that is suitable for use in the bare or uncoated condition where exposun to a n d atmosphere causes a tightly adherent oxide to form on the surface of the substrate protecting it from further oxidation. The A588 steel, when used as a coated substrate, is claimed to p v i d e a longer coating life than other structural steels, such as A36.
A total of 2 1 6 test panels were ordcred from the Jay Allen Steel Company in Pittsburgh, Pennsylvania: 108 of the A36 panels and 108 of the A588 panels. The dimensions of each test panel wcre 152.4 mm x 304.8 mm x 6.35 mm (thickness) (6 in x 12 in x 1/4 in). In the design of the experiment, six panels w m assigned per substrate per coating system, with four of the panels sent to KTA-Tator in Pittsburgh, Pennsylvania, for durability testing and two sent to the LaQue Center in Kure Beach, North Carolina, for outdoor exposure testing.
Surface Preparation of Substrates
Surface contaminants that could nduce adhesion, such as grease, oil, dirt, or mill scale, wm removed prior to painting. Upon arrival at the painting contractor’s facility, each test panel was inspected by an operator. Inspection revealed little or no mill scale on each panel surface but did reveal the presence of grease and dirt Mechanical cleaning was not necessary. For cleaning, operators cleaned cach panel with rags soaked with lacquer thinner to remove surface contaminants.
Six panels of each substrate were then attached to a 1.2 m x 0.9 m x 0.013 m (4 ft x 3 ft x !4 in) wooden board by Velcro hook and loop strips. Each test panel was labeled with an identification number for data quality control. This configuration provided a total panel surface area of 0.54 m2, 0.9 m x 0.6 m (6 ft’, 3 fl x 2 ft) for each operator to apply each coating, giving an adequate amount of coating coverage for calculating each coating system’s VOC emissions as applied.
Pbysid Properties of Each Coating
Before application, an operator thoroughly mixed each container of coating, then poured 7.6 to 1 1.4 P (2 to 3 gal) of the coating into a standard 18.9 P (5 gal) container. Thne grab ~ p k s werc taken from the center of the container. Each 500-mP (17-fl.oz) sample was delivered to RTI’s analytical laboratory and analyzed, in triplicate, to detcrmine the perccnt VOC content by volume percent water content (if the coating was watchme), density, percent volume solids, and percent weight solids of each coating. The analysis method used was EPA Reference Method 24.3 Volume solids a d weight solids of each coating wert derived from ASTM Standard D 236ge2
<
I
8-35

a
i
i VOC Emissions Determination
VOC emissions, as applied, per Operator per coating were determined from weight loss data of the standard 5-gal paint container and each coating's percent solids, by weight. Weight loss was determined by weighing the standard 5-gal container before and after each coating application using a Sartorius F32000S floor scale, with a capacity of 32 kg (71 lb) and a readability of 0.1 g (0.0002 lb).
Prior to coating application, each test panel, with Velcro strips and label attached, was weighed. The technique used to determine the weight of each test panel was to place a standard clean and empty 5-gal container on the center of the pan of the floor scale used to determine coating usage during application. The weight of the container was tarcd out. A test panel was then placed on top of the container in a centered position. Each test panel from each set of 12 panels (each set equals 12 test panels on each support board for each operator) was placed on top of the container in the same position. After weighmg, the container was removed, the scale re-zeroed, and the container placed back 011 top of the scale for the next set of readings.
After the coating application phase of the test was Complete, test panels were removed from their woodcn supports and laid horizontally side by side on plywood panels away from the test ~IWL They were allowed to airm in this position for a minimum of 7 days. After air cuxing, each test panel was reweighed to determine the amount of coating solids remaining on each panel. The same floor scale was used to determine these weights.
Performance Testing
Four test panels from each coating, substrate, and operator combination were shipped to KTA-Tator in Pittsburgh, Pennsylvania, for durability testing. Each test panel was subjected to four performance tests: impact resistance (ASTM D 2794); adhesion (ASTM D 3359); methyl ethyl ketone (MEK) rub (ASTh4 D 4752); and pencil hardness (ASTh4 D 3363): A test matrix representing the number and type of panels per coating system tested was designed: three panels per test per substrate (for three operators each) per coating system for each test panel, resulting in a total number of 72 panels tested for five coating systems and the standard.
Outdoor Exposure Testing
The Lame Center in Wrightsville Beach, North Carolina, conducted a 3-month exposure test of the remaining 72 panels. This test site is me of four outdoor exposure testing facilities in the United States. The test site is classified as a severe marine atmospheric environment.
LaQueCen~personnelarrangedeachtestpaml~exposureracksibatestingarra,25m(82ft)from the Atlantic Ocean, at their Kure Beach, North Carolina, facility. In addition, they pufanncd and documented, as necessary, the following tests: dry film thickness (DIT) of the coating 011 each pane; gloss measurements of each panel prior to exposure on the racks per ASTM Standard D 523; scribed each panel per ASTM Standard D 1654; exposed each panel at 30' to the horizontal facing the Atlantic Ocean for 3 months; and photographed all coated panels together.
After exposme, each panel was inspected for: gloss, befare and after washing, per ASTM Standard D 523; chalking per ASTM Standard D 4214 (Test Method C); blist.cn per ASTM Standard D 714; creepage at the scribe per ASTM Standard D 1654; and rust per ASTM Standard D 610. A photograph was taken of each panel while on the exposure racks; a group photo of each set of six panels (per substrate per coating system) and one photograph of the most severely affd panel in the set were taken.
I
8-36

RESULTS
The results from this evaluation include analyses of each coating's physical properties, calculations of VOC emissions as applied, and results from performance and outdoor exposure testing. Performance and outdoor exposure results were used to provide end users with a qualitative assessment of each coating's applicability to field service. The following sections describe each evaluation and its results.
Coating Analysis
The underlying purpose for analyzing each coating was to detexmine VOC content, density, solids weight percent, and water content in weight percent. VOC content vaiues were used to provide a comparison against the proposed EPA VOC content limits for the years 1996 and 2000 and for the year 2004. Density and solids weight percent were used to calculate VOC emissions. Water content in weight percent was analyzed to show the amount of water in each waterborne coating. Table 2 summarizes the analytical results.
Table 2. Results of Coating Analyses '
voc Solids Water content - content content coating
system Sample (do (pC/cm3) (WL %) (WL %) .
1 primer 360 2.4 85
topcoat 372 1.3 71
2 primer 283 1.2 44 46
topcoat 284 1.2 49 38
3 primer 394 1.4 72 - tapcoat 190 1.1 45 47
4 topcoat 84(mixed) * 1.3 a N A ~ NA
5 primer 237 1.2 37 56
f
intermediate 360 1.6 78 -
topcoat 284 1.2 40 49
6 (standard) primer 394 1.4 72 - topcoat 424 1 .o 57 -
' Values shown are the mean of six samples per coating. 1 g/m' = 62.43 I@. VOC content as applied, minus water, of each sample ' No water detected.
1 g/t = 0.008345 IWgal. ' NA = Not available since EPA Mahod 24 could not
although they tended to run 3 to 7 percent higher than values provided by the manufacrunrs.
analyzed. * Manufactum's numbers were used.
* No bias was determined for VOC content meaMenrents be used-
I 8-37

VOC Content
Figure 1 compares anal@ VOC content VCISUS the EPA-proposed VOC content limits for the years 1996 and 2000 and for the ycar 2004. Ofthe six coating systems evaluated, systems 2,3,4, and 5 met the EPA-proposed VOC mmt limits. Coating system 4, which was the twocomponent polysiloxane, could not be analyzed by the testing )abaratary using EPA Method 24. The manufacturer’s value for VOC content was Used.
Coating
4 P r o p o r c d 2004 llmlt ,-$-,Propored 1996 & 2000 limit
[NOTE: 1 = 0.008345 Ib/gal] Figure 1. Average VOC Content for Each Coating System
VOC Emissions
Figure 2 shows that the average VOC emissions of coating systems 3,4, and 5 wen lower than those of system 6 (the standard). Over time, the lowest-VOC content coating system would prove to be a better system than the standard with nspect to VOC emissions if the durability (Le., service life) and cost of that system were equivalent.
Pertormance Testing
Table 3 ranks each coating system by performance test. The purpose of this ranking is to provide a representative idea of how each coating system performed o v d and how cach system compared to the standard with respect to performance testing. Each test was assigned a point value an a scale of 1 to 5, each unit depending on the scale for each test. This rating system was selected because each of the test results could be conveniently divided into five sections. Refer to each test separattly described below for definitions related to each test’s rating definition.
AUcoatingsystemsoutpaformcdthestandard. c o a t i n g ~ y a e m 4 0 ~ ~ ~ a l l o t h e r c o a t i n g ~ a n d was shown to be the best performing in durability. The following sections describe the results of each ptr;onnance test as they related to the ASTM standard test methods employed.
8-38

700
600
9 500
400
300
200
100
1 2' 3 4 5 6
Coating System (by Operator)
* Weight data for coating system 2 not available. [NOTE. 1 g/m2 = 0.295 Ib/in2]
Figure 2. VOC Emissions as Applied per Unit Area
Table 3. Ranking of Ea& Coating System (Per$ommnce Testing)
Coating Impact Adhesion MEK resistance Hardness I system resistance Method A Method B To primer To metal Scratch Gouge
"
rota1
5 18 4 20 I 29 6 17 3 21 2 26
Rank
26 2 2 3
2
4 21 6 20 I 28 4 21
(continued)
8-39

Table 3. ' Ranking of Each Coating System (continued)
Rating Definitions (mean of three operators): MEKresistance
surface) Rating Impact resistance Adhesion (Double ~ b s to Hardness
1 0-30 0-1 1-10 1-3 2 31-60 2 1 1-20 4-7 3 61-90 3 21 -30 8-1 1 4 ' 91-120 4 31-40 12-13 5 121 + 5 41 + 14
[4. According to AS", the impact resistance test method has been found to be useful over many years in @cting the performance of organic coatings for their ability to resist cracking caused by impacts. This test measures the indentation that results when a painted panel is struck with a hard object such as a steel ball. Results of impact testing are illustrated in Figure 3 for A36 and A588 substrates. Clearly, coating systems 2,4, and 5 performed best, having an end failure point of 8.96 m-kg (160 in-lb). The standard, along with systems 1 and 3, showed poor performance in comparison to systems 2,4, and 5. Their end failure point was 5.60 m-kg (100 in-lb) or less. All coating systems proved to be q u a l to or better than the standard's 3.36 m-kg (60 in-lb). Results are also summarized in Table 3.
&. Because the substrate and degree of surface preparation have a drastic effect on coating adhesion, this method of evaluating a coating's adhesion to different substrates or surface treatments, or of different coatings to the same substrate and treatment, is of considerable usefulness
160
120 1401
40 20 0
1 II 2
3 4 5 6
WOTE: 1 in-lb = 0.056 m-kg]
Figure 3. Impact Resistance (Average of Substrates A36 and A588)
I
8-40
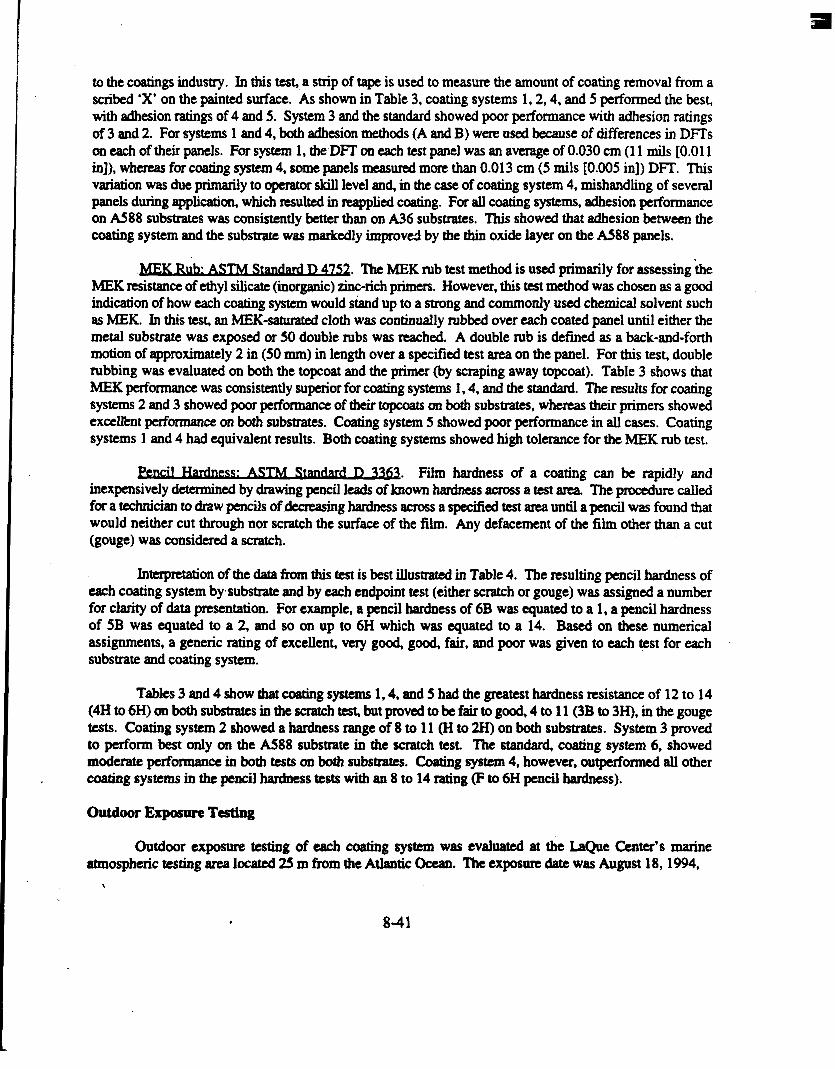
I to the coatings industry. In this test,, a strip of tape is used to measure the amount of coating removal from a scribed 'X' on the painted surface. As shown in Table 3, coating systems 1,2,4, and 5 performed the best, with adhesion ratings of 4 and 5. System 3 and the standard showed poor performance with adhesion ratings of 3 and 2. For systems 1 and 4, both adhesion methods (A and B) were used because of differences in DFTs on each of their panels. For system 1, the Dm on each test panel was an average of 0.030 cm (1 1 m i l s [0.011 in]), whereas for coating system 4, some panels measured more than 0.013 cm (5 mils [0.005 in]) Dm. This variation was due primarily to operator skill level and, in the case of coating system 4, mishandling of several panels during application, which resulted in reapplied casting. For all coating systems, adhesion performance on A588 substrates was consistently better than on A36 substrates. This showed that adhesion between the coating system and the substrate was markedly improvd by the thin oxide layer on the A588 panels.
D 472 . The MEK rub test method is used primarily for assessing 'the MEK resistance of ethyl silicate (inorganic) dnc-rich primers. However, this test method was chosen as a good indication of how each coating system would s b d up to a strong and commonly used chemical solvent such as MEK. In this test, an MEK-saturated cloth was continually rubbed over each coated panel until either the metal substrate was exposed or 50 double rubs was nached. A double mb is defined as a back-and-forth motion of approximately 2 in (50 mm) in length over a specified test area on the panel. For this test, double rubbing was evaluated on both the topcoat and the primer (by scraping away topcoat). Table 3 shows that MEK performance was consistently superior for coating systems 1.4, and the standard. The results for coating systems 2 and 3 showed poor perfonnance of their topcoats on both substrates, whereas their primers showed exceEnt perfomance on both substrates. Coating system 5 showed poor performance in all cases. Coating systems 1 and 4 had equivalent results. Both coating systems showed high tolerance for the MEK rub test.
7363. Film hardness of a coating can be rapidly and inexpensively determined by drawing pencil leads of known hardness across a test area The proaxlure called for a technician to draw pencils of decreasing hardness across a specified test area until apencil was found that would neither cut through nor scratch the surface of the film. Any defacement of the film other than a cut (gouge) was considered a scratch.
Intapmation of the data from this test is best illustrated in Table 4. The nsulting pencil hardness of each coating system bymbstrate and by each endpoint test (either scratch or gouge) was assigned a number for clarity of data presentation. For example, a pencil hardness of 6B was equated to a 1, a pencil hardness of 5B was equated to a 2, and so on up to 6H which was equated to a 14. Based on these numerical assignments, a generic rating of excellent, very good, good, fair, and poor was given to each test for each substrate and coating system.
Tables 3 and 4 show that mating systems 1,4, and 5 had the greatest hardness resistance of 12 to 14 (4Hto6H)anbothsubstratesinthescratchtesfbutprovedtobefairtogood,4to11(3Bto3H),inthegouge tests. Coating system 2 showed a hardness range of 8 to 11 (H to 2H) on both substrates. System 3 proved to perform best only on the A588 substrate in the scratch test. The standard, coating system 6, showed moderate perfonnance in both tests on both substrates. Coating system 4, however, outperformed all other coating systems in the pencil hardness tests with an 8 to 14 rating (F to 6H pencil hardness).
Outdoor Exposure Testing
Outdoor exposure testing of each coating system was evaluated a! the LaQuc Center's marine atmospheric testing a m locattd 25 m from the Atlantic Ocean. Tht exposure date was August 18,1994,
\
I 8-41

Table 4. Pencil Hardness Rating for Each Coating System
Coating system
Test result 1 2 * 3 4 5 6
A36-Scratch E G F E E G
A588-Scmtch VG G E E E VG
A36-Gouge G G F VG F F
E = Excellent (14); VG = Very Good (12-13); G = Good (8-1 I ) ; F = Fair (4-7); P = Poor (1-3). Values in parentheses are mean values of operators A, B, and C.
and the inspection date was December 1, 1994, for a total exposure period of 15 weeks. Orientation of the exposed panels was 30" facing the Ocean (east). Table 5 ranks each coating system by exposure test. Each test was assigned a point value on a scale of 0 to 10.
7 strate
'Mean I of th
Table 5. Ranking of Each Coating System ' (Outdoor Exposure Testing)
Coating system Gloss Creepage Rust Blisters Chalk Total Run&
1 8 10 10 10 10 48 I 2 0 7 10 10 10 37 6 3 5 7 10 10 10 42 3 4 10 4 10 10 10 44 2 5 8 6 8 10 10 42 3
6 (standard) 6 7 10 10 8 41 5
8 10 10 10 ' 10 48 1 . 0 7 10 10 10 ' 37 6 5 8 10 10 10 43 3 10 4 10 10 10 44 2
5 8 7 7 10 10 42 4 6 (standard) 6 8 10 10 8 42 4
rec operators. E
Only coating systems 1,3, and 4 outperformed the standard. Coating system 1 outperformed all other coatings and was shown to be the best performing in weathering durability. The following sections describe each test performed on each panel at the conclusion of exposure testing.
D 1414. A 5-cm (2-in) scribe was made on the lower half of each test panel according to the procedures in ASTM Standard D 1654 prior to exposure. The representative mean, maximum, and minimum of creepage, corrosion, or loss of paint extending from the scribe mark was recorded.
8-42

As illustrated in Table 5, coating systems 2, 3.5, and 6 showed creepage between 0.5 and 3.0 mm (1164 to 118 in) over the 3-month exposure period. Coating system 4 performed the worst with creepage between 3.0 and 7.0 mm (118 to 1/4 in). Interestingly, coating system 1 outperformed a l l other systems with zero creepage from the scribe. This could be due to the larger film thickness of a three-coating system versus the smaller film thicknesses of the other coating systems. In comparison to the standard, only coating system 1 showed superiority in paint retention at the scribe over the other coating systems.
-. The degree of rusting on each test panel was determined by the percent of the area rusted. These percentages were converted into a rust grade scale ranging from 0 to 10 as shown in Table 5. Only coating system 5 showed significant rusting. All other systems, including the standard, showed very little rusting.
S w D 714. The degree of blistering of each test panel, according to ASTM Standard D 7 14, was evaluated by comparing each exposed surface to a photographic reference standard. Reference standards were s e l e c t e d by ASTM in four steps corresponding to size on a numerical scale from 10 to 0, in which No. 10 represents no blistering. Blistering standard No. 8 represents the smallest size blister easily seen by the unaided eye. However, as illustrated in Table 5, no blistering occurred (10) on any of the six coating systems evaluated for either substrate.
D 4914 C-od C). By definition, chalking is the formation on a pigmented coating of a friable powder evolved from the paint film itself at, or just beneath, the surface. Method C was used for evaluating the degree of chalking on each test panel. Table 5 shows the results of chalking on substrates A36 and A588 by-coating system and by operator. A 10 indicates no film formation on the surface of the test panel. An 8 indicates a slight film formation. As shown, coating systems 1 through 5 outperformed system 6 with a 10 rating as compared to an 8 rating. No distinction can be made between each of coating systems 1 through 5.
D 523. Gloss measurements were taken with a Minolta Multi, Gloss 268, at a 60" orientation. Gloss measurements of each test panel were taken at three separate intervals: after the initial setup, before washing with water and a mild detergent solution, and after washing.
Table 6 reveals the same pattern for either substrate where the initial gloss for coating systems 1.4, and 6 were consistently higher than for systems 2, 3, and 5. With respect to gloss retention from initial setup to post-washing of the panels, coating systems 4 and 5 were the best, having relatively the same gloss for both substrates. However, coating system 2 was the only coating system to have an increase in gloss from initial setup to post-washing for both substrates. This was possibly due to additional curing and/or loss of VOCs or to the sloughing off during exposure of pigmentation within the paint system, which is typically added to achieve gloss specifications. Gloss for coating systems 3 and 6 decreased the most out of all systems. In comparison to the standard, coating systems 1 and 4 had the highest degree of gloss and the most gloss retention after exposure.
8-43
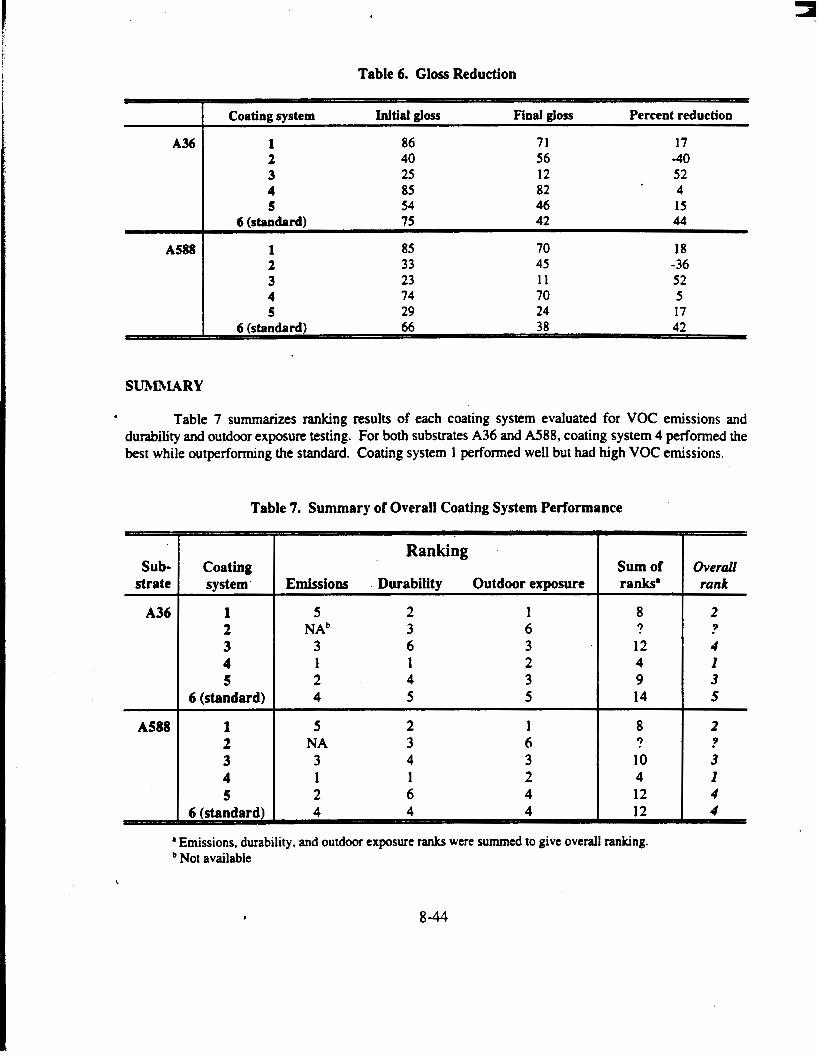
Table 6. Gloss Reduction
Coating system Initial gloss Final gloss Percent reduction
A36 2 40 56 -40 1 86 71 17
4 85 82 * 4 3 25 12 52
5 54 46 15 6 (standard) 75 42 44
AS88 1 85 70 18 2 33 45 -36 3 23 11 52 4 74 70 5 5 29 24 17
Table 7 summarizes ranking results of each coating system evaluated for VOC emissions and durability and outdoor exposure testing. For both substrates A36 and A588, coating system 4 performed the best while outperforming the standard. Coating system 1 performed well but had high VOC emissions.
Table 7. Summary of Overall Coating System Performance
Sub- strate
A36
Coating system'
1 2 3 4 5
6 (standard)
1 2 3 4 S
6&(standara
Ranking Sum of
Emissions Durability Outdoor exposure ranks'
5 2 N A ~ 3
3 6 1 1 2 4 4 5
8 ? 12 4 9 14
8-44
Overall rank
2
4 Z 3 5
2
3 Z 4 4
3
3
-

CONCLUSIONS
The objective of the evaluation was to compare VOC emissions, as applied, of alternative low-vw industrial maintenance coating system to a standard. The results of performance testing in conjunction with the 3-month outdoor exposure test were inconclusive as to a coating system's service life. However, Some conclusions can be made from this evaluation as to the degree of VOC emissions reduction of the coating systems tested versus the standard.
The tables and figures presented in this paper show that VOC emissions were dependent on several factors, including the VOC content of each coating layer of each coating system, the number of coating layers per system, and the m o u n t of coating applied (as recommended by the manufacturer). However, these tests have shown that the solvent-bome, twocomponent polysiloxane epoxy and the multi-layer, solvent-borne polyurethane coating systems were better than the standard, a solvent-borne alkyd.
0 The solvent-borne, twocomponent polysiloxane epoxy coating system achieved excellent ratings in most categories of testing and was the lowest VOC content coating (by a factor of 4 versus the standard).
0 Although the multi-layer, solvent-borne polyurethane coating system had higher VOC elinissions than the standard, it is apparent from the emissions data that number of coatings and film thickness played a major role in producing such high emissions. Thus, a low VOC content for a coating does not necessarily mean lower emissions for the system as applied. It did, however, perform as well as or better than the standard in almost all cases.
0 Thus, as a result of the severity of this evaluation test, not only would implementation of all of these alternative coating systems, over time, d u c e emissions but these systems would also excel in the field under light or moderate conditions as compand to the standard coating system.
REFERENCES
1. Reisch, Marc S., "Paints and Coatings," Chemical d Engineering N e w pages 34-61, October 18, 1993.
2 . American Society for Testing and Materials. 1994. Annual Book of American Sociery for Testing and Materials. Volumes 6.01.6.02.6.03, and 6.04. Philadelphia, Pennsylvania.
3 . Emission Measurement Technical Information Center. May 1993. NSPS Test Method, Method 24 - Determination of Volatile Mancr Content, Water Conrent, Density, VolumeSplids, and Weight Solids ofSurface Coatings. Research Triangle Park, North Carolina.
8-45