Embed Size (px)
Citation preview

ISSN: 2278 – 1323 International Journal of Advanced Research in Computer Engineering & Technology (IJARCET)
Volume 1, Issue 7, September 2012
167 All Rights Reserved © 2012 IJARCET
Abstract— This work provides the knowledge
about the working of Gabor filters for ten
different types of images. A comparative study is
based on the output of the noisy and the filtered
images using Gabor filter. This process of getting
the noisy images is based on three types of
images: Gaussian, Poisson and Speckle. Finally
an algorithm is developed that performs all the
filtering techniques on the input image and the
statistical parameters are calculated as per the
comparison between output and input images.
These statistical parameters are displayed
graphically and they are compared for both the
noisy and the filtered images. For the evaluation
of the performance of Gabor filters statistical
parameters like signal to noise ratio, correlation
coefficient and Structure similarity are used and
the MATLAB codes required in calculating these
parameters are developed. These parameters are
used to calculate the image quality of the output
image obtained from Gabor filter, based on the
values of these parameters the results of all the
output images is discussed
Index Terms—Gabor Filter, Gaussian, Poisson, MATLAB.
INTRODUCTION
Manuscript received June, 2012.
D.K. Somwanshi , Department of EIC and Electrical
Engineering Jagannath Gupta Institute Of Engineering &
Technolgy, Sitapura ,Jaipur. Jaipur, India.
Ravindra Panchariya, Department Of Electronics
Instrumentation Control Engineering, Govt. Engineering College
Bikaner,,India,.
Abhay Krishan, Department of Applied Electronics &
Instrumentation, RKGIT, Ghaziabad, India.
This paper work is carried out to study the analysis
of Gabor filtered output images and the noisy images.
For this analysis, we are testing the values of various
quality parameters like SNR, Correlation and SSIM.
For getting the noisy images, we are using three types
of noises, Gaussian, Poisson and Speckle noises. For
segmentation purposes, we are selecting a particular
area of the original images and this area is different for
all the images. For segmentation analysis, we are
using the comparison of three output images as:
Original image segmentation, Gabor filtered output
segmentation and noised output segmentation. These
three output images are having the same dimensions
for their comparison. The various parameters of the
Gabor filter play a major role in deciding the output
image. The size, phase, orientation and frequency of
the output image are selected by the Gabor filter. The
image features are measured by employing an
appropriate Gabor filter with adaptively chosen size,
orientation, frequency and phase for each pixel. An
image property called phase divergence is used for the
selection of the appropriate filter size. Characteristic
features related to the change in brightness, texture
and position are extracted for each pixel at the selected
size of the filter. 2-D Gabor filter is easier to tune the
direction and radial frequency band-width, and easier
to tune center frequency, so they can simultaneously
get the best resolution in spatial domain and frequency
domain. Gabor filter outputs can be modeled as
Gaussian’s and develop algorithm for selecting
optimal filter parameters.
EVALUATION OF GABOR FILTER
PARAMETERS FOR IMAGE
ENHANCEMENT AND SEGMENTATION
D. K. SOMWANSHI 1, R . PANCHARIYA
2 , ABHAY KRISHAN
3

168
GABOR FILTERS
A Gabor filter is a linear filter whose impulse
response is defined by a harmonic function
multiplied by a Gaussian function. Because of the
multiplication-convolution property (Convolution
theorem), the Fourier transform of a Gabor filter's
impulse response is the convolution of the Fourier
transform of the harmonic function and the Fourier
transform of the Gaussian function. Gabor filters
are directly related to Gabor wavelets, since they
can be designed for number of dilations and
rotations
However, in general, expansion is not applied for
Gabor wavelets, since this requires computation of
biorthogonal wavelets, which may be very
time-consuming. Therefore, usually, a filter bank
consisting of Gabor filters with various scales and
rotations is created. The filters are convolved with
the signal, resulting in a so-called Gabor space.
This process is closely related to processes in the
primary visual cortex. The Gabor space is very
useful in e.g., image processing applications such
as iris recognition and fingerprint recognition.
Relations between activations for a specific spatial
location are very distinctive between objects in an
image. Furthermore, important activations can be
extracted from the Gabor space in order to create a
sparse object representation. The Gabor Filters
have received considerable attention because the
characteristics of certain cells in the visual cortex of
some mammals can be approximated by these
filters. In addition these filters have been shown to
posses optimal localization properties in both
spatial and frequency domain and thus are well
suited for texture segmentation problems. Gabor
filters have been used in many applications, such as
texture segmentation, target detection, fractal
dimension management, document analysis, edge
detection, retina identification, image coding and
image representation. A Gabor filter can be viewed
as a sinusoidal plane of particular frequency and
orientation, modulated by a Gaussian envelope.
),(),(),( yxgyxsyxh
),( yxs : Complex sinusoid
),( yxg : 2-D Gaussian shaped function, known as
envelope
)(2
1
)(2
2
2
2
2
00
2
1),(
),(
yx
yx
yvxuj
eyxg
eyxs
where ),( yxs is a complex sinusoid, known as
the carrier, and ),( yxg is a 2-D Gaussian-shaped
function, known as the envelope.
The complex sinusoid is defined as follows,
)))(2(exp(),( 00 Pyvxujyxs
where ),( 00 vu and P define the spatial frequency
and the phase of the sinusoid respectively. This
sinusoid can be represented as two separate real
functions, conventionally allocated in the real and
imaginary part of a complex function.
The real part and imaginary part of this sinusoid
are
))(2sin()),(Im(
))(2cos()),(Re(
00
00
Pyvxuyxs
Pyvxuyxs
The parameters 0u and 0v define the spatial
frequency of the sinusoid in Cartesian
coordinates. This spatial frequency can also be
expressed in polar coordinates as magnitude F 0
and direction 0 :
i.e.
000
000
0
01
0
2
0
2
00
sin
cos
)(tan
Fv
Fu
u
v
vuF

ISSN: 2278 – 1323 International Journal of Advanced Research in Computer Engineering & Technology (IJARCET)
Volume 1, Issue 7, September 2012
169 All Rights Reserved © 2012 IJARCET
The real and imaginary parts of a complex sinusoidal
Using this representation, the complex sinusoid is
)))sincos(2(exp(),( 000 PyxFjyxs
The Gaussian envelope The Gaussian envelope looks as follows:
)))()((exp(),( 2
0
22
0
2
rrr yybxxaKyx
where ),( 00 yx is the peak of the function , a and
b are scaling parameters of the Gaussian, and the
r subscript stands for a rotation operation such
that
cos)(sin)()(
sin)(cos)()(
000
000
yyxxyy
yyxxxx
r
r
A Gaussian envelope
MATERIALS AND METHODS
Images as Inputs
Gabor filters needs some types of images as the
input. These images require the process of
computer algorithms as per the input image.
These computer algorithms yield two types of
images from Computer Algorithm: noisy image
and magnitude image. The magnitude image is
comparing with the noisy image, which gives the
advantages of Gabor filters in various parameters.
There are ten original standard images:-

170
ALGAE.tif BLANKET.tif
COUNTING.tiff GRAY.tiff
JUNGLE.tiff
MOON.tiff

ISSN: 2278 – 1323 International Journal of Advanced Research in Computer Engineering & Technology (IJARCET)
Volume 1, Issue 7, September 2012
171 All Rights Reserved © 2012 IJARCET
LENA.JPG TESTPAT.tiff
TOPVIEW.tiff
NOISES Gaussian noise- This type of noise adds
normal distributed noise to the original
image. The noise is independent of the
image it is applied to. The value of the
pixel is altered by the additive Gaussian
noise as nlkxlkJ ),(),(
Where n is the noise, ),0(~ vNn ,
being distributed normally with variance
v. the noisy pixels which are generated
are anywhere between black and white,
ULTRASONIC.tif
distributed according to the Gaussian
curve. The width of the curve is adjusted
with the mean and the variance
parameter.
Poisson noise- Poisson noise is
generated from the data instead of
adding artificial noise to the data. If I,
the original image, is double precision,
then input pixel values are interpreted as
means of Poisson distributions scaled up
by 121e . Poisson noise generates a
noise sequence of integer numbers
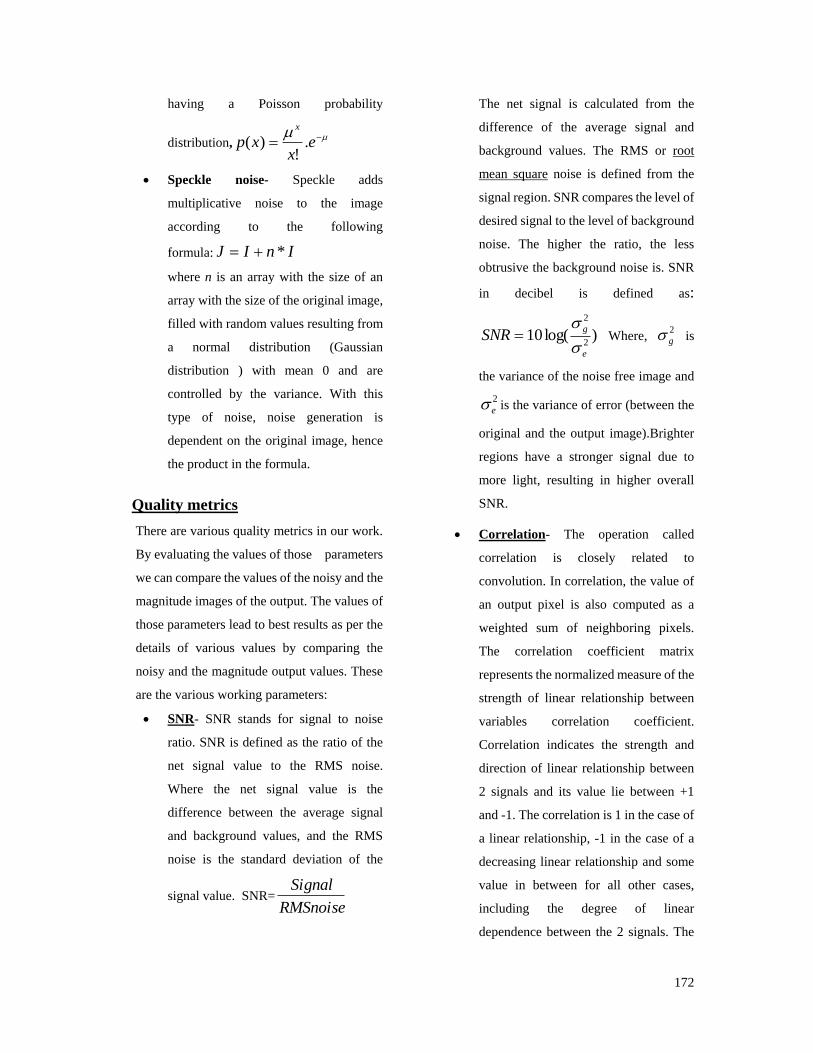
172
having a Poisson probability
distribution, e
xxp
x
.!
)(
Speckle noise- Speckle adds
multiplicative noise to the image
according to the following
formula: InIJ *
where n is an array with the size of an
array with the size of the original image,
filled with random values resulting from
a normal distribution (Gaussian
distribution ) with mean 0 and are
controlled by the variance. With this
type of noise, noise generation is
dependent on the original image, hence
the product in the formula.
Quality metrics
There are various quality metrics in our work.
By evaluating the values of those parameters
we can compare the values of the noisy and the
magnitude images of the output. The values of
those parameters lead to best results as per the
details of various values by comparing the
noisy and the magnitude output values. These
are the various working parameters:
SNR- SNR stands for signal to noise
ratio. SNR is defined as the ratio of the
net signal value to the RMS noise.
Where the net signal value is the
difference between the average signal
and background values, and the RMS
noise is the standard deviation of the
signal value. SNR=RMSnoise
Signal
The net signal is calculated from the
difference of the average signal and
background values. The RMS or root
mean square noise is defined from the
signal region. SNR compares the level of
desired signal to the level of background
noise. The higher the ratio, the less
obtrusive the background noise is. SNR
in decibel is defined as:
)log(102
2
e
gSNR
Where,
2
g is
the variance of the noise free image and
2
e is the variance of error (between the
original and the output image).Brighter
regions have a stronger signal due to
more light, resulting in higher overall
SNR.
Correlation- The operation called
correlation is closely related to
convolution. In correlation, the value of
an output pixel is also computed as a
weighted sum of neighboring pixels.
The correlation coefficient matrix
represents the normalized measure of the
strength of linear relationship between
variables correlation coefficient.
Correlation indicates the strength and
direction of linear relationship between
2 signals and its value lie between +1
and -1. The correlation is 1 in the case of
a linear relationship, -1 in the case of a
decreasing linear relationship and some
value in between for all other cases,
including the degree of linear
dependence between the 2 signals. The

ISSN: 2278 – 1323 International Journal of Advanced Research in Computer Engineering & Technology (IJARCET)
Volume 1, Issue 7, September 2012
173 All Rights Reserved © 2012 IJARCET
closer the coefficient is to either -1 or
+1, the stronger the correlation between
the signals.
22 )ˆˆ()(
)ˆ)((
gggg
ggggCOC
Where gg ˆ& are the original and
noised images and gg ˆ& are the
means of the original and the noised
images.
SSIM- SSIM stands for structural
SIMilarity. The SSIM index is a method
for measuring the similarity between
two images. The SSIM index is a full
reference metric, in other words, the
measuring of image quality based on an
initial uncompressed or distortion-free
image as reference. SSIM is designed to
improve on traditional methods like
PSNR and MSE, which have proved to
be inconsistent with human eye
perception. The SSIM metric is
calculated on various windows of an
image. The measure between two
windows of size N X N x and y is:
))((
)cov2)(2(),(
2
22
1
22
21
cc
ccyxSSIM
yxyx
xyyx
with
x the average of x ;
y the average of y ;
2
x the variance of x ;
2
y the variance of y ;
covxy the covariance of y ;
c1 = (k1L)2, c2 = (k2L)2 two
variables to stabilize the
division with weak
denominator ;
L the dynamic range of the
pixel-values ;
k1 = 0.01 and k2 = 0.03 by
default.
Working Algorithm using MATLAB
This working Algorithm is the way of
doing our work. This is a step by step
procedure that how we implement the
images and how we evaluate the
working parameters. The main
algorithm,

174
followed in order to fulfill the aim of our
work, is as follows:
Step 1:
Read the original standard image
(ALGAE.tif, BLANKET.tif,
COUNTING.tiff, GRAY.tiff,
JUNGLE.tiff, LENA.jpg, MOON.tiff,
TESTPAT.tiff, TOPVIEW.tiff,
ULTRASONIC.tif)
Step 2:
Apply the Gabor Filter to the original
standard image and storing the mainly
outputs for the Noisy image and the
Magnitude image.
Step 3:
Resize the output noisy and output
magnitude images as per the original
standard image size as the size of the
original image may be. To evaluate
various parameters from the original and
the output image it is necessary to
maintain the same size of the images.
Step 4:
Before calculating the values of the
various parameters, it is necessary to
convert that output image to
1-Dimensional image because that
standard image doesn’t work by using
the parameters formula in their original
form.
Step 5:
Calculate the value of the quality metrics
parameters by using the MATLAB
command:
SNR (I, J), Correlation (I, J), [mssim
ssim_map] = ssim_index (I, J)
This command gives the values of the
SNR, Correlation and SSIM where I is
the original image and J is the output
image.
Step 6:
After run of all the parameters, all the
values of parameters are calculated by
changing the Variances and changing
the frequency of the Gabor filters. The
best value results are collected and
plotted all with respect to their particular
Variances.
RESULTS:- Algae.tif:-

ISSN: 2278 – 1323 International Journal of Advanced Research in Computer Engineering & Technology (IJARCET)
Volume 1, Issue 7, September 2012
175 All Rights Reserved © 2012 IJARCET
For Gaussian noise, SNR gives best result for the
variance of 0.3, correlation coefficient gives best
result for the variance of 0.1. Similarly, SSIM
gives best result for the variance of 0.1. For
Poisson noise, SNR gives best result for the
variance of 0.5, correlation coefficient gives best
result for the variance of 0.1. Similarly, SSIM
gives best result for the variance of 0.1. For
Speckle noise, SNR gives best result for the
variance of 0.3, correlation coefficient gives best
result for the variance of 0.1. Similarly, SSIM
gives best result for the variance of 0.1.
Blanket.tif:-
For Gaussian noise, SNR gives best result for the
variance of 0.1, correlation coefficient gives best
result for the variance of 0.3, SSIM gives best
result for the variance of 0.7. For Poisson noise,
SNR gives best result for the variance of 0.1,
correlation coefficient gives best result for the
variance of 0.7. Similarly, SSIM gives best result
for the variance of 0.7. For Speckle noise, SNR
gives best result for the variance of 0.1,
correlation coefficient gives best result for the
variance of 0.3. SSIM gives best result for the
variance of 0.5.
Counting.tiff:-
For Gaussian noise, SNR gives best result for the
variance of 0.3, correlation coefficient gives best
result for the variance of 0.7 and SSIM gives best
result for the variance of 0.5.
For Poisson noise, SNR gives best result for the
variance of 0.7, correlation coefficient gives best
result for the variance of 0.5. Similarly, SSIM
gives best result for the variance of 0.5. For
Speckle noise, SNR gives best result for the
variance of 0.1, correlation coefficient gives best
result for the variance of 0.5 and SSIM gives best
result for the variance of 0.3.
Gray.tiff:-
For Gaussian noise, SNR gives best result for the
variance of 0.1, correlation coefficient gives best
result for the variance of 0.3 and SSIM gives best
result for the variance of 0.1.
For Poisson noise, SNR gives best result for the
variance of 0.3, correlation coefficient gives best
result for the variance of 0.7 and SSIM gives best
result for the variance of 0.1.
For Speckle noise, SNR gives best result for the
variance of 0.1. Similarly, correlation coefficient
gives best result for the variance of 0.1 and SSIM
gives best result for the variance of 0.1.
Jungle.tiff:-
For Gaussian noise, SNR gives best result for the
variance of 0.5. Similarly, correlation coefficient
gives best result for the variance of 0.5 and SSIM
gives best result for the variance of 0.3. For
Poisson noise, SNR gives best result for the
variance of 0.7, correlation coefficient gives best
result for the variance of 0.5 .Similarly, SSIM
gives best result for the variance of 0.5. For
Speckle noise, SNR gives best result for the
variance of 0.5. Similarly, correlation coefficient
gives best result for the variance of 0.5 and SSIM
gives best result for the variance of 0.3.
Lena.jpg:-
For Gaussian noise, SNR gives best result for the
variance of 0.3, correlation coefficient gives best
result for the variance of 0.5 and SSIM gives best
result for the variance of 0.3.
For Poisson noise, SNR gives best result for the
variance of 0.3, correlation coefficient gives best

176
result for the variance of 0.7 and SSIM gives best
result for the variance of 0.3.
For Speckle noise, SNR gives best result for the
variance of 0.1, Correlation coefficient gives best
result for the variance of 0.3 and SSIM gives best
result for the variance of 0.1.
Moon.tiff:-
For Gaussian noise, SNR gives best result for the
variance of 0.1, correlation coefficient gives best
result for the variance of 0.3 and SSIM gives best
result for the variance of 0.1.
For Poisson noise, SNR gives best result for the
variance of 0.5, correlation coefficient gives best
result for the variance of 0.7 and SSIM gives best
result for the variance of 0.5.
For Speckle noise, SNR gives best result for the
variance of 0.1. Correlation coefficient gives best
result for the variance of 0.3. Similarly, SSIM
gives best result for the variance of 0.1.
Testpat.tiff:-
For Gaussian noise, SNR gives best result for the
variance of 0.1. Similarly, correlation coefficient
gives best result for the variance of 0.1 and SSIM
gives best result for the variance of 0.1. For
Poisson noise, SNR gives best result for the
variance of 0.5. Similarly, correlation coefficient
gives best result for the variance of 0.5 and SSIM
gives best result for the variance of 0.5. For
Speckle noise, SNR gives best result for the
variance of 0.1. Correlation coefficient gives best
result for the variance of 0.7 and SSIM gives best
result for the variance of 0.3.
Topview.tiff:-
For Gaussian noise, SNR gives best result for the
variance of 0.3, correlation coefficient gives best
result for the variance of 0.5. Similarly, SSIM
gives best result for the variance of 0.5. For
Poisson noise, SNR gives best result for the
variance of 0.5, correlation coefficient gives best
result for the variance of 0.7. Similarly, SSIM
gives best result for the variance of 0.7. For
Speckle noise, SNR gives best result for the
variance of 0.1. Correlation coefficient gives best
result for the variance of 0.5. Similarly, SSIM
gives best result for the variance of 0.1.
Ultrasonic.tif:-
For Gaussian noise, SNR gives best result for the
variance of 0.1, correlation coefficient gives best
result for the variance of 0.5. Similarly, SSIM
gives best result for the variance of 0.5. For
Poisson noise, SNR gives best result for the
variance of 0.1, correlation coefficient gives best
result for the variance of 0.7. Similarly, SSIM
gives best result for the variance of 0.7. For
Speckle noise, SNR gives best result for the
variance of 0.1. Correlation coefficient gives best
result for the variance of 0.7. Similarly, SSIM
gives best result for the variance of 0.7.
Effect of Gabor filter for image
segmentation These are the comparison of Image segmentation
for various images. There are three segmentation
results for every image. These are the
segmentation of Original image and the best
values output for Noisy and filtered images.

ISSN: 2278 – 1323 International Journal of Advanced Research in Computer Engineering & Technology (IJARCET)
Volume 1, Issue 7, September 2012
177 All Rights Reserved © 2012 IJARCET
Original Image Filtered Image Noisy image
Original Image Filtered Image Noisy image
Original Image Filtered Image Noisy Image

178
Original Image Filtered Image Noisy Image
Original Image Filtered Image Noisy Image
Original Image Filtered Image Noisy Image
Original Image Filtered Image Noisy Image

ISSN: 2278 – 1323 International Journal of Advanced Research in Computer Engineering & Technology (IJARCET)
Volume 1, Issue 7, September 2012
179 All Rights Reserved © 2012 IJARCET
Original Image Filtered Image Noisy Image
Original Image Filtered Image Noisy Image
After all the image segmentation has been done,
we observe that the images that contain noises not
gave good segmentation results after applying
Gabor filters. The rest images that do not have
noisy are given best results after applying Gabor
filters as compared to the original images. In these
figures, Gabor filtered output images give best
results as compared to the original image
segmentation. And noisy images segmentation
clearly indicates bad segmentation as compared
to the other two images (original image and
Gabor filtered output image).
CONCLUSION AND FUTURE
SCOPE
CONCLUSION
This work presents evaluation of Gabor filter’s
parameters for various noisy and filtered images
using Gabor filters. A lot of combinations of these
noisy and filtered images have been obtained to
find the best values as per the analysis of those
two images of the quality metrics, SNR,
Correlation and SSIM. The input image formats
that have been used in this work are TIFF, TIF
and JPEG and the output image format is having
JPEG.
The analysis of all the obtained experimental
results, demonstrates that the image noise is
significantly reduced after applying Gabor filter.
The parameters which are evaluated were
Gabor-filtered output images give best output
values for all the quality metrics and also give the
best results for the image segmentation.
There are ten images in this work. For the analysis
of results, we using the variances values (0.1, 0.3,
180
0.5, 0.7) and for some frequency values (300,
500, 700, 900, 1500)Hz. Each image gives best
response for some particular variances values and
for some particular frequency values.
Of all the frequency values that we are
using, the frequency value 900 Hz gives
the maximum best values for results.
The frequency values 300, 500 and 700
Hz gives nearly around the same amount
of best results.
The frequency value 1500 Hz gives the
least amount of best results.
For all the noises that we are used in this thesis
work, each noise will give some different
response from the other noises.
For Gaussian noise, the comparison of
noisy and filtered images give the best
results mostly for the variances of 0.1
and 0.3.
For Poisson noise, the comparison of
noisy and filtered images give the best
results for all the working variances.
For Speckle noise, the comparison of
noisy and filtered images give the best
results for the variances of 0.1.
For segmentation results, we can analyze all the
three figures in the same plane. These three
figures are: segmentation of original image,
segmentation of both the noisy and filtered
images that are different for all the ten images that
gives best results as per the comparison between
noisy and filtered images.
FUTURE SCOPE
The application of Gabor filters has been growing
at a very fast rate. Gabor filters can be used for
image segmentation, weed image classification,
Palmprint recognition, Texture segmentation, for
the illumination invariant recognition of color
texture, for an automatic inspection system for
textile fabrics and many places.
This work can be further done in the
field of texture image segmentation.
And also works for various other
parameters like MSE etc.
Moreover, for future work we can use
various AI techniques like Radon
neural network, Fuzzy, Adaptive, GA
in order to attain the best output
without performing calculations for
each and every combination. This
work can be done by using this
technique will lead to more efficiency
and less tedious work.
This work can be done using the
technique of frequency domain
analysis using fractals, FFTs.

ISSN: 2278 – 1323 International Journal of Advanced Research in Computer Engineering & Technology (IJARCET)
Volume 1, Issue 7, September 2012
181 All Rights Reserved © 2012 IJARCET
REFERENCES
1. Z.-Q. Liu, R.M. Rangayyan and C.B.Frank,”
Analysis directional features in images using Gabor
filters”pp.68-74, 1990 IEEE.
2. Jiang Wen, You Zhisherg and Li Hui,”Segment the
Metallograph Images Using Gabor
Filter”pp.25-28,1994 International symposium on
speech, Image Processing and Neural
Networks,13-16 April 1994,Hong Kong.
3. Richard Buse and Zhi-Qiang Liu,”Feature
extraction and analysis of handwritten words in
Grey-scale images using Gabor filters”pp.164-168,
1994 IEEE.
4. Andreas Teuner, Olaf Pichler and Bedrich J.
Hosticka,” Unsupervised Texture Segmentation of
Image Using Tuned Matched Gabor fiters”, IEEE
transactions on image processing, June 1995.
5. Shuzo Yamamoto, Yoshikazu Nakajima, Shinichi
Tamura, Yoshinobu Sato and Seiyo Harino,”
Extraction of fluorescent dot traces from a scanning
Laser Opthalmoscope Image sequence by
Spatio-Temporal Image analysis:Gabor Filter and
Radon Transform Filtering”, IEEE transactions on
biomedical engineering, November 1999.
6. Ian R Fasel, Marian S Barlett and Javier R
Movellan,” A comparison of Gabor filter methods
for automatic detection of Facial landmarks”, fifth
IEEE international conference on automatic face
and Gesture recognition, 2002.
7. C.Klimanee and DT Nguyen,” On the design of 2-D
Gabor Filtering of Fingerprint Images”, IEEE,
2004.
8. Rong Lu and Yi Shen,” Image segmentation Based
on Random Neural Network Model and Gabor
filters” proceedings of 2005 IEEE engineering in
medicine and biology 27th annual conference.
9. Ying-Chun Li, Zhan-Chun Li, Yun-Huan Mei and
Jian-Xin Zhang,” detecting algorithms based Gabor
in Microscopic image” proceedings of the fourth
International conference on machine learning and
cybernetics, Guangzhou, August 2005.
10. Hany Ayad Bastawrous, Takuya Fukumoto,
Norihisa Nitta and Masaru Tsudagawa,” detection
of ground glass opacities in lung CT images using
Gabor filters and neural networks”, instrumentation
and measurement technology conference Ottawa,
Canada, May 2005.
11. Hong Wei and Marc Bartels,” Unsupervised
segmentation Using Gabor wavelets and statistical
features in LIDAR Data analysis”, Proceedings of
the 18th international conference on pattern
recognition, 2005.
12. K. L. Mak and P. Peng,” An automated inspection
system for textile fabrics based on Gabor filters”,
Department of Industrial and Manufacturing
Systems Engineering, The University of
Hong-Kong, February 2007.
13. Mohammed Al-Rawi and Jie Yang,” Using Gabor
Filter for the illumination invariant recognition of
color texture”, Institute of Image processing and
Pattern recognition, Shanghai Jiao Tong University,
PR China, December 2007.
14. Jesmin F.khan, Reza R. Adhani and Sharif M.A.
Bhuiyan,” A customized Gabor filter for
unsupervised color image segmentation”,
Department of Electrical and Computer
Engineering, University of Alabama in Huntsville,
USA, 2008.
15. Xin Pan and Qiu-Qi Ruan,” Palmprint recognition
using Gabor-based local invariant features”,
Institute of information science, Beijing Jiaotong
University, PR China, 2008.
16. J. Bossu, Ch. Gee, G. Jones and F.Truchetet,”
Wavelet transform to discriminate between crop and
weed in perspective agronomic images”, 21 Bld
Olivier de serres, France, 2008.
17. Asnor Juraiza Ishak, Aini Hussain and Mohd
Marzuki Mustafa,” Weed image classification using
Gabor wavelet and gradient field distribution”,
Department of Electrical, Electronic and Systems
Engineering, Faculty of Engineering and built
environment,University Kebangsaan Malaysia,
Malaysia 2008.
18. Minqin Wang, Guoqiang Han, Yongqiu Tu, Guohua
Chen and Yuefang Gao,” Unsupervised Texture
Image segmentation Based on Gabor Wavelet and
multi-PCNN”, School of computer Science and
Engineering, South China University of
Technology, China 2008.
19. Gholam Ali Rezaei Rad and Kaveh Samiee,” Fast
and modified Image segmentation Method Based on
Active Contours and Gabor filter” Electrical
Engineering Department of Iran University of
Sciences and Technology, 2008.
20. “Natural Coding of Tactile Texture: Comparison of
Spatial and Temporal Mechanics for roughness
Perception”, Charles E. Connor and Kenneth O.
Johnson, the Journal of Neuroscience, September
1992.
21. Rafael C.Gonzalez, Richard E.Woods and Steven
L.Eddins, “Digital Image Processing Using
MATLAB”, Pearson Education (Singapore) Pte
Ltd., Indian Branch, 482 F.I.E. Patparganj, Delhi
110092, India, 2004.
22. Javier R. Movellan, “Tutorials on Gabor Filters”,
pp.1-20,GNU Free documentation License
1.1,Kolmogorv Project,2002