Embed Size (px)
Citation preview

Clemson UniversityTigerPrints
All Theses Theses
5-2016
Evaluation of an Inexpensive Sensor to MeasureSoil ColorRoxanne StiglitzClemson University, [email protected]
Follow this and additional works at: https://tigerprints.clemson.edu/all_theses
This Thesis is brought to you for free and open access by the Theses at TigerPrints. It has been accepted for inclusion in All Theses by an authorizedadministrator of TigerPrints. For more information, please contact [email protected].
Recommended CitationStiglitz, Roxanne, "Evaluation of an Inexpensive Sensor to Measure Soil Color" (2016). All Theses. 2367.https://tigerprints.clemson.edu/all_theses/2367

EVALUATION OF AN INEXPENSIVE SENSOR
TO MEASURE SOIL COLOR
A Thesis
Presented to
the Graduate School of
Clemson University
In Partial Fulfillment
of the Requirements for the Degree
Masters of Science
Forest Resources
by
Roxanne Stiglitz
January 2016
Accepted by:
Dr. Elena Mikhailova, Committee Chair
Dr. Christopher Post
Dr. Mark Schlautman

ii
ABSTRACT
Soil color determination can be subjective due to environmental conditions and
human error. The objectives of this study were to examine the precision of a relatively
inexpensive color sensor (NixTM Pro); to compare soil color measurements using this
color sensor to human determination by soil science professionals using the standard
Munsell Color Chart; and to compare the accuracy of this color sensor to a laboratory
standard colorimeter (Konica Minolta CR-400). Sensor measurements were compared to
the soil color chart by converting the Nix Pro values to Munsell soil color codes using
BabelColor conversion software. Thirty-one Cecil (Fine, kaolinitic, thermic Typic
Kanhapludults) soil samples were collected and tested for color. Munsell color codes
were converted into cyan, magenta, yellow, and black (CMYK) color values, and the Nix
sensor’s scan results were tested against predetermined Munsell color values and
colorimeter CMYK color values using correlation analysis for all treatments. Nix Pro
Color Sensor was precise in soil color determination and it was more accurate than the
Munsell Color Chart and comparable to the Konica Minolta CR-400 for both dry and
moist soil. The Munsell Color Chart was accurate compared to the Konica Minolta CR-
400 in dry soil, but it was less accurate in moist soil. The Nix Pro Color Sensor can be a
successful tool to measure soil color in the standard Munsell color codes and this study
presents a step-by-step method for converting sensor measurements to the standard
Munsell color codes.
Keywords: colorimetry, iron, Munsell Color Chart, soil color coordinates, Ultisols
iii
DEDICATION
This thesis is dedicated to Corey Stiglitz, Helen and Ashton Tennant, and Robin and
Rocky Floyd.
iv
ACKNOWLEDGEMENTS
Dr. Ksenija Gasic (Department of Plant and Environmental Sciences, Clemson
University) provided access to the Konica Minolta CR-400 colorimeter. Thanks to
committee members Dr. Elena Mikhailova, Dr. Christopher Post, and Dr. Mark
Schlautman. In addition, thanks to Dr. Julia Sharp for her help and advice. Clemson
University – United States provided funding for this study; Technical Contribution No.
6304 of the Clemson University Experiment Station. This material is based upon work
supported by NIFA/USDA, under Project number SC-1700452.

v
TABLE OF CONTENTS
TITLE PAGE……………………………………………………………………………...i
ABSTRACT……………………………………………………………………………....ii
DEDICATION…………………………………………………………………………....iii
ACKNOWLEDGMENTS………………………………………………………………..iv
LIST OF FIGURES………………………………………………………………………vi
LIST OF TABLES……………………………………………………………………….vii
CHAPTER
I. Evaluation of an inexpensive sensor to measure soil color………………...1
Introduction……………………………………………………………..1
Materials and methods………………………………………………….5
Results and discussion……..…………………………..……………...11
Conclusions……………………………………………………………16
APPENDICES…………………………………………………………………………...18
A: Figures………………………………………………..…………………………..18
B: Tables…………………………………………………………………………….22
REFERENCES…………………………………………………………………………..29

vi
LIST OF FIGURES
Figure Page
1 Soil profile for practice soil pit 2 used during 2014 Southeast Regional
Collegiate Soils Contest (October 5-9, 2014)………………………………19
2 Nix Pro Color Sensor CMYK color code means vs. Nix Pro Color Sensor
CMYK scan sets in dry and moist soil and mean CMYK color codes in
dry vs. moist soil (n = 31 soil samples for each set, corresponding
correlation (r-value) and significance (p-value) data are reported in
Tables 2 and 3)……………………………………………………………...20
3 Munsell Color Chart codes converted to CMYK color codes and
compared to the Nix Pro Color Sensor CMYK color codes and Konica
Minolta CR-400 conversion to CMYK color codes in dry and moist soil
(n = 31 soil samples for each set; corresponding correlation (r-value) and
significance (p-value) data are reported in Tables 2 and 3)…………….…...21

vii
LIST OF TABLES
Table Page
1 Selected soil properties for practice soil pit 2……………………………23
2 Correlation (r-value) between Nix Pro CMYK color codes: Dry
versus moist soil (n = 31 soil samples in each set, all
p-values < 0.001)………………………………………………………..24
3 Correlation (r-value) between Munsell Color Chart, Nix Pro, and
Konica Minolta CR-400: Mean CMYK color codes in dry and
moist soil (n = 31 soil samples in each set)……………………………..25
4 Munsell Color Chart, Nix Pro Color Sensor, and Konica Minolta
CR-400 color code mean (standard deviation) for each of the soil
horizons of practice soil pit 2 in the CMYK (M=magenta,
Y= yellow, K=black) codes……………………………………………...26
5 Munsell Color Chart, Nix Pro Color Sensor, and Konica Minolta
CR-400 color codes for each of the soil horizons of practice soil
pit 2 in the Munsell Color Chart notation………………………………..27
6 Comparison of color matches (hue, value, chroma) between
Munsell Color Chart, Nix Pro Color Sensor, and Konica Minolta
CR-400 color…………………………………………………………......28

1
CHAPTER ONE
Evaluation of an inexpensive sensor to measure soil color
INTRODUCTION
Soil color is used in soil classification and the Munsell Color Chart is the standard
method of color determination (Thompson et al., 2013). Munsell Color Charts allow
users to identify soil colors ranging from reds to blues (Miller, 1958), and identify iron
and humus content in the soil (Sugita and Marumo, 1996). However, limitations in using
the Munsell Color Chart include: (1) user sensitivity (e.g. colorblindness, subjectivity)
(Lusby et al., 2013; Mouazen et al., 2007), (2) environmental conditions (e.g. moisture
content, lighting conditions) (Mouazen et al., 2007), and (3) difficult statistical analysis
(e.g. limited color chips, cylindrical color coordinates) (Kirillova et al., 2014). These
limitations have created a need for alternative methods of color analysis with fewer
limitations, more precision and higher accuracy.
Sugita and Marumo (1996) tested how color alone can be used to differentiate
between soils after each of the following treatments: air-drying, moistening, organic
matter decomposition, iron oxide removal, and ashing. Removing organic matter and iron
oxide produced the most distinguishable soil colors (97% of samples were
distinguishable). The results showed that various treatments can help to distinguish the
color between soil samples when using only the Munsell Color Chart making soil color
analysis more accurate, and that color can be a robust indicator of organic matter and iron

2
oxide levels in soil. However, because different regions have different soil properties,
various other treatments may be necessary to accurately determine color. This method
also eliminates the convenience of in-the-field color analysis that the Munsell Color
Chart offers.
With the human eye being unreliable at color determinations (Thompson et al.,
2013), other soil scientists have turned to spectrophotometers for determining soil color.
In a study conducted by Shields et al. (1968), soil samples from Chernozemic and
Podzolic soils in air-dried and field-capacity conditions were analyzed for color using the
Munsell Color Chart and a Bausch and Lomb model Spectronic 600 laboratory
spectrophotometer. The spectrophotometer results had low standard deviations showing
that the spectrophotometer was more precise than the visual measurements using the
Munsell Color Chart. Moisture also caused the Munsell color results to vary in hue more
than expected. Spectrophotometers, therefore, do eliminate much of the human error
involved with color analysis of soil samples. The wide application of spectrophotometers
to soil color determination has been limited because of their expensive cost and lack of
portability making spectrophotometers an undesirable replacement for the Munsell
Color Chart for quick analysis of a soil’s color.
Aydemir et al. (2004) proposed a new method of soil analysis using color. In this
method, a color image flatbed scanner was used to scan thin section soil samples. The
results were then analyzed for soil micromorphology using the soil color processed by the
Erdas Processing software. The researchers found that from 80% to 100% of the time,
separation and identification of soil mineral, non-mineral, non-crystalline, and poorly

3
crystalline components were successful. This method of color analysis to determine soil
components shows promise for technologies in soil science. The flatbed scanner was
successful in determining soil color and with analysis accompanied by software, it is
possible to use color to determine many important soil qualities. However, this method of
analysis is still limited to a laboratory setting in that scanners are not mobile and require a
power source to function. Furthermore, it brings into question whether scanners of
different types would perform just as well.
A recent study by Gomez-Robledo et al. (2013) tested the use of cell phone
cameras to quantitatively determine soil color. A mobile app was developed for the
experiment that would take photos of a soil sample and determine the red, green, and blue
(RGB) color codes for the pixels that appeared the most in a cropped area of the photo.
The resulting RGB color codes were converted to Munsell HVC and red, green, and blue
coordinates (XYZ color codes) to compare to scans from a Konica Minolta 2600d
spectrophotometer. The results showed that under controlled lighting conditions, the cell
phone camera was more accurate at determining color than visual measurements with the
Munsell Color Chart. A notable benefit to this method of color analysis is the
convenience in mobility that it offers. With mobile devices becoming increasingly
available to consumers, access to this technology would not be limited. Unfortunately,
this type of analysis is camera specific and would require calibrations and testing on
thousands of individual camera sensors which is not feasible. Furthermore, lighting
conditions may not always be controlled during the use of the app creating more room for
inconsistencies.

4
In a study by Meyer et al. (2004), unsupervised color indices and fuzzy clustering
methods were observed to determine if accurate classification of plant, soil, and residue
materials was possible using only digital images and the Image Processing and Fuzzy
Logic Toolboxes in MATLAB®. Three different plant growth stages were recorded in
681 digital images taken with a Kodak Digital Science DC120 digital camera in
automatic mode for best picture and red, green, and blue (RGB) separation. RGB color
codes were chosen for this experiment because of the way the human eye perceives color
through its 4% blue, 32% green, and 64% red cones, and because RGB can be
mathematically converted to other color systems such as hue (H), saturation (S), and
intensity (I). HSI could then be used to determine other color measurements such as
excess green (ExG). The results showed that characterization accuracy increased with
later growth stages of plants and with bare soils. More than 10% of an image needed to
consist of plant pixel coverage for there to be enough color data for clustering. While the
algorithms used during this experiment require further research to enable the software to
more accurately characterize young growth plants and ground cover, there is promise in
this new technology to advance soil and plant characterization through imaging software
and the visible spectra.
O’Donnell et al. (2011) also took advantage of digital cameras and image analysis
software in the hopes of characterizing soils redoximorphic features based on color.
Under controlled conditions, a digital camera was used to capture images of exposed soil
cores and the data was stored as RGB color values. The RGB values were then converted
to 238 possible Munsell color notations using a minimum spectral distance algorithm.

5
The standard methods of soil color analysis, Munsell Color Chart system, does not dictate
how to incorporate Munsell notation into statistical analysis. Given that the Munsell
notation does not bode well for statistical analysis, many scientists turn to converting
color systems to, and from, Munsell notation which may introduce error. Others have
previously noted the need for a statistical standard color system in soil science to
accommodate analyses involving soil color (Kirillova et al., 2014).
The Munsell Color Chart has been widely applied to soil color determination
because of its ease of use; however, color analysis should be precise and accurate as well.
Ideally, a new method of color analysis would be easy to use, mobile, be relatively
inexpensive, produce consistent and accurate results, and produce results that allow for
easy statistical analysis. For these reasons, the objectives of this study were: (i) to
examine the precision of a relatively inexpensive color sensor; (ii) to compare soil color
measurements using this color sensor to human determination by soil science
professionals using the standard Munsell Color Chart; and (iii) to compare the accuracy
of this color sensor to a laboratory standard colorimeter.
MATERIALS AND METHODS
Study area
Soil samples for this study were collected at the Simpson Agricultural Experiment
Station (Simpson Farm) near Pendleton, South Carolina. The Simpson Farm is used
predominantly for research related to cattle operations (fescue in the spring and fall,
Bermuda grass in the summer, and corn silage or winter annuals during winter)

6
(http://www.clemson.edu/public/researchfarms/ beef_cattle/). The soil series found on the
study location include Cecil clay loam, Pacolet sandy loam, Cartecay–Chewacla
complex, Hiwassee sandy loam, and Cecil sandy loam
(websoilsurvey.sc.egov.usda.gov/App/WebSoilSurvey.aspx).
Sampling
Thirteen soil pits were excavated for the purpose of the 2014 Southeast Regional
Collegiate Soils Contest, which was hosted by Clemson University at the Simpson
Agricultural Station (Fig. 1; http://gis.clemson.edu/elena/SoutheastSoilContest.htm).
These pits were also used to gather samples for the purpose of this experiment where
thirty one samples from seven of the pits were chosen for analysis. Using the soil profiles
described by Natural Resource Conservation Service (NRCS) staff for color before the
competition, samples were collected from each horizon after the judging was completed.
Soil samples were collected using a hand trowel to scoop soil from each horizon and the
samples were then transferred to individual soil sample bags. After collection, the
samples were analyzed at the Ag Service Lab using their standard operating procedures
(http://www.clemson.edu/public/regulatory/ag_svc_
lab/soil_testing/soil_procedures/index.html). The remaining soil from the samples was
used for the color determinations associated with this study.
Laboratory analysis

7
Samples were characterized for texture (i.e., percent sand, silt, and clay) and
classified based on the standard NRCS soil triangle (e.g., clay, clay loam, sandy loam,
etc.). Each sample was oven dried, crumbled, and passed through a 2 mm sieve. The
samples’ total carbon percentages were also determined by the Ag Service Lab
(Agricultural Service Laboratory, 2014; Table 1). The moist samples were previously
analyzed by NRCS staff using the Munsell Soil Color Charts by using the consensus
among three professional soil scientists. Dry soil color determination using the Munsell
Soil Color chart was completed under laboratory conditions by one individual.
Color analysis using the Nix Pro Color Sensor
Soil samples were tested for color using a NixTM Pro Color Sensor. The sensor is
controlled wirelessly by any Android or Apple phone or tablet through Bluetooth and has
its own light-emitting diode (LED) light source located within the concave base of the
sensor about 1 cm above the field of view. The sensor produces scan results in various
color system codes, such as RGB, XYZ, lightness (L*), redness (a*), and yellowness (b*)
(CIEL*a*b*), and cyan, magenta, yellow, and black (CMYK). The sensor is also
rechargeable, easily accessible because of its small size, can be recalibrated easily, and
costs $349 (http://www.nixsensor.com).
Thirty-one soil samples were tested by placing the sensor on a small amount of
each soil, about an inch in diameter, which was poured onto a plate. The surface of the
sample was leveled to give the sensor a flat area to rest directly on and the ‘‘scan” option
was selected. The base of the sensor, 1.5 cm in diameter, was completely covered by the

8
soil sample, allowing no outside light to enter the scan area. Previous testing showed that
there was no significant difference in color results when scanned in indoor or outdoor
lighting conditions because of the sensor’s LED light source, therefore each sample was
scanned three times under both dry and moist soil conditions and the CMYK, XYZ, and
CIEL*a*b* results were averaged and recorded. The samples were moistened using a
water dropper. Each sample only received enough drops of water to dampen the entire
surface of the sample to the point of no more color change in the soil. CMYK was chosen
to use for analysis because the Nix Pro Color Sensor does not produce Munsell HVC
results. Furthermore, preliminary work was conducted using CMYK color codes so
further work was continued with this method for consistency. CMYK color codes are also
measured on a scale of 0–100 (for each color, cyan, magenta, yellow, and black) making
statistical analysis simple.
Converting Munsell notation to CMYK percentage values
The Munsell values of each soil sample (NRCS measured moist samples from the
pits, the laboratory dried samples, and the researcher determined moist and dry Munsell
values) were converted to CMYK percentages using color converter software. The codes
were first converted to RGB values using the BabelColor software
(http://www.babelcolor.com/). The RGB values were then converted to CMYK
percentage values using the Pipette software (www.sttmedia.com/pipette).
Konica Minolta CR-400 analysis of soil samples

9
A Konica Minolta CR-400 laboratory-grade colorimeter was used as the baseline
color measurement device and produced color results in a variety of color formats
including CIEL*a*b*, XYZ, and Munsell HVC color codes. The colorimeter was
calibrated by scanning a standard white plate and manually entering the CIEL*a*b* color
values predetermined for the plate. When using the Konica Minolta, the clear base of the
sensor was placed on the surface of the soil sample. The surface only needed to be large
enough to cover the 8-mm aperture of the sensor. The cost of the CR-400 model used in
this experiment was approximately $5000 (http://sensing.konicaminolta.us/). The thirty-
one soil samples previously analyzed for color were scanned using the Konica Minolta.
Dry soil samples were placed on a plate and scanned using the colorimeter three times for
each soil sample. The results were recorded and averaged. The soil samples were then
moistened using a water dropper to dampen the soil surface. Each sample was again
scanned three times and the results recorded and averaged. The results were recorded in
XYZ percentage color values for statistical comparison to the Nix Pro Color Sensor
because the colorimeter did not produce CMYK percentage color values. To
accommodate for this difference, the XYZ percentage color values recorded using the
Konica Minolta CR-400 were converted to CMYK percentage color values using the
Pipette software (www.sttmedia.com/pipette). The CIEL*a*b* color codes were also
recorded for the thirty-one soil samples.
Converting CIEL*a*b* values to Munsell notation

10
The CIEL*a*b* color codes produced by the Nix Pro Color Sensor and Konica
Minolta CR-400 and recorded for the thirty-one soil samples under dry and moist soil
conditions were converted to Munsell Color Chart notation using the BabelColor color
converter software (http://www.babelcolor.com/). For this step, CIEL*a*b* was chosen
to convert to Munsell because only one color converter needed to be used, thus
eliminating a step and reducing possible error. Using the BabelColor converter, the
checkbox for CIEL*a*b* color input was selected and the ‘‘Compare” option was
changed to ‘‘Convert.” Next, the ‘‘Deck 2” option was selected for the output color code
to allow for conversion results to be displayed in Munsell notation. The CIEL*a*b* color
coordinates were input manually and the resulting Munsell notations were displayed
automatically.
Statistical analysis
Once all scan results for the Nix Pro sensor and Konica Minolta CR-400 were
recorded, all data were compared to examine statistical relationships among the three
methods of color determination in dry and moist soil sample conditions using correlation
analyses. All cyan (C%) values were measured as zero, therefore no statistical analyses
could be conducted for cyan. Additionally, pairwise t-tests were conducted for each of
the 31 soil samples between each of the pairs of sensors to examine differences between
Nix Pro Color Sensor and Konica Minolta for wet and dry samples. A significance level
of 0.05 was used for all tests. A Bonferroni correction was applied to control the

11
familywise error rate in the multiple pairwise t-tests (adjusted significance level =
0.0016).
RESULTS AND DISCUSSION
Precision of color sensor in dry and moist soil
Replicate scans or sets were completed (where one sample was scanned three
times to examine the reproducibility of the measurement) for dry and moist soil samples
using the Nix Pro Color Sensor. The results were nearly identical to each other with
strong, positive correlations (Fig. 2a and b). Significant positive correlations exist
between Nix Pro Color Sensor scans for magenta (M%), yellow (Y%), or black (K%) in
dry soil with correlation values from 0.92 to 1 (p-values <0.001). Nix Pro Color Sensor
scans in moist soil also show significant positive correlations among the scans for
magenta (M%), yellow (Y%), and black (K%) with correlation values larger than 0.98 (p-
values <0.001).
The graphs in Fig. 2 illustrate that moisture does not appear to be an important
variable with the Nix Pro Color Sensor as seen by the overall strong, positive correlations
between the color results of the dry and moist soil. Only minor differences were observed
between the color codes of dry and moist soil samples, mostly appearing in the graph for
yellow (Y%) (Fig. 2c). Table 2 shows that there are significant positive correlations for
Nix Pro Color Sensor between dry and moist soil for magenta (M%), yellow (Y%), or
black (K%) with correlations of 0.96, 0.84, and 0.89 respectively, (all p-values <0.001).

12
Past studies have shown that moisture can make a soil appear noticeably darker,
increasing the hue of the soil (Shields et al., 1968).
Accuracy of color sensor compared to Munsell Color Chart
Table 3 shows that there is a significant positive correlation between the Munsell
Color Chart and Nix Pro Color Sensor in dry soil for magenta (M%) with a correlation of
0.89 (p-value <0.001), in dry soil for yellow (Y%) with a correlation of 0.78 (p-value
<0.001), and in dry soil for black (B%) with a correlation of 0.59 (p-value <0.001). There
is a significant positive correlation between the Munsell Color Chart and Nix Pro Color
Sensor in moist soil for magenta (M%) with a correlation of 0.51 (p-value = 0.003), in
moist soil for yellow (Y%) with a correlation of 0.59 (p-value <0.001), and in moist soil
for black (K%) with a correlation of 0.58 (p-value <0.001). Fig. 3a suggests that the Nix
Pro Color Sensor is more consistent with the Munsell Color Chart in dry soils for
magenta (M%) and yellow (Y%) than it is for black (K%), although a significant
correlation still exists between the two for black (K%). There is a consistent moderately
strong, positive correlation between the two color determination methods for all three
color values (Fig. 3b).
Accuracy of color sensor compared to laboratory colorimeter
There is a significant positive correlation between the Nix Pro Color Sensor and
Konica Minolta CR-400 in dry soil for magenta (M%) with a correlation of 0.93 (p-value
<0.001), in dry soil for yellow (Y%) with a correlation of 0.97 (p-value <0.001), and in
13
dry soil for black (K%) with a correlation of 0.45 (p-value = 0.011; Table 3). There is a
significant positive correlation between the Nix Pro Color Sensor and Konica Minolta
CR-400 in moist soil for magenta (M%) with a correlation of 0.96 (p-value <0.001), in
moist soil for yellow (Y%) with a correlation of 0.71 (p-value <0.001), and in moist soil
for black (K%) with a correlation of 0.8 (p-value <0.001).
The Nix Pro Color Sensor and Konica Minolta CR-400 are nearly identical in
magenta (M%) and yellow (Y%) color values in dry and moist soil conditions and have a
significant positive correlation for black (K%) in dry and moist soil conditions (Fig. 3a
and b; Table 4). This suggests that the Nix Pro Color Sensor is accurate with respect to
the laboratory standard colorimeter. These results were to be expected as sensors have
proven to be accurate to other such devices in past studies (Gomez-Robledo et al., 2013).
A significant positive correlation between the Munsell Color Chart and Konica Minolta
CR-400 in dry soil for magenta (M%) with a correlation of 0.8 (p-value <0.001), in dry
soil for yellow (Y%) with a correlation of 0.72 (p-value <0.001), and in dry soil for black
(K%) with a correlation of 0.36 (p-value = 0.047; Table 3). There is a significant positive
correlation between the Munsell Color Chart and Konica Minolta CR-400 in moist soil
for magenta (M%) with a correlation of 0.50 (p-value = 0.004), in moist soil for yellow
(Y%) with a correlation of 0.48 (p-value = 0.006), and in moist soil for black (K%) with a
correlation of 0.48 (p-value = 0.006).
The correlations between the Konica Minolta CR-400 and the Munsell Color
Chart are similar to the correlations between the Nix Pro Color Sensor and Munsell Color
Chart (Fig. 3a and b). This indicates that the Nix Pro Color Sensor has accuracy similar to

14
the Konica Minolta CR-400 and would produce results more closely related to the Konica
Minolta CR-400 than to those of the Munsell Color Chart. Given that the Munsell Color
Chart is inaccurate (Kirillova et al., 2014), these results were also expected. However, it
was expected that since the moist soil samples were analyzed for color by NRCS staff
using the Munsell Color Chart that the moist soil color results would be more accurate to
the colorimeter than the dry soil sample color results. The data suggest that the opposite
is true, which may contribute to human error and user sensitivities when using the
Munsell Color Chart for determining color (Kirillova et al., 2014).
A series of pairwise t-tests for sensor and colorimeter values in the CIE 1931
XYZ color space were conducted. Wet soil samples were compared for the average
difference between the Nix Pro Color Sensor and the Konica Minolta for each of the 31
soil samples and found that 87% of X and Y soil samples had means that were not
significantly different, while 90% of the Z channel soil sample means were not
significantly different (i.e., 90% of the 31 null hypotheses were not rejected when
comparing the means for the Nix Pro Color Sensor and the Konica Minolta). For dry
samples, 87% of the X, 84% of the Y, and 87% of the Z channel samples means did not
significantly differ between the Nix Pro Color Sensor and the Konica Minolta.
Converting CIEL*a*b* values to Munsell notation
Conversion results from the CIEL*a*b* color notation are demonstrated in Table
5. The results show that it is possible to convert Nix Pro and Konica Minolta CR-400
CIEL*a*b* color codes to Munsell HVC and produce similar results to those when using

15
the Munsell Color Chart alone. For example, the Nix Pro sensor gave a complete match
(i.e., same hue, value and chroma) for the dry Bt3 horizon, matched two of the three
Munsell characteristics for the dry Ap and Bt1 horizons, and matched one of the three
Munsell characteristics for the dry Bt2 horizon (Table 5). In general, conversion from the
sensor measurements to Munsell color notation varied by only one or two chips in hue,
value, or chroma. However, given that the Munsell Color Chart has a limited number of
color chips, ideally the conversions should produce Munsell HVC codes more precisely.
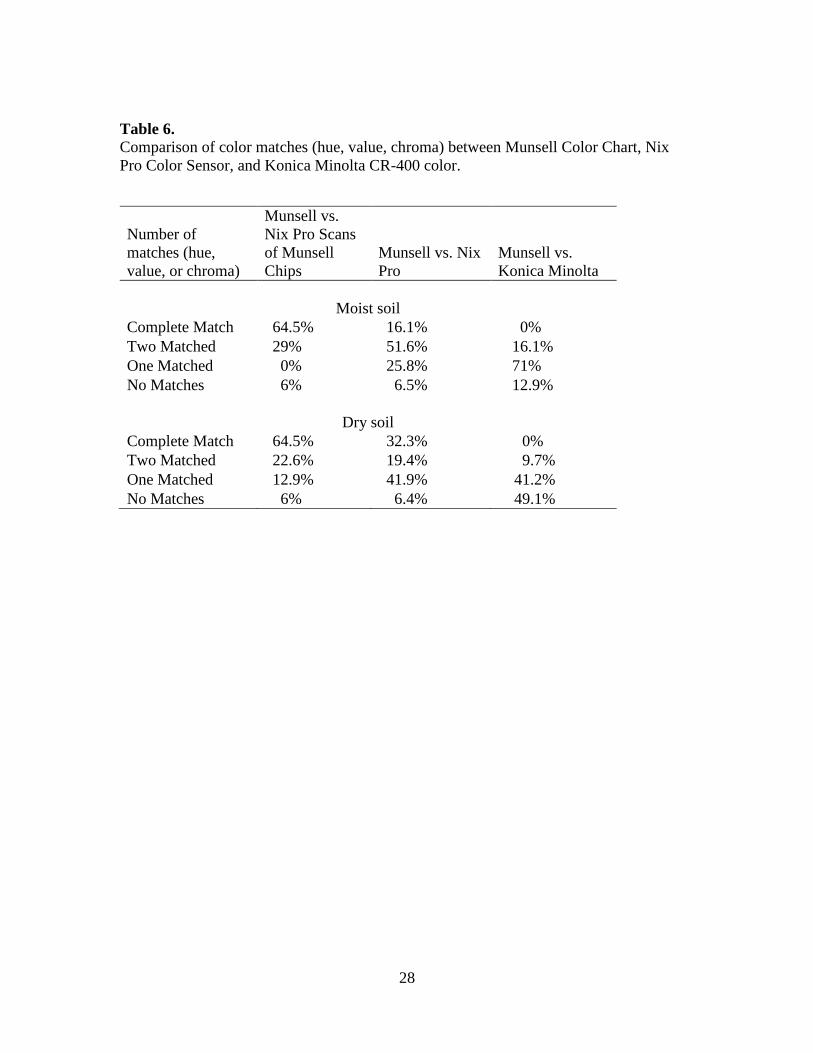
Table 6 shows that when the Munsell color chips determined for moist soil
samples were scanned using the Nix Pro color sensor and the subsequent color codes
were converted back to Munsell, 64.5% of the results matched all three of the original
Munsell color chips for hue, value and chroma. This complete match percentage dropped
to 16.1% when comparing Munsell to Nix Pro scans of moist soil samples converted to
Munsell notation and 0% complete match when comparing Munsell to Konica Minolta
CR-400 scans of moist soil samples converted to Munsell notation. The Nix Pro scans of
moist soil samples converted to Munsell matched two of the three Munsell characteristics
51.6% of the time. The Konica Minolta CR-400 scans of moist soil samples converted to
Munsell notation values matched one Munsell characteristic 71% of the time.
Table 6 shows that when the Munsell color chips determined for dry soil samples
were scanned using the Nix Pro color sensor and the subsequent color codes were
converted back to Munsell, 64.5% of the results matched all three of the original Munsell
color chips hue, value, and chroma. This complete match percentage dropped to 32.3%
when comparing Munsell to Nix Pro scans of dry soil samples converted to Munsell

16
notation and 0% complete match when comparing Munsell to Konica Minolta CR-400
scans of dry soil samples converted to Munsell notation. The Nix Pro scans of dry soil
samples converted to Munsell matched one Munsell notation value for dry soil 41.9% of
the time. The Konica Minolta CR-400 scans of dry soil samples converted to Munsell
matched none of the Munsell notation values for dry soil 49.1% of the time.
CONCLUSIONS
The Nix Pro Color Sensor was repeatable based on significant positive
correlations between scans when comparing sets of dry soil samples and for scans when
comparing sets of moist samples. There were significant differences in color for scans for
dry versus moist soil samples. Soil color is often measured at greater wavelengths when
using spectrometers to account for the difference in soil color that can result from
moisture in the soil (Alchanatis et al., 2006). Reported results show that the Nix Pro
Color Sensor determined the true color of a soil sample regardless of moisture content
based on significant positive correlations between Nix Pro Color Sensor scans for
samples in dry and moist conditions.
Nix Pro Color Sensor observations were similar to the Konica Minolta CR-400 in
both dry and moist soils based on strong positive correlations and statistical analysis
between the two methods for both dry and moist soil. The Nix Pro Color Sensor may be a
good alternative to the Munsell Color Chart in the color determination of a soil because
its color values are more closely related to that of a laboratory standard colorimeter, such
as the Konica Minolta CR-400.

17
The various color systems available with the Nix Pro Color Sensor allow for a
more convenient color comparisons than is available with the Munsell Color Chart. Many
other areas of agricultural sciences are rapidly turning to portable sensors in the hopes of
creating a practical and inexpensive method of on-site analysis for their crops and land
(Sanchez et al., 2013). Other studies have also shown that mobile devices are improving
in analysis of soil morphology and that there is an increasing demand for ‘‘simple and
inexpensive hardware” to be readily available (Aydemir et al., 2004).

18
APPENDICES
Appendix A
Figures

19
Fig. 1. Example of soil profile (out of 7 total soil profiles used in the study) for practice
Soil pit 2 during 2014 Southeast Regional Collegiate Soils Contest (October 5-9, 2014

20
Fig. 2. Nix Pro Color Sensor CMYK color code means vs. Nix Pro Color Sensor CMYK scan sets in dry and moist soil and mean
CMYK color codes in dry vs. moist soil (n = 31 soil samples for each set, corresponding correlation (r-value) and significance (p-
value) data are reported in Tables 2 and 3).
a) Nix Pro: Dry soil b) Nix Pro: Moist soil c) Nix Pro: Dry versus
moist soil

21
a) All color methods: Dry soil b) All color methods: Moist soil
Fig. 3. Munsell Color Chart codes converted to CMYK color codes and compared to the
Nix Pro Color Sensor CMYK color codes and Konica Minolta CR-400 conversion to
CMYK color codes in dry and moist soil (n = 31 soil samples for each set; corresponding
correlation (r-value) and significance (p-value) data are reported in Tables 2 and 3).

22
Appendix B
Tables

23
Table 1
Selected soil properties for practice soil pit 2.
Horizon
Lower
depth
Texture
Sand
Silt
Clay
OC
pH in
water
BS
CEC
P
K
Ca
Mg
Zn
Mn
Cu
B
Na
(cm) (%) (%) (meq/100g) (mg/kg)
Ap 11 SL 70 14 16 1.3 5.0 42 4.8 10.0 23 299 107 2.5 14 0.25 0.15 4.5
Bt1 28 SCL 58 14 28 0.4 5.6 39 3.9 1.5 14 207 100 0.5 4 0.30 0.10 5.5
Bt2 59 SC/SCL 52 12 36 0.3 5.6 35 3.3 1.0 9 186 77 0.4 3 0.20 0.10 5.0
Bt3 90+ SC/C 46 8 46 0.2 5.5 30 4.0 1.0 9 217 111 0.4 1 0.25 0.15 6.5

24
Table 2 Correlation (r-value) between Nix Pro CMYK color codes: Dry versus moist soil (n = 31
soil samples in each set, all p-values < 0.001).
CMYK
(color codes)
Mean moist
Magenta (M %)
Mean moist
Yellow (Y %)
Mean moist
Black (K %)
Mean dry Magenta (M %) 0.96 - -
Mean dry Yellow (Y %) - 0.84 -
Mean dry Black (K %) - - 0.89

25
Table 3
Correlation (r-value) between Munsell Color Chart, Nix Pro, and Konica Minolta CR-
400: Mean CMYK color codes in dry and moist soil (n = 31 soil samples in each set).
CMYK
(color codes)
Munsell Chart
Nix Pro
Konica Minolta
Dry soil
Magenta (M %)
Munsell Chart 1 0.89* 0.8*
Nix Pro 0.89* 1 0.93*
Konica Minolta 0.8* 0.93* 1
Yellow (Y %)
Munsell Chart 1 0.78* 0.72*
Nix Pro 0.78* 1 0.97*
Konica Minolta 0.72* 0.97* 1
Black (K %)
Munsell Chart 1 0.52* 0.36**
Nix Pro 0.59* 1 0.45***
Konica Minolta 0.36** 0.45*** 1
Moist soil
Magenta (M %)
Munsell Chart 1 0.51**** 0.5*****
Nix Pro 0.51**** 1 0.96*
Konica Minolta 0.5***** 0.96* 1
Yellow (Y %)
Munsell Chart 1 0.59* 0.48******
Nix Pro 0.59* 1 0.71*
Konica Minolta 0.48****** 0.71* 1
Black (K %)
Munsell Chart 1 0.58* 0.48******
Nix Pro 0.58* 1 0.8*
Konica Minolta 0.48****** 0.8* 1
*p-value < 0.001 **p-value = 0.047 ***p-value = 0.011 ****p-value = 0.003
*****p-value = 0.004 ******p-value = 0.006

26
Table 4
Munsell Color Chart, Nix Pro Color Sensor, and Konica Minolta CR-400 color code mean (standard deviation) for each of the
soil horizons of practice soil pit 2 in the CMYK (M=magenta, Y= yellow, K=black) codes.
Soil
horizon
Lower
depth (cm)
Munsell Color Chart
(CMYK%)
n=3
Nix Pro
Color Sensor
(CMYK%)
n=3
Konica Minolta
CR-400
(CMYK%)
n=3
M Y K M Y K M Y K
Dry soil
Ap 11 24 (0) 43 (0.6) 33 (0) 25 (1) 47 (1.2) 39 (2.1) 25 (0.2) 45 (0.3) 46 (3.2)
Bt1 28 38 (0) 62 (0.6) 32 (0.6) 33 (0) 57 (0.6) 34 (0.6) 31 (1) 55 (0.2) 45 (0.4)
Bt2 59 29 (0.6) 55 (0) 28 (0.6) 31 (0) 55 (0) 35 (2) 31 (0.2) 54 (0.2) 41 (0.4)
Bt3 90+ 32 (1.5) 50 (4.5) 35 (0.6) 35 (0) 59 (0.6) 38 (2) 34 (0.1) 56 (0.3) 42 (1.5)
Moist soil
Ap 11 31 (0) 51 (0.6) 50 (0) 31 (0) 55 (0) 58 (0.6) 31 (0.6) 55 (0.8) 64 (0.2)
Bt1 28 36 (0) 60 (0.6) 46 (0) 41 (0) 64 (0.6) 49 (0) 41 (0.1) 69 (1.2) 59 (1)
Bt2 59 42 (0.6) 64 (0.6) 44 (0) 40 (0.6) 65 (0.6) 51 (1.5) 35 (0.3) 53 (0.9) 53 (0.4)
Bt3 90+ 44 (0) 58 (0.6) 43 (0.6) 45 (0) 69 (0) 52 (1.2) 45 (0.6) 71 (1.3) 53 (0.2)

27
Table 5
Munsell Color Chart, Nix Pro Color Sensor, and Konica Minolta CR-400 color codes
for each of the soil horizons of practice soil pit 2 in the Munsell Color Chart notation.
Soil
horizon
Lower
depth
(cm)
Munsell Color Chart
Hue (H), Value (V),
Chroma (C)
n=1
Nix Pro Color Sensor
Hue (H), Value (V),
Chroma (C)
n=3
Konica Minolta
CR-400
Hue (H), Value (V),
Chroma (C)
n=3
H V C H V C H V C
Dry soil
Ap 11 7.5YR 6 4 7.5YR 5 4 10YR 5 4
Bt1 28 5YR 5 8 5YR 5 6 7.5YR 4 4
Bt2 59 7.5YR 6 6 5YR 5 6 10YR 5 4
Bt3 90+ 5YR 5 6 5YR 5 6 5YR 5 6
Moist soil
Ap 11 5YR* 4 4 5YR 3 4 7.5YR 3 4
Bt1 28 5 YR 4 6 2.5YR 4 6 5YR 3 6
Bt2 59 2.5YR 4 6 5YR 4 6 5YR 4 4
Bt3 90+ 10YR 4 6 2.5YR 3 6 5YR 3 6
Note: Moist soil color was determined by NRCS soil scientists.
28
Table 6.
Comparison of color matches (hue, value, chroma) between Munsell Color Chart, Nix
Pro Color Sensor, and Konica Minolta CR-400 color.
Number of
matches (hue,
value, or chroma)
Munsell vs.
Nix Pro Scans
of Munsell
Chips
Munsell vs. Nix
Pro
Munsell vs.
Konica Minolta
Moist soil
Complete Match 64.5% 16.1% 0%
Two Matched 29% 51.6% 16.1%
One Matched 0% 25.8% 71%
No Matches 6% 6.5% 12.9%
Dry soil
Complete Match 64.5% 32.3% 0%
Two Matched 22.6% 19.4% 9.7%
One Matched 12.9% 41.9% 41.2%
No Matches 6% 6.4% 49.1%

29
REFERENCES
Agricultural Service Laboratory, 2014. Clemson University.
<http://www.clemson.edu/public/regulatory/ag_svc_lab/index.html>.
Alchanatis, Victor, Ridel, Leonid, Hetzroni, Amots, Yaroslavsky, Leonid, 2006. Weed
detection in multi-spectral images of cotton fields. Comput. Electron. Agric. 47
(June), 243–260.
Aydemir, S., Keskin, S., Drees, L.R., 2004. Quantification of soil features using digital
image processing (DIP) techniques. Geoderma 119 (March), 1–8. BabelColor,
2015. BabelColor: Color Measurement and Analysis. <http://www.
abelcolor.com/>.
Gomez-Robledo, L., Lopez-Ruiz, N., Melgosa, M., Palma, A., Fermin Capitan-Vallvey,
L., Sanchez-Maranon, M., 2013. Using the mobile phone as Munsell soil–colour
sensor: an experiment under controlled illumination conditions. Comput.
Electron. Agric. 99, 200–208.
Kirillova, N.P., Vodyanitskii, Yu.N., Sileva, T.M., 2014. Conversion of soil color
parameters from the Munsell System to the CIE-L⁄a⁄b⁄ System. Eurasian Soil Sci.
48 (5), 468–475.

30
Konica Minolta, 2015. Konica Minolta: Sensing Americas.
<http://sensing.konicaminolta.us/>.
Lusby, F., Zieve, D., Black, B. (Eds.), 2013. May 7. Color Blindness.
<http://www.ncbi.nlm.nih.gov/pubmedhealth/PMH0001997/>.
Meyer, George E., Neto, Joao Camargo, Jones, David D., Hindman, Timothy W., 2004.
Intensified fuzzy clusters for classifying plant, soil, and residue regions of interest
from color images. Comput. Electron. Agric. 42 (3), 161–180.
Miller, R., 1958. The Munsell System of color notation. Am. Soc. Mammal. 39, 278–286.
Mouazen, A., Karoui, R., Deckers, J., De Baerdemaeker, J., Ramon, H., 2007. Potential
of visible and near-infrared spectroscopy to derive colour groups utilising the
Munsell soil colour charts. Biosyst. Eng. 97, 131–143.
O’Donnell, T. Kevin, Goyne, Keith W., Miles, Randall J., Baffaut, Claire., Anderson,
Stephen H., Sudduth, Kenneth A., 2011. Determination of representative
elementary areas for soil redoximorphic features identified by digital image
processing. Geoderma 161, 138–146.

31
Pipette, 2015. Stefan Trost Media: Software Solutions. <www.sttmedia.com/pipette>.
Sanchez, Maria-Teresa, De la Haba, Maria, Perez-Marin, Dolores, 2013. Internal and
external quality assessment of mandarins on-tree and at harvest using a portable
NIR spectrophotometer. Comput. Electron. Agric. 92 (March), 66–74.
Shields, J., Paul, E., Arnaud, R., Head, W., 1968. Spectrophotometric measurement of
soil color and its relationship to moisture and organic matter. Can. J. Soil Sci. 48,
271–280.
Simpson Beef Cattle Farm, 2014. Clemson University.
<http://www.clemson.edu/public/researchfarms/beef_cattle/>.
Southeast Soil Contest, 2014. Clemson University.
<http://gis.clemson.edu/elena/SoutheastSoilContest.htm>.
Sugita, R., Marumo, Y., 1996. Validity of color examination for forensic soil
identification. Forensic Sci. Int. 83, 201–210.
Thompson, J., Pollio, A., Turk, P., 2013. Comparison of Munsell Soil Color Charts and
the GLOBE soil color book. Soil Sci. Soc. Am. 77 (March 25), 2089–2093.

32
Web Soil Survey, 2015. USDA.
<websoilsurvey.sc.egov.usda.gov/App/WebSoilSurvey.aspx>.