Embed Size (px)
Citation preview
ARTICLE IN PRESS
0043-1354/$ - se
doi:10.1016/j.w
�Correspond
fax: +30225 10
E-mail addr
(H.K. Karapan
Water Research 39 (2005) 549–558
www.elsevier.com/locate/watres
Evaluating phenanthrene sorption on various wood chars
Gavin Jamesa, David A. Sabatinia, Cary T. Chioub, David Rutherfordb,Andrew C. Scottc, Hrissi K. Karapanagiotid,�
aSchool of Civil Engineering and Environmental Science, University of Oklahoma, Norman, OK 73019, USAbUS Geological Survey, Denver, CO 80225, USA
cGeology Department, Royal Holloway University of London, Egham, Surrey, TW20 OEX, UKdMarine Sciences Department, University of the Aegean, Mytilene 81100, Greece
Received 21 April 2004; received in revised form 2 October 2004; accepted 22 October 2004
Abstract
A certain amount of wood char or soot in a soil or sediment sample may cause the sorption of organic compounds to
deviate significantly from the linear partitioning commonly observed with soil organic matter (SOM). Laboratory
produced and field wood chars have been obtained and analyzed for their sorption isotherms of a model solute
(phenanthrene) from water solution. The uptake capacities and nonlinear sorption effects with the laboratory wood
chars are similar to those with the field wood chars. For phenanthrene aqueous concentrations of 1 mgl�1, the organic
carbon-normalized sorption coefficients (log Koc) ranging from 5.0 to 6.4 for field chars and 5.4–7.3 for laboratory
wood chars, which is consistent with literature values (5.6–7.1). Data with artificial chars suggest that the variation in
sorption potential can be attributed to heating temperature and starting material, and both the quantity and
heterogeneity of surface-area impacts the sorption capacity. These results thus help to corroborate and explain the
range of logKoc values reported in previous research for aquifer materials containing wood chars.
r 2004 Elsevier Ltd. All rights reserved.
Keywords: Wood char; Sorption; Koc; Phenanthrene; Nonlinear isotherms; Surface area
1. Introduction
Chiou, (1995) and Gustafsson et al. (1997) suggested
that small amounts of high surface-area carbonaceous
material (HSACM) (e.g., wood chars or soot) may
significantly change the sorption behavior of soils or
sediments for organic contaminants. In such cases, the
sorption isotherms usually exhibit a significant concave-
downward shape at low concentrations (Ce) relative to
water solubilities (Sw), but a practically linear shape at
e front matter r 2004 Elsevier Ltd. All rights reserve
atres.2004.10.015
ing author. Tel.: +30225 103 6835;
3 6809.
ess: [email protected]
agioti).
moderate-to-high CeSw�1 (Gustafsson et al., 1997; Xing
et al., 1996; Huang et al., 1997; Chiou and Kile, 1998;
Xia, 1998; Kleineidam et al., 1999; White and Pignatello,
1999; Xia and Ball, 1999, 2000; Karapanagioti and
Sabatini, 2000; Chiou et al., 2000). The nonlinear
sorption at low CeSw�1 reflects the dominance of solute
adsorption with HSACM, while the linear sorption at
the moderate-to-high CeSw�1 reflects the dominance of
solute partitioning into the soil organic matter (SOM)
(Chiou and Kile, 1998; Allen-King et al., 2002;
Kleineidam et al., 2002).
The presence of HSACM in small amounts in some
soils and sediments has been corroborated by organic
petrographic methods applied to samples of different
origins (Kleineidam et al., 1999; Karapanagioti and
d.
ARTICLE IN PRESSG. James et al. / Water Research 39 (2005) 549–558550
Sabatini, 2000; Karapanagioti et al., 2000, 2001; Ghosh
et al., 2000). Using this identification method, the char-
like particles were visually observed and characterized.
Recent work by Karapanagioti and Sabatini (2000) not
only identified opaque particles in an aquifer material
but also quantified the content of wood char particles in
the sample.
Using the composite sorption model for single
contaminants (Karapanagioti and Sabatini, 2000),
Karapanagioti et al. (2001) found that phenanthrene-
char logKoc values ranged from 5.6 to 6.8 for a variety
of soils and geosolids, illustrating the range in adsorp-
tion power within the wood chars. However, the in-situ
effect of a char (or HSACM) on the sorption of a given
contaminant will depend critically on the char content,
the surface properties, and the competitive adsorption of
other coexisting contaminants (Chiou and Kile, 1998;
Cornelissen and Gustafsson, 2004).
The main goal of the current study is to present direct
evidence that wood chars from different origins do in
fact exhibit variations in their sorptive properties as has
been indirectly inferred from earlier research. A
secondary goal is to demonstrate potential reasons for
the observed variation in wood char sorption (e.g.,
variations in surface area based on starting material and
heating temperature). A tertiary goal is to demonstrate
that not only surface area but surface heterogeneity is
also responsible for the resulting sorption character-
istics. Toward this end, a series of char samples were
obtained from various forest fires and volcanic activity
sites and their sorptive properties were measured. To
gain further insight into the sorptive properties of the
field chars, the sorptive effects were also characterized
for a range of wood chars produced under controlled
laboratory conditions with different starting materials
and heating temperatures; while these variables have
been evaluated in the activated carbon literature
(Mattson and Mark, 1971; Puri, 1980), to our knowl-
edge they are studied here for the first time with
environmental wood chars. In this work, we refer to
the chars as wood chars instead of charcoals because the
term charcoal traditionally refers to materials produced
under highly specific conditions, which are not likely to
be found in nature.
2. Experimental methods
2.1. Char samples
The field wood char samples evaluated in this study
were obtained from sites of different climates with
different native plant species; details of the sampling
methods are documented elsewhere (Scott et al., 2000).
The plant species and locations of the wildfires-lava
flow from which these samples were taken are given in
Table 1. Each sample was collected by hand from the
surface and labeled according to the plant species in the
vicinity and the date of the wildfire or pyroclastic flow.
Artificial wood char samples were prepared using
methods outlined elsewhere (Jones et al., 1991). Other
researchers have also applied this method to produce
artificial chars that were then used to investigate natural
char properties (Bustin and Guo, 1999). Different plant
species of similar size and shape, all containing woody
tissue, were either buried under sand or charred in a
sealed clay pot in a thermostatically controlled furnace
at temperatures between 300 and 820 1C for 1 h. This
method restricts the oxygen supply to the woody tissue,
thereby allowing the material to be charred rather than
combusted. After firing, the samples were allowed to
cool before being removed to prevent further change.
The starting materials and heating temperatures for the
laboratory-produced samples are presented in Table 2.
It should be noted that other char-preparing methods
utilize continuous purging of the gas phase to help
prevent redeposition of volatilized materials (Nguyen et
al., 2003). Research has yet to demonstrate which of
these methods may best replicate a given environmental-
heating scenario. Nonetheless, the goal of this research is
to evaluate variations in sorption trends for a range of
wood chars rather than to exactly replicate a given
environmental-heating condition or produce materials
with specific characteristics.
2.2. Surface-area measurements
Char samples (about 0.2 g) were outgassed for roughly
16 h (overnight) at 90 1C under a flow of helium (about
10mlmin�1) before being used for surface-area analysis
using a GEMINI-2360 surface-area analyzer from
(Micromeritics). The surface areas were determined
from the BET plot of the N2 adsorption data at liquid
N2 temperature (77K) and relative pressures (PPo�1)
between 0.05 and 0.20. Five data points were used to
construct the plot to derive the monolayer adsorption
capacity, from which the surface area was calculated
using the N2 molecular area of 16.2E-20m2. The open
surface areas and the micropore volumes were deter-
mined from t-plots (de Boer et al., 1966) by use of the N2
adsorption data. Detailed methods for these analyses are
described by Rutherford et al. (1997).
2.3. Total organic-carbon fraction measurements
The total organic-carbon fraction (foc) of char
samples was analyzed by measuring the amount of
CO2 produced by sample combustion using a total
organic-carbon analyzer (TOC 5050A, Shimadzu, Ja-
pan). Calibration was achieved with a 144 g l�1 standard
glucose solution (Fisher Biotech, New Jersey). Analysis
was carried out with an oven temperature of 900 1C on

ARTICLE IN PRESS
Table
1
Info
rmation
ofnatu
ralch
ars
Sample
Startingmaterial
Samplingplace
f oca
Totalsu
rface
areab
(m2g�1)
Open
csu
rface
area
(m2g�1)
Totalpore
volumeb
(cm
3g�1)
Micro
pore
cvolume
(cm
3g�1)
MVO-456
Angiosp
erm
from
pyro
clastic
flow
Montserra
t,Caribbea
nIslands
0.81
19
1.4
0.0128
0.0096
MVO-457
Angiosp
erm
from
pyro
clastic
flow
Montserra
t,Caribbea
nIslands
0.81
3.8
3.2
0.0075
0.0003
OF
Mixed
wood
char
Wildfiresin
Western
Canada
0.58
3.1
2.2
0.0054
0.0005
PP
Pop
ulu
ssp
p.
Wildfiresin
Western
Canada
0.54
2.4
1.6
0.0044
0.0004
1989
Pop
ulu
ssp
p.
Fro
m1989Canadian
Forest
Fire
0.68
1.7
0.3
0.0022
0.0007
1982
Pop
ulu
ssp
p.
Fro
m1982Canadian
Forest
Fire
0.83
85
6.2
0.0502
0.0399
af o
c:org
anic-carb
on
fractionalco
ntent.
bErrors
on
surface
area,pore
volume,
open
surface
area,and
micro
pore
are
allwithin
5%
(plusand
minus).
cDetermined
from
t-plots
(deBoer
etal.,1966).
G. James et al. / Water Research 39 (2005) 549–558 551
the solid sample module. Since this analytical method
could not distinguish between carbons from carbonized
material (such as char) and normal organic matter, the
determined carbon fractions of char samples are
operationally termed the total organic-carbon fractions
(foc).
2.4. Isotherm tests
Phenanthrene solutions for sorption by wood chars
were prepared in synthetic ground water (deionized
water with 44mg l�1 CaCl2 H2O, 14mg l�1 CaSO4, and
17mg l�1 NaHCO3 added). Sodium azide was added at a
concentration of 200mg l�1 to prevent phenanthrene
biodegradation. Batch isotherm experiments were con-
ducted in triplicate in 100ml crimp-top glass vials. To
expedite equilibrium, char samples were pulverized by
hand before being passed through a 200-mesh sieve.
Others have demonstrated that pulverization of acti-
vated carbon (Randtke and Snoeyink, 1983) or sedi-
mentary samples containing natural organic matter
(Rugner et al., 1999) did not significantly alter the
sorption capacity. Selected samples, including wood
chars with low and high surface areas, were monitored
for sorption kinetics. Samples with pulverized material
reached sorption equilibrium within 7 days. A range of
phenanthrene concentrations [0.04–0.77 of Sw where
Sw ¼ 1.3mg l�1(Kleineidam et al., 2002)] were prepared
and added to the char samples (approximately 3mg).
Samples were kept in the dark at 20 1C, and shaken once
each day for 7 days. Phenanthrene concentrations were
analyzed using a Shimadzu RF-551 PC Spectrofluoro-
metric Detector in cuvette mode.
For each batch experiment triplicate blank samples
(containing only phenanthrene) were prepared and
monitored. These blank samples did not indicate any
significant phenanthrene degradation or sorptive losses
on the glassware for the duration of the experiment.
Previous studies have described these methods in
additional detail (Kleineidam et al., 1999; Karapanagioti
and Sabatini, 2000; Karapanagioti et al., 2000; James,
2001).
3. Data analysis
Since the primary interest of this study is the sorption
capacity and isotherm nonlinearity associated with a
wood char, the Freundlich equation was used to evalute
these effects. The Freundlich equation relates the mass
of chemical sorbed per unit mass of solid (qe) (mg kg�1)
to the equilibrium solute concentration (Ce) (mg l�1) as
follows:
qe ¼ K frCNe ; (1)
ARTICLE IN PRESS
1,E+05
1,E+06
1,E+07
1,E+08
1 10 100 1000
Ce (µg l-1)
qe
(µg
kg
-1)
f oc-1
MVO 456MVO 457OFPP19891982
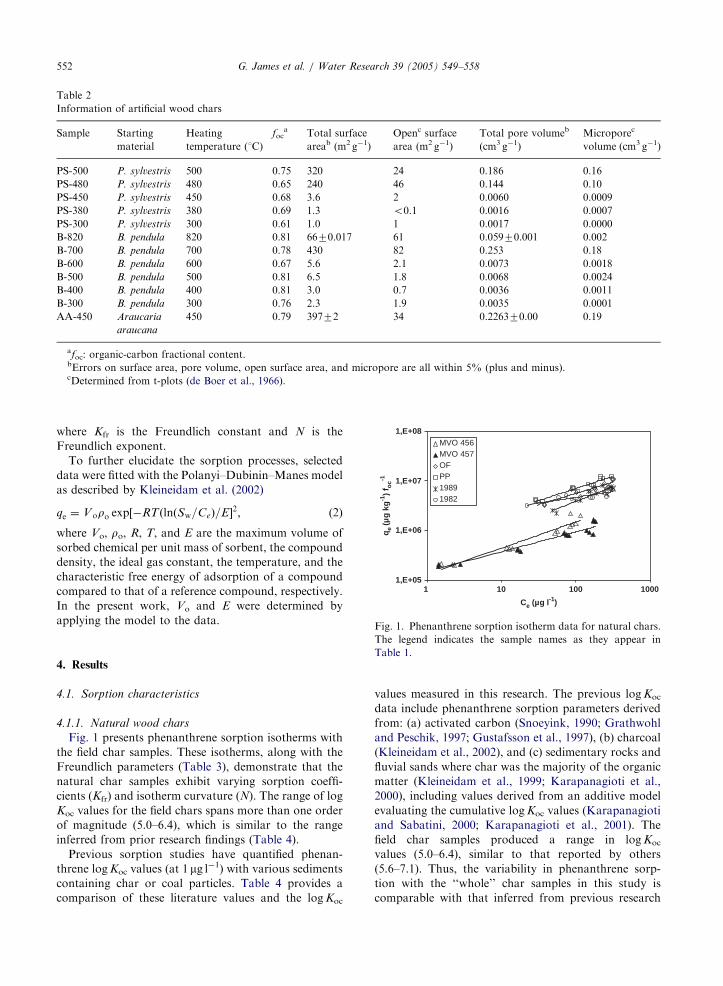
Fig. 1. Phenanthrene sorption isotherm data for natural chars.
Table 2
Information of artificial wood chars
Sample Starting
material
Heating
temperature (1C)
foca Total surface
areab (m2 g�1)
Openc surface
area (m2 g�1)
Total pore volumeb
(cm3 g�1)
Microporec
volume (cm3 g�1)
PS-500 P. sylvestris 500 0.75 320 24 0.186 0.16
PS-480 P. sylvestris 480 0.65 240 46 0.144 0.10
PS-450 P. sylvestris 450 0.68 3.6 2 0.0060 0.0009
PS-380 P. sylvestris 380 0.69 1.3 o0.1 0.0016 0.0007
PS-300 P. sylvestris 300 0.61 1.0 1 0.0017 0.0000
B-820 B. pendula 820 0.81 6670.017 61 0.05970.001 0.002
B-700 B. pendula 700 0.78 430 82 0.253 0.18
B-600 B. pendula 600 0.67 5.6 2.1 0.0073 0.0018
B-500 B. pendula 500 0.81 6.5 1.8 0.0068 0.0024
B-400 B. pendula 400 0.81 3.0 0.7 0.0036 0.0011
B-300 B. pendula 300 0.76 2.3 1.9 0.0035 0.0001
AA-450 Araucaria
araucana
450 0.79 39772 34 0.226370.00 0.19
afoc: organic-carbon fractional content.bErrors on surface area, pore volume, open surface area, and micropore are all within 5% (plus and minus).cDetermined from t-plots (de Boer et al., 1966).
G. James et al. / Water Research 39 (2005) 549–558552
where Kfr is the Freundlich constant and N is the
Freundlich exponent.
To further elucidate the sorption processes, selected
data were fitted with the Polanyi–Dubinin–Manes model
as described by Kleineidam et al. (2002)
qe ¼ Voro exp½�RTðlnðSw=CeÞ=E�2; (2)
where Vo, ro, R, T, and E are the maximum volume of
sorbed chemical per unit mass of sorbent, the compound
density, the ideal gas constant, the temperature, and the
characteristic free energy of adsorption of a compound
compared to that of a reference compound, respectively.
In the present work, Vo and E were determined by
applying the model to the data.
The legend indicates the sample names as they appear in
Table 1.
4. Results4.1. Sorption characteristics
4.1.1. Natural wood chars
Fig. 1 presents phenanthrene sorption isotherms with
the field char samples. These isotherms, along with the
Freundlich parameters (Table 3), demonstrate that the
natural char samples exhibit varying sorption coeffi-
cients (Kfr) and isotherm curvature (N). The range of log
Koc values for the field chars spans more than one order
of magnitude (5.0–6.4), which is similar to the range
inferred from prior research findings (Table 4).
Previous sorption studies have quantified phenan-
threne logKoc values (at 1 mg l�1) with various sediments
containing char or coal particles. Table 4 provides a
comparison of these literature values and the logKoc
values measured in this research. The previous logKoc
data include phenanthrene sorption parameters derived
from: (a) activated carbon (Snoeyink, 1990; Grathwohl
and Peschik, 1997; Gustafsson et al., 1997), (b) charcoal
(Kleineidam et al., 2002), and (c) sedimentary rocks and
fluvial sands where char was the majority of the organic
matter (Kleineidam et al., 1999; Karapanagioti et al.,
2000), including values derived from an additive model
evaluating the cumulative logKoc values (Karapanagioti
and Sabatini, 2000; Karapanagioti et al., 2001). The
field char samples produced a range in logKoc
values (5.0–6.4), similar to that reported by others
(5.6–7.1). Thus, the variability in phenanthrene sorp-
tion with the ‘‘whole’’ char samples in this study is
comparable with that inferred from previous research

ARTICLE IN PRESS
Table 3
Isotherm results with phenanthrene and chars collected in nature
Samplea Kfrb (mg kg�1) (lm g�1)N Nc log (Kfr
bfoc�1d) ¼ logKoc
e at Cef¼ 1mg l�1, 95% CIg
MVO-456 1.1 E 571.3 E 4 0.5370.04 5.0–5.2
MVO-457 1.2 E 571.4 E 4 0.4070.03 5.1–5.3
OF 3.9 E 578.2 E 4 0.4670.05 5.6–6.1
PP 4.0 E 576.2 E 4 0.4970.04 5.7–6.0
1989 1.7 E 575.3 E 4 0.6070.07 5.0–5.8
1982 1.3 E 672.9 E 5 0.2470.05 5.9–6.4
aSample names are explained in Table 1.bKfr: Freundlich sorption constant.cN: Freundlich exponent.dfoc: organic-carbon fractional content.eKoc: organic-carbon fractional content normalized sorption coefficient.fCe: equilibrium concentration of the contaminant in solution (mg l�1).gCI: confidence interval based on triplicate samples.
Table 4
Phenanthrene logKoca values at equilibrium concentration ¼ 1mg l�1 for pyrogenic materials from previous studies and the present
work
Source Material logKoca N b
(Snoeyink, 1990)c Activated carbon 7.1 0.44
(Grathwohl and Peschik, 1997)c Activated carbon 5.8–6.0 0.56–0.70
(Gustafsson et al., 1997) Soot 7.1
Activated carbon 6.5–7.1d
(Kleineidam et al., 2002) Charcoal 6.4e
(Kleineidam et al., 1999) Opaque particles, char, coal 6.3–6.8
(Karapanagioti et al., 2000) Char or coal-dominated particulate organic matter 5.6–6.4 0.55–0.57
(Karapanagioti and Sabatini, 2000) Opaque particles 5.8
(Karapanagioti et al., 2001) Opaque particles 5.6–6.8
Present research Natural chars 5.0–6.4 0.24–0.60
Artificial wood chars 5.4–7.3 0.13–0.42
aKoc: organic-carbon fractional content normalized sorption coefficient.bN: Freundlich exponent.cCalculated based on isotherm results and assuming activated carbon organic carbon content fraction foc ¼ 0.8.dCalculated by present work, reference (Gustafsson et al., 1997) from other references.eCalculated from (Kleineidam et al., 2002) using the same data analysis and units as in the present work, reference (Kleineidam et al.,
2002) reports values of 5.6 and 5.0 calculated from a combined partitioning and Polanyi potential theory based model, on the bases of
subcooled liquid solubilities and water solubilities, respectively, at Ce ¼ 1mg l�1.
G. James et al. / Water Research 39 (2005) 549–558 553
with char-containing aquifer materials (Karapanagioti
and Sabatini, 2000; Karapanagioti et al., 2001).
4.2. Artificial wood chars
Given that the field chars show a high degree of
variability in their surface properties and behavior, it is
worthwhile to explore the contributing factors using
chars produced under controlled conditions. Artificial
wood chars were thus prepared with different starting
materials and heating temperature; while in the activated
carbon literature these factors are well known to affect
the sorptive properties of the resulting material (Matt-
son and Mark, 1971; Puri, 1980), to our knowledge this
is the first time they have been evaluated for subsurface
wood chars. Given that it is impossible to exactly
reproduce the specific field charring conditions, our
intent here is to evaluate whether starting material and
heating temperature can help explain the observed range
in sorption characteristics for field wood chars.

ARTICLE IN PRESSG. James et al. / Water Research 39 (2005) 549–558554
4.3. Sorption properties and heating temperatures
Fig. 2 shows the phenanthrene uptake isotherms with
the artificial wood char samples from the species Pinus
sylvestris and Betula pendula. The isotherm data clearly
demonstrates that phenanthrene sorption (qe) increases
for materials exposed to higher temperatures, showing a
sharp jump at specific heating temperatures (450–480 1C;
Fig. 2a). Also, for samples from the species B. pendula, a
sorption jump occurs for samples heated at 600–700 1C
(Fig. 2b). While the specific temperature at which this
jump occurs may depend on the method used to produce
the char samples, these results show that the heating
temperature can be at least partly responsible for the
observed variation in wood char adsorptivity. These
sorption jumps also coincide with dramatic increases in
surface area (Table 2). Additionally, isotherms with the
artificial chars become increasingly nonlinear as the
heating temperature increases. The N values range from
0.42, which is moderately nonlinear to 0.13, which is
highly nonlinear (Table 5 presents the Kfr and N values
of the isotherms shown in Figs. 2a and b). This
1,E+05
1,E+06
1,E+07
1,E+08
1 10 100 1000
Ce (µg l-1)
qe
(µg
kg
-1)
f oc-1
PS 500 PS 480PS 450PS 380PS 300
1,E+05
1,E+06
1,E+07
1,E+08
1 10 100 1000
Ce (µg l-1)
q e
(µg
kg
-1)
f oc-1
B 820
B 700
B 600
B 500
B 400
B 300
(a)
(b)
Fig. 2. Phenanthrene sorption isotherm data for artificial chars
from the species (a) P. sylvestris and (b) B. pendula. The legend
indicates the temperature of heating.
increasing nonlinearity reflects an increasing heteroge-
neity of the char surface and thus its affinity for
nonpolar solutes.
4.4. Variation with source material
The surface properties of a wood char produced at a
given heating temperature also depend on the starting
material. The phenanthrene uptake isotherms with
450 1C P. sylvestris and 500 1C B. pendula samples are
very similar (Fig. 3, Kfr and N values in Table 5).
However, the isotherms for P. sylvestris and Araucaria
araucana samples are different (Fig. 3), even though
their heating temperatures are the same (450 1C). Thus,
at a given heating temperature, wood chars from varying
starting materials may exhibit differing sorptive capa-
cities even if they are heated under similar conditions.
For comparison purposes, Table 5 presents the
normalized sorption capacities (Kfrfoc�1) of phenanthrene
on wood chars at Ce ¼ 1 mg l�1 (logKoc). The phenan-
threne logKoc values are observed to range from 5.4 to
7.3 (Table 5). These values are consistent with the range
of logKoc values (5.6–6.8) that Karapanagioti et al.
(2001) found from samples containing opaque (char-
like) particles. The pattern of increasing logKoc values
with increasing heating temperature is observed for all
the artificially produced wood chars (Table 5). Thus, the
present results demonstrate that heating temperature
and starting material are potential factors that can help
explain the sorptive variability of natural chars,
concepts well known in the activated carbon literature
but to our knowledge demonstrated here for the first
time with natural wood chars.
4.5. Surface area and related properties of chars
Tables 1 and 2 present data on total surface area,
open surface area, total porosity, and microporosity for
the field and artificial wood char samples. The term open
surface area refers to the area associated with the
nonporous structure of the solid whereas the total
surface area includes the surface area from the porous
structure of the solid. Total porosity refers to the total
volume of all micro-, meso-, and macro-pores and
microporosity refers only to the volume of micropores
that have a diameter less than 20 A (Gregg and Sing,
1982; Chiou, 2002).
For the field chars, total surface areas range from 1.7
to 85m2 g�1. Samples with high total surface areas also
exhibit high micropore volumes (e.g., MVO-456, 1982).
However, no simple correlation exists between these
properties and the sampling site, the cause/extent of
charring, or the starting material. Samples MVO-456
and MVO-457, both produced from pyroclastic flow and
collected at the same site, exhibit total surface areas of
19 and 3.8m2 g�1, respectively. Also, samples 1989 and

ARTICLE IN PRESS
Table 5
Isotherm results with phenanthrene and artificial wood chars
Samplea Kfrb (mg kg�1)
(lm g�1)NNc qe
d SA�1 (mgm�2) at
Cee¼ 300mg l�1
Vof (cm3 kg�1) log (Kfr
bfoc�1g) ¼ logKoc
h at
Cee¼ 1mg l�1 (95% CIi)
PS-500 1.1 E 771.1 E 6 0.1370.03 78 0.022 7.1–7.3
PS-480 5.6 E 677.1 E 5 0.1570.03 58 0.014 6.8–7.1
PS-450 9,3 E 577.3 E 4 0.2570.02 1500 0.0037 6.1–6.2
PS-380 3.3 E 574.3 E 4 0.3670.04 2600 0.0026 5.5–5.9
PS-300 2.5 E 574.2 E 4 0.4270.04 3400 0.0034 5.4–5.8
B-820 1.0 E 777.9 E 5 0.2170.02 470 0.028 7.0–7.2
B-700 1.2 E 771.8 E 6 0.1670.04 62 0.024 7.0–7.3
B-600 4.3 E 571.1 E 5 0.4270.07 700 0.0073 5.5–6.1
B-500 6.4 E 571.2 E 5 0.3670.04 740 0.0050 5.7–6.1
B-400 6.6 E 576.8 E 4 0.3270.03 1600 0.0041 5.8–6.0
B-300 7.5 E 571.5 E 5 0.2770.05 3400 0.0030 5.8–6.2
AA-450 3.4 E 674.0 E 5 0.3470.04 56 0.019 6.5–6.7
aSample names are explained in Table 2.bKfr: Freundlich sorption constant.cN: Freundlich exponent.dqe: mass of chemical sorbed per unit mass of soil.eCe: equilibrium concentration of the contaminant in solution (mg l�1).fVo: maximum volume of sorbed chemical per unit mass of sorbent.gfoc: organic-carbon fractional content.hKoc: organic-carbon fractional content normalized sorption coefficient.iCI: confidence interval; mean7standard deviation.
1,E+06
1,E+07
1,E+08
1 10 100 1000
Ce (µg l-1)
qe
(µg
kg
-1)
f oc-1
Araucaria araucana-450Pinus sylvetris-450Birch pendula-500
Fig. 3. Comparison of the phenanthrene sorption isotherms for
artificial chars from three different species given similar heating
temperatures.
G. James et al. / Water Research 39 (2005) 549–558 555
1982, both from the same starting material, Populus spp.,
have total surface areas of 1.7 and 85m2 g�1, respec-
tively.
For the artificial wood char samples, a dramatic
increase in surface area occurs at a certain heating
temperature. For example, for the wood char from the
B. pendula series (B-300 to B-820), the total surface area
is less than 6.5m2 g�1 for all samples heated between 300
and 600 1C, but increases dramatically to 430m2 g�1
when heated at 700 1C. Likewise, for the P. sylvestris
series the total surface area increases from less than
3.6m2 g�1 when heated below 450 1C to greater than
240m2 g�1 when heated at higher than 480 1C. Similar
trends are also observed for the other three properties
(i.e. open surface area, total porosity and microporos-
ity).
From Table 2, the fractions of the open surface area
to the total surface area decrease for samples with high
total surface areas. For example, 38% of the total
surface area (66m2 g�1) for sample B-600 comes from
the open surface area, whereas for B-700 only 19% of
the total surface area (430m2 g�1) comes from the open
surface. This suggests that the heating process produces
a significant amount of micropores, which agrees with
the measured micropore volumes in Table 2 (e.g. B-600:
0.0018 cm3 g�1 vs. B-700: 0.18 cm3 g�1).
Samples with low total surface area generally have
larger fractions of open surface area. It appears that low
temperatures do not activate the charred wood well
enough to produce micropores. In some cases, however,
the high-temperature heating may also produce small
surface areas. For the B. pendula series with the heating
temperature increasing from 700 to 820 1C, the total
surface area decreased from 430 to 66m2 g�1; a similar
decrease occurred for the other three properties (i.e.
open surface area, total porosity, and microporosity). At
high heating temperatures (i.e. higher than 820 1C) the
pores created do not contribute to surface area and
adsorption of N2 and our solute (Van Krevelen, 1993).
While this may well be an artifact of our experimental

ARTICLE IN PRESSG. James et al. / Water Research 39 (2005) 549–558556
procedure for producing wood chars, such a situation
might also occur in natural systems.
5. Discussion
Since the Koc values indicate that partitioning is not
the only sorption mechanism active, alternate mechan-
isms are explored. Fig. 4 presents logKoc values (at
Ce ¼ 1mg l�1) for all chars studied in the present work
versus their surface areas. As expected there is a general
trend of increasing logKoc with increasing surface area;
however, the increase is not proportional for all samples.
These results suggest that while increases in surface area
do result in increased sorption, the surface areas created
by the different chars exhibit varying sorption affinities.
This is also corroborated by the calculated qe SA�1 at
Cee¼ 300 mg l�1 (the maximum equilibrium concentra-
tion in our experiments) and Vo which were calculated
on the assumption of surface sorption and pore filling,
respectively (Table 5). The qe SA�1 results suggest that
not all samples have equal coverage; Vo in some cases
overestimates the sample microporosity suggesting that
not only pore filling takes place for samples of low
surface area.
Thus, it is observed that surface area alone is not
adequate to fully characterize char adsorption. A recent
study shows that different heating temperatures produce
different amounts of hydrophilic acidic/basic surface
groups (Chun et al., 2004). Such hydrophilic groups
strongly attract water and thus reduce the adsorption of
organic solutes from water by adsorptive competition.
Thus, the adsorption per unit SA may vary significantly
among char samples. Also, many low-temperature chars
(or those heated at high temperatures with short heating
times) may also contain a significant amount of organic
residue that could contribute to char uptake by partition.
Thus, on a unit SA basis, one may find a higher uptake
5
6
7
8
1 10 100 1000
SA (m2 g-1)
log
Ko
c
Fig. 4. logKoc versus surface area (SA) for the laboratory and
field char samples.
with these low-temperature chars (Table 5). Certainly the
involvement of both organic residue and surface acidic/
basic polar groups could significantly affect the solute
uptake on a unit SA basis. With this consideration, it
appears that the simple properties (e.g., the quantity and
surface area of char or black carbon) commonly used to
characterize other well-defined adsorbent solids (e.g.,
activated carbon) might not be sufficient for characteriz-
ing the behavior of natural wood chars. Similar results
have been observed with black carbon contents in natural
solids (Karapanagioti et al., 2004).
6. Conclusions
The main conclusions of this study are as follows:
�
The uptake capacities and nonlinear sorption effectswith the laboratory wood chars are similar to those
with the field wood chars and observed in previous
research for char-containing aquifer materials; the
sorptive properties of the wood chars in this research
are highly heterogeneous.
�
For phenanthrene aqueous concentrations at 1 mg l�1,the organic carbon-normalized sorption coefficients,
logKoc, range from 5.0 to 6.4 for field chars and from
5.4 to 7.3 for laboratory wood chars, which is
consistent with variations inferred for wood chars in
previous studies (5.6–7.1).
�
The results with artificial chars suggest that there is acritical heating temperature above which a given
starting material produces a wood char with the
highest adsorption capacity and surface area (i.e., both
starting material and heating temperature impact
sorptive characteristics). Thus, these processes, which
are well known to be important in the activated carbon
literature, also prove to be important for sorption with
naturally produced wood chars.
�
Surface area alone is not adequate for characterizingsorptive characteristics; heterogeneous surface prop-
erties also contribute to sorptive properties of the
wood chars.
Acknowledgments
The authors would like to thank Dr. Mark Nanny
from the University of Oklahoma for assistance in
making foc measurements. Hrissi Karapanagioti was
partially funded by the Greek National Scholarship
Foundation while working on this project.
References
Allen-King, R.M., Grathwohl, P., Ball, W.P., 2002. New
modeling paradigms for the sorption of hydrophobic
ARTICLE IN PRESSG. James et al. / Water Research 39 (2005) 549–558 557
organic chemicals to heterogeneous carbonaceous matter in
soils, sediments, and rocks. Advances in Water Resources
25, 985–1016.
Bustin, R.M., Guo, Y., 1999. Abrupt changes (jumps) in
reflectance values and chemical compositions of artificial
charcoals and inertinite in coals. International Journal of
Coal Geology 38, 237–260.
Chiou, C.T., 1995. Comment on ‘‘thermodynamics of organic
chemical partition in soils’’. Environmental Science Tech-
nology 29, 1421–1422.
Chiou, C.T., 2002. Partition and Adsorption of Organic
Contaminants in Environmental Systems. Wiley Inter-
science, New Jersey.
Chiou, C.T., Kile, D.E., 1998. Deviation from sorption linearity
on soils of polar and nonpolar organic compounds at low
relative concentrations. Environmental Science Technology
32, 338–343.
Chiou, C.T., Kile, D.E., Rutherford, D.W., Sheng, G., Boyd,
S.A., 2000. Sorption of selected organic compounds from
water to a peat soil and its humic acid and humin fractions
potential sources of the sorption nonlinearity. Environ-
mental Science Technology 34, 1254–1258.
Chun, Y., Sheng, G., Chiou, C.T., Xing, B., 2004. Com-
positions and sorptive properties of crop residue-
derived chars. Environmental Science Technology 38,
4649–4655.
Cornelissen, G., Gustafsson, O., 2004. Sorption of phenan-
threne to environmental black carbon in sediment with and
without organic matter and native sorbates. Environmental
Science Technology 38, 148–155.
de Boer, J.H., Lippens, B.C., Linsen, B.G., Broekhoff, J.C.P.,
van der Heuvel, A., Osinga, Th.J., 1966. The t-curve of
multilayer N2-adsorption. Journal of Colloid Interface 21,
405–414.
Ghosh, U., Seb Gillete, J., Luthy, G.R., Zare, R.N., 2000.
Microscale location, characterization, and association of
polycyclic aromatic hydrocarbons on harbor sediment
particles. Environmental Science Technology 34,
1729–1736.
Grathwohl, P., Peschik, G., 1997. Permeable sorptive walls
for treatment of hydrophobic organic contaminant plumes
in ground water. In: Proceedings of International
Conference on Containment Technology. St. Petersburg,
Florida.
Gregg, S.J., Sing, K.S.W., 1982. Adsorption, Surface Area, and
Porosity, second ed. Academic Press, London.
Gustafsson, O., Haghseta, F., Chan, C., MacFarlane, J.,
Gschwend, P.M., 1997. Quantification of the dilute sedi-
mentary soot phase: implication for PAH speciation and
bioavailability. Environmental Science Technology 31,
203–209.
Huang, W., Young, T.M., Schlautman, M.A., Yu, H., Weber,
Jr., W.J., 1997. A distributed reactivity model for sorption
by solids and sediments: 9. General isotherm nonlinearity
and applicability of the dual domain model. Environmental
Science Technology 31, 1703–1710.
James, G., 2001. The impact of charcoal properties on
phenanthrene sorption Master’s Thesis, University of
Oklahoma, Norman, OK.
Jones, T., Scott, A.C., Cope, M., 1991. Reflectance measure-
ments against temperature of formation for modern
charcoals and their implications for the study of fusain.
Bulletin Geological Society France 162, 193–200.
Karapanagioti, H.K., Sabatini, D.A., 2000. Impacts of hetero-
geneous organic matter on phenanthrene sorption: different
aquifer depths. Environmental Science Technology 34,
2453–2460.
Karapanagioti, H.K., Kleineidam, S., Ligouis, B., Sabatini,
D.A., Grathwohl, P., 2000. Impacts of heterogeneous
organic matter on phenanthrene sorption: equilibrium and
kinetic studies with aquifer material. Environmental Science
Technology 34, 406–414.
Karapanagioti, H.K., Childs, J., Sabatini, D.A., 2001. Impacts
of heterogeneous organic matter on phenanthrene sorption:
different soil and sediment samples. Environmental Science
Technology 35, 4684–4690.
Karapanagioti, H.K., James, G., Sabatini, D.A., Kalaitzidis, S.,
Christanis, K., Gustafsson, O., 2004. Evaluating char-
coal presence in sediments and its effect on phenan-
threne sorption. Water, Air and Soil Pollution: Focus 4,
359–373.
Kleineidam, S., Rugner, H., Ligouis, B., Grathwohl, P., 1999.
Organic matter facies and equilibrium sorption of phe-
nanthrene. Environmental Science Technology 35,
1637–1644.
Kleineidam, S., Schuth, C., Grathwohl, P., 2002. Solubility-
normalized combined pore-filling-partitioning sorption iso-
therms for organic pollutants. Environmental Science
Technology 36, 4689–4697.
Mattson, J.S., Mark, H.B., 1971. Activated Carbon. Marcel
Dekker Inc., New York.
Nguyen, T.H., Brown, R.A., Ball, W.P., 2003. An evaluation of
thermal resistance as a measure of black carbon content in
diesel soot, wood char and sediment. Organic Geochemistry
35, 217–234.
Puri, B.R., 1980. In: Irwin, H., Suffet, Michael, J. McGuire.
(Eds.), Activated carbon adsorption. Discussions section.
Ann Arbor Science.
Randtke, S.J., Snoeyink, V.L., 1983. Evaluating GAC adsorp-
tive capacity. AWWA Journal 75, 406–413.
Rugner, H., Kleineidam, S., Grathwohl, P., 1999. Long-
term sorption kinetics of phenanthrene in aquifer
materials. Environmental Science Technology 33,
1645–1651.
Rutherford, D.W., Chiou, C.T., Eberl, D.D., 1997. Effects of
exchanged cation on the microporosity of montmorillonite.
Clays and Clay Minerals 45, 534–543.
Scott, A.C., Cripps, J., Nichols, G., Collinson, M.E., 2000. The
taphonomy of charcoal following a recent heathland fire:
and some implications for the interpretation of fossil
charcoal deposits. Palaeogeography, Palaeoclimatology
Palaeoecology 164, 1–31.
Snoeyink, V.L., 1990. Adsorption of organic compounds in
water quality and treatment. A handbook of Community
Water Supplies AWWA. McGraw-Hill, New York
(Chapter 13).
Van Krevelen, D.W., 1993. Coal: Typology–Physics–Chemis-
try–Constitution, third ed. Elsevier, Amsterdam.
White, J.C., Pignatello, J.J., 1999. Influence of bisolute
competition on the desorption kinetics of polycyclic
aromatic hydrocarbons in soil. Environmental Science
Technology 33, 4292–4298.

ARTICLE IN PRESSG. James et al. / Water Research 39 (2005) 549–558558
Xia, G., 1998. Sorption behavior of nonpolar organic chemicals
on natural sorbents. Ph.D. Dissertation, The John Hopkins
University, Baltimore, MD.
Xia, G., Ball, W.P., 1999. Adsorption-partitioning uptake of
nine low polar organic chemicals on a natural sorbent.
Environmental Science Technology 33, 262–269.
Xia, G., Ball, W.P., 2000. Polanyi-based models for the
competitive sorption of low polarity organic contaminants
on a natural sorbent. Environmental Science Technology
34, 1246–1253.
Xing, B., Pignatello, J.J., Gigliotti, B., 1996. Competitive
sorption between atrazina and other organic compounds in
soil and model sorbents. Environmental Science Technology
30, 2432–2440.


![SW MATM through ZONE - Cisco · %SW_MATM-4-MACFLAP_NOTIF:Host[enet]in[chars][dec]isflappingbetweenport[chars]andport [chars] Recommended Checkthenetworkforpossibleloops. Action %SW_MATM-4-WIRELESS](https://img.dokumen.tips/doc/110x75/5f7c820f9a0d1f3f5c674488/sw-matm-through-zone-cisco-swmatm-4-macflapnotifhostenetincharsdecisflappingbetweenportcharsandport.jpg)


