Embed Size (px)
DESCRIPTION
euroncap
Citation preview

EUROPEAN NEW CAR ASSESSMENT PROGRAMME
(Euro NCAP)
ASSESSMENT PROTOCOL – PEDESTRIAN PROTECTION
Version 6.0
February 2012

Version 6.0
February 2012
Copyright ©Euro NCAP - This work is the intellectual property of Euro NCAP. Permission is granted
for this material to be shared for non-commercial, educational purposes, provided that this copyright
statement appears on the reproduced materials and notice is given that the copying is by permission
of Euro NCAP. To disseminate otherwise or to republish requires written permission from Euro NCAP.

Version 6.0
February 2012
EUROPEAN NEW CAR ASSESSMENT PROGRAMME (Euro NCAP)
ASSESSMENT PROTOCOL – PEDESTRIAN PROTECTION
Table of Contents
1 INTRODUCTION .................................................................................................................. 1
2 METHOD OF ASSESSMENT .............................................................................................. 1
2.1 Points Calculation ...................................................................................................................... 1
3 PEDESTRIAN IMPACT ASSESSMENT ............................................................................ 2
3.1 Criteria and Limit Values ......................................................................................................... 2 3.1.1 Headform ............................................................................................................................................... 2 3.1.2 Upper Legform ...................................................................................................................................... 2 3.1.3 Legform ................................................................................................................................................. 3
3.2 Modifiers .................................................................................................................................... 3
3.3 Scoring & Visualisation............................................................................................................. 3 3.3.1 Scoring ................................................................................................................................................... 3 3.3.2 Headform Correction factor ................................................................................................................... 3 3.3.3 Visualisation of results ........................................................................................................................... 6
4 CONCEPTS BEHIND THE ASSESSMENTS ..................................................................... 8
4.1 Tolerance Limits ........................................................................................................................ 8
5 REFERENCES ...................................................................................................................... 9

Version 6.0 1 February 2012
EUROPEAN NEW CAR ASSESSMENT PROGRAMME (Euro NCAP)
ASSESSMENT PROTOCOL – PEDESTRIAN PROTECTION
1 INTRODUCTION
Important changes have been made to the Euro NCAP ratings resulting in the introduction of the
overall rating scheme. Individual documents are released for the four main areas of assessment:
Assessment Protocol – Adult Occupant Protection;
Assessment Protocol – Child Occupant Protection;
Assessment Protocol – Pedestrian Occupant Protection;
Assessment Protocol – Safety Assist;
In addition to these four assessment protocols, a separate document is provided describing the
method and criteria by which the overall safety rating is calculated on the basis of the car
performance in each of the above areas of assessment.
The following protocol deals with the assessments made in the area of Pedestrian Protection, in
particular in the adult and child head, the upper leg form and lower leg form impacts.
2 METHOD OF ASSESSMENT
The assessment of pedestrian protection is made with the use of headform, upper legform and
legform data. In the legform areas, the bumper and front of the bonnet of the car are divided into
zones which are assessed using the two legform impactors. Euro NCAP will select “worst case”
test points and manufacturers may nominate additional tests to be performed and the results will
be included in the assessment.
In the headform impact area, a grid will be marked on the outer surface of the vehicle. The vehicle
manufacturer is required to provide the Euro NCAP Secretariat with data detailing the protection
offered by the vehicle at all grid locations. The data shall be provided to the Euro NCAP
Secretariat before any test preparation begins. The predicted level of protection offered by the
vehicle is verified by Euro NCAP by means of testing of a sample of randomly selected grid-
points and the overall prediction is corrected accordingly.
2.1 Points Calculation
For the legform impact areas, a sliding scale system of points scoring has been used to calculate
points for each measured criterion. This involves two limits for each parameter, a more
demanding limit (higher performance), below which a maximum score is obtained and a less
Version 6.0 2 February 2012
demanding limit (lower performance), beyond which no points are scored. The maximum score
for each test zone is two points (one point per half for bumper and bonnet leading ledge testing).
Where a value falls between the two limits, the score is calculated by linear interpolation. No
capping is applied to any of the measurements.
For the headform impact area, the protection predicted by the vehicle manufacturer will be
compared to the outcome of the randomly selected test locations. The results at those test
locations will be used to generate a correction factor, which will then be applied to the predicted
score. Only data that results in a correction factor of between 0.500 and 1.500 are accepted.
Where this is not the case, the cause will be investigated and the Secretariat will subsequently
take a decision as to how to proceed. Where the data are accepted, the headform score will be
based on the predicted data score with correction applied.
3 PEDESTRIAN IMPACT ASSESSMENT
3.1 Criteria and Limit Values
The assessment criteria used for the pedestrian impact tests, with the upper and lower
performance limits for each parameter, are summarised below. Where multiple criteria exist for
an individual test, the lowest scoring parameter is used to determine the performance of that test.
3.1.1 Headform
The manufacturer must provide a predicted data for all grid points. This data shall be expressed as
a colour according to the corresponding colour boundaries for the predicted HIC15 performance
below. Alternatively, HIC15 values may be provided.
Green HIC15 < 650
Yellow 650 ≤ HIC15 < 1000
Orange 1000 ≤ HIC15 < 1350
Brown 1350 ≤ HIC15 < 1700
Red 1700 ≤ HIC15
The manufacturer is allowed to colour a limited number of grid points blue where the
performance is unpredictable. These grid points will always be tested. The procedure is detailed
in the Pedestrian Protection Test protocol.
3.1.2 Upper Legform
Higher performance limit
Bending Moment 300Nm* (20% risk of femur/pelvis fracture)
Sum of forces 5.0kN* (20% risk of femur/pelvis fracture)
(*EEVC Limits)

Version 6.0 3 February 2012
Lower performance limit
Bending Moment 380Nm
Sum of forces 6.0kN
3.1.3 Legform
Higher performance limit
Tibia deceleration 150g* (20% risk of lower leg fracture) [3]
Knee shear displacement 6mm* (risk for initial knee joint damage) [3]
Knee bending angle 15º * (risk for initial knee joint damage) [3]
(*EEVC Limits)
Lower performance limit
Tibia deceleration 200g (40% risk of lower leg fracture) [3]
Knee shear displacement 7mm
Knee bending angle 20º
3.2 Modifiers
There are no modifiers applied.
3.3 Scoring & Visualisation
3.3.1 Scoring
A maximum of 24 points is available for the headform test zone. The total score for all grid points
is calculated as a percentage of the maximum achievable score, which is then multiplied by 24
points. The bonnet leading edge and bumper test zone will be awarded a maximum of 6 points
each. A total of 36 points are available in the pedestrian protection assessment.
3.3.1.1 Headform
Each of the grid points can be awarded up to one point, resulting in a maximum total amount of
points equal to the number of grid points. For each predicted colour the following points are
awarded to the grid point:
Green HIC15 < 650 1.00 point
Yellow 650 ≤ HIC15 < 1000 0.75 points
Orange 1000 ≤ HIC15 < 1350 0.50 points
Brown 1350 ≤ HIC15 < 1700 0.25 points
Red 1700 ≤ HIC15 0.00 points
3.3.2 Headform Correction factor
The data provided by the manufacturer is scaled using a correction factor, which is calculated
based on a number of verification tests performed. The verification points are randomly selected
Version 6.0 4 February 2012
grid points, distributed in line with the predicted colour distribution.
The actual tested total score of the verification test points is divided by the predicted total score of
these verification test points. This is called the correction factor, which can be lower or higher
than 1.
The correction factor is multiplied to all the grid points (excluding defaulted and blue points). The
final score for the vehicle can never exceed 100% regardless of the correction factor.
3.3.2.1 HIC tolerance
As test results can be variable between labs and in-house tests and/or simulations a 10% tolerance
to the HIC value of the verification test is applied. The tolerance is applied in both directions,
meaning that when a tested point scores better than predicted, but within tolerance, the predicted
result is applied. The tolerance only applies to verify whether the predicted colour of the tested
verification point is correct. When, including tolerance, the colour is not in line with the
prediction, the true colour of the test point will be determined based by comparing the actual
measured HIC value with the colour band in section 3.3.1.1 without applying a tolerance to the
HIC value.
Prediction HIC15 range Accepted HIC15 range
Green HIC15 < 650 HIC15 < 722.22
Yellow 650 ≤ HIC15 < 1000 590.91 ≤ HIC15 < 1111.11
Orange 1000 ≤ HIC15 < 1350 909.09 ≤ HIC15 < 1500.00
Brown 1350 ≤ HIC15 < 1700 1227.27 ≤ HIC15 < 1888.89
Red 1700 ≤ HIC15 1545.45 ≤ HIC15
3.3.2.2 Example:
Headform testing:
Manufacturer X has provided the following prediction to Euro NCAP with a total score of 90
points (excluding blue) out of the possible 195:

Version 6.0 5 February 2012
The prediction consists of the following:
15 Default Green x 1.00 = 15.00
30 Green x 1.00 = 30.00
30 Yellow x 0.75 = 22.50
30 Orange x 0.50 = 15.00
30 Brown x 0.25 = 7.50
30 Red x 0.00 = 0.00
15 Default Red x 0.00 = 0.00
15 Blue
195 grid points 90.00 points
15 verification points were chosen for testing:
Version 6.0 6 February 2012
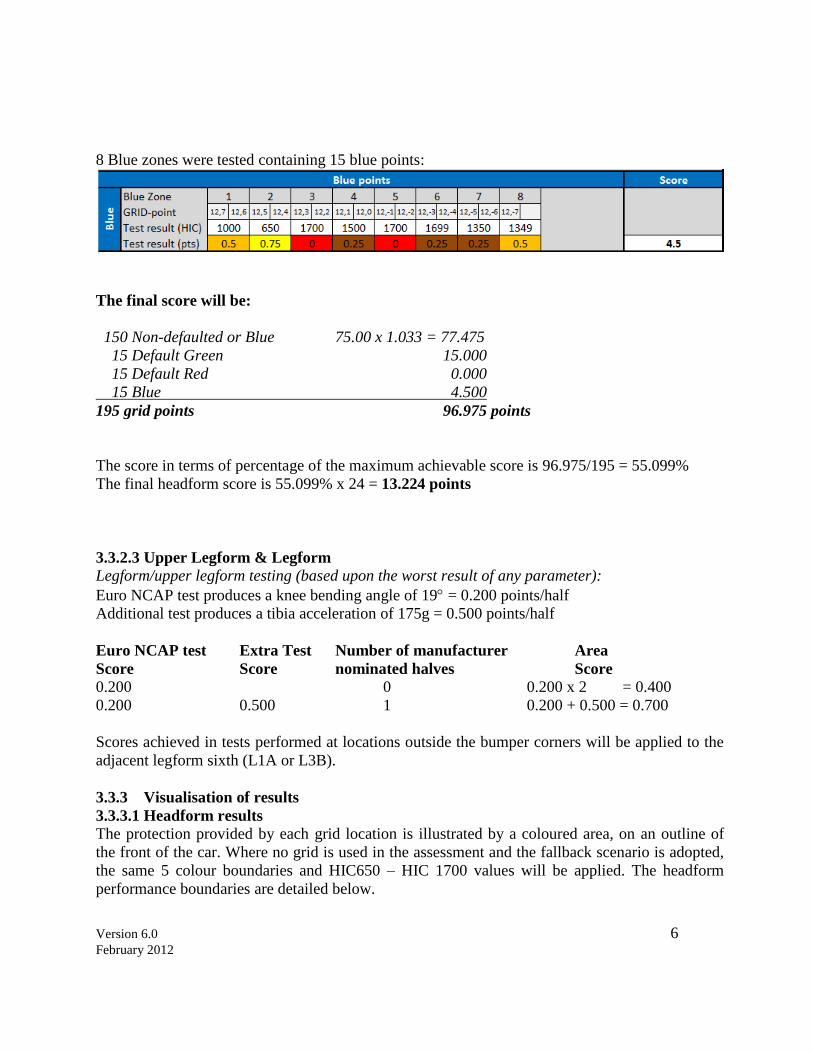
8 Blue zones were tested containing 15 blue points:
The final score will be:
150 Non-defaulted or Blue 75.00 x 1.033 = 77.475
15 Default Green 15.000
15 Default Red 0.000
15 Blue 4.500
195 grid points 96.975 points
The score in terms of percentage of the maximum achievable score is 96.975/195 = 55.099%
The final headform score is 55.099% x 24 = 13.224 points
3.3.2.3 Upper Legform & Legform
Legform/upper legform testing (based upon the worst result of any parameter):
Euro NCAP test produces a knee bending angle of 19 = 0.200 points/half
Additional test produces a tibia acceleration of 175g = 0.500 points/half
Euro NCAP test Extra Test Number of manufacturer Area
Score Score nominated halves Score 0.200 0 0.200 x 2 = 0.400
0.200 0.500 1 0.200 + 0.500 = 0.700
Scores achieved in tests performed at locations outside the bumper corners will be applied to the
adjacent legform sixth (L1A or L3B).
3.3.3 Visualisation of results
3.3.3.1 Headform results
The protection provided by each grid location is illustrated by a coloured area, on an outline of
the front of the car. Where no grid is used in the assessment and the fallback scenario is adopted,
the same 5 colour boundaries and HIC650 – HIC 1700 values will be applied. The headform
performance boundaries are detailed below.
Version 6.0 7 February 2012
Green HIC15 < 650 1.00 point
Yellow 650 ≤ HIC15 < 1000 0.75 points
Orange 1000 ≤ HIC15 < 1350 0.50 points
Brown 1350 ≤ HIC15 < 1700 0.25 points
Red 1700 ≤ HIC15 0.00 points
3.3.3.2 Legform & upper legform results
The protection provided by each legform test site is illustrated by a coloured area, on an outline of
the front of the car. The colour used is based on the points awarded for that test site (rounded to
three decimal places), as follows:
Green 2.000 points
Orange 0.001 – 1.999 points
Red 0.000 points
Version 6.0 8 February 2012
4 CONCEPTS BEHIND THE ASSESSMENTS
4.1 Tolerance Limits
Where possible, Euro NCAP uses EEVC biomechanical limits as the higher and lower
performance criteria. In order to discriminate between cars which more nearly meet the EEVC
requirements from those which greatly exceed them, a lower limit has been set. This has been
derived from the lower performance limit used in the European Regulation (EC) No 78/2009 in
case of the headform tests and mainly from experience gained in the early phases of Euro NCAP
in case of the legform and upper legform tests.

Version 6.0 9 February 2012
5 REFERENCES
1 Prasad, P. and H. Mertz. The position of the US delegation to the ISO Working Group 6 on
the use of HIC in the automotive environment. SAE Paper 851246. 1985
2 Mertz, H., P. Prasad and G. Nusholtz. Head Injury Risk Assessment for forehead impacts.
SAE paper 960099 (also ISO WG6 document N447)
3 EEVC WG17 Report, ‘Improved Test Methods to Evaluate Pedestrian Protection
Afforded by Passenger Cars’, September 2002.