Embed Size (px)
Citation preview

Estimation of the Total Cost of Bridge Construction for use in Accelerated Bridge 1
Construction Selection Decisions 2
By 3 4 Jianmin Jia 5
Graduate Research Assistant, Department of Civil and Environmental Engineering 6 Florida International University 7 10555 W. Flagler Street, EC 3730, Miami, FL 33174 8 Phone: (786) 571-0012, E-mail: [email protected] 9 10
Mohamed Ibrahim 11 Graduate Research Assistant, Department of Civil and Environmental Engineering 12
Florida International University 13
10555 W. Flagler Street, Miami, FL 33174 14 E-mail: [email protected] 15 16
Mohammed Hadi, Ph.D., P.E. 17 Associate Professor, Department of Civil and Environmental Engineering 18
Florida International University 19 10555 W. Flagler Street, EC 3605, Miami, FL 33174 20
Phone: (305) 348-0092, E-mail: [email protected] 21 22
Wallied Orabi 23 Assistant Professor, Department of Civil and Environmental Engineering 24
Florida International University 25 10555 W. Flagler Street, Miami, FL 33174 26
E-mail: [email protected] 27 28
Ali Mostafavi 29 Assistant Professor, Department of Civil and Environmental Engineering 30 Florida International University 31
10555 W. Flagler Street, Miami, FL 33174 32 E-mail: [email protected] 33
34 Yan Xiao, Ph.D., PE 35 Research Associate, Department of Civil and Environmental Engineering 36
Florida International University 37 10555 W. Flagler Street, EC 3730, Miami, FL 33174 38 Phone: (305) 348-1393, E-mail: [email protected] 39 40
A Paper Submitted for Presentation and Publication at the 95th Annual Meeting of the 41 Transportation Board, Washington, D.C. 42 43 Word Count = 4,167 words + 8 figures + 5 tables = 7,417 words 44 45
June 31, 2015 46

Jia et al. 1
ABSTRACT 1
In this study, a framework for the comparison of Accelerated Bridge Construction (ABC) and 2 conventional construction methods is developed and implemented to a case study. The 3
construction costs of ABC is estimated based on a historical database of ABC costs and point 4 towards higher cost of ABC compared to other methods. The main influencing factors on the 5 cost are found to be the average annual daily traffic (AADT), number of spans, location (urban 6 versus rural), and ABC type. Analyses based on limited data did not identify any statistically 7 significant difference in the indirect and agency costs between ABC and conventional bridge 8
construction methods. 9 This study incorporates the dollar values of mobility, travel time reliability, safety, and 10
emission in calculating user costs. The estimation of the construction impacts on the user costs is 11 done using a number of tools and methods that are integrated with the estimation of the 12
construction costs, in a single environment by the research team. The application of this study 13 framework to a case study demonstrates the benefits of using the total cost in the decision 14 making process associated with ABC versus conventional bridge selection. The case study 15
demonstrates that the ABC can have a higher construction cost than conventional methods but its 16 total cost can be lower, if all the elements of construction costs and user costs are added. 17
18 19 20
Key Words: Accelerated Bridge Construction, Construction Cost, Road User Cost, Construction 21
Type Decisions 22

Jia et al. 2
INTRODUCTION 1
According to the U.S. Department of Transportation status report of 2013, 25.9% of all the 2 bridges in the United States are either structurally deficient or functionally obsolete. There is 3
therefore a pressing need for significant bridge repair and replacement efforts (1). These bridge 4 projects create a challenge to State Transportation Agencies (STAs) across the country in order 5 to minimize the associated traffic disruptions in a safe way while preserving the quality of the 6 work and fulfilling budget constraints. In an effort to combat this challenge, the Federal Highway 7 Administration (FHWA) is adopting and promoting the implementation of accelerated bridge 8
construction techniques (ABC) through the “Every Day Counts” initiative to expedite project 9 delivery and minimize their impacts on the transportation network (2). 10
Accordingly, a number of STAs are implementing ABC techniques and have experienced 11 positive outcomes in a significant number of bridge replacement and/or rehabilitation projects. 12
However, ABC techniques are often associated with high initial costs, which deter many STAs 13 from a wider implementation of these techniques (3). In addition, the impacts of adopting these 14 accelerated techniques on the current bridge design and construction processes is not fully 15
understood, which adds to the complexity of choosing ABC over conventional methods in bridge 16 projects. Therefore, there is a pressing need to provide decision makers with an appropriate 17
estimating tool of the total cost of ABC projects including: construction, indirect, agency cost, 18 and user costs. This paper presents a framework for analyzing and estimating the total ABC cost 19 and compare it to the total cost of conventional construction methods. The aim is to support 20
agency decisions when selecting between conventional and ABC bridge construction approaches. 21 The framework is applied to a real-world case study to demonstrate its effectiveness in 22
supporting these decisions. 23 24
LITERATURE REVIEW 25
Accelerated Bridge Construction (ABC) methods have been successfully used by many STAs for 26
both planned and emergency bridge projects. However, the total cost of ABC projects are not 27 completely understood, let alone being included in the decision making process for such projects. 28
This total cost includes: construction, indirect, agency, user costs, and in some cases revenue loss 29 in the cases of toll facility construction. The total cost needs to be analyzed and estimated to 30 support better decisions in selecting ABC versus conventional bridge construction methods. 31
However, this process can be complex, as it involves the evaluation of different types of costs 32 including but not limited to: construction costs, engineering and inspection costs, user costs, 33
revenue loss costs, right of way, quality of work, and the impact on surrounding communities 34 and businesses (4). User costs should include the consideration of the impacts on mobility, 35
reliability, motorist and construction worker safety, the environments, and businesses, among 36 others. Unfortunately however, the lack of appropriate tools inclusive of the aforementioned 37 factors does not allow the agencies to fully realize the true benefits and appreciate the true costs 38 of ABC compared to conventional bridge construction. There are a number of existing tools that 39 are currently in use by or available to STAs to support their decision-making related to ABC. 40
These tools can be categorized under two main categories: qualitative and AHP-based 41 quantitative tools. 42
Qualitative decision support tools currently in use by STAs include flowcharts, matrices, 43 and questionnaires. One of the most widely used qualitative tools is the FHWA flowchart (5) that 44 is designed to assist decision makers in determining whether the use of prefabricated bridges is 45

Jia et al. 3
suitable for their projects or not. The flowchart includes questions related to major factors that 1 might justify the use of ABC, such as: average daily traffic; whether it is an emergency bridge 2 replacement project; whether the bridge is on an evacuation route; detours and lane closures 3 times; and whether the bridge construction is on the critical path of the project schedule. If the 4
user answers “no” to all these questions, the use of ABC is only justified if it improves safety 5 and/or if the construction cost is less than that of conventional bridge construction. Alternatively, 6 if the answer to any one of five aforementioned questions is “yes”, then the decision maker 7 should consider ABC after examining the bridge’s need for rapid construction, and its safety and 8 costs impacts. Similar decision making practices are followed in other qualitative tools, such as 9
the FHWA matrix (5) and STA questionnaires. This kind of subjective practice that uses a yes/no 10 and/or Likert scale approaches to evaluate ABC projects is insufficient in identifying and 11 evaluating the true costs of ABC methods. 12
AHP-based quantitative tools are also used for ABC decision making. One of these tools, 13 and perhaps the most well-known ABC decision making tool, is developed by the Oregon 14 Department of Transportation (ODOT) in collaboration with seven other DOTs (6). In this tool, 15
five main decision criteria are considered: direct cost, indirect cost, schedule constraints, site 16 constraints, and customer service. Furthermore, a set of sub-criteria was developed for each of 17
these five criteria. The tool guides the decision makers through performing two-step pair-wise 18 comparisons between the construction alternatives for each of the criteria selected by the users 19 based on their goals and priorities. This method considers myriad factors and reduces the very 20
high subjectivity inherent in the qualitative tools by attempting to assign scores to each 21 construction method based on its performance in each of the criteria considered. However, these 22
scores and their relative weights are still subjective since they are assigned based on the user’s 23 perceptions rather than objective evaluation and in-depth analysis. These tools are therefore 24
susceptible to underestimation or overestimation of the utility of different alternatives. While 25 such methods might be suitable for inherently subjective criteria, such as customer service, they 26
are insufficient to objectively evaluate criteria such as construction, indirect and user costs. 27 Another important component in decision-making process is to assess the user costs. The “Work 28 Zone Road User Costs – Concepts and Applications” report produced for the Federal Highway 29
Administration presents a framework for the use of user and construction costs in alternative 30 analysis and associated decision making process which can also be implemented on ABC and 31
conventional construction method (7). The report also discusses how the unit cost of delays, 32 vehicle operating cost, crashes, and safety can be calculated based on outputs from tools and 33
methods that can calculate these parameters. 34 A number of tools have been developed that can be used to assess the impacts of work 35
zones on mobility. The FHWA Traffic Analysis Toolbox Volumes VIII and IX classifies these 36
tools to sketch planning tools, traffic demand models, signal optimization tools, macroscopic 37 simulation, mesoscopic simulation, and microscopic simulation. These documents provide 38 guidance to assist in selecting between these different types of tools based on various factors. 39 The sketch planning tools range from simple spreadsheets that allow the analysis of a single link 40
like the Q-DAT (8) developed for Texas Transportation Institute (TTI) to slightly more 41 complicated tools like the QuickZone tool (9) developed by the FHWA that allows the modeling 42 of multiple links on the subject facility and alternative route. A good example of macroscopic 43 simulation models are the tools that implement the freeway and urban street facility procedures 44 of the Highway Capacity Manual (HCM) including the soon to be updated work zone procedures 45 in the 2015 update to the HCM (10). An example of the use of demand forecasting modeling 46

Jia et al. 4
tools and simulation-based dynamic traffic assignment modeling tools is reported in the WISE 1 approach developed as part of the SHRP 2 R11 project (11). Although the above tools can 2 provide estimates of mobility impacts, they do not consider reliability, emission, and safety 3 impacts, which can add to the total cost and influence the decision-making process of 4
construction projects. Recent information, tools, and findings from the TRB SHRP 2 Reliability 5 program, EPA MOVES emission modeling, and Highway Safety Manual (HSM) (12) procedures 6 are not considered. The availability of real-word data from advanced traffic monitoring systems 7 and other sources has increased in recent year, allowing the use of data in the decision making 8 process and in the development and validation of models. 9
10
METHODOLGY 11
In this study, a framework was developed and applied to analyze and compare the total cost of 12
ABC versus conventional construction methods. This framework analyzes utilizes information 13 such as bridge characteristics, project schedule, and traffic data to estimate construction, agency 14 and indirect costs, and road user costs, as shown in Figure 1. The following sections describe the 15
framework components. 16
17
18
Figure 1 Flow chart for total cost analysis framework 19
20
Construction Costs 21
An important component of the developed framework is to estimate the direct construction costs 22 of ABC projects and compare it to conventional construction methods. These costs include the 23 material, labor, and equipment costs needed to build the bridge in addition to the contractor’s 24 indirect costs. Agencies still have no good answers regarding the relative costs of the two 25 construction approaches. To help answering this question, a model was developed in this study 26 to estimate and identify the expected construction costs expressed in $/ft
2 for ABC bridges. 27

Jia et al. 5
To develop the cost estimation model, historical data on construction costs of ABC 1 projects was collected from the FHWA SharePoint database developed under the National ABC 2 Project Exchange, which is an ongoing project sponsored by Florida International University – 3 University Transportation Center. This database includes data on the final construction costs for 4
a considerable number of nationwide ABC projects. In addition, follow-up email and phone calls 5 to other transportation agency personnel was conducted to complete any missing data, where 6 needed. In total, the research team was able to collect sufficient data for a total of 65 ABC 7 projects from 29 different states (as shown in Figure 2). The collected data cover bridges 8 constructed between the years of 1998 and 2013 and include ABC methods such as: self-9
propelled modular transporter (SPMT), lateral sliding, and pre-fabricated bridge elements & 10 systems (PBES). 11
12
13
Figure 2 Data from nationwide ABC projects 14
In order to account for the relatively long time span of the collected bridge project data 15
and their geographical distribution over the nation, the collected cost data was normalized by 16 time and location to allow for an accurate analysis. This normalization was performed using the 17
time and location indices from the widely used RSMeans cost data (http://www.rsmeans.com). 18
Using the RSMeans time indices, all construction costs were adjusted to the year 2014. Similarly, 19 construction costs were normalized to the national average using the indices correspondent to 20 each bridge location. 21 22 Data Analysis 23
In order to facilitate the development of the estimation model, it is important to identify the most 24 important and influencing variables of the bridge characteristics. Therefore, the collected data 25 was categorized in clusters of bridges that share the same characteristics. To this end, the data 26 was clustered by four main variables: (i) bridge location, (ii) type, (iii) annual average daily 27 traffic (AADT), and (iv) number of spans. For example, 39 out of the 65 bridges were 28
constructed in rural locations and 50 of them were concrete bridges (see Figure 3). The 65 29 bridges had spans ranging from a single span to seven spans. The annual average daily traffic on 30 these bridges ranges from, as low as few hundreds, to as high as 200,000 vehicles. 31

Jia et al. 6
1
Figure 3 Descriptive statistics of the collected data 2
A classification and regression tree (C&RT) analysis was performed on the 3 abovementioned clustered data using the SPSS software package to determine the impact of each 4
of the aforementioned four bridge characteristics on the final construction cost. As shown in 5
Figure 4 and Table 1, the C&RT analysis showed that all of the above four characteristics had 6
significant impacts on the final total construction cost of the ABC bridges with the AADT and 7 number of bridge spans being the two factors with the highest impact. This might be justified by 8
the higher construction, staging, and traffic control costs associated with projects dealing with 9 high AADT and larger number of spans. Similarly, the higher number of bridge spans signifies a 10 larger scope of work and therefore higher construction costs. Table 1 shows the relative 11
importance of the four variables in characterizing the construction cost of the ABC approach. 12

Jia et al. 7
B1
2
3
4
Figure 4 C&RT Analysis 5

Jia et al. 8
Table 1 Relative Importance of Independent Variables According to C&RT Analysis Results 1
Independent Variable Importance
AADT 100.0%
Number of Span 99.2%
Type 59.4%
Location 35.3%
2 The aforementioned four independent variables were used to develop a method to 3
estimate the range of construction costs per square foot for an ABC project. Due to the different 4 nature of the influencing factors, there variables were treated differently, in order to accurately 5
reflect their impacts on the predicted construction cost. For example, due to the wide range of the 6
AADT values in the collected data, the AADT values were divided into eight different intervals 7 with each given a categorical value as shown in Table 2. In addition, the bridge type was 8 categorized using two input values: “0” for concrete bridges and “1” for steel bridges. Similarly a 9
value of “0” was used for bridges in rural areas and “1” for urban areas. 10 11 Table 2 The AADT Independent Variable Representation 12
Categorical Value 0 to 1000 0
1001 to 5000 1 5001 to 10000 2
10001 to 20000 3 20001 to 50000 4 50001 to 100000 5 100001 to 200000 6 More than 200001 7
13 Due to the high variations in the collected data, it was decided to use the construction 14
cost estimate as a range rather than a specific value in the model, as shown in Table 3. The cost 15 range for each AADT category, location type, number of spans, and bridge type was then 16
computed based on historical data. 17 18 Table 3 Cost Ranges Used in the Analysis 19
Category 1 2 3 4 5 6 7 8 9 10
Range
($/ft2)
0-
100
101-
200
201-
300
301-
400
401-
500
501-
600
601-
700
701-
800
801-
900
901-
1000
20
It is noteworthy that the predicted cost represents a national average due to the 21 aforementioned cost data normalization and it is therefore important to adjust it to the specific 22 location of the bridge under study. The RSMeans cost indices mentioned above can be used for 23 this purpose. To allow for comparing the predicted cost with the conventional construction 24 methods, the average conventional bridge construction rates published by different state 25 department of transportation (DOTs) were summarized and used. 26
Jia et al. 9
Agency and Indirect Costs 1
In addition to the construction costs, addressed in the former section, it is also important to 2 analyze the agency and indirect costs associated with bridge projects. These costs include, for 3
example, preliminary engineering, right of way, construction engineering, and inspection costs. 4 An analysis of ten projects from Oregon Department of Transportation (ODOT) was used to 5 identify any statistically significant difference in these costs between ABC and conventional 6 bridge construction methods. Due to limited data availability, statistical data analysis was 7 performed only for preliminary engineering and cost engineering costs both of which did not 8
show any statistically significant difference between ABC and conventional methods. Further 9 data is still sought from other state DOTs in order to increase the sample size and therefore the 10 accuracy of the analysis. Until further analysis is performed, agency and indirect costs are 11 excluded from further comparison in this paper. It is worth mentioning, however, that the 12
examined data seems to indicate that the agency and indirect cost can be approximately 13 calculated as 20% of the construction cost for both conventional and accelerated bridge 14 construction. 15
16
Road User Costs 17
As mentioned earlier, the FHWA report “Work Zone Road User Costs: Concepts and 18 Applications” (7) provides a framework to estimate road user costs for work zones. However, the 19
report does not address specifically the tools and methods to perform the actual assessments of 20 these parameters. In this study; mobility, reliability, safety and emission impacts; in line with the 21 FHWA report and SHRP 2 reliability program recommendations, are considered and assessed to 22
estimate road user costs. Multiple tools and methods are utilized to assess these parameters. All 23 utilized tools and post processing of the tools were integrated in a single environment to allow 24
easy access and use of the tools. Below is a brief review the estimated parameters and the 25 utilized tools in the estimation. 26
27 The first component of user cost is the total travel time delay due to construction, 28
estimated as follows: 29
30
(1) 31 32 where, VOT is value of time, TotalDelay represents the total delay during construction, and 33 delay occupancy is region-specific parameter that can vary by time of day and trip purpose 34
(occupancy of 1.4 persons per vehicle is used in this study). The QuickZone tool developed by 35 the FHWA was used in this study estimate the total delay. QuickZone, is a sketch-planning tool 36
that allows analyzing work zone mobility impacts; producing estimates of traffic delays, queues, 37 and associated delay dollar values. The VOT used in this study is 16.64 $/person-hour based on 38 the FHWA report (7). 39
Another important component for road user cost is reliability. Reliability is defined as “a 40 measure of how consistent or predictable travel times are over time” by the L05 project of the 41
Second Strategic Highway Research Program (SHRP 2) (13). Regression equations to estimate 42 reliability, originally developed in the SHRP 2 L03 project (14) and later implemented in a 43 spreadsheet tool developed in the SHRP 2 L07 project (15), were used to estimate reliability in 44

Jia et al. 10
this study, considering the lane hour lost due to construction. The utilized measures of reliability 1 that can be calculated using the models are the nth percentile travel time indexes (TTIs), where 2 nth could be the 10th, 50th, 80th, 95th, and mean travel time index (TTI). The TTI estimation 3 models have the following general functional form, 4
5
(2) 6 7 where, 8 nth
percentile TTI, 9 lane hour lost, 10 critical demand-capacity ratio, 11 hours of rainfall exceeding 0.05 inch, and 12 coefficients for nth percentile TTI 13
14 To convert the reliability to dollar value, it is necessary to estimate the value of reliability 15
(VOR). The L04 project of the SHRP 2 program (16) addressed the VOR, and indicated that it is 16 a function of the travel purpose, household income, car occupancy and travel distance. In this 17
study, the buffer time, representing the extra time budgeted for travel, is selected as the reliability 18 measure to estimate reliability costs based on its use in the SHRP 2 L04 project, as follows. 19
20
(3) 21
(4) 22
The VOR value used in this project is 22.5$/hr, according to SHRP 2 L04 project (16). 23
Work zone safety is also an important component, when estimating user costs. According 24 to a research from Indiana (7), the crash modification factor (CMF) due to work zone ranges 25 from 1.3 to 1.6. This indicates a 30% to 60% increase in crash rates due to work zones. This 26
factor can be used to estimate the motorist safety benefits from reducing the construction 27 durations due to ABC. The reduction in crashes calculated in this way will have to be converted 28
to dollar values based on the estimated crash cost. In this study, the crash cost is estimated as 29 follows: 30
31
(5) 32
Where, VMT is vehicle-miles traveled and UnitCost is the estimated cost for one crash, which 33 can vary by region and location depending on the severity of the crashes. The CMF used in this 34
study is 1.3. 35 Work zone also can increase the pollutant emission from vehicles due to the increase in 36
stops and decrease in speed. The average speed approach of the MOtor Vehicle Emission 37 Simulator (MOVES), developed by the United States Environmental Protection Agency (EPA) 38
was used in this study to estimate emission (17). The average speed approach is the simplest of 39 the project level analysis in MOVES and is based on the average speed of the vehicles and the 40 vehicle miles traveled by vehicle type. The emission cost was then estimated using the following 41 equation, 42
43
(6) 44

Jia et al. 11
Where, the utilized unit costs of emission were obtained from the FHWA report mentioned 1 earlier (7). Three types of pollutants are considered in this study, including Carbon Oxide (CO), 2 Nitrogen Oxide (NOx), and Hydrocarbons (HC). 3
The user should conduct sensitivity analyses on the dollar values and possibly other input 4
parameters to the user cost calculations to determine how the total cost analysis will be impacted 5 considering the uncertainty in these values and possibly the weights that the agency put on these 6 costs compared to the construction costs. 7
8
CASE STUDY 9
A case study was used to illustrate the use of the framework developed in this study for the 10 estimation of the total costs of bridge construction using ABC and conventional methods. The 11 bridge is located at the interchange of I-4 and Graves Avenue in Orlando, FL. The project was 12
conducted on a section of I-4 that has an AADT of 67,000 vehicle per day (see Figure 5). During 13 construction, an existing two-lane four-span concrete beam bridge was widened to 33 ft with two 14 traffic lanes, a shoulder and a sidewalk on each side. The basic information for this project is 15
shown in Table 4. 16
17
Figure 5 Location of Study Bridge Construction Project 18

Jia et al. 12
Table 4 Basic Information for I-4/Graves Bridge 1
Segment No of Lanes Length (miles) Free flow speed (mph)
I-4-work zone 3 lanes 3.1 60
Detour 2 lanes 4.3 30
2 The construction period and lane closure schedules are different between the ABC and the 3 conventional construction methods. These results in the construction cost, user cost, and thus the 4 total cost to be different between the two construction approaches and have to be estimated and 5
compared. Below are the estimated construction durations for the different alternatives. 6 7
ABC method. ABC method requires I-4 to close one outside lane from 21:00 to 24:00 for 8
only four nights. This schedule was obtained based on project documents. 9
Conventional method I. Conventional method I requires I-4 to close two outside lanes from 10
21:00 to 24:00 for 48 nights. This schedule is a hypothetical schedule identified in this study, 11
as a potential variation for Conventional Method II identified in project documents. The 12
main purpose of including this additional method, although not specified as an option in the 13
project document, is to further the comparison that can made using the identified framework. 14
Due to the site overhead costs caused by the longer period of Conventional Method I 15
compared to Conventional Method II, the construction cost of method 1 is estimated to be 15% 16
higher than conventional method II. 17
Conventional method II. Conventional method I requires I-4 to close all the lanes from 18
21:00 to 24:00 for 32 nights. This is a schedule obtained from the project documentation that 19
shows the schedule of the construction estimated by the agency for the conventional bridge 20
construction. 21
Work zone capacity has a large influence on the estimation of mobility and reliability impacts 22
and thus the road user costs. Since there is uncertainty in the open lane capacity during 23 construction, sensitivity analysis was done to determine the impact of this parameter value on the 24 analysis results. In this study, three values of work zone capacity were utilized and the results of 25
the analysis were compared to determine the impacts on the analysis results: an estimate from a 26 previous analysis of real-world data by this study’s researchers (capacity equal to 1000 27 veh/hr/lane), HCM 2010 methodology (1136 veh/hr/lane), and a method presented in the 28 NCHRP project 03-107 report (18) (capacity equal to 1264 veh/hr/lane). 29
Another important issue is route diversion due to construction zones. During the lane 30
closure period, drivers may choose to divert to alternative routes. Unfortunately, currently there 31
is not simple method to estimate the diversion, although a more complex analysis using 32 simulation-based dynamic traffic assignment may be useful in estimating this diversion, as was 33 done in the SHRP 2 R11 project (11). In this study, 0% diversion rate was assumed one lane 34 closure, 5% diversion rate with two lane closure, and 100% diversion to the alternative route 35 with full lane closure. The researcher will be working on methodologies to better identify these 36
diversion rates in future efforts. 37 Using the models and procedures described in the methodology section, the results of the 38
total costs analysis using the ABC and conventional methods are shown in Table 5. For mobility 39
costs, Conventional Method II has the highest value since all the vehicles had to use an 40

Jia et al. 13
alternative route with the full closure required by this method. Travel time reliability estimation 1 using the SHRP 2 L3 and L07 project procedures were found to be highly sensitive to the 2 capacity value. For safety costs, the safety impacts appear to be low due to the low demands at 3 night. The emission impacts in dollar values appear to be also low for this case study with the 4
ABC method had the lowest pollutant emission. The construction costs estimated based on the 5 historical costs data, as described in the methodology section, for the conventional method and 6 ABC method were 119 $/sq-ft and 172$/sq-ft, respectively. These were the values used in the 7 analysis. 8 9
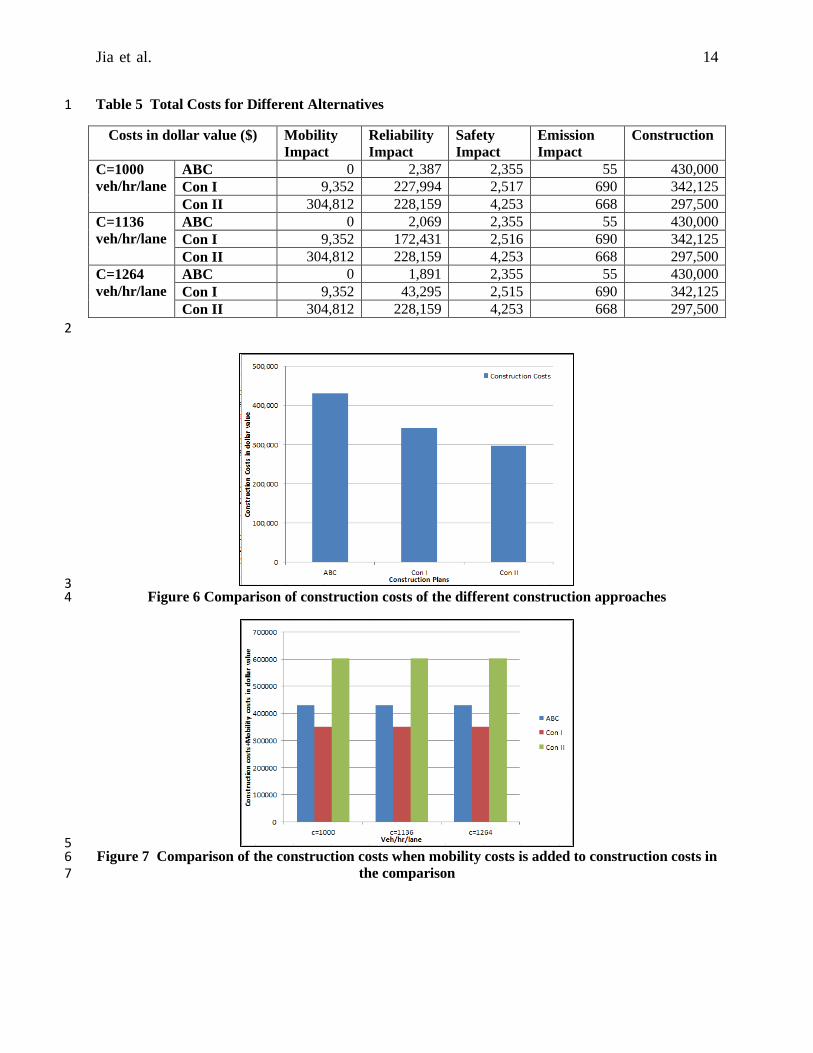
RESULTS 10 11 The results from applying the framework to the case study are shown in Table 5 and Figures 6 to 12
7. As shown in Figure 6, the construction cost of the ABC is higher than the conventional 13 methods. This could be also in part due to the less experience with ABC compared to 14 conventional methods and the ABC cost may decrease with increasing experience in ABC. The 15
Conventional Method I has a 15% higher construction cost compared to Conventional Method II 16 due to the longer construction times. If the comparison was done based on the construction cost 17
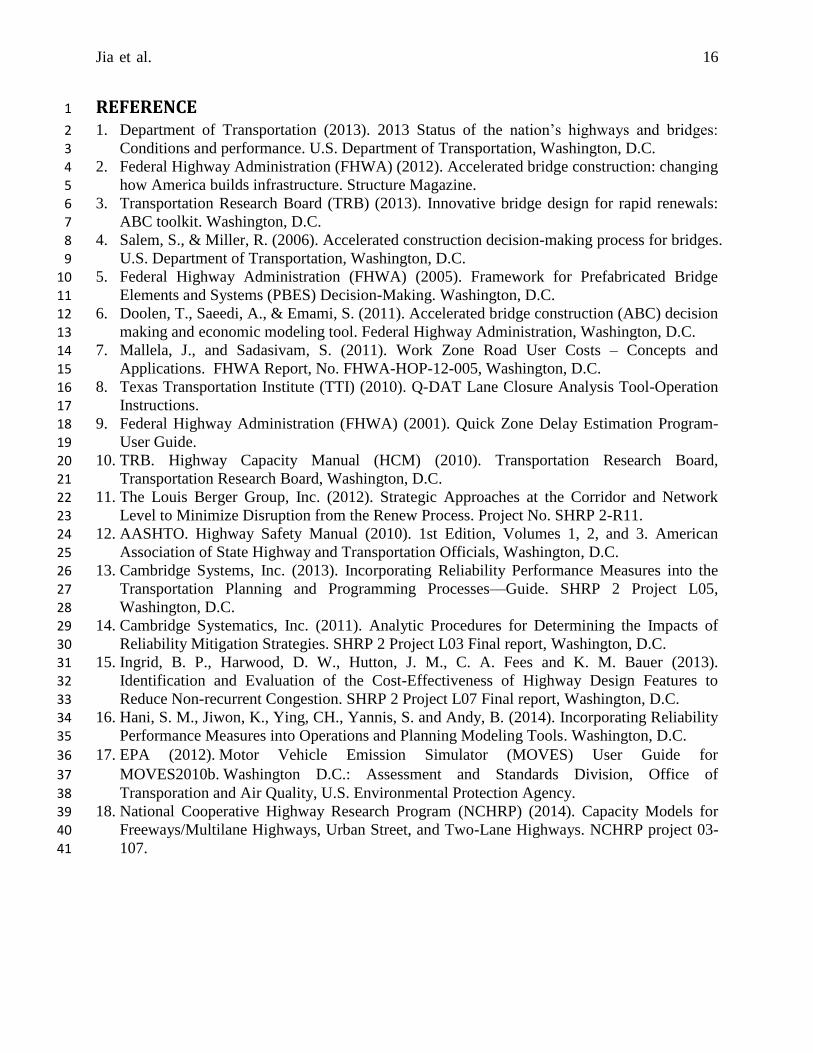
alone, the agencies will select the Conventional Method II. 18 If the mobility (travel time delays due to construction) is added to the comparison, as is 19
sometimes done when comparing construction and construction management alternatives, Figure 20
7 shows that Conventional Method II became the alternative with the highest cost. However, the 21 cost of Conventional Method I was still lower than the ABC cost, as shown in Figure 7. When all 22
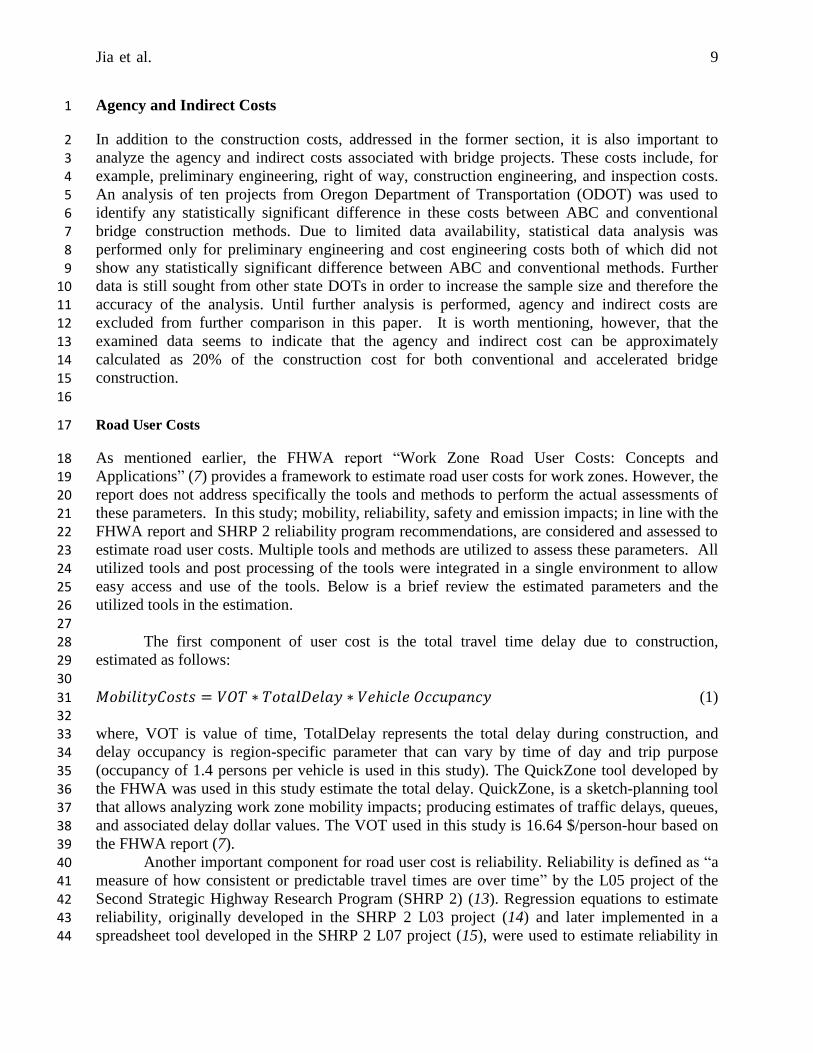
components of the user costs were added to the analysis, the ABC became the best alternative, 23 except with the optimistic lane capacity of the work zone (capacity of 1264 veh/hr/lane). This 24
illustrates the benefit of using the total costs in the comparison between ABC and conventional 25 methods. If additional user costs, such as the impacts on businesses and toll revenue losses, if 26
any, could be added, then the user cost could even higher. In this project, I-4 was not a tolled 27 highway and there was no impact on businesses that could be quantified. 28
Jia et al. 14
Table 5 Total Costs for Different Alternatives 1
Costs in dollar value ($) Mobility
Impact
Reliability
Impact
Safety
Impact
Emission
Impact
Construction
C=1000
veh/hr/lane
ABC 0 2,387 2,355 55 430,000
Con I 9,352 227,994 2,517 690 342,125
Con II 304,812 228,159 4,253 668 297,500
C=1136
veh/hr/lane
ABC 0 2,069 2,355 55 430,000
Con I 9,352 172,431 2,516 690 342,125
Con II 304,812 228,159 4,253 668 297,500
C=1264
veh/hr/lane
ABC 0 1,891 2,355 55 430,000
Con I 9,352 43,295 2,515 690 342,125
Con II 304,812 228,159 4,253 668 297,500
2
3 Figure 6 Comparison of construction costs of the different construction approaches 4
5 Figure 7 Comparison of the construction costs when mobility costs is added to construction costs in 6
the comparison 7

Jia et al. 15
1 Figure 8 Comparison of the total costs of different alternatives with the consideration of the 2
construction and user costs 3
CONCLUSIONS 4
In this study, a framework for the comparison of ABC and conventional construction methods 5 was developed and implemented to a case study. The total cost incorporates both construction 6 costs and road user costs associated with construction methods, and can be used as a standalone 7
or in combination with other quantitative and qualitative criteria as part of the decision making 8 process of ABC versus conventional bridge selection decisions. The construction costs of ABC 9
was estimated based on a historical database of ABC costs and point towards higher cost of ABC 10 compared to other methods. The main influencing factors on the cost were found to be the 11 AADT, number of spans, location (urban versus rural), and ABC type. Limited data is available 12
about the agency and indirect costs associated with ABC projects. An initial analysis in this 13
study did not identify any statistically significant difference in these costs between ABC and 14 conventional bridge construction methods. The examined data seems to indicate that the agency 15 and indirect cost can be approximately calculated as 20% of the construction cost for both 16
conventional and accelerated bridge construction. 17 This study incorporates the dollar values of mobility, travel time reliability, safety, and 18
emission in calculating user costs. The estimation of the construction impacts on user costs was 19 done using a number of tools and methods that were integrated with the estimation of the 20 construction cost in a single environment by the research team. 21
The application of this study framework to a case study demonstrated the benefits of 22 using the total cost that incorporates both the construction cost and user cost in the decision 23
making process. The case study demonstrated that the ABC can have a higher construction cost 24
than conventional methods but its total cost can be lower, if all the elements of user costs are 25
added. Additional case studies, for more congested conditions during lane closures, will 26 demonstrate even higher benefits of ABC, since the lane closures in the case study were 27 conducted at late night. 28
Future analysis will be done in a future study of the indirect costs and agency costs 29 associated with ABC relative to conventional construction methods. In addition, additional 30
analysis of the expected diversion due to construction will be performed, which is an important 31 component of the user cost estimation. Finally, the total cost framework developed in this paper 32 will be incorporated as part of a more comprehensive decision support tool that includes the 33
assessment of other quantitative and qualitative decision criteria. 34
Jia et al. 16
REFERENCE 1
1. Department of Transportation (2013). 2013 Status of the nation’s highways and bridges: 2
Conditions and performance. U.S. Department of Transportation, Washington, D.C. 3 2. Federal Highway Administration (FHWA) (2012). Accelerated bridge construction: changing 4
how America builds infrastructure. Structure Magazine. 5 3. Transportation Research Board (TRB) (2013). Innovative bridge design for rapid renewals: 6
ABC toolkit. Washington, D.C. 7
4. Salem, S., & Miller, R. (2006). Accelerated construction decision-making process for bridges. 8 U.S. Department of Transportation, Washington, D.C. 9
5. Federal Highway Administration (FHWA) (2005). Framework for Prefabricated Bridge 10 Elements and Systems (PBES) Decision-Making. Washington, D.C. 11
6. Doolen, T., Saeedi, A., & Emami, S. (2011). Accelerated bridge construction (ABC) decision 12
making and economic modeling tool. Federal Highway Administration, Washington, D.C. 13 7. Mallela, J., and Sadasivam, S. (2011). Work Zone Road User Costs – Concepts and 14
Applications. FHWA Report, No. FHWA-HOP-12-005, Washington, D.C. 15
8. Texas Transportation Institute (TTI) (2010). Q-DAT Lane Closure Analysis Tool-Operation 16 Instructions. 17
9. Federal Highway Administration (FHWA) (2001). Quick Zone Delay Estimation Program-18
User Guide. 19 10. TRB. Highway Capacity Manual (HCM) (2010). Transportation Research Board, 20
Transportation Research Board, Washington, D.C. 21 11. The Louis Berger Group, Inc. (2012). Strategic Approaches at the Corridor and Network 22
Level to Minimize Disruption from the Renew Process. Project No. SHRP 2-R11. 23
12. AASHTO. Highway Safety Manual (2010). 1st Edition, Volumes 1, 2, and 3. American 24
Association of State Highway and Transportation Officials, Washington, D.C. 25
13. Cambridge Systems, Inc. (2013). Incorporating Reliability Performance Measures into the 26 Transportation Planning and Programming Processes––Guide. SHRP 2 Project L05, 27
Washington, D.C. 28 14. Cambridge Systematics, Inc. (2011). Analytic Procedures for Determining the Impacts of 29
Reliability Mitigation Strategies. SHRP 2 Project L03 Final report, Washington, D.C. 30
15. Ingrid, B. P., Harwood, D. W., Hutton, J. M., C. A. Fees and K. M. Bauer (2013). 31 Identification and Evaluation of the Cost-Effectiveness of Highway Design Features to 32
Reduce Non-recurrent Congestion. SHRP 2 Project L07 Final report, Washington, D.C. 33 16. Hani, S. M., Jiwon, K., Ying, CH., Yannis, S. and Andy, B. (2014). Incorporating Reliability 34
Performance Measures into Operations and Planning Modeling Tools. Washington, D.C. 35
17. EPA (2012). Motor Vehicle Emission Simulator (MOVES) User Guide for 36
MOVES2010b. Washington D.C.: Assessment and Standards Division, Office of 37
Transporation and Air Quality, U.S. Environmental Protection Agency. 38
18. National Cooperative Highway Research Program (NCHRP) (2014). Capacity Models for 39 Freeways/Multilane Highways, Urban Street, and Two-Lane Highways. NCHRP project 03-40
107. 41